\cbConcerning the formation of chains of particles in the Kob-Andersen (4:1) and Wahnström (1:1) model liquids on coolind and supercooling
Abstract
Investigations of structural changes happening with liquids on cooling and supercooling continue to attract significant attention as there is still no sufficient understanding of the connection between the structural changes and the dynamic slowdown. Previously, liquids’ structures were usually discussed from the local perspective. Thus, the environments of individual particles were classified and it was assumed that the changes in populations of these local or medium-range environments should be related to the changes in liquids’ properties. Here, we report on the structural evolutions of the binary Kob-Andersen (KA) (4:1) and Wahnström (1:1) model liquids using a different approach. The approach is based on the previously not discussed observation that in the liquid and supercooled liquid states some particles form nearly linear chains in the temperature region where the crystallization process has not been observed. Depending on the chain definition, it is possible to speak about the chains containing more than 8 particles. The average number of chains monotonically increases as the temperature of the liquid decreases. We also found that the number of chains remains nearly constant in the inherent structures (IS) obtained from the parent structures (PS) above the potential energy landscape (PEL) crossover temperature (PELCT). Then, below the PELCT, the average number of chains in the IS increases, as the temperature of the PS decreases. Counter-intuitively, for the KA system, we found that below the PELCT the number of chains in the PS can be larger than the number of chains in the corresponding IS. This, in our view, indicates that in the supercooled liquid there is some delicate beyond medium-range range order that is being destroyed by the relaxation procedure from the PS to IS. Calculations of the distributions of the potential energies (PE) of the particles in linear chains show that the particles forming the chains tend to have higher PE than the particles which are not in the linear chains. We also found that the particles forming the chains diffuse at a slightly lower rate than the particles that do not belong to the chains. Finally, we address the lifetimes of the observed chains, which happen to be smaller than the -relaxation time of the system. In our discussions, we compare the results for the chains with the results obtained within the topological cluster classification approach.
Introduction
Search for a hidden ordering of particles in supercooled liquids (SCL), that may lead to understanding of the dynamic slow down at the glass transition, continues for decades [royall2015role, tanaka2019revealing, lehmkuhler2020slowing, boattini2021averaging, tanaka2022roles, russo2016crystal, sanz2014avalanches, jungblut2016pathways, hu2018configuration, ingebrigtsen2019crystallization, marin2020tetrahedrality, levashov2022investigation, levashov2020structure, royall2020dynamicalaspects]. Earlier studies were usually focused on considerations of local atomic environments of individual particles often limited by the nearest neighbor shells [royall2015role, tanaka2019revealing, bernal1959geometrical, steinhardt1983bond, egami1982local, malins2013lifetimes]. In more recent studies, it has been demonstrated that an order associated with the second and more distant neighbors (a medium-range order) is also important for understanding the liquids’ dynamics and, in particular, the relevant relaxation timescales [malins2013lifetimes, wu2015hidden, sheng2006atomic, pan2011origin, bouchaud2004adam, berthier2012static, ryu2021medium, levashov2020structure, ryu2021medium, tah2022kinetic, levashov2017contribution, fan2020unveiling, zhang2020revealing, yuan2021connecting, boattini2020autonomously, boattini2021averaging, banerjee2021attractive].
Numerical simulations (NS) represent an invaluable tool in the structural studies of liquids [royall2015role, tanaka2019revealing, lehmkuhler2020slowing, boattini2021averaging, tanaka2022roles, russo2016crystal, sanz2014avalanches, jungblut2016pathways, ingebrigtsen2019crystallization, marin2020tetrahedrality, levashov2022investigation, levashov2020structure, steinhardt1983bond, egami1982local, malins2013lifetimes, wu2015hidden, sheng2006atomic, pan2011origin, berthier2012static, ryu2021medium, tah2022kinetic, levashov2017contribution, fan2020unveiling, zhang2020revealing, yuan2021connecting, boattini2020autonomously, banerjee2021attractive, 1995KobAndersen01, 1995KobAndersen02, 1998SastryPEL, 2002KApressureBagchi, malins2013lifetimes, coslovich2011locally]. There are several model systems which are actively used in NS of SCL. One of these is the Kob-Andersen (KA) binary system (KAS) consisting of of larger -particles and of smaller -particles [1995KobAndersen01, 1995KobAndersen02]. This model has been very extensively studied in a number of different contexts (see, for example, Ref. [1995KobAndersen01, 1995KobAndersen02, kob1997dynamical, donati1998stringlike, 1998SastryPEL, 2002KApressureBagchi, biroli2008thermodynamic, berthier2009nonperturbative, malins2013lifetimes, malins2013identification, coslovich2011locally, coslovich2013static, zhang2020revealing, das2022crossover]). In particular, there were studies of the short and medium range order from the perspective of local environments of selected particles [1995KobAndersen01, 1995KobAndersen02, kob1997dynamical, donati1998stringlike, 1998SastryPEL, 2002KApressureBagchi, biroli2008thermodynamic, berthier2009nonperturbative, malins2013lifetimes, malins2013identification, coslovich2011locally, coslovich2013static, zhang2020revealing, boattini2021averaging]). Another system that has been extensively studied previously is the binary equimolar Wahnström system (WS) [wahnstrom1991molecular, malins2013longlivedclusters].
In this paper, we discuss a particular observation made on the KAS and WS. Thus, for the KAS, we found that on decrease of the temperature larger -particles exhibit an increasing tendency to form approximately linear chains. In the WS the chains are formed by the smaller -particles and also by all particles.
We note that the linear chains that we discuss, generally, are not related to the results concerning the chain-like cooperative motion extensively discussed previously [donati1998stringlike].
In our view, the presented results are of significant interest as they explicitly demonstrate and partially elucidate the presence of an angular ordering on length scales exceeding 7 or 8 distances between the nearest neighbors. It is also possible that the chains of particles that we observe represent the precursors of the crystal nuclei.
We came to the observation of the linear chains in the KA system occasionally. Our initial goal was to perform for the KA system the investigation, which is similar to the one presented in our previous work [levashov2020structure] (despite the fact that a somewhat similar study has been performed before [coslovich2013static]). In the process of reviewing the related literature, in particular Ref.[malins2013lifetimes], we attempted to observe visually the “11A” (Ref.[malins2013lifetimes]) locally favored structure. Thus, we isolated the environments of a few selected -particles up to the second neighbors and visually analyzed them. It became obvious from this analysis that it is possible to speak about the presence of nearly linear chains of large particles in the system. The related structure files in the “xyz” format are provided in the supplemental materials (SM).
The paper is organized as follows. In section The used potential and simulations details, we briefly discuss the details of the simulation procedure and data analysis. More details are provided in the SM. In sections Definition of chains, we define the chains. Then, in section Analysis of the obtained data, we present the results concerning the numbers of chains in the parent liquid and the corresponding inherent structures. In this section, we also discuss the energies and the diffusion rate of the particles forming the chains, and the lifetimes of the chains. We conclude in section Conclusion.
The used potential and simulations details
In our simulations, we used the modified forms [stoddard1973numerical] of the Kob-Anderson potentials [1995KobAndersen01, 1995KobAndersen02]. The unmodified Kob-Andersen potentials are the shifted Lennard-Jones potentials with the parameters of length, , and energy, , chosen in a particular way. The modified potentials go to zero at the cutoff distances with zero derivatives (forces). The same modified potentials have been used, for example, in Ref.[stoddard1973numerical, 1998SastryPEL, 2002KApressureBagchi, malins2013lifetimes]. We provide more details on the used potentials and the simulation procedure in the supplemental materials (SM). Masses of all particles are assumed to be the same, . The chosen units of length, energy and time are: , , .
We performed NVT simulations mostly on the (4:1) Kob-Andersen system of 8000 particles (6400 -particles and 1600 -particles). The average density of the particles was . We also performed some of the simulations on the system containing particles.
We used the LAMMPS molecular dynamics (MD) program [Plimpton1995, thompson2022lammps, lammps].
At every considered temperature we performed (10 for the systems of 8000 particles)/(6 for the system of particles) simulations starting from independent structures. In each of these simulations, we accumulated (100 for the systems of 8000 particles)/(20 for the system of particles) configurations. For , the mean square displacement (MSD), , which corresponded to the time interval between the two consecutively saved structures was larger than 0.1 for the -particles. For this reason, we believe that for all saved structures can be considered as independent. Then, in the temperature interval , the independence of the saved structures, obtained in the same simulation run, is questionable. For it is reasonable to assume that the structures obtained in the same simulation run are not independent. In any case, at all studied temperatures, we analyzed all of the obtained structures, (1000 for the systems of 8000 particles)/(120 for the system of particles), as independent.
The ISs were produced using the FIRE algorithm [bitzek2006structural, guenole2020assessment] within the LAMMPS program Ref.[Plimpton1995, thompson2022lammps, lammps]. More details can be found in the SM.
To address the generality of the results obtained on the KAS, we also studied the Wahnström system (WS) [wahnstrom1991molecular] of particles, as it is described in [malins2013identification]. In these simulations, we used the shifted-force forms of the pair potentials [toxvaerd2011communication]. The simulations for the WS were performed in the NVT ensemble for the system containing 8000 particles. The implemented relaxation procedure was similar to the one used for the KAS. At every studied temperature, we accumulated 100 structures of the parent liquid and produced from these parent structures (PS) 100 inherent structures (IS).
Definition of chains
We say that there is a link or a bond between two large -particles if the distance between them is smaller than the cutoff distance, , corresponding to the position of the 1st minimum in the partial pair density function of particles, i.e., (see the SM).
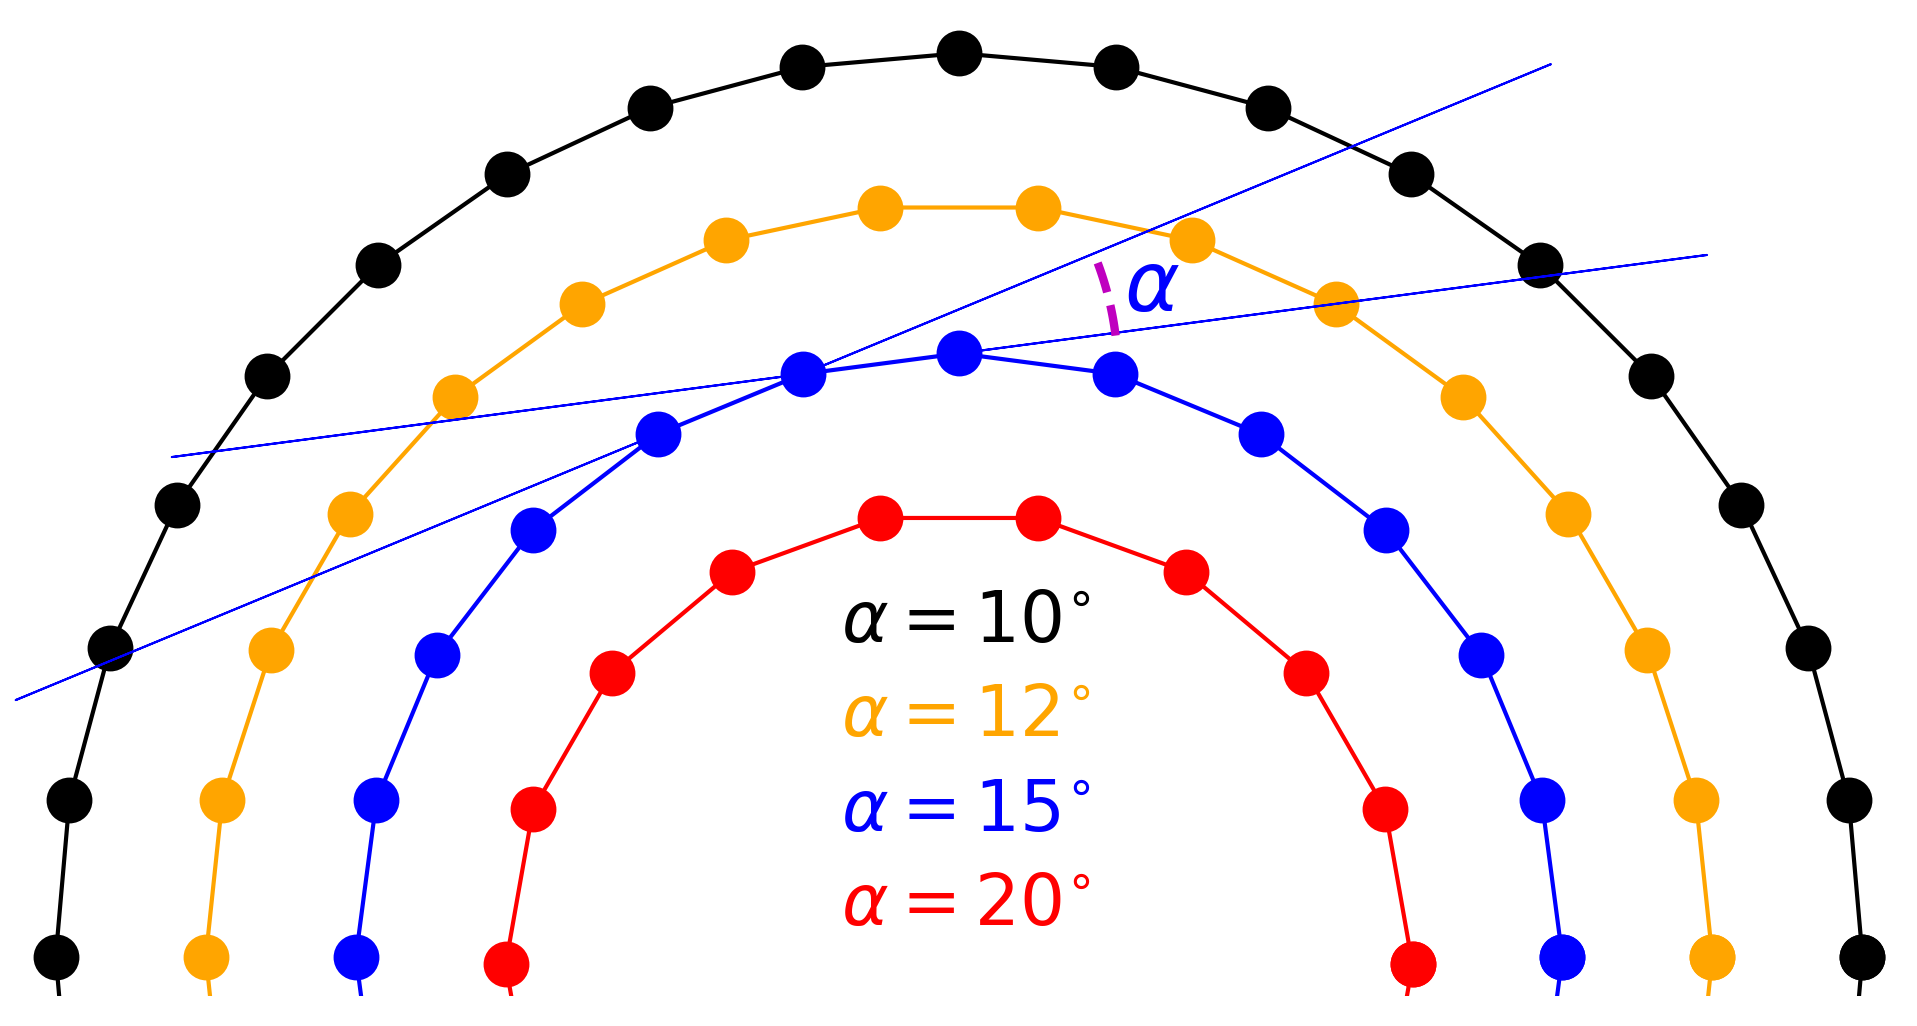
We say that large -particles form a chain if all nearest links in the chain intersect at the angles . See Fig.1,2.
In the SM, we describe the algorithm that has been used to find the chains in the system.
Analysis of the obtained data
Observation of the linear chains
on the parent and inherent structures
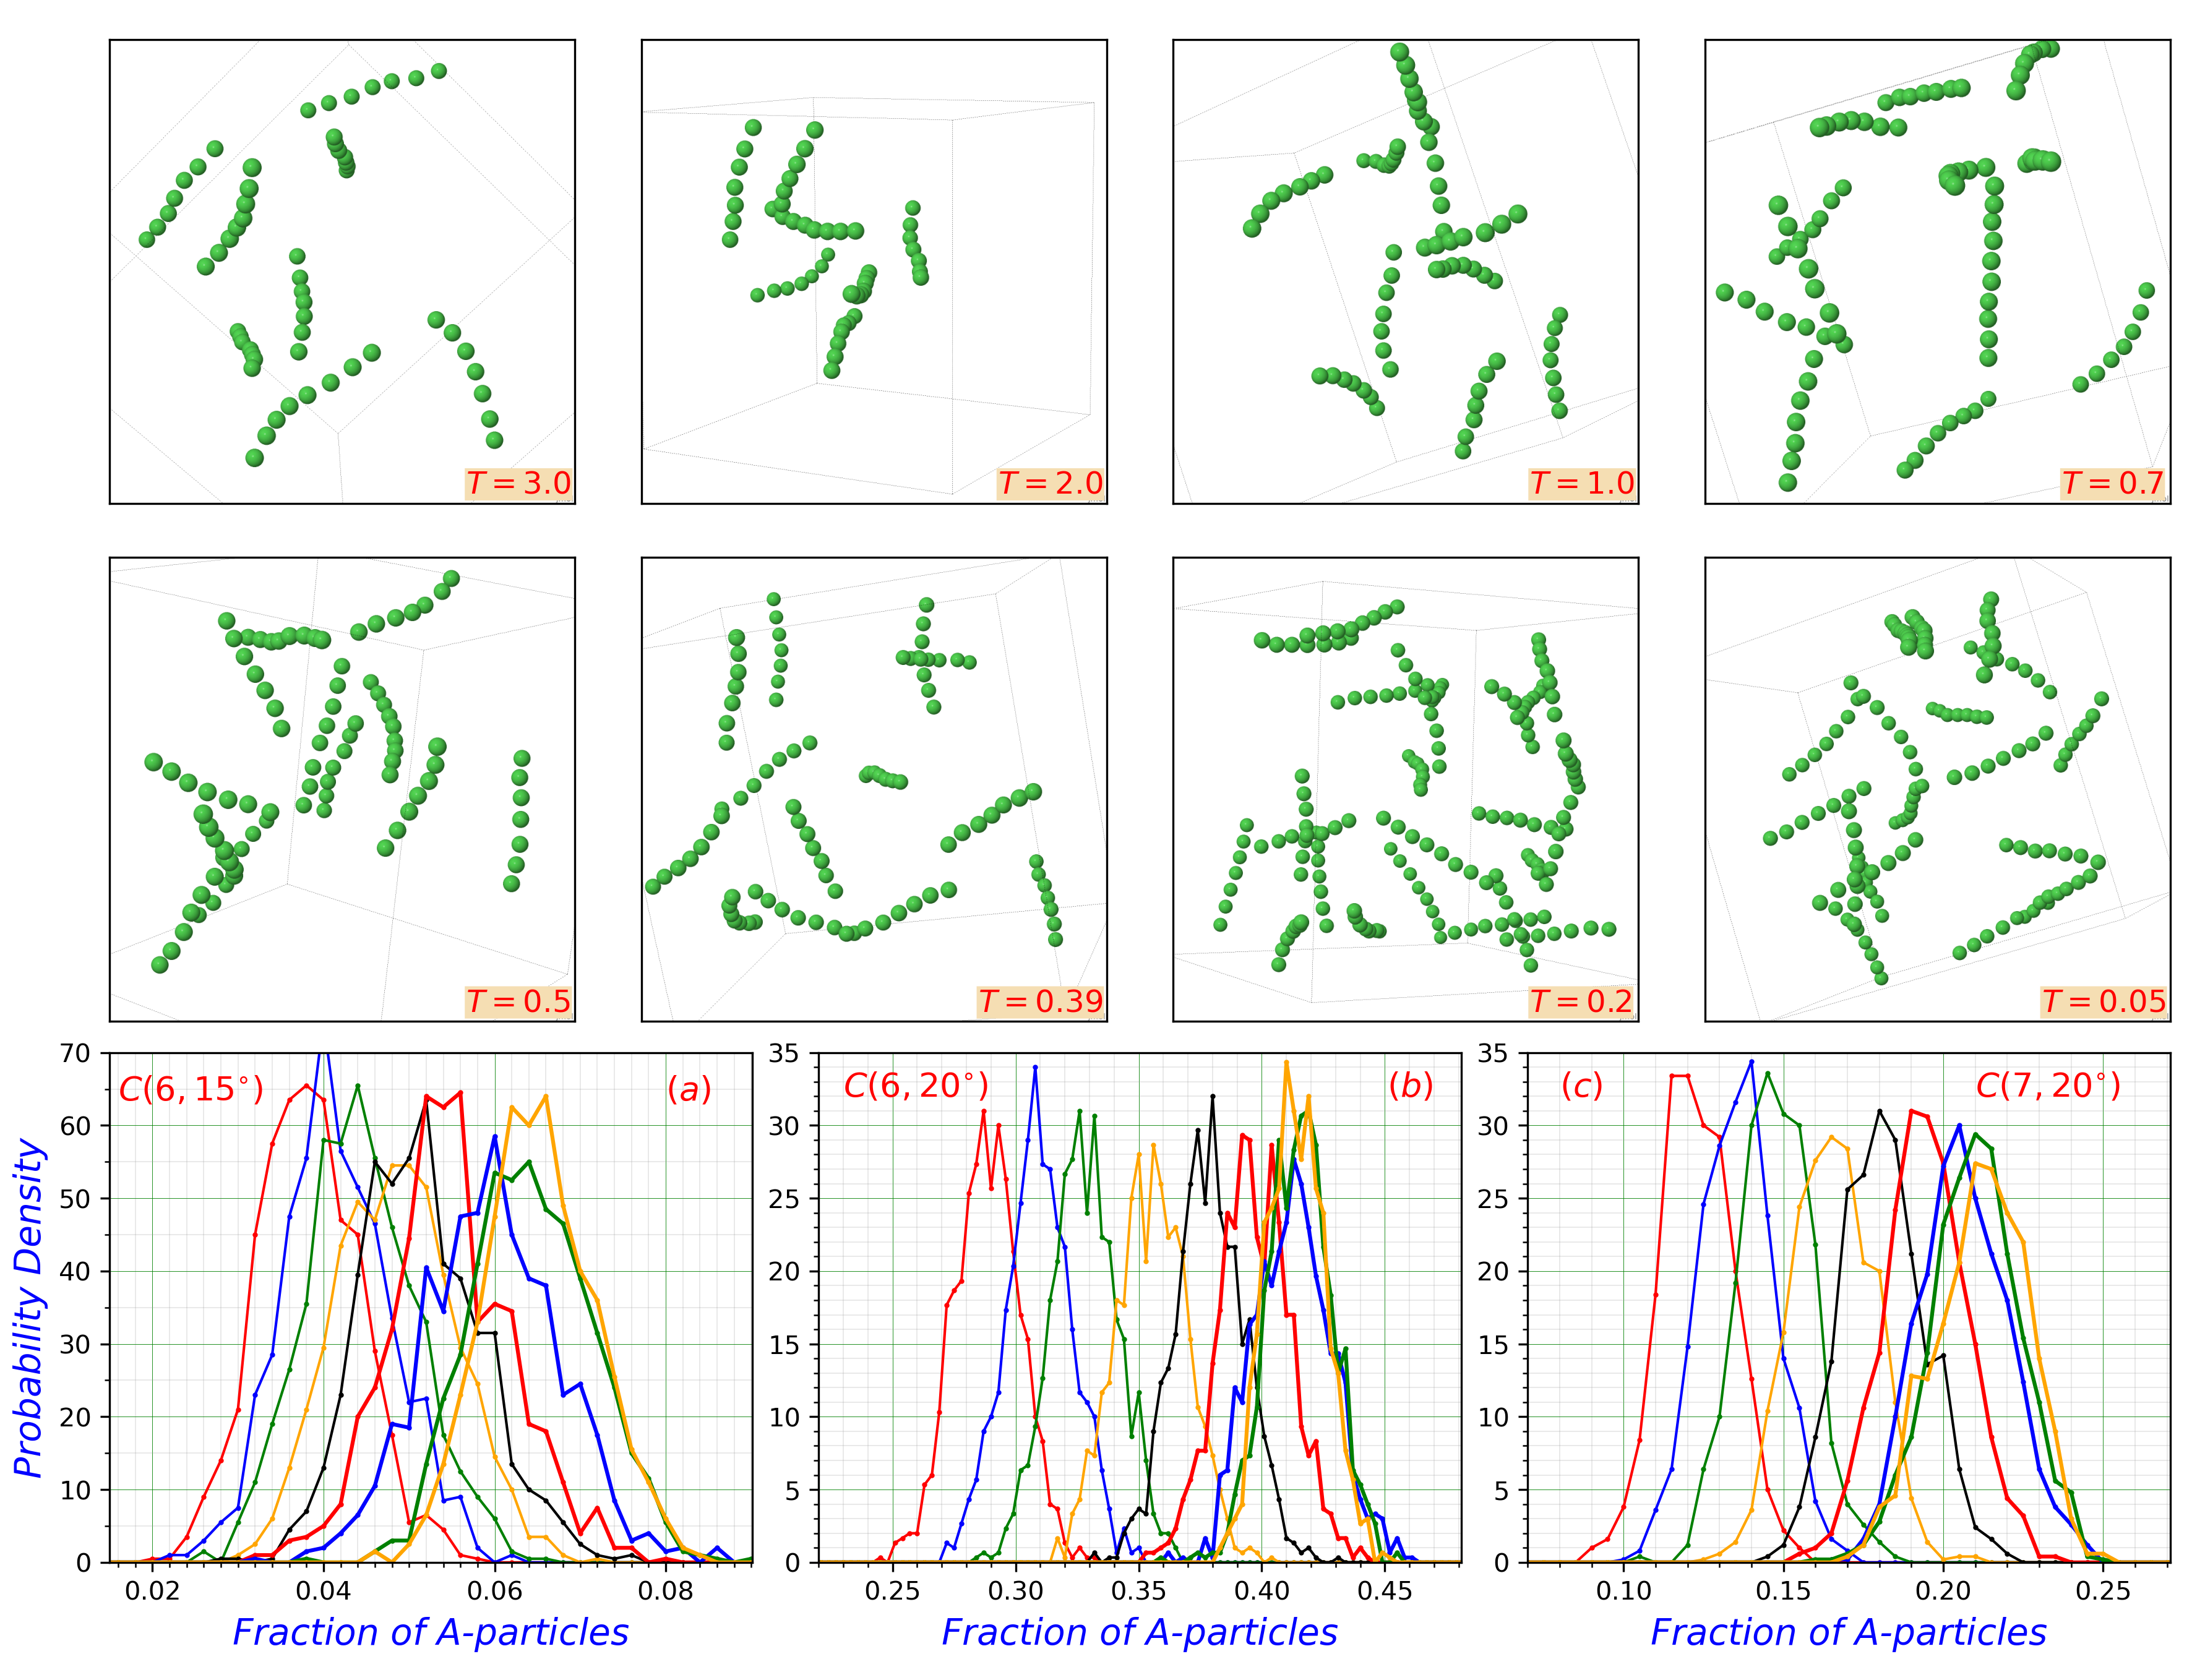
The upper two rows in Fig. 2 show the snapshots of the -particles-chains found in the -particles system at selected temperatures. Only particles forming the chains are shown. It is clear that at lower temperatures there are more chains than at higher temperatures.
We note that it does not follow from the shown data that the chains at lower temperatures agglomerate into some more complex structures. However, more detailed visual examinations of the structures show, especially at temperatures below , that it is eventually possible to see several closely located chains which are approximately parallel to each other. Sometimes it is a longer chain and one or two shorter chains which are neighbors that are approximately parallel to each other. Some of such arrangements can be seen in the structure files provided in the SM. This point is, in our view, of importance from the following perspective. Let us imagine that on cooling in the liquid start to form some precursors of crystal nuclei. Then, it is reasonable to expect that in such crystal-like precursors can be found somewhat aligned chains of the -particles. However, at least at , we do not see often the closely positioned chains that are approximately aligned, i.e., most of the chains appear to be isolated. Thus, it is possible that the observed chains represent the 1D ordering and they are not a part of some more complex ordered structures. This issue requires further investigations, of course.
Panels (a,b,c) in the 3rd row of Fig. 2 show the probability distributions for the numbers of particles involved in all chains of a particular type in instantaneous configurations. As the temperature is reduced, the probability distributions shift to the right, i.e., the numbers of particles participating in the chains statistically increase. The data originate from 1000 instantaneous configurations of 8000 particles produced in 10 independent runs.
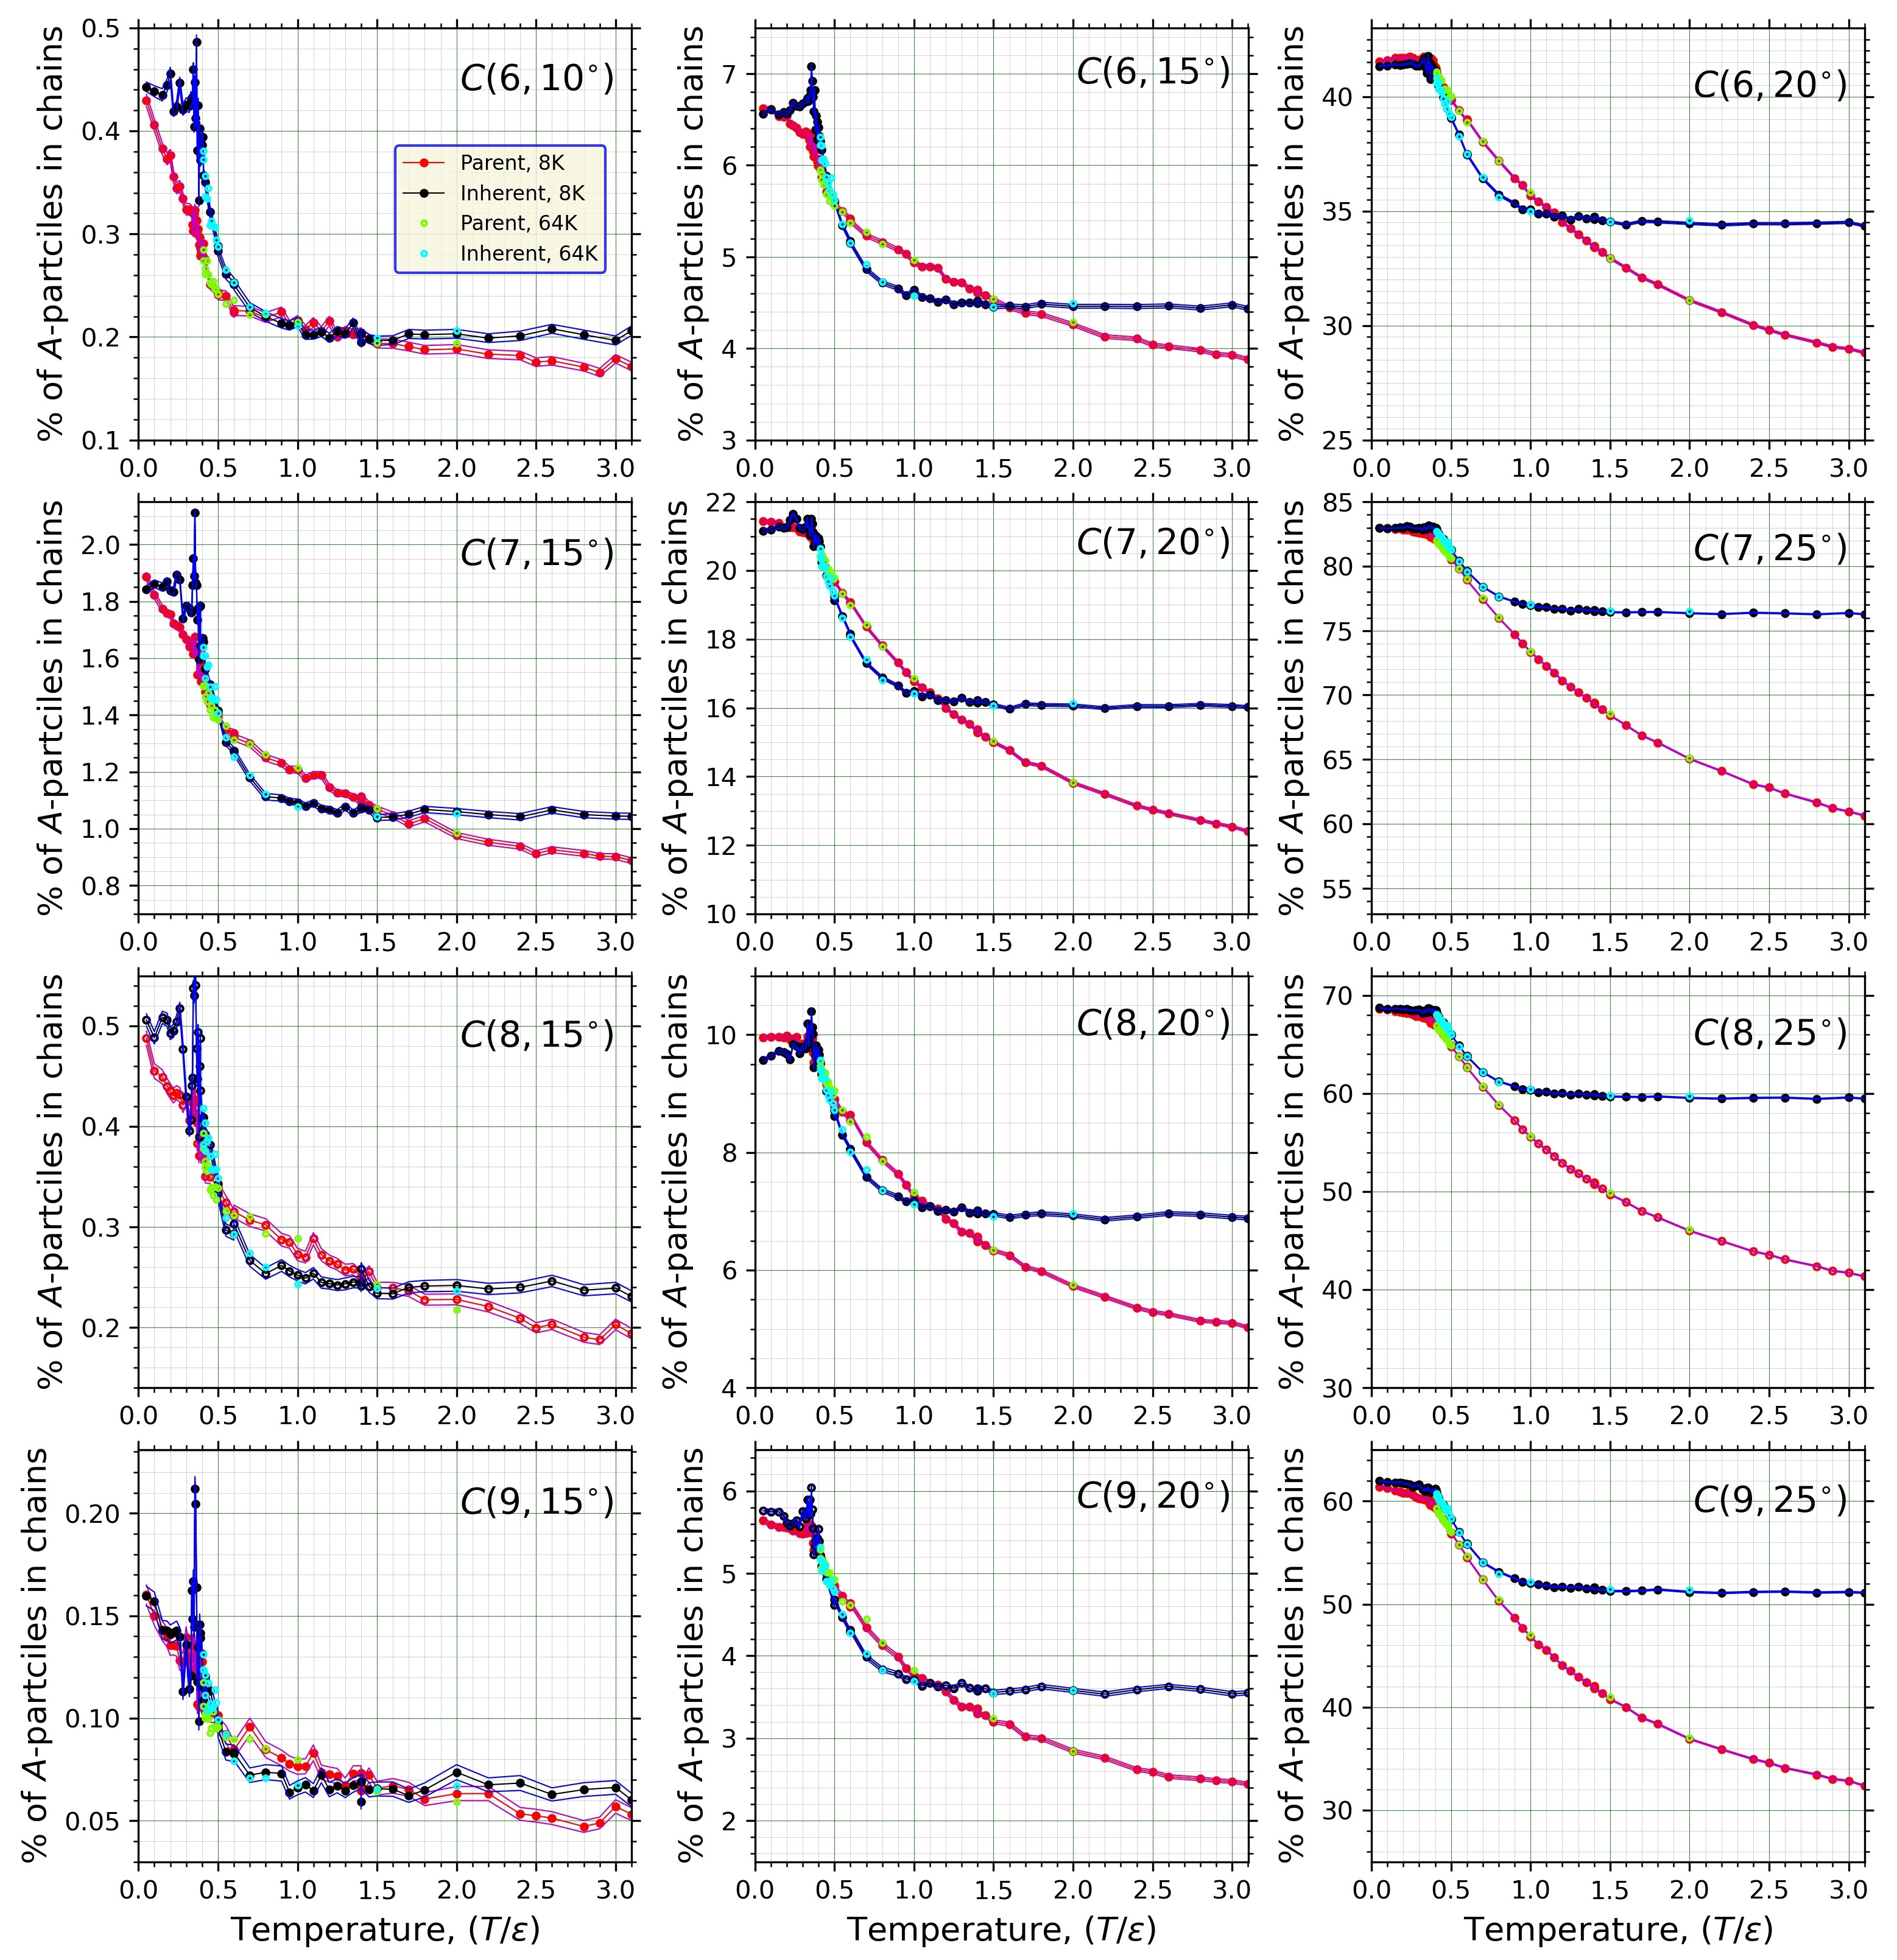
In Fig. 3, the red curves and the red solid circles show how the average numbers of particles in all chains of a particular type depend on the temperature.
In every panel there are three red curves that show the average value and the average value . We see that the average numbers of particles involved in the chains monotonically increase, as the temperature of the liquid decreases. The more abrupt rise in the numbers of chains in the temperature range , in view of [ingebrigtsen2019crystallization], might be related to the proximity of the temperatures at which the crystallization has been observed [ingebrigtsen2019crystallization]. The crystallization manifests itself, in the considered system, by the appearance of the regions containing FCC-crystals of particles.
We do not discuss the process of crystallization here. The points that we make here are the following. First, we note that the observation of the development of the chain-like ordering is a new result. Second, in our view, the observed development of the linear ordering clearly shows that in the considered liquid there are orientational correlations extending beyond, at least, the th nearest neighbors (from one end of the chain to another end). Third, we suggest that the observed linear chains might represent the precursors of the crystal nuclei that may or may not realize.
The blue curves in Fig. 3 correspond to the results obtained on the inherent structures (ISs).
Practically, all shown blue curves exhibit an abrupt crossover at the potential energy landscape (PEL) crossover (PELC) temperature (PELCT). Originally, the PELCT was observed by consideration of the potential energies of the ISs [1998SastryPEL]. As far as we know, there is still no clarity with respect to which structural changes in the liquid the PELC is related. Our results concerning the presence of the linear chains are purely geometrical. Therefore, it is reasonable to think that the formation of chains is closely related to the structural ordering that underlies the PELC. It is possible, of course, that the observed chains represent some parts of more complex structures. On the other hand, as follows from the subsection (Results for the selected clusters obtained with the topological cluster classification (TCC) program), the numbers of several types of clusters are also sensitive to the PELC. Thus, there are many “geometrical objects” whose number is sensitive to the PELC.
Of particular interest is the relation between the red and blue curves corresponding to the chains , , , , , , and . For these chains, in the supercooled liquid range of temperatures, , we observe that the average number of chains in the ISs is smaller than the number of chains in the parent structures (PS). This is a counter-intuitive behavior. Indeed, since the ISs are more relaxed than the PSs, it is natural to expect that there always should be more chains in the ISs. In our view, the obtained results suggest that in the parent supercooled liquid there develops some delicate, beyond medium-range, order that is destroyed by a “rough” relaxation procedure by which the ISs are produced from the PSs. The linear chains either represent this order or represent a part of this order. It is also possible that the decrease in the number of chains in the transition from the parent to inherent structures is related to the fact that the pressure of the inherent structures becomes negative at . The pressure of the inherent structures becomes even more negative as the temperature of the parent structures further decreases. See the SM and, for example, Ref.[sastry2000liquid, altabet2018cavitation, makeev2018distributions] in this context. We note that in Ref.[sastry2000liquid] it has been shown that at , that we study in this paper, the inherent structures (under the negative pressure) remain globally homogeneous.
On the other hand, at temperatures above the PELCT the relaxation procedure increases the number of chains to some nearly constant value. Thus, even a “rough” relaxation can increase the number of chains in the system.
The results from the system of 64000 particles are also shown in Fig. 3 as open-green and open-cyan circles.
Results for the selected clusters obtained with the topological cluster classification (TCC) program
As shown in Fig.3, the temperature dependencies of the average numbers of particles (NoPs) involved in the chains calculated on the IS exhibits a crossover at the PELCT. While this result is of interest, it is necessary to note that this number is not the only structural parameter exhibiting the PELC.
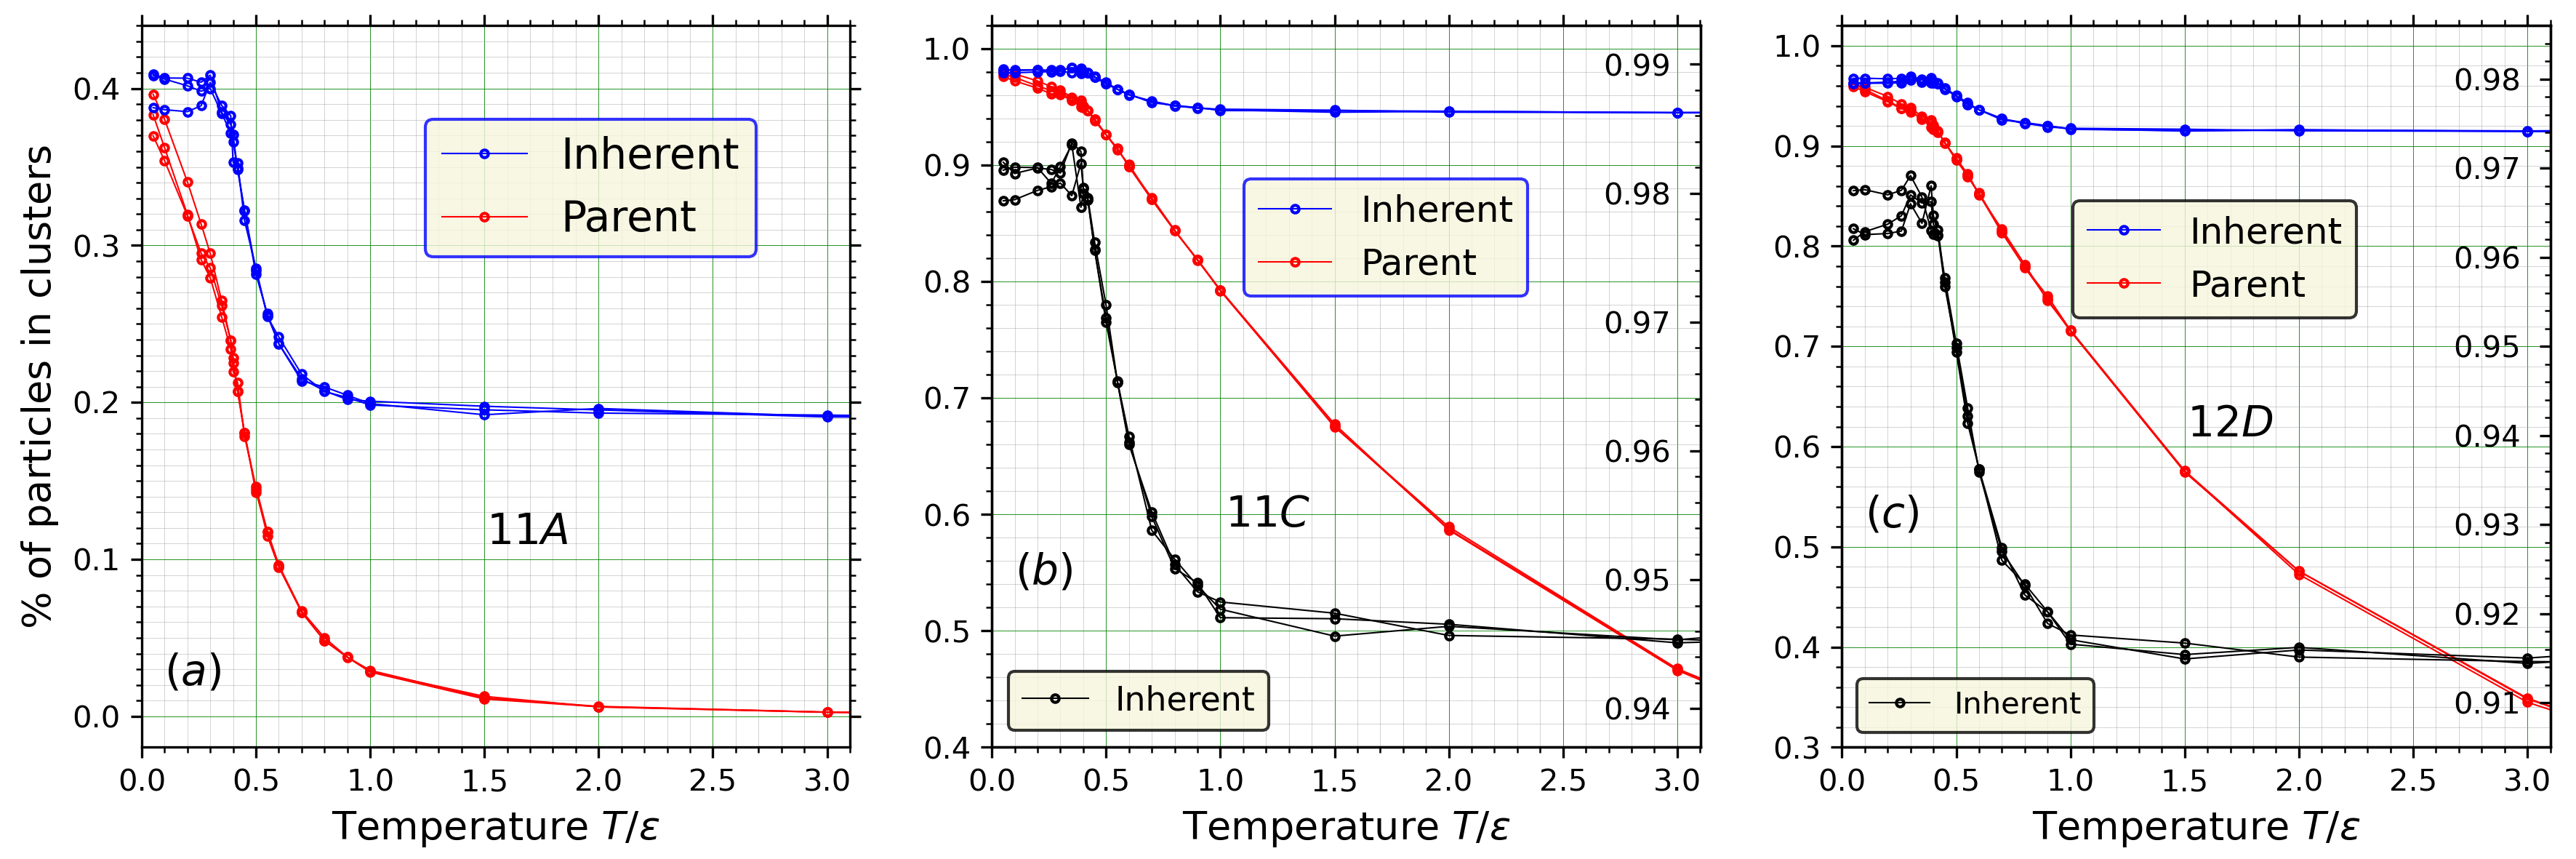
To address this point, we used the topological cluster classification program and studied the temperature dependencies of the NoPs involved in the selected local clusters [malins2013identification, malins2013longlivedclusters, malins2013lifetimes]. These temperature dependencies for the parent and inherent structures are shown in Fig. 4. It follows from the data that the PELC is observable for all studied clusters, while it is significant only for the clusters. The case of clusters is also of special interest because for these clusters the presence of the crossover is quite obvious even from the analysis of the parent structures. This is in agreement with Ref. [malins2013lifetimes] in which it has been suggested that clusters play a special role in the dynamic slowdown.
We also statistically studied the overlap between the particles forming the chains and the particles forming the 11A clusters. We found that the overlap is essentially random.
Concerning the generality of the obtained results
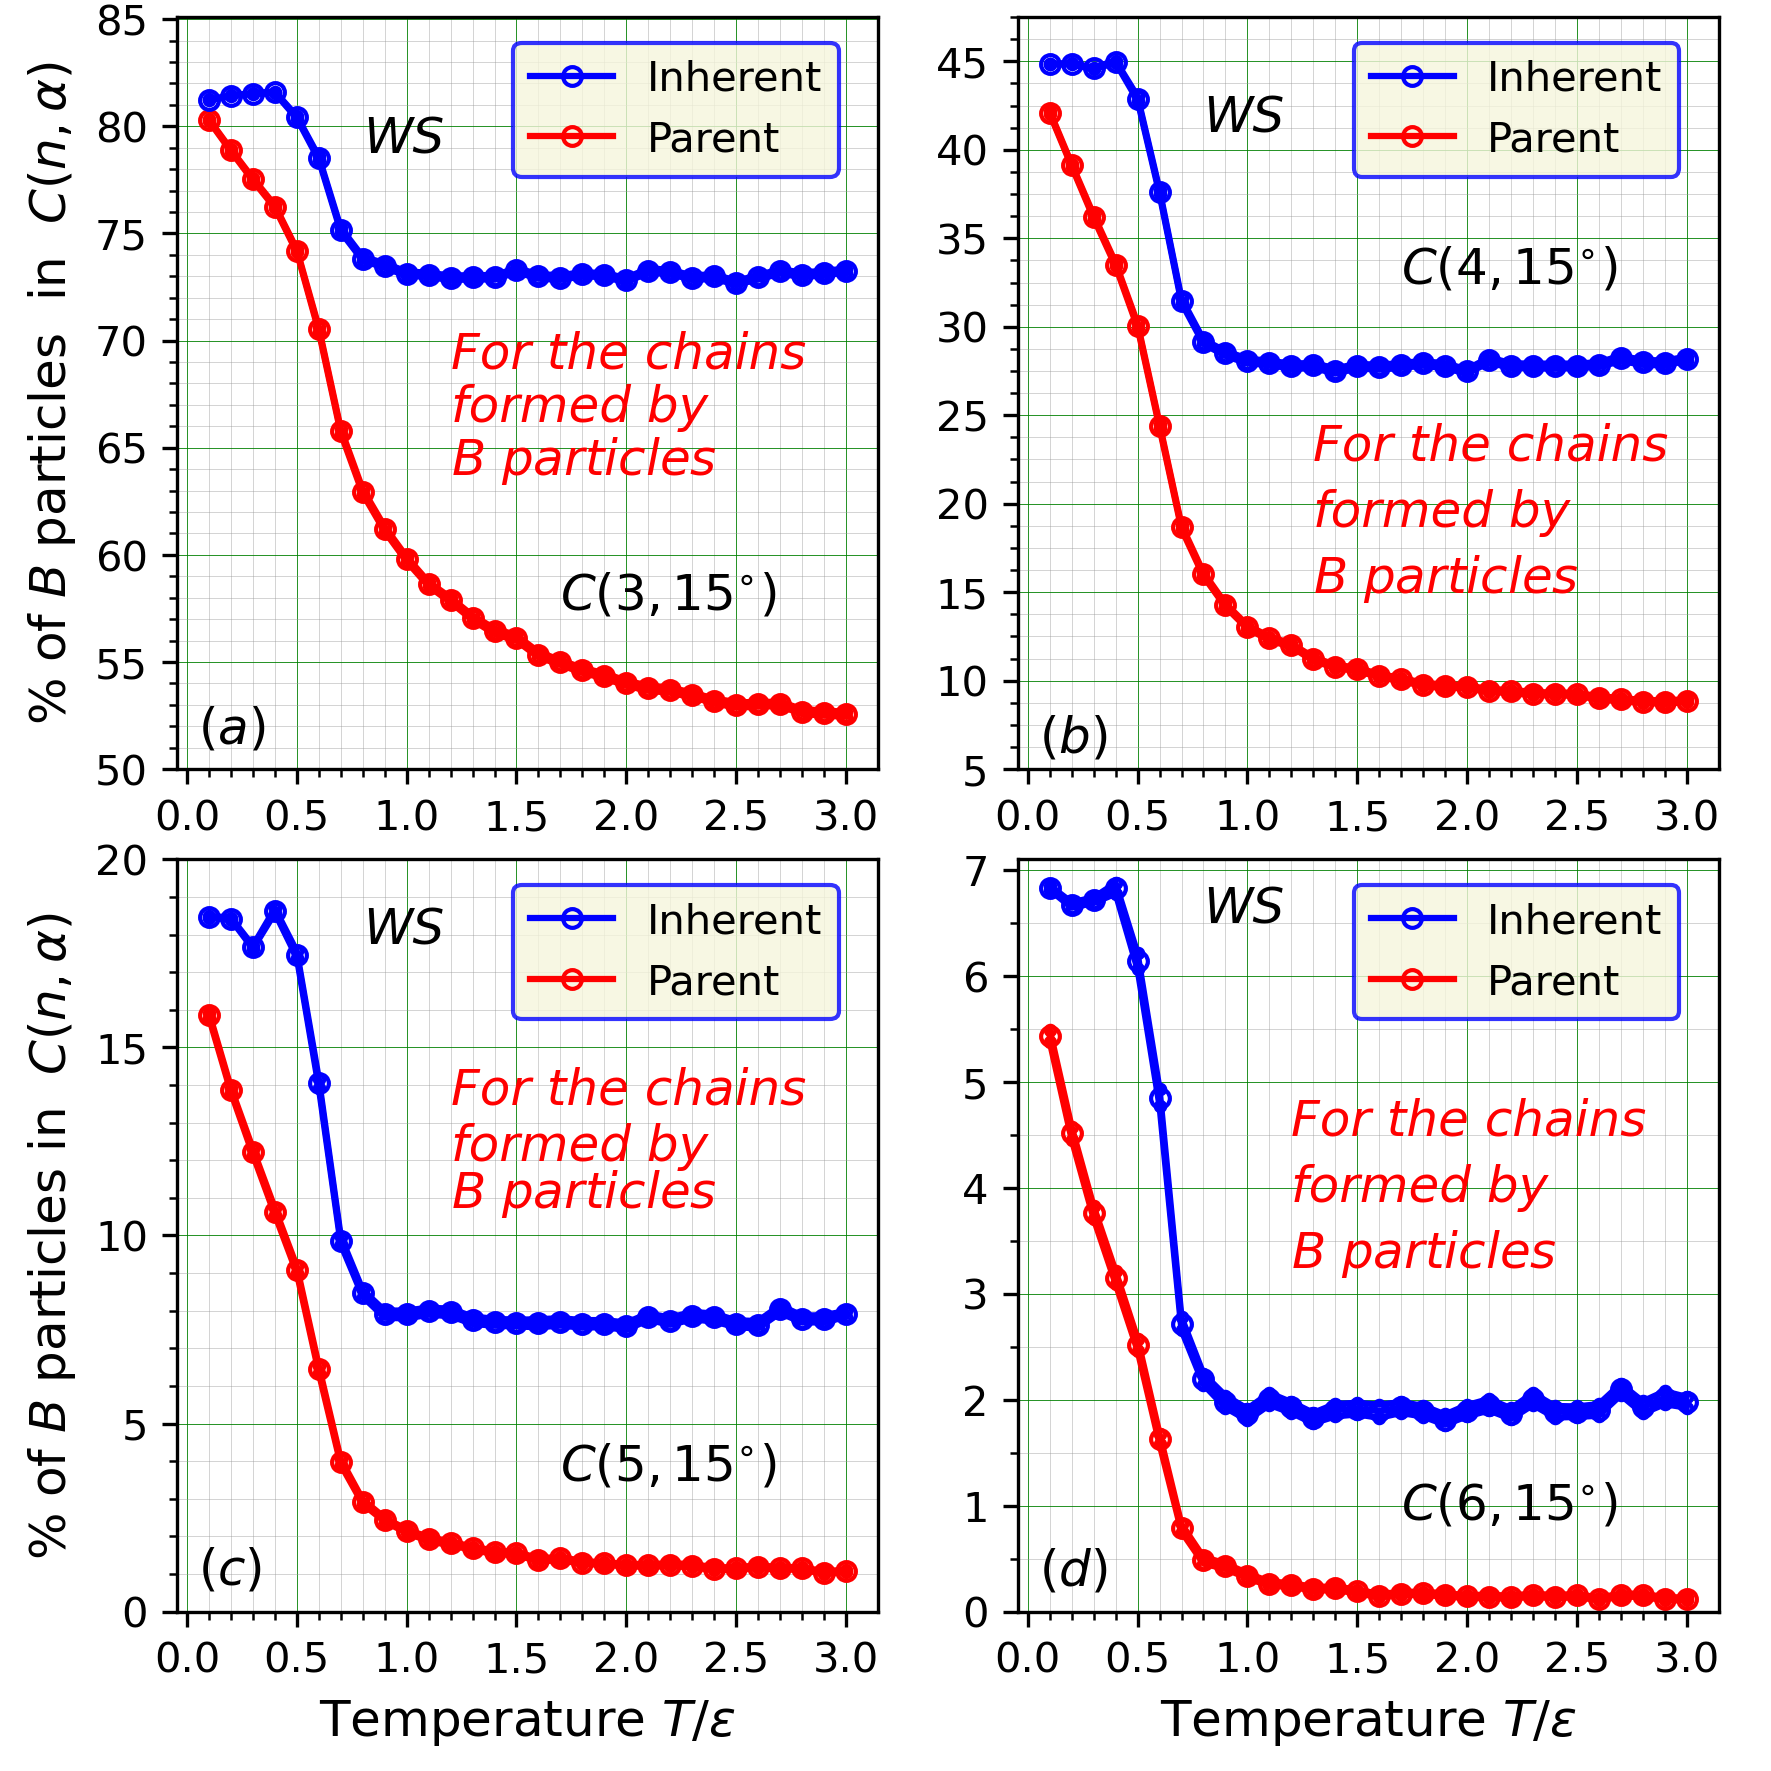
To address the generality of the results obtained on the KAS we also studied the Wahnström system (WS) [wahnstrom1991molecular, malins2013identification] of particles. We found that the development of chains in the WS on cooling is also present. However, in the WS the chains are formed by the smaller, ””, and all particles. Some of the obtained results are shown in Fig. 5. We are planning to report more results obtained on the Wahnström system in a separate publication.
We also studied the formation of the chains in the KAS on cooling at zero pressure–the chains of -particles form in this system too.
Distributions of the potential energies of particles forming the chains
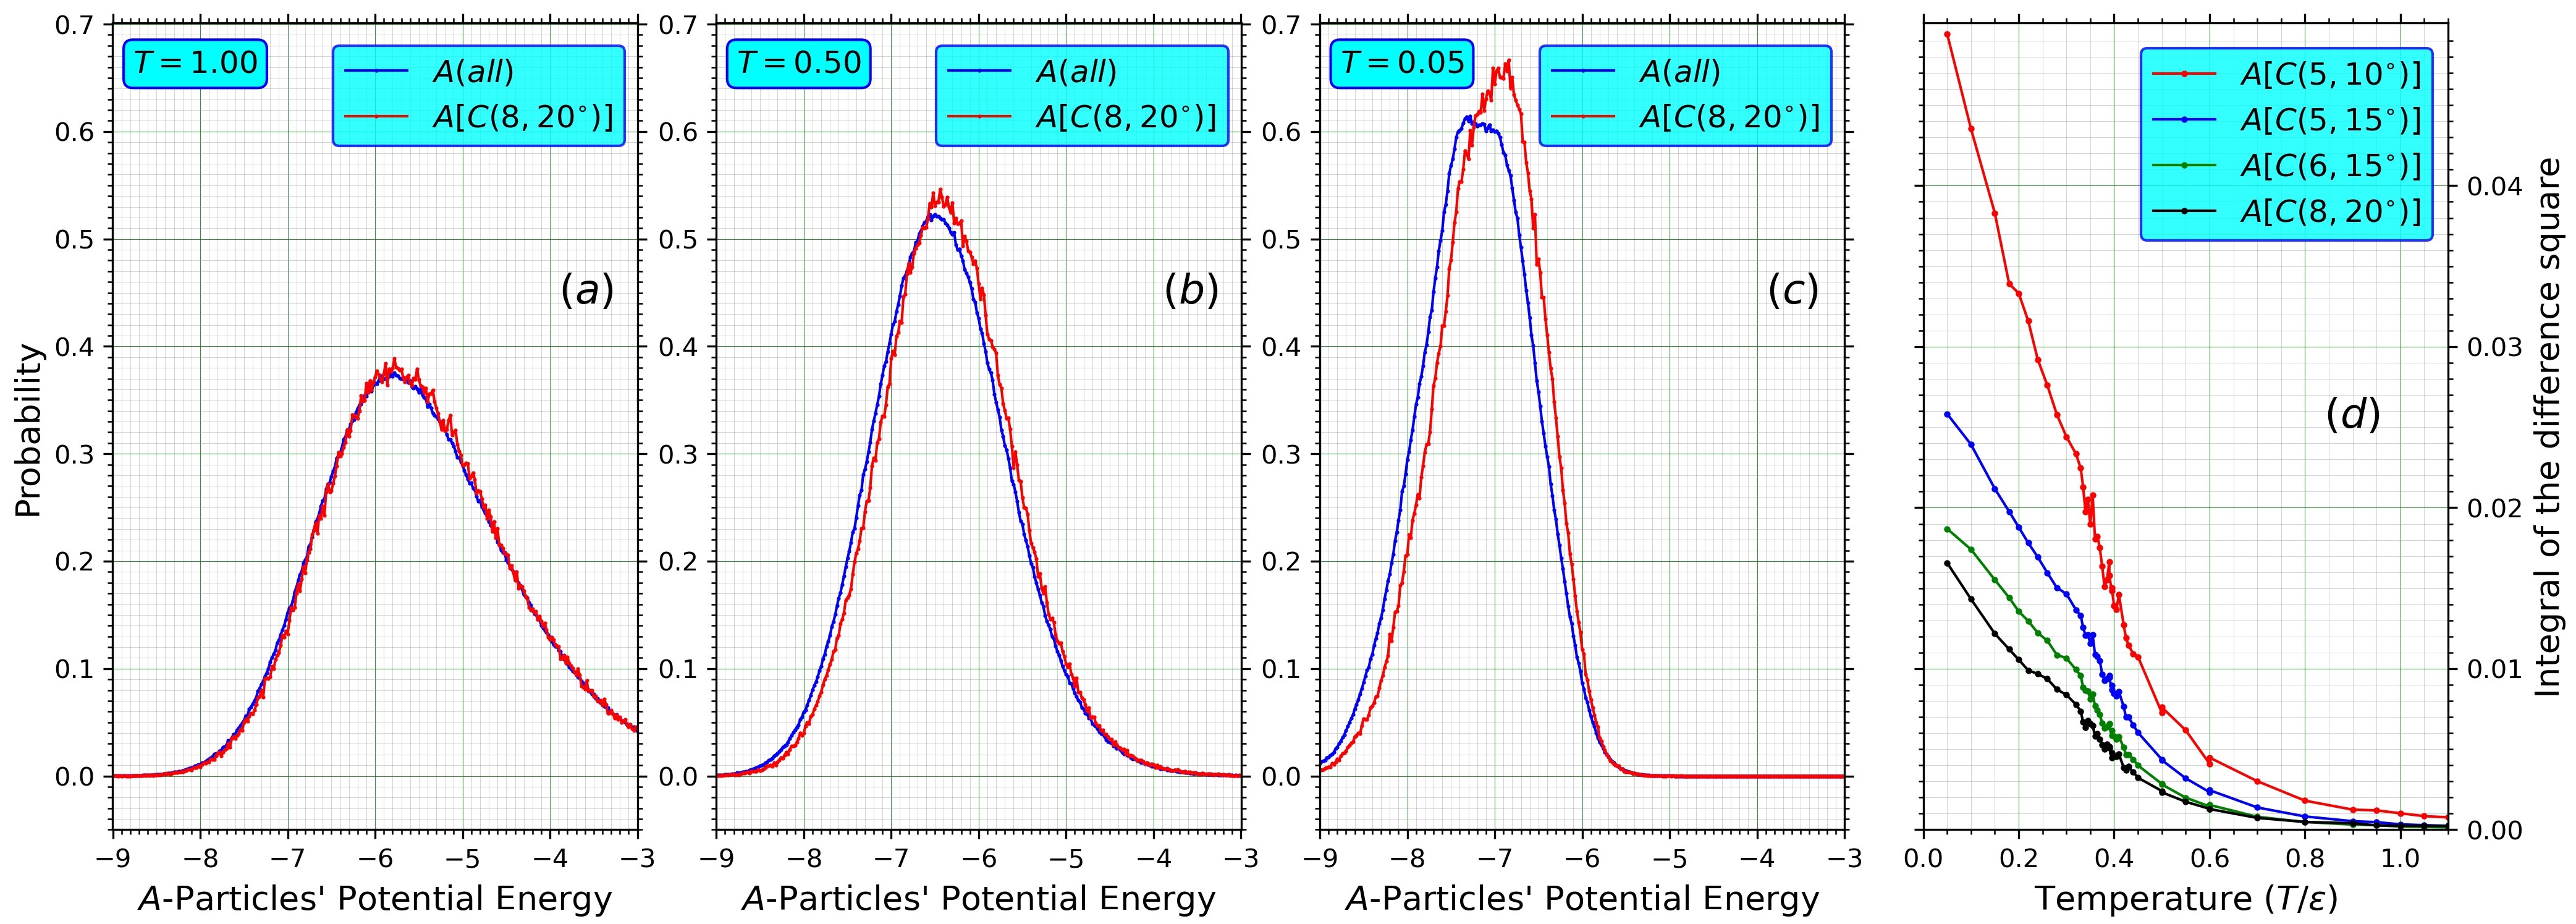
It is of interest to compare the distributions of the potential energies (DoPE) of the -particles participating in the chains with the DoPE of all -particles. These results are shown in Fig. 6(a,b,c). Another figure with more data on the issue is provided in the SM. It follows from Fig. 6(a,b,c) that the energies of the particles forming the chains are statistically higher than the energies of all -particles. This result suggests that the chains do not represent the conformations of particles with the tendency to have a particularly high structural stability. It is also possible that the chains are located at the boundaries of some more stable structures. This issue requires further investigations.
In Fig. 6(d) we show how the integrals of the squares of the differences between the curves, like those shown in panels (a,b,c) depend on the temperature. We see that these integrals start to grow as the temperature is reduced below the PELCT. This result also suggests the existence of the connection between the PELC and the chain formation.
Diffusion
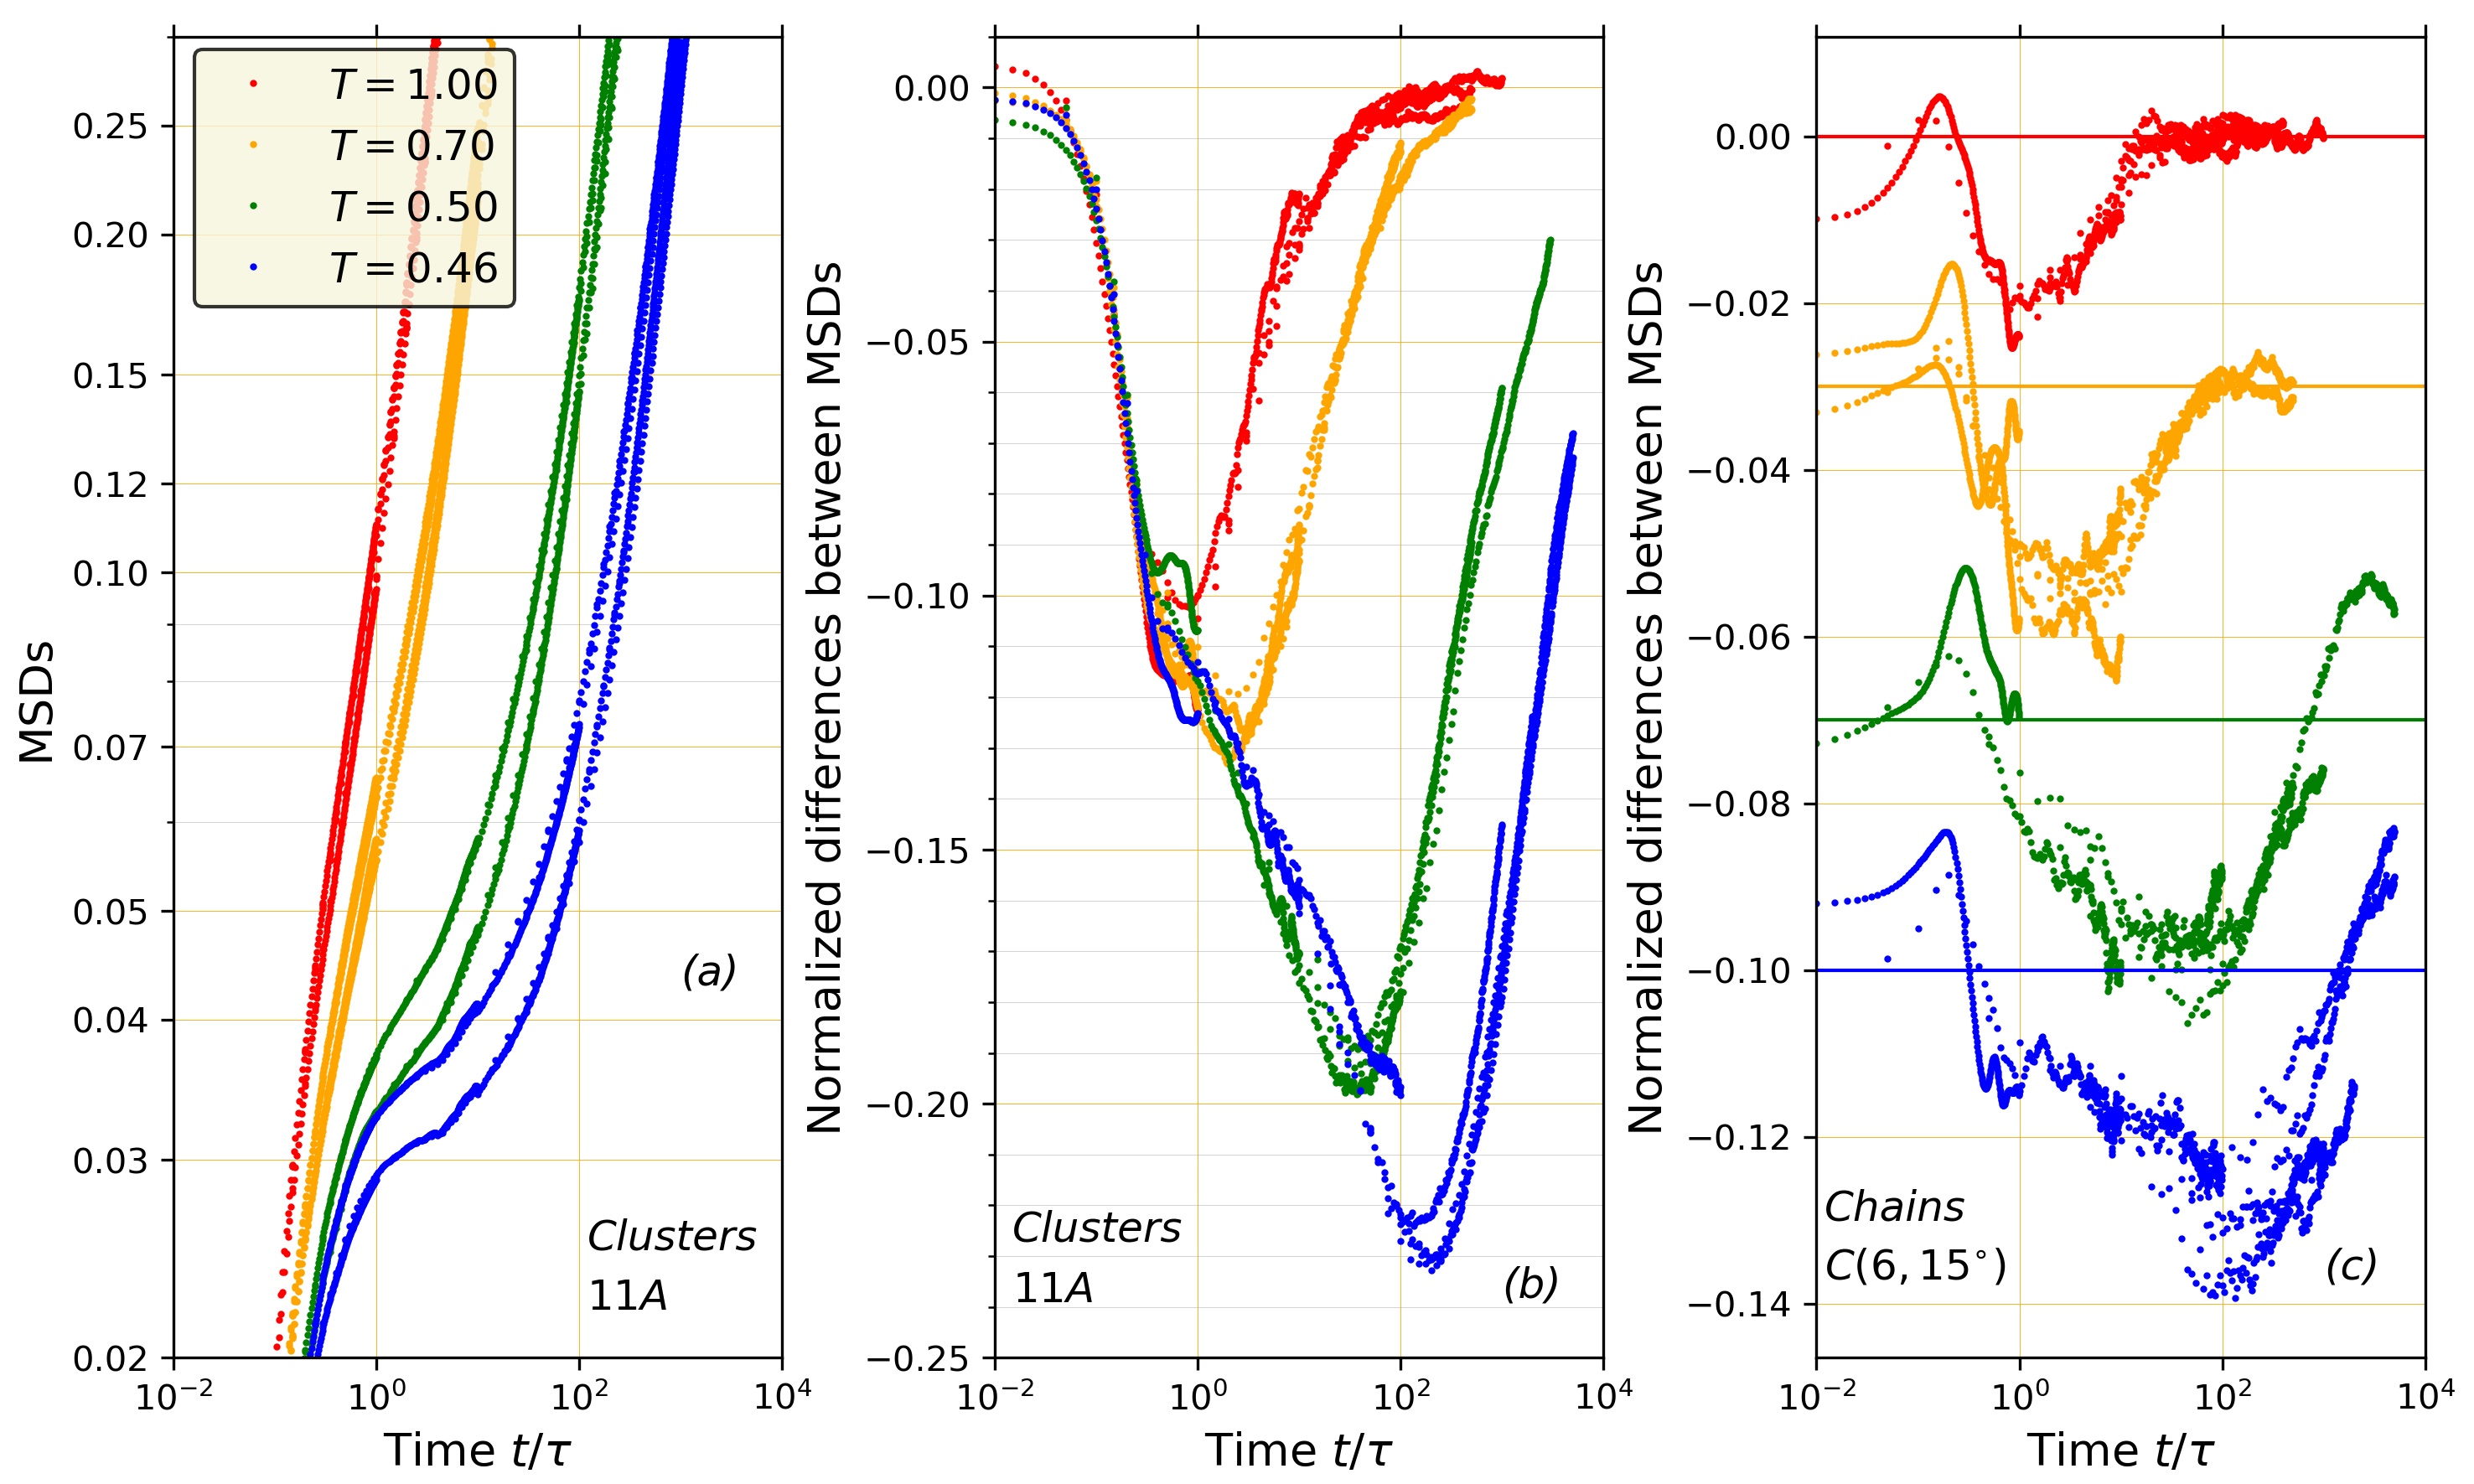
Probably, the most basic question, which is of interest in the context of the observed chains, concerns the rate of diffusion of the particles that form the chains and how the rate of their diffusion compares to the rate of diffusion of other particles. In the context of the clusters of particles, for the Wahnström system, this question has been addressed in Fig.5(c) of Ref. [malins2013longlivedclusters]. Here, we follow the same approach for the KA system and compare the results for the chains with the results for the clusters [malins2013lifetimes]. In panel (a) of Fig. 7 we show the time-dependencies of the mean square displacements (MSDs) of the particles that belong to the and those that do not belong to the clusters. As the temperature decreases, the differences between the curves corresponding to the same temperature increase. The differences are the largest at the late -relaxation time, i.e., when the particles, on average, leave their cages. This behavior can also be observed in panel (b) that shows the normalized differences between the curves of the same color in panel (a). Notably, the difference-curves exhibit well-defined minimums that, as the temperature decreases, shift to the larger times, as expected. Note also that, at the lowest temperature, at the minimum, the normalized difference is approximately of the MSD calculated by averaging over all particles. In panel (c), we show the results, analogous to those in panel (b), but for the particles that belong and do not belong to the chains. For the clarity of presentation, the results for the lower temperatures were shifted downwards. The comparison of the data in (c) with (b) shows that the slow-down effect for the particles in chains is approximately five times smaller than for the particles in clusters. The smallness of the effect is the reason why we did not plot the MSDs corresponding to the chains in panel (a)– it would be difficult to distinguish between the chains-related curves. Nevertheless, panel (c) clearly shows that the slowdown-effect is there.
The data shown in Fig.7, for each temperature, were accumulated in several simulation runs of different lengths. The averaging was done over 1000 initial configurations in each run.
Lifetimes of the chains
It is also of interest to address the lifetimes of the chains (LoCs). Of course, the LoCs depend on the types of the chains. For example, the LoCs and should be different.
In the following, we define the chain-overlap correlation function (COCF) with the goal to address the chains’ lifetimes.
We define as the set of all -particles in the system that participate in all chains at time . Then, is the number of particles in the set . Further, is the time-averaged number of particles in the chains .
It is convenient to introduce the probability, , for a randomly chosen particle to be in the set . Clearly, , where is the total number of -particles in the system.
We define the overlap set, , as the set of particles that simultaneously belong to the sets and . Then, we define: as the number of particles in the set .
Finally, we define the average number of particles in the overlaps corresponding to configurations separated by time :
In further considerations, we assume that and .
Let us consider two sets: and . Since and , all particles in the set are also in the set . Therefore, at :
| (1) |
In the limit , the “memory” of the initial configuration is gone. Therefore, any particle that at was in the set has the same probability to be in the set as any other particle in the system. Therefore:
| (2) |
On the basis of (1,2) we define the chain overlap correlation function (COCF), as:
| (3) |
By definition, is equal to 1 (unity) at and it is equal to zero at .
We also can rewrite (3) using the probabilities:
| (4) |
We define the characteristic lifetimes of the chains as the times at which the functions decay to some chosen values. Thus, is the time at which some COCF decays to the value of and is the time at which the COCF decays to the value of .
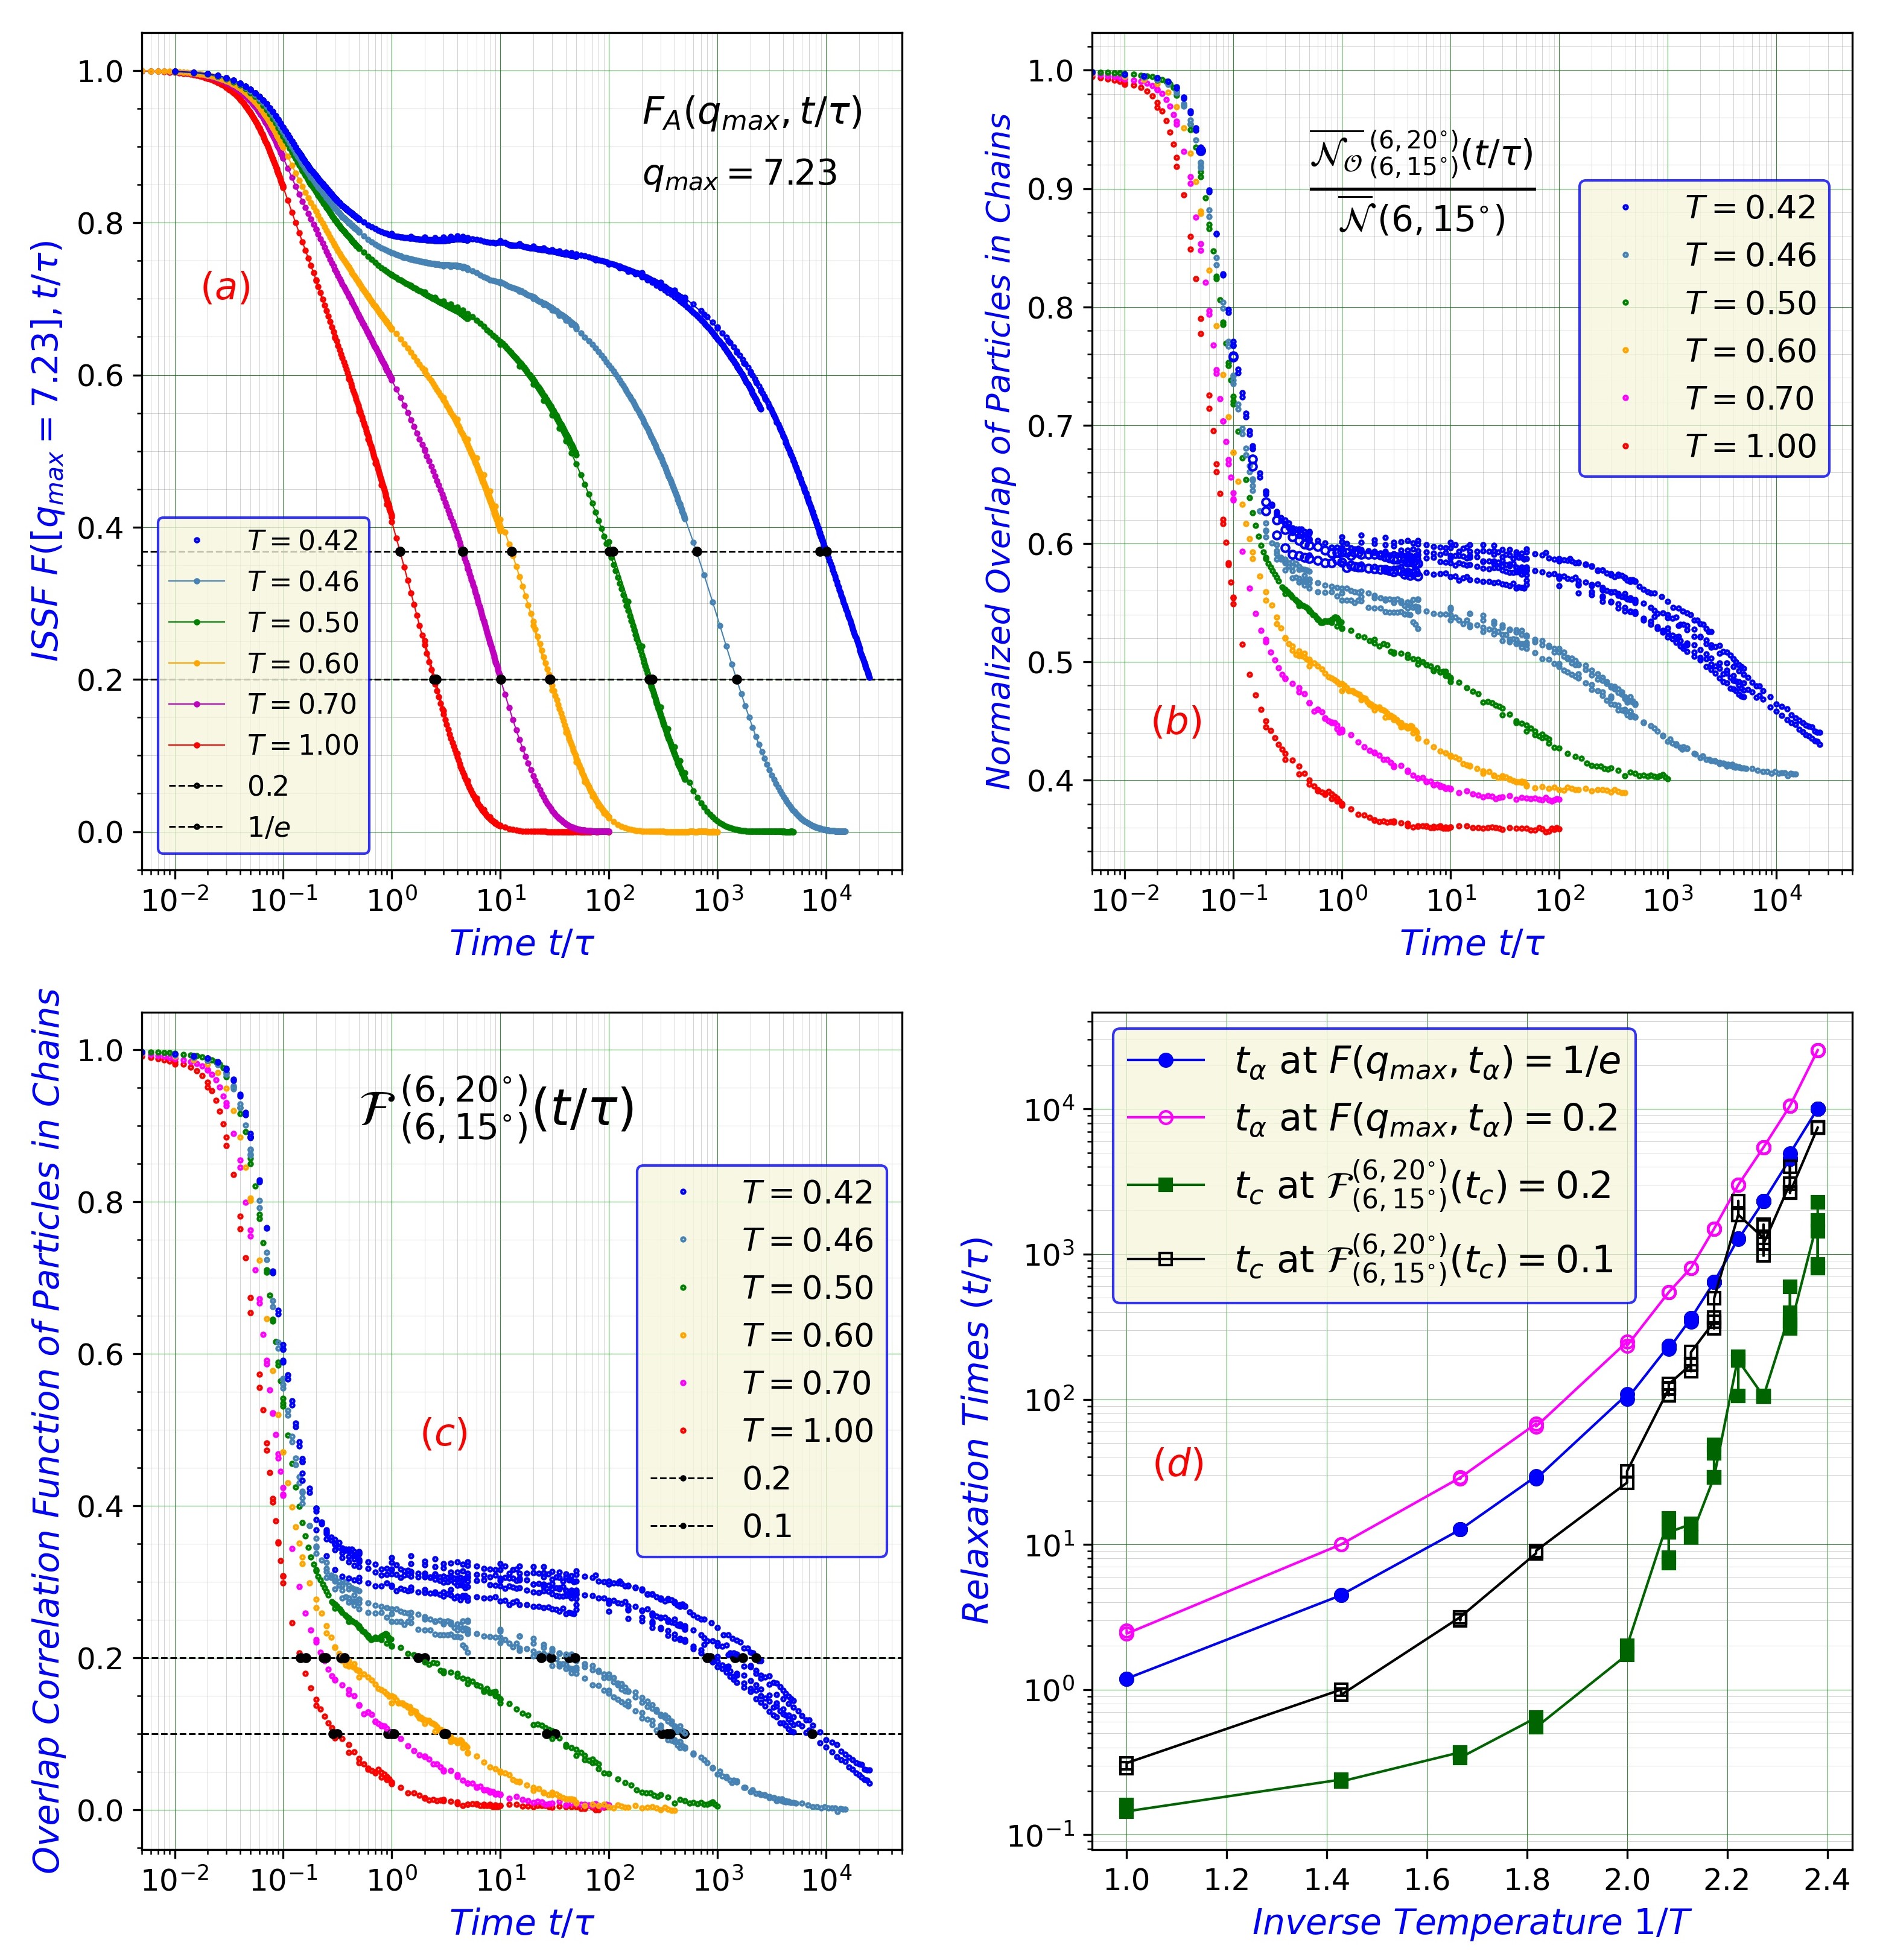
In Fig.8(a) we show the dependencies on time of the intermediate self-scattering function for the large (“A”) particles at selected temperatures. In panels (b) we show the dependencies on time of the normalized number of particles in the overlap between the and sets of chains. Note that, according to (1,2), the shown ratio is equal to at and it saturates to as the time increases, as can be compared with the corresponding panel of Fig.2. In Fig.8(c) we show the COCF defined in (3,4). In this panel, the black circles mark the intersections of the COCF with the lines used to define the COCF decay times.
The result shown in Fig. 8 have been obtained from several independent simulation runs. In these runs, to obtain the correlation functions at different times, the structures were saved for later analysis with different time intervals between the saved configurations. Thus, the total lengths of the simulations runs were also different (for the same number of the saved configurations). It follows from panels (b,c) that for the COCF can significantly vary from a simulation to a simulation. In our view, the reason for this is the insufficient total duration of every particular simulation. Essentially, we observe that the relaxation is not homogeneous in time in the system of the studied size and for the considered time intervals. It is also possible that this behavior is related to some even slower relaxation processes (like ageing) that may proceed in the deeply supercooled liquids. The process of crystallization also can contribute to the observed behavior. However, we think that the process of crystallization can only contribute for the temperatures , i.e., only to the lowest temperature data shown in (b,c) [ingebrigtsen2019crystallization]. Generally, the behavior at such low temperatures is not of interest for us here. Thus, while we show some data for , we are not particularly interested in their quantitative quality at present.
In Fig.8(d), we show the temperature dependencies of the relaxation times obtained from panels (a,c). As it can be expected, the relaxation times associated with the decay of the chains are shorter than the -relaxation times, even thought the chains do not represent a strict geometrical restriction. Indeed, approximately of all -particles participate in such chains at low temperatures.
An important comment concerns the significance of understanding and realization in the simulations of the infinite-time limit of the COCF (3,4). Indeed, in our considerations, we do not address the evolution of each chain individually. Instead, we always consider the total numbers of particles involved in the chains of particular types. For example, some particles can from chain at . The same particles can also form the chains of the same type at . However, at some , such that the chain formed by these particles may not satisfy the required geometrical condition, i.e., it may not exist at . Our approach does not address the time evolution of the chains in such a detailed way. However, the understanding and realization in simulations of the infinite time limit of the COCF justifies the use and physical meaning of the characteristic relaxation times extracted from the behavior of the COCFs.
Conclusion
In this paper, we reported about a structural property of the Kob-Andersen and Wahnström model liquids that has not been discussed previously. Thus, we have shown that in the Kob-Andersen system large -particles exhibit a tendency for an approximately linear chain-like ordering which has been observed in the parent liquid structures above and below the potential energy landscape (PEL) crossover temperature. The observed chains can contain more than 8 particles. Thus, our results indicate that in the liquids there is beyond medium-range angular ordering. The observed chains can represent this ordering or be a part of a more complex ordering that requires further investigations.
The results obtained on the inherent structures show that the temperature dependence of the numbers of particles involved in the chains exhibits a marked crossover at the potential energy landscape crossover temperature. Since our definition of the chains is purely geometrical, it is possible that we found a structural feature that underlies or which is closely related to the phenomenon of the PEL crossover.
Besides, our results show that the relaxation procedures used to obtain the inherent structures can destroy the delicate ordering associated with the chain formation in the supercooled liquid range. It is also possible that the observed behavior is related to the fact that somewhat below the PEL crossover temperature the pressure of the system becomes negative and it becomes even more negative as the temperature of the parent structures further decreases.
In our view, it is natural to assume that the observed chains of particles should be related to the long-debated issue concerning the presence of crystallinity in liquids (see, for example, [levashov2022investigation]). If the observed chains can be considered as crystallites, then the total number of particles participating in the chains characterizes the degree of crystallinity of the liquid. If this is so, then the increase in crystallinity that we observe, as the temperature decreases, shows that the liquid become more crystal-like at lower temperatures.
In this work, we, effectively, look at the one dimensional signature of the possible crystallinity of the studied liquid. In principle, it is possible that this crystallinity is just one dimensional. It is also possible, of course, to search for two dimensional signatures of crystallinity, i.e., to look for small plane-like regions.
We also investigated the rate of diffusion of the particles forming the chains and found that it is only slightly lower than the average rate of diffusion of all particles.
Then, we investigated the lifetimes of the observed chains. The obtained results show that there are several regimes in the decay of the chains which qualitatively resemble the decay regimes of the intermediates self-scattering function. However, the characteristic lifetimes of the chains are noticeably smaller than the -relaxation times.
We also performed similar investigations on on the Wahnström system of particles and the Kon-Andersen model at zero pressure. We found that the chains of particles form in those systems too. We are planning to report more detailed accounts of these results elsewhere.
In our view, further investigations related to the origin of the chain-like ordering are of significant interest.
Acknowledgements
We gratefully acknowledge access to the following computational resources:
Supercomputing Center of Novosibirsk State University (http://nusc.nsu.ru).