††thanks: Now at Iowa State University, Ames, IA 50011, USA††thanks: now at Department of Physics and Astronomy, University of California at Davis, Davis, CA 95616, USA††thanks: Now at Los Alamos National Laboratory, Los Alamos, New Mexico 87545, USA††thanks: now at Department of Physics and Astronomy, University of Mississippi, Oxford, MS 38677††thanks: Now at University of Minnesota, Minneapolis, Minnesota 55455, USA††thanks: Now at Department of Physics, University of Cincinnati, Cincinnati, Ohio 45221, USA
The MINERvA Collaboration
Simultaneous measurement of
charged-current
single production in
CH, C, , Fe, and Pb targets
in MINERvA
A. Bercellie
Department of Physics and Astronomy, University of Rochester, Rochester, New York 14627 USA
K.A. Kroma-Wiley
Department of Physics and Astronomy, University of Pennsylvania, Philadelphia, PA 19104
Department of Physics and Astronomy, University of Rochester, Rochester, New York 14627 USA
S. Akhter
AMU Campus, Aligarh, Uttar Pradesh 202001, India
Z. Ahmad Dar
Department of Physics, William & Mary, Williamsburg, Virginia 23187, USA
AMU Campus, Aligarh, Uttar Pradesh 202001, India
F. Akbar
AMU Campus, Aligarh, Uttar Pradesh 202001, India
V. Ansari
AMU Campus, Aligarh, Uttar Pradesh 202001, India
M. V. Ascencio
Sección Física, Departamento de Ciencias, Pontificia Universidad Católica del Perú, Apartado 1761, Lima, Perú
M. Sajjad Athar
AMU Campus, Aligarh, Uttar Pradesh 202001, India
L. Bellantoni
Fermi National Accelerator Laboratory, Batavia, Illinois 60510, USA
M. Betancourt
Fermi National Accelerator Laboratory, Batavia, Illinois 60510, USA
A. Bodek
Department of Physics and Astronomy, University of Rochester, Rochester, New York 14627 USA
J. L. Bonilla
Campus León y Campus Guanajuato, Universidad de Guanajuato, Lascurain de Retana No. 5, Colonia Centro, Guanajuato 36000, Guanajuato México.
A. Bravar
University of Geneva, 1211 Geneva 4, Switzerland
H. Budd
Department of Physics and Astronomy, University of Rochester, Rochester, New York 14627 USA
G. Caceres
Centro Brasileiro de Pesquisas Físicas, Rua Dr. Xavier Sigaud 150, Urca, Rio de Janeiro, Rio de Janeiro, 22290-180, Brazil
T. Cai
Department of Physics and Astronomy, University of Rochester, Rochester, New York 14627 USA
G.A. Díaz
Department of Physics and Astronomy, University of Rochester, Rochester, New York 14627 USA
H. da Motta
Centro Brasileiro de Pesquisas Físicas, Rua Dr. Xavier Sigaud 150, Urca, Rio de Janeiro, Rio de Janeiro, 22290-180, Brazil
S.A. Dytman
Department of Physics and Astronomy, University of Pittsburgh, Pittsburgh, Pennsylvania 15260, USA
J. Felix
Campus León y Campus Guanajuato, Universidad de Guanajuato, Lascurain de Retana No. 5, Colonia Centro, Guanajuato 36000, Guanajuato México.
L. Fields
Department of Physics, University of Notre Dame, Notre Dame, Indiana 46556, USA
A. Filkins
Department of Physics, William & Mary, Williamsburg, Virginia 23187, USA
R. Fine
Department of Physics and Astronomy, University of Rochester, Rochester, New York 14627 USA
A.M. Gago
Sección Física, Departamento de Ciencias, Pontificia Universidad Católica del Perú, Apartado 1761, Lima, Perú
H. Gallagher
Physics Department, Tufts University, Medford, Massachusetts 02155, USA
P.K.Gaur
AMU Campus, Aligarh, Uttar Pradesh 202001, India
A. Ghosh
Departamento de Física, Universidad Técnica Federico Santa María, Avenida España 1680 Casilla 110-V, Valparaíso, Chile
Centro Brasileiro de Pesquisas Físicas, Rua Dr. Xavier Sigaud 150, Urca, Rio de Janeiro, Rio de Janeiro, 22290-180, Brazil
S.M. Gilligan
Department of Physics, Oregon State University, Corvallis, Oregon 97331, USA
R. Gran
Department of Physics, University of Minnesota – Duluth, Duluth, Minnesota 55812, USA
E.Granados
Campus León y Campus Guanajuato, Universidad de Guanajuato, Lascurain de Retana No. 5, Colonia Centro, Guanajuato 36000, Guanajuato México.
D.A. Harris
York University, Department of Physics and Astronomy, Toronto, Ontario, M3J 1P3 Canada
Fermi National Accelerator Laboratory, Batavia, Illinois 60510, USA
D. Jena
Fermi National Accelerator Laboratory, Batavia, Illinois 60510, USA
S. Jena
Department of Physical Sciences, IISER Mohali, Knowledge City, SAS Nagar, Mohali - 140306, Punjab, India
J. Kleykamp
Department of Physics and Astronomy, University of Rochester, Rochester, New York 14627 USA
A. Klustová
The Blackett Laboratory, Imperial College London, London SW7 2BW, United Kingdom
M. Kordosky
Department of Physics, William & Mary, Williamsburg, Virginia 23187, USA
D. Last
Department of Physics and Astronomy, University of Pennsylvania, Philadelphia, PA 19104
T. Le
Physics Department, Tufts University, Medford, Massachusetts 02155, USA
Rutgers, The State University of New Jersey, Piscataway, New Jersey 08854, USA
A. Lozano
Centro Brasileiro de Pesquisas Físicas, Rua Dr. Xavier Sigaud 150, Urca, Rio de Janeiro, Rio de Janeiro, 22290-180, Brazil
X.-G. Lu
Coventry CV4 7AL, UK
Oxford University, Department of Physics, Oxford, OX1 3PJ United Kingdom
I. Mahbub
Department of Physics, University of Minnesota – Duluth, Duluth, Minnesota 55812, USA
E. Maher
Massachusetts College of Liberal Arts, 375 Church Street, North Adams, MA 01247
S. Manly
Department of Physics and Astronomy, University of Rochester, Rochester, New York 14627 USA
W.A. Mann
Physics Department, Tufts University, Medford, Massachusetts 02155, USA
C. Mauger
Department of Physics and Astronomy, University of Pennsylvania, Philadelphia, PA 19104
K.S. McFarland
Department of Physics and Astronomy, University of Rochester, Rochester, New York 14627 USA
B. Messerly
Department of Physics and Astronomy, University of Pittsburgh, Pittsburgh, Pennsylvania 15260, USA
J. Miller
Departamento de Física, Universidad Técnica Federico Santa María, Avenida España 1680 Casilla 110-V, Valparaíso, Chile
O. Moreno
Department of Physics, William & Mary, Williamsburg, Virginia 23187, USA
Campus León y Campus Guanajuato, Universidad de Guanajuato, Lascurain de Retana No. 5, Colonia Centro, Guanajuato 36000, Guanajuato México.
J.G. Morfín
Fermi National Accelerator Laboratory, Batavia, Illinois 60510, USA
D. Naples
Department of Physics and Astronomy, University of Pittsburgh, Pittsburgh, Pennsylvania 15260, USA
J.K. Nelson
Department of Physics, William & Mary, Williamsburg, Virginia 23187, USA
C. Nguyen
University of Florida, Department of Physics, Gainesville, FL 32611
A. Olivier
Department of Physics and Astronomy, University of Rochester, Rochester, New York 14627 USA
V. Paolone
Department of Physics and Astronomy, University of Pittsburgh, Pittsburgh, Pennsylvania 15260, USA
G.N. Perdue
Fermi National Accelerator Laboratory, Batavia, Illinois 60510, USA
Department of Physics and Astronomy, University of Rochester, Rochester, New York 14627 USA
K.-J. Plows
Oxford University, Department of Physics, Oxford, OX1 3PJ United Kingdom
M.A. Ramírez
Department of Physics and Astronomy, University of Pennsylvania, Philadelphia, PA 19104
Campus León y Campus Guanajuato, Universidad de Guanajuato, Lascurain de Retana No. 5, Colonia Centro, Guanajuato 36000, Guanajuato México.
R.D. Ransome
Rutgers, The State University of New Jersey, Piscataway, New Jersey 08854, USA
H. Ray
University of Florida, Department of Physics, Gainesville, FL 32611
D. Ruterbories
Department of Physics and Astronomy, University of Rochester, Rochester, New York 14627 USA
H. Schellman
Department of Physics, Oregon State University, Corvallis, Oregon 97331, USA
C.J. Solano Salinas
Facultad de Ciencias, Universidad Nacional de Ingeniería, Apartado 31139, Lima, Perú
H. Su
Department of Physics and Astronomy, University of Pittsburgh, Pittsburgh, Pennsylvania 15260, USA
M. Sultana
Department of Physics and Astronomy, University of Rochester, Rochester, New York 14627 USA
V.S. Syrotenko
Physics Department, Tufts University, Medford, Massachusetts 02155, USA
B. Utt
Department of Physics, University of Minnesota – Duluth, Duluth, Minnesota 55812, USA
E. Valencia
Department of Physics, William & Mary, Williamsburg, Virginia 23187, USA
Campus León y Campus Guanajuato, Universidad de Guanajuato, Lascurain de Retana No. 5, Colonia Centro, Guanajuato 36000, Guanajuato México.
N.H. Vaughan
Department of Physics, Oregon State University, Corvallis, Oregon 97331, USA
A.V. Waldron
The Blackett Laboratory, Imperial College London, London SW7 2BW, United Kingdom
B. Yaeggy
Departamento de Física, Universidad Técnica Federico Santa María, Avenida España 1680 Casilla 110-V, Valparaíso, Chile
L. Zazueta
Department of Physics, William & Mary, Williamsburg, Virginia 23187, USA
Abstract
Neutrino-induced charged-current single production in the resonance region is of considerable interest to accelerator-based neutrino oscillation experiments. In this work, high statistics differential cross sections are reported for the semi-exclusive reaction
nucleon(s) on scintillator, carbon, water, iron, and lead targets recorded by MINERvA using a wide-band beam with GeV. Suppression of the cross section at low and enhancement of low are observed in both light and heavy nuclear targets compared to phenomenological models used in current neutrino interaction generators. The cross-sections per nucleon for iron and lead compared to CH across the kinematic variables probed are 0.8 and 0.5 respectively, a scaling which is also not predicted by current generators.
Charged pion production is an important process for accelerator-based oscillation experiments. For low energy experiments, T2K Abe et al. (2011), T2HK Abe et al. (2018), and SBN Antonello et al. (2015), this process is both a significant background to quasielastic scattering and is used as a signal reaction when the pion is identified. For higher energy experiments, NOvA Ayres et al. (2004) and DUNE Acciarri et al. (2015), the process is a large fraction of the signal.
Neutrino oscillation experiments rely on an accurate model of pion production
to evaluate neutrino energy for events with charged pions.
Although NOvA, T2K, and T2HK utilize relatively low-A nuclear media such as hydrocarbons or water, SBN and DUNE experiments rely on argon (A = 40) targets. In order for these
experiments to make use of the wealth of neutrino interaction data obtained with light nuclei, a knowledge of neutrino cross-section scaling as a function of target A is required. This work tests scaling behavior by simultaneously measuring the differential cross sections of nucleons as the target nucleon number is changed from carbon (A=12) to lead (A= 208). We also present cross section ratios to scintillator, where many systematic uncertainties cancel, allowing a precise measurement of the nuclear dependence.
Previous measurements of charged-current pion production Aguilar-Arevalo et al. (2011); Adamson et al. (2015a); Eberly et al. (2015); Le et al. (2015); McGivern et al. (2016); Altinok et al. (2017) have found disagreements between data and models at both low (the negative of the square of the four momentum
transfer from the lepton) and in pion kinetic energy. Simulations of this process must model both the primary neutrino-nucleon interaction and a variety of nuclear effects, including interactions of produced hadrons within the nucleus. This convolution of primary production and nuclear modification makes it difficult to isolate the model features responsible for the disagreements. Measurements on multiple nuclei can help separate nuclear effects from other aspects of the interaction.
Signal reactions for this measurement are charged-current interactions which produce a single negatively charged muon and a single positively charged pion. Any number of baryons may be in the final state; however, no other mesons may be produced. To match MINERvA’s acceptance, the muon is restricted in momentum () and angle with respect to the neutrino beam (), such that GeV/c and . Pion kinetic energy () is restricted to MeV.
To enhance reactions involving a baryon resonance, a selection is made on the invariant hadronic mass of the final state. We define , where , is the average of the proton and neutron masses. is the invariant mass of the hadronic final state under the assumption that
the target nucleon is at rest. is required to be less than GeV.
This analysis provides measurements in eight kinematic variables: the magnitude of the muon momentum and its longitudinal and transverse components (, , and ), the angle of the muon (), the kinetic energy and angle of the charged pion with respect to the neutrino beam ( and ), , and as defined by the kinematics of the final state particles.
These measurements use event samples collected at the MINERvA detector using the medium energy NuMI beam at Fermilab Aliaga et al. (2014). To create the neutrino beam, 120 GeV protons impact a graphite target and produce pions and kaons. Two magnetic horns focus these charged particles into a pipe where they decay into primarily muon neutrinos. A GEANT4 simulation of the NuMI beamline Aliaga et al. (2016) predicts the neutrino flux using constraints from hadron production data. Previous MINERvA measurements of neutrino elastic scattering on atomic electrons, , constrain the normalization of the neutrino flux, reducing the uncertainty of the flux between 2 and 20 GeV from 7.8% to 3.9% Valencia et al. (2019); Zazueta et al. (2022). Another MINERvA measurement of inverse muon decay, , constrains the flux at higher neutrino energies Ruterbories et al. (2021).
These data represent an exposure of protons on target, half of which were taken with the water target filled.
The MINERvA detector consists of a central polystyrene-based scintillator tracker with an upstream nuclear target region and downstream electromagnetic and hadronic calorimeters. The nuclear target region contains five planes of passive material comprised of carbon, water, iron, and lead targets. The scintillator tracking planes are 95% CH by weight.
The passive targets are interspersed between regions of active tracking volumes. The finely segmented tracking volumes of the MINERvA detector consist of hexagonal planes of nestled triangular scintillator strips with a pitch of 1.7 cm , allowing for spatial reconstruction with a resolution of 3 mm Aliaga et al. (2014). The MINOS Near Detector, located 2 m downstream of the MINERvA detector measures charge and momentum of exiting muons Michael et al. (2008).
The simulation of the MINERvA detector utilizes GEANT4 version 4.9.4p2 Agostinelli et al. (2003) with the QGSP_BERT physics list Guthrie et al. (1968); Bertini and Guthrie (1971); Kaidalov (1982) to model the detector response. Calibrations using through-going muons provide the absolute energy scale Aliaga et al. (2014). Measurements on a scaled down version of the MINERvA detector in a charged particle test beam set the hadronic energy response Aliaga et al. (2015). Overlaying data onto simulated events captures the effects of overlapping activity due to additional beam interactions.
A modified version of the GENIE v2.12.6 event generator, denoted “MnvTune v4.3.1”, supplies the neutrino interaction simulation Andreopoulos et al. (2010).
For inelastic events with the invariant hadronic mass GeV/, resonance pion production assumes the Rein-Seghal model Rein and Sehgal (1981) with an axial mass of GeV/
Kuzmin et al. (2006). Deep inelastic scattering relies on the Bodek-Yang model Bodek et al. (2005) tuned to agree with external measurements of pion production and total cross sections. Coherent pion production is simulated with the Rein-Seghal Rein and Sehgal (1983, 2007) model with corrections for muon mass. The nuclear medium is modeled as a relativistic Fermi gas (with Fermi momentum MeV/) Moniz et al. (1971) with an added Bodek-Ritchie high momentum tail Bodek and Ritchie (1981); Bodek (1981). Simulation of hadron final state interactions within the nucleus are predicted by the INTRANUKE-hA package Andreopoulos et al. (2010).
The GENIE simulation has been tuned to better reproduce MINERvA data and provide more accurate signal and background models. Modifications to the quasielastic process are described in Ref. Carneiro et al. (2020); Rodrigues et al. (2016a). Pion production through baryon resonances is modified to match the bubble chamber data as in Ref. Rodrigues et al. (2016b). Coherent pion production is reweighted in both the energy of the pion and to agree with a recent measurement of coherent pion production Ramirez et al. (2022). The normalization of coherent pion production is increased by 43.7% to account for coherent interactions on hydrogen, known as diffractive pion production, based on the Kopeliovic model Kopeliovich et al. (2012). The changes above comprise “MnvTune v4.2.1”.
However, signal events in the scintillator disagree with the prediction of this model. The model for all targets except hydrogen was corrected by matching the simulated cross section versus to the data. This results in improved estimates of efficiencies and backgrounds. . The correction decreases the single pion production for GeV with a slow logarithmic increase for higher . Details of this tune are given in
the supplemental material.
This modification, combined with those of MnvTune v4.2.1,
forms MnvTune v4.3.1.
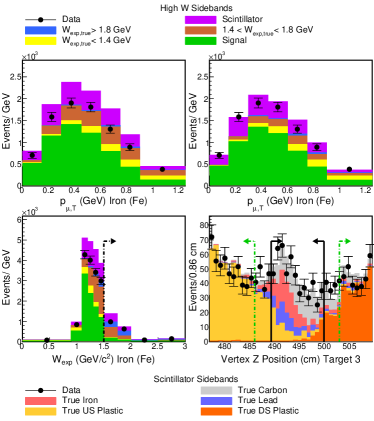
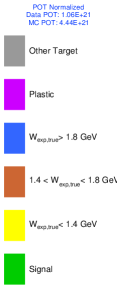
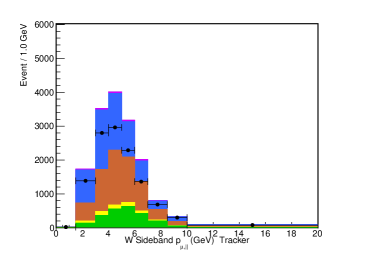
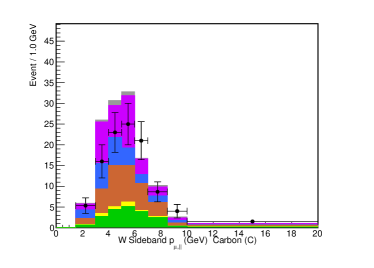
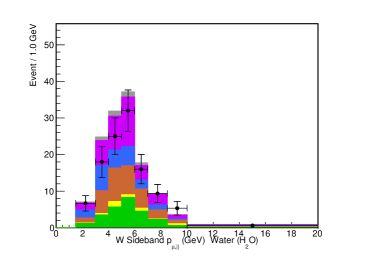
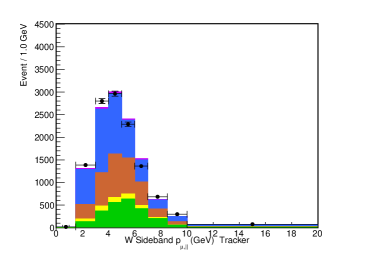
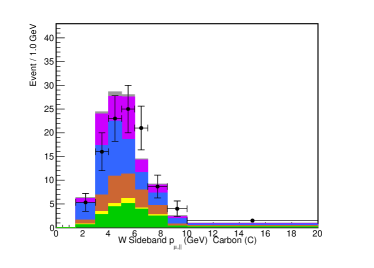
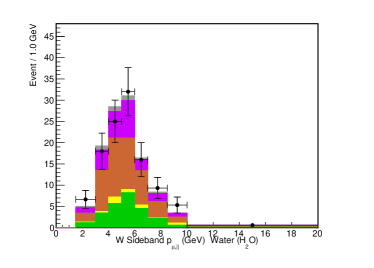
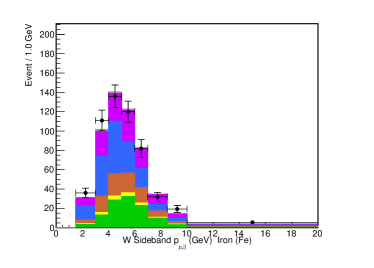
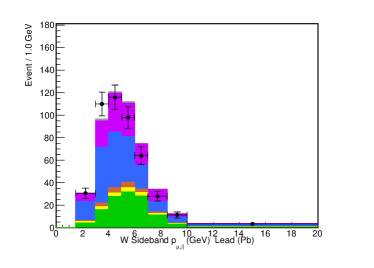
Figure 1: distributions in iron for the signal regions before (top left) and after (top right) the simulation has been constrained with background estimates from data, the high sideband in in iron (bottom left) and the scintillator sidebands in vertex z of target 3 (bottom left).
The background in the bottom plots have not been constrained. The solid (dashed) arrows in the lower right plot delineate the signal (sideband) regions.
Events labeled are those that pass the signal selection but fail other elements of the signal definition.
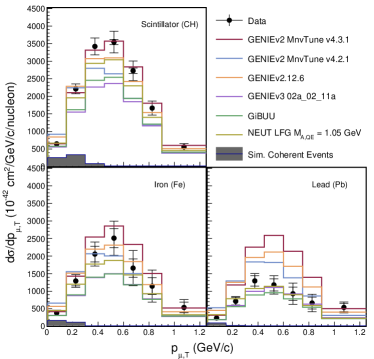
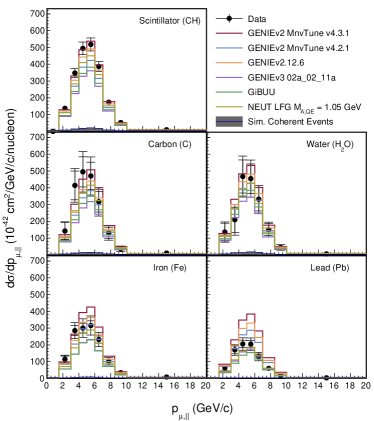
Figure 2: Differential cross section measured on
scintillator, iron, and lead
(solid points) compared to GENIE, GIBUU and NEUT generators, all of which are discrepant with one if not all nuclei.
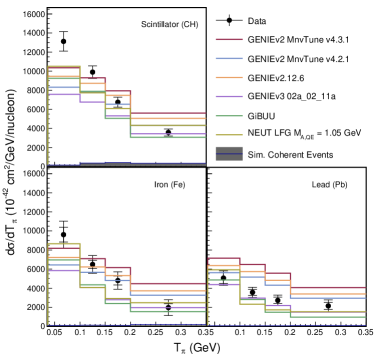
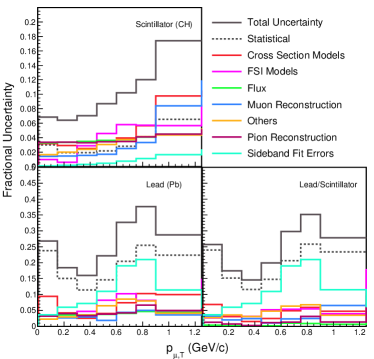
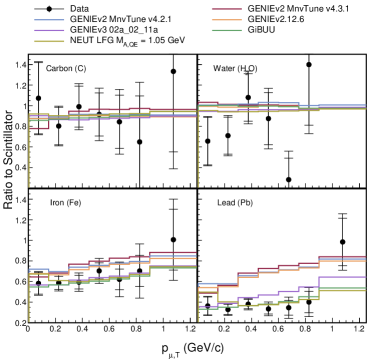
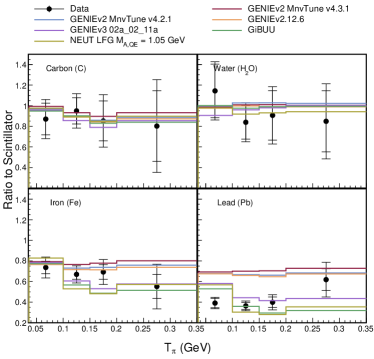
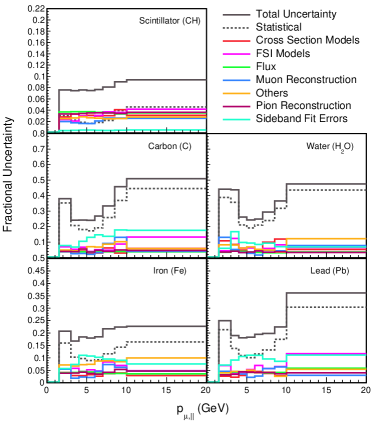
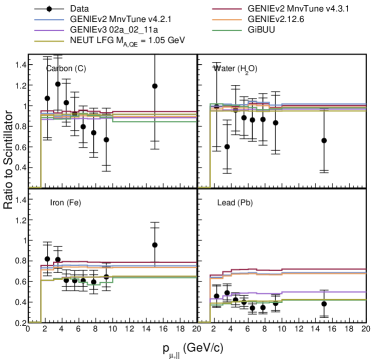
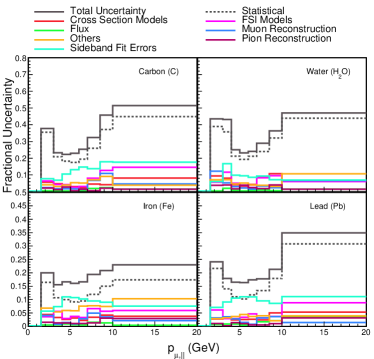
Figure 3: Differential cross section in scintillator, iron, and lead (solid points) compared to GENIE, GIBUU and NEUT generators, all of which are discrepant. Figure 4: Systematic uncertainties on the differential cross section in lead and scintillator and uncertainties of the ratio of .Figure 5: Cross section ratios for carbon, water, iron, and lead (solid points), as compared to GENIE, NEUT, and GIBUU.Figure 6: Cross section ratios for carbon, water, iron, and lead (solid points) compared to predictions from GENIE, NEUT, and GIBUU. The predictions from GIBUU and NEUT agree better with the measurements than those from GENIE.
Selected events are required to have at least two tracked particles that start in the correct target. One track must be identified as a negatively charged muon by the MINOS Near Detector. One remaining track must be identified as a non-interacting charged pion by matching a Michel electron to the endpoint of the track and having longitudinal energy deposition () consistent with a non-interacting pion. All remaining tracks must not have consistent with a pion.
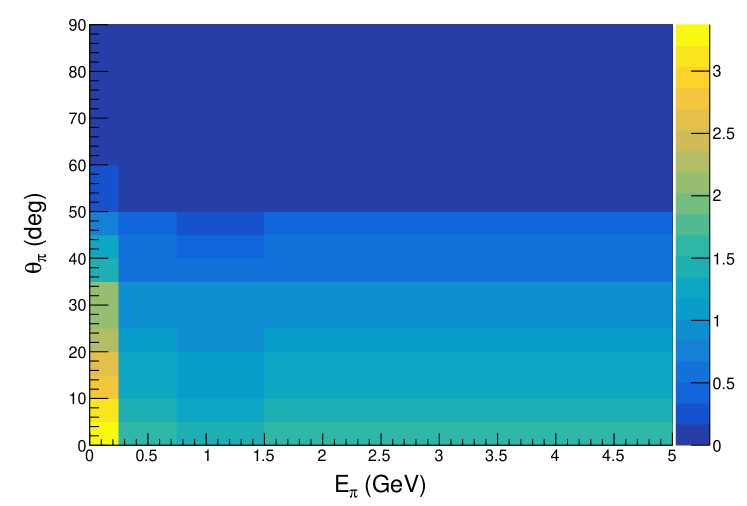
The charged pion tracking efficiency decreases at lower momentum and at angles perpendicular to the detector axis. The efficiency to reconstruct the Michel electron from the was predicted from the simulation and validated in the scintillator tracker using stopping muons produced in the rock upstream of the detector Bercellie (2022).
The GeV requirement strongly reduces the number of multipion events. Both and are computed using the visible calorimetric energy in the detector to estimate Bercellie (2022).
After all cuts there are 33,231 events in the tracker, and 1403 (1033) events in the iron (lead), and 295 (291) events in the carbon (water).
The two primary backgrounds are pion production events with GeV and pion production events that appear to originate from the passive nuclear targets but are actually produced in the adjacent scintillator. First, simulated events with reconstructed GeV in the scintillator target are weighted to match data using two scale factors, one for events with true between and GeV and one for events with above GeV. True is computed in the same manner as reconstructed but uses true simulated values. To improve the background prediction from events in scintillator adjacent to the passive target, pions with low or also receive additional weights to improve agreement with the scintillator target data.
Next, simulated events in each target are
weighted to correct the prediction of adjacent scintillator backgrounds using events observed in data near the passive targets. Finally, a weight is applied for events with high reconstructed , in the same manner as above, for each target material. Fig. 1 shows a sample of data used in the background constraints, before and after constraints. The full set of weights are given in the supplemental material.
Kinematic smearing due to the detector in the background-subtracted distributions is removed with iterative D’Agostini unfolding D’Agostini (1995, 2010) as implemented in the RooUnfold Adye (2011) framework. The number of iterations was chosen by studying the fidelity of unfolding randomly thrown pseudodata samples generated from alternate physics models.
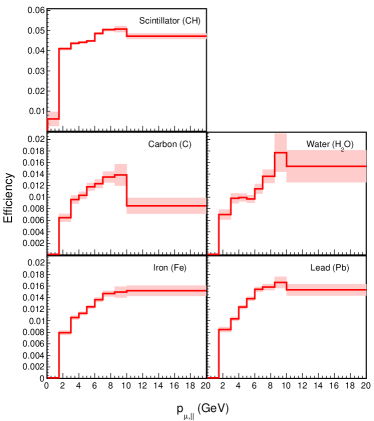
The event distributions are corrected for selection efficiency and acceptance, which is 4.5% (1%) on average in the tracker (passive targets). Efficiencies are available in the supplement.
The differential cross sections are obtained by normalizing the resulting event rates by the integrated neutrino flux and number of target nucleons.
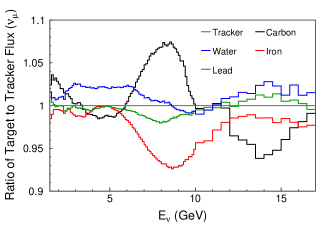
One complication of forming ratios of cross sections between the passive targets and the tracker is that the fluxes have small differences due to the distributions of mass relative to the beam axis, as shown in the supplemental material. This is corrected by measuring the cross section on scintillator in several regions of the detector, each integrated over a slightly different neutrino energy distribution. Linear combinations of these regional cross sections are used to form a cross section integrated over a flux that matches the relevant target. These cross sections are used to form the ratio of target-to-tracker cross-section ratios Bercellie (2022); Kleykamp (2021).
Figure 2 shows the differential cross section on materials with highest statistics (iron, lead, and scintillator). Lower statistics measurements on water and carbon are available in the supplement.
The statistical uncertainty dominates in all measurements, except in the scintillator.
An example of the uncertainties
on the cross sections
are shown in Fig. 4; uncertainties in the cross section models which enter via efficiency and unfolding are the largest, but are lower than the statistical uncertainties in all targets but the scintillator.
Statistical uncertainties in the sideband constraints are also significant for the passive targets. Systematic uncertainties are smaller in the cross section ratios, which benefit from partial cancellation of the flux, cross section model, and reconstruction uncertainties.
Ratios of cross sections to that in scintillator are shown for and in Figs. 5 and 6.
The cross-section ratios of carbon or water to scintillator can be characterized by a scale factor of unity, while ratios between iron or lead to scintillator are constant at 0.8 and 0.5 respectively, with no large modifications to distribution shapes for either or .
Cross sections and cross section ratios to scintillator in other kinematic variables are tabulated and shown in
the supplemental material.
Ratios in the other variables also exhibit this scaling behavior.
None of the six generator models investigated capture the evolution of absolute cross section. The generators NEUTHayato (2009) and GIBUUGallmeister et al. (2016) do correctly predict the cross section ratios between Fe and Pb and scintillator, as shown in Figs. 5 and 6, while the GENIE predictions do not agree. The GENIE models use pion- and nucleon-nucleus scattering data to implement single-step absorption and other scattering processes (INTRANUKE-hA) Andreopoulos et al. (2010), whereas NEUT, NuWRO and GIBUU employ different microscopic transport algorithms to simulate pion and nucleon intranuclear scattering.
As previously noted, the scintillator cross section showed a large discrepancy with the MINERvA-tuned GENIE model, which is corrected with a weight as a function of . In Fig. 2, the differential cross section as a function of the related observable shows poor agreement both with untuned GENIE models (GENIEv2.12.6) and with tuned models without this weighting function (GENIEv2 MnvTune v4.2.1). The shape of the data is in better agreement with the weighted model (GENIEv2 MnvTune v4.3.1) in all targets, even though the weight is derived using only the scintillator measurement. The absolute normalization of the cross section is not well described by MnvTune v4.3.1 in Iron or Lead.
Similarly, the ratios of between the targets and scintillator are consistent with being independent of .
A feature of both the GENIE v3 and GiBUU models is that they
predict the large suppression lead relative to other targets. However, as seen in Fig. 6, these models also predict a larger ratio at low in the heavy targets, a feature which is not seen in the data.
In summary, these data on single pion production on a wide variety of nuclei provide a new way to test nuclear models through their nuclear dependence. We observe a large modification to the predicted distribution of single events that it can be consistently seen in all nuclei. These results give guidance in how the wealth of data on scintillator targets can be applied to models for oxygen and argon for future neutrino experiments.
Acknowledgements.
This document was prepared by members of the MINERvA Collaboration using the resources of the Fermi National Accelerator Laboratory (Fermilab), a U.S. Department of Energy, Office of Science, HEP User Facility. Fermilab is managed by Fermi Research Alliance, LLC (FRA), acting under Contract No. DE-AC02-07CH11359.
These resources included support for the MINERvA construction project, and support
for construction also
was granted by the United States National Science Foundation under
Award No. PHY-0619727 and by the University of Rochester. Support for
participating scientists was provided by NSF and DOE (USA); by CAPES
and CNPq (Brazil); by CoNaCyT (Mexico); by ANID PIA / APOYO AFB180002, CONICYT PIA ACT1413, and Fondecyt 3170845 and 11130133 (Chile);
by CONCYTEC (Consejo Nacional de Ciencia, Tecnología e Innovación Tecnológica), DGI-PUCP (Dirección de Gestión de la Investigación - Pontificia Universidad Católica del Peru), and VRI-UNI (Vice-Rectorate for Research of National University of Engineering) (Peru); NCN Opus Grant No. 2016/21/B/ST2/01092 (Poland); by Science and Technology Facilities Council (UK); by EU Horizon 2020 Marie Skłodowska-Curie Action; by a Cottrell Postdoctoral Fellowship from the Research Corporation for Scientific Advancement; by an Imperial College London President’s PhD Scholarship. We thank the MINOS Collaboration for use of its near detector data. Finally, we thank the staff of
Fermilab for support of the beam line, the detector, and computing infrastructure.
Abe et al. (2018)K. Abe et al. (Hyper-Kamiokande), “Hyper-Kamiokande Design
Report,” (2018), (unpublished), arXiv:1805.04163
[physics.ins-det] .
Antonello et al. (2015)M. Antonello et al. (MicroBooNE, LAr1-ND,
ICARUS-WA104), “A Proposal for
a Three Detector Short-Baseline Neutrino Oscillation Program in the Fermilab
Booster Neutrino Beam,” (2015), (unpublished), arXiv:1503.01520 [physics.ins-det] .
Ayres et al. (2004)D. S. Ayres et al. (NOvA), “NOvA: Proposal to Build a 30 Kiloton Off-Axis
Detector to Study Oscillations in the NuMI
Beamline,” (2004), (unpublished), arXiv:hep-ex/0503053 .
Acciarri et al. (2015)R. Acciarri et al. (DUNE), “Long-Baseline Neutrino Facility (LBNF) and Deep
Underground Neutrino Experiment (DUNE): Conceptual Design Report, Volume 2:
The Physics Program for DUNE at LBNF,” (2015), (unpublished), arXiv:1512.06148 [physics.ins-det] .
Zazueta et al. (2022)L. Zazueta et al. (MINERvA), “Improved constraint on the MINERvA medium
energy neutrino flux using
data,” (2022), (unpublished), arXiv:2209.05540 [hep-ex]
.
Ramirez et al. (2022)M. A. Ramirez et al. (MINERvA), ““-Induced CC Coherent
Production from C, CH, Fe and Pb nuclei in the MINERvA Detector” (manuscript
in preparation),” (2022), “-Induced CC Coherent Production from C, CH, Fe and
Pb nuclei in the MINERvA Detector” (manuscript in preparation).
Bercellie (2022)A. Bercellie (MINERvA), Muon Neutrino Charged Current Single Pion Production on Various Targets in
the MINERvA Detector, Ph.D. thesis, Rochester U. (2022).
A Flux Differences between Targets and Tracker before Reweighting of Tracker
Figure Supp.1: Ratio of neutrino fluxes in carbon, water, iron, and lead to scintillator as a function of energy before reweighting of the scintillator sample denominator.
B Single tune function
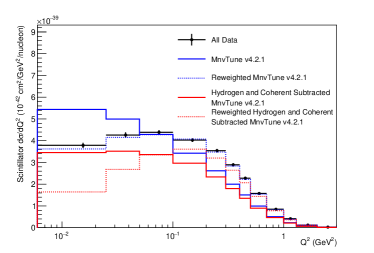
The disagreement between the initial tuned GENIE model described above and the scintillator data was addressed by applying a weighting function, to all non-coherent single pion production on nuclei other than hydrogen. Coherent pion production and production on hydrogen are excluded from the correction because they are independently constrained by the results of Ref. Ramirez et al. (2022) and Ref. Rodrigues et al. (2016b), respectively. The predicted coherent and hydrogen cross section on scintillator in the data was subtracted from the measurement in the data, and compared to the same quantity in the simulation, and the ratio was fit to find .
This fit has the form shown in equation 1, where Erf is the Gaussian error function, and the fitted parameters are given in Tab. Supp.I. Figure Supp.2 shows the cross section ratio as well as the fit.
These suppression at low relative to high is a feature that has been observed in different data sets, including MINOS on iron Adamson et al. (2015b) and in other MINERvA pion measurements on scintillator Stowell et al. (2019); Eberly et al. (2015); McGivern et al. (2016); Altinok et al. (2017). Models have some differences in prediction, although generally do not predict this large suppression. The high shape evolution of different versions and tunes of GENIE goes from GENIEv2 MnvTune v4.2.1 (steepest), to untuned GENIE v2.12.6 to GENIE v3 02a_02_11a to GENIEv2 MnvTune v4.3.1 (flattest) via changes to the axial form factor and, in the case of GENIE v3, also the vector form factor and FSI processes. Like the tunes of Refs. Stowell et al., 2019 and Adamson et al., 2015b, the MnvTune v4.3.1 adds the ad hoc additional shape at low evident in these data.
(1)
Parameter
Fitted Value
/ndf
1.58/11
Table Supp.I: Fitted parameters of the model variation
(a)
(b)
Figure Supp.2: (a) Hydrogen Subtracted Incoherent Data/Simulation Cross Section Ratio and the weighting function (FHC nu-e constraint). (b) Unweighted and Reweighted Total and Hydrogen Subtracted Incoherent Simulated Cross Section Compared to Data Cross Section.
C Sideband scale factors
Target
GeV/
GeV/
/ndf
Carbon
0.147/4
Water
18.956/4
Iron
1.705/4
Lead
0.324/4
Scintillator
3.192/4
Table Supp.II: sideband scales found from the fit in the high GeV sideband for all targets.
(a)
(b)
(c)
(d)
(e)
Figure Supp.3: distribution of selected events before constraining the simulation using background estimates from data. The dashed arrow delineates the high sideband region.
(a)
(b)
(c)
(d)
(e)
Figure Supp.4: distribution of selected events after constraining the simulation using background estimates from data. The dashed arrow delineates the high sideband region.
Target
Upstream Scale
Upstream /ndf
Downstream Scale
Downstream /ndf
Target 1
1.45/6
2.76/6
Target 2
3.90/7
12.00/6
Target 3
6.93/10
4.03/7
Target 4
4.18/5
13.70/7
Target 5
9.89/7
11.89/7
Table Supp.III: Upstream and downstream scintillator target sideband scales for all nuclear targets
D Coherent Pion Production Weights
Figure Supp.5: Plot of weights applied to coherent pion production events, given the kinematics of the coherent , derived from ME MINERvA data Ramirez et al. (2022)
(GeV)
0.0-0.25
0.25-0.5
0.5-0.75
0.75-1.0
1.0-1.5
1.5-2.0
2.0-3.0
3.0-5.0
(deg)
0-5
3.372
1.593
1.593
1.369
1.360
1.593
1.593
1.593
5-10
3.083
1.456
1.456
1.251
1.243
1.456
1.456
1.456
10-15
2.742
1.296
1.296
1.113
1.106
1.296
1.296
1.296
15-20
2.577
1.218
1.218
1.046
1.039
1.218
1.218
1.218
20-25
2.345
1.108
1.108
0.952
0.945
1.108
1.108
1.108
25-30
2.116
1.000
1.000
0.859
0.853
1.000
1.000
1.000
30-35
2.116
1.000
1.000
0.859
0.853
1.000
1.000
1.000
35-40
1.422
0.672
0.672
0.577
0.573
0.672
0.672
0.672
40-45
1.238
0.585
0.585
0.503
0.499
0.585
0.585
0.585
45-50
0.713
0.337
0.337
0.289
0.288
0.337
0.337
0.337
50-60
0.263
0.124
0.124
0.107
0.106
0.124
0.124
0.124
60-70
0.049
0.023
0.023
0.020
0.020
0.023
0.023
0.023
70-80
0.049
0.023
0.023
0.020
0.020
0.023
0.023
0.023
80-90
0.049
0.023
0.023
0.020
0.020
0.023
0.023
0.023
Table Supp.IV: Tabulation of weights applied to coherent pion production events, given the kinematics of the coherent , derived from ME MINERvA data Ramirez et al. (2022)
E Efficiencies
(a)
(b)
(c)
(d)
Figure Supp.6: Efficiencies for scintillator (top left), carbon (middle left), water (middle right), iron (bottom left) and lead (bottom right). The shaded error bands show total uncertainties, including systematics and simulated statistics.
(a)
(b)
(c)
(d)
Figure Supp.7: Efficiencies for scintillator (top left), carbon (middle left), water (middle right), iron (bottom left) and lead (bottom right). The shaded error bands show total uncertainties, including systematics and simulated statistics.
F Absolute Cross Section Plots
(a)
(b)
(c)
(d)
Figure Supp.8: Differential cross sections versus muon variables.
(a)
(b)
(c)
(d)
Figure Supp.9: Differential cross sections versus other variables.
G Absolute Cross Section Error Summaries
(a)
(b)
(c)
(d)
Figure Supp.10: Systematic uncertainties of differential cross sections for scintillator (top left), carbon (middle left), water (middle right), iron (bottom left) and lead (bottom right)
(a)
(b)
(c)
(d)
Figure Supp.11: Systematic uncertainties of differential cross sections for scintillator (top left), carbon (middle left), water (middle right), iron (bottom left) and lead (bottom right)
H Cross Section Ratio Plots
One of the striking features in these comparisons is that there are large difference in the ratios between the GENIEv2 and GENIEv3 models for the iron and lead targets. These are primarily from different the FSI effects in the generators. The increased pion scattering and absorption rates in heavy nuclei in GENIEv3 appear to better describe our data.
(a)
(b)
(c)
(d)
Figure Supp.12: Cross section ratios versus muon variables.
(a)
(b)
(c)
(d)
Figure Supp.13: Cross section ratios versus other variables.
I Cross Section Ratio Error Summaries
(a)
(b)
(c)
(d)
Figure Supp.14: Systematic uncertainties of cross section ratios for carbon/scintillator (top left), water/scintillator (top right), iron/scintillator (bottom left) and lead/scintillator (bottom right)
(a)
(b)
(c)
(d)
Figure Supp.15: Systematic uncertainties of cross section ratios for carbon/scintillator (top left), water/scintillator (top right), iron/scintillator (bottom left) and lead/scintillator (bottom right)
J Cross Section Tables
Table Supp.V: Measured cross section as function of on scintillator, in units of /GeV/c/nucleon, and the absolute and fractional cross section uncertainties
Bin edges (GeV/c)
Abs. Unc.
Frac. Stat. Unc.
Frac. Sys. Unc.
Frac. Flux Unc.
1.5-3.0
132.41
9.94
0.031
0.068
0.037
3.0-4.0
339.29
25.45
0.022
0.072
0.037
4.0-5.0
492.23
37.09
0.019
0.073
0.037
5.0-6.0
521.41
39.22
0.017
0.073
0.037
6.0-7.0
393.48
30.19
0.018
0.074
0.036
7.0-8.5
177.43
14.31
0.022
0.078
0.035
8.5-10.0
53.66
4.89
0.039
0.082
0.033
10.0-20.0
9.51
0.90
0.046
0.083
0.035
Table Supp.VI: Statistical covariance matrix of measured cross section as function of on scintillator, in units of /GeV/c/nucleon
Bin edges (GeV/c)
1.5-3.0
3.0-4.0
4.0-5.0
5.0-6.0
6.0-7.0
7.0-8.5
8.5-10.0
10.0-20.0
1.5-3.0
16.658
4.105
0.935
0.338
0.170
0.049
0.020
0.002
3.0-4.0
4.105
57.479
12.979
3.077
0.916
0.225
0.043
0.006
4.0-5.0
0.935
12.979
83.056
19.009
4.249
0.707
0.145
0.016
5.0-6.0
0.338
3.077
19.009
76.961
17.936
2.974
0.414
0.049
6.0-7.0
0.170
0.916
4.249
17.936
52.187
8.527
1.138
0.061
7.0-8.5
0.049
0.225
0.707
2.974
8.527
15.067
1.952
0.104
8.5-10.0
0.020
0.043
0.145
0.414
1.138
1.952
4.444
0.153
10.0-20.0
0.002
0.006
0.016
0.049
0.061
0.104
0.153
0.190
Table Supp.VII: Systematic covariance matrix of measured cross section in on scintillator, in units of /GeV/c/nucleon
Bin edges (GeV/c)
1.5-3.0
3.0-4.0
4.0-5.0
5.0-6.0
6.0-7.0
7.0-8.5
8.5-10.0
10.0-20.0
1.5-3.0
82.125
213.956
314.097
329.205
240.409
106.454
32.919
5.696
3.0-4.0
213.956
590.438
854.841
906.030
662.006
293.496
94.406
15.869
4.0-5.0
314.097
854.841
1292.343
1361.955
1020.144
458.089
144.301
24.963
5.0-6.0
329.205
906.030
1361.955
1461.454
1099.429
498.336
156.016
26.910
6.0-7.0
240.409
662.006
1020.144
1099.429
859.179
394.495
122.519
21.348
7.0-8.5
106.454
293.496
458.089
498.336
394.495
189.709
57.596
10.355
8.5-10.0
32.919
94.406
144.301
156.016
122.519
57.596
19.425
3.242
10.0-20.0
5.696
15.869
24.963
26.910
21.348
10.355
3.242
0.618
Table Supp.VIII: Measured cross section as function of on scintillator, in units of /degree/nucleon, and the absolute and fractional cross section uncertainties
Bin edges (degree)
Abs. Unc.
Frac. Stat. Unc.
Frac. Sys. Unc.
Frac. Flux Unc.
0-2
93.64
6.19
0.023
0.062
0.033
2-3
226.67
15.25
0.025
0.063
0.035
3-4
276.53
18.89
0.025
0.063
0.035
4-5
278.12
22.02
0.028
0.074
0.036
5-6
262.12
25.46
0.031
0.092
0.038
6-8
232.61
21.04
0.027
0.086
0.038
8-10
167.48
16.70
0.038
0.092
0.041
10-13
114.14
13.91
0.047
0.112
0.046
Table Supp.IX: Statistical covariance matrix of measured cross section as function of on scintillator, in units of /degree/nucleon
Bin edges (degree)
0-2
2-3
3-4
4-5
5-6
6-8
8-10
10-13
0-2
4.693
-0.300
-0.494
-0.035
-0.001
-0.002
-0.002
-0.002
2-3
-0.300
31.566
0.489
-1.641
-0.173
-0.013
-0.015
-0.013
3-4
-0.494
0.489
49.367
1.222
-2.542
-0.137
0.002
-0.004
4-5
-0.035
-1.641
1.222
60.451
2.522
-1.709
-0.064
0.008
5-6
-0.001
-0.173
-2.542
2.522
68.064
-0.152
-1.074
-0.021
6-8
-0.002
-0.013
-0.137
-1.709
-0.152
39.575
-0.871
-0.601
8-10
-0.002
-0.015
0.002
-0.064
-1.074
-0.871
39.542
-1.187
10-13
-0.002
-0.013
-0.004
0.008
-0.021
-0.601
-1.187
28.649
Table Supp.X: Systematic covariance matrix of measured cross section in on scintillator, in units of /degree/nucleon
Bin edges (degree)
0-2
2-3
3-4
4-5
5-6
6-8
8-10
10-13
0-2
33.684
78.058
87.540
87.329
86.942
68.156
50.842
37.409
2-3
78.058
200.937
237.301
255.413
267.730
210.228
154.423
119.171
3-4
87.540
237.301
307.318
345.850
375.759
306.688
229.018
179.044
4-5
87.329
255.413
345.850
424.408
479.626
386.851
290.976
229.426
5-6
86.942
267.730
375.759
479.626
580.386
461.821
343.697
276.712
6-8
68.156
210.228
306.688
386.851
461.821
403.285
300.163
244.821
8-10
50.842
154.423
229.018
290.976
343.697
300.163
239.503
193.833
10-13
37.409
119.171
179.044
229.426
276.712
244.821
193.833
164.717
Table Supp.XI: Measured cross section as function of on scintillator, in units of /GeV/c/nucleon, and the absolute and fractional cross section uncertainties
Bin edges (GeV/c)
Abs. Unc.
Frac. Stat. Unc.
Frac. Sys. Unc.
Frac. Flux Unc.
1.5-3.0
137.27
10.42
0.030
0.070
0.037
3.0-4.0
347.62
25.93
0.022
0.071
0.037
4.0-5.0
494.41
37.52
0.018
0.074
0.037
5.0-6.0
518.20
38.78
0.017
0.073
0.037
6.0-7.0
386.60
29.60
0.018
0.074
0.036
7.0-8.5
173.45
14.06
0.022
0.078
0.035
8.5-10.0
52.71
4.76
0.040
0.081
0.033
10.0-20.0
9.44
0.89
0.046
0.082
0.035
Table Supp.XII: Statistical covariance matrix of measured cross section as function of on scintillator, in units of /GeV/c/nucleon
Bin edges (GeV/c)
1.5-3.0
3.0-4.0
4.0-5.0
5.0-6.0
6.0-7.0
7.0-8.5
8.5-10.0
10.0-20.0
1.5-3.0
17.281
4.316
0.981
0.386
0.175
0.047
0.019
0.002
3.0-4.0
4.316
59.783
13.377
3.199
0.890
0.225
0.042
0.006
4.0-5.0
0.981
13.377
83.368
19.478
4.159
0.688
0.142
0.016
5.0-6.0
0.386
3.199
19.478
76.300
17.415
2.887
0.399
0.049
6.0-7.0
0.175
0.890
4.159
17.415
50.714
8.346
1.129
0.062
7.0-8.5
0.047
0.225
0.688
2.887
8.346
14.498
1.871
0.101
8.5-10.0
0.019
0.042
0.142
0.399
1.129
1.871
4.343
0.147
10.0-20.0
0.002
0.006
0.016
0.049
0.062
0.101
0.147
0.188
Table Supp.XIII: Systematic covariance matrix of measured cross section in on scintillator, in units of /GeV/c/nucleon
Bin edges (GeV/c)
1.5-3.0
3.0-4.0
4.0-5.0
5.0-6.0
6.0-7.0
7.0-8.5
8.5-10.0
10.0-20.0
1.5-3.0
91.226
229.520
338.349
347.709
251.637
112.813
34.549
6.067
3.0-4.0
229.520
612.679
877.172
909.191
657.101
291.505
93.008
15.804
4.0-5.0
338.349
877.172
1324.084
1362.526
1012.135
457.507
142.290
25.029
5.0-6.0
347.709
909.191
1362.526
1427.562
1062.163
483.211
149.666
26.138
6.0-7.0
251.637
657.101
1012.135
1062.163
825.422
380.578
117.151
20.653
7.0-8.5
112.813
291.505
457.507
483.211
380.578
183.242
55.337
10.013
8.5-10.0
34.549
93.008
142.290
149.666
117.151
55.337
18.344
3.110
10.0-20.0
6.067
15.804
25.029
26.138
20.653
10.013
3.110
0.598
Table Supp.XIV: Measured cross section as function of on scintillator, in units of /GeV/c/nucleon, and the absolute and fractional cross section uncertainties
Bin edges (GeV/c)
Abs. Unc.
Frac. Stat. Unc.
Frac. Sys. Unc.
Frac. Flux Unc.
0.00-0.15
646.46
44.23
0.030
0.062
0.033
0.15-0.30
2212.06
141.95
0.019
0.061
0.033
0.30-0.45
3421.09
240.61
0.019
0.068
0.035
0.45-0.60
3545.67
308.07
0.022
0.084
0.036
0.60-0.75
2728.36
278.16
0.028
0.098
0.037
0.75-0.90
1665.26
200.09
0.041
0.113
0.041
0.90-1.25
559.10
97.31
0.065
0.161
0.045
1.25-2.50
19.99
5.98
0.221
0.202
0.045
Table Supp.XV: Statistical covariance matrix of measured cross section as function of on scintillator, in units of /GeV/c/nucleon
Bin edges (GeV/c)
0.00-0.15
0.15-0.30
0.30-0.45
0.45-0.60
0.60-0.75
0.75-0.90
0.90-1.25
1.25-2.50
0.00-0.15
375.058
-5.551
-47.201
-7.308
-0.821
-0.902
-0.344
-0.030
0.15-0.30
-5.551
1821.647
31.115
-156.758
-39.058
-9.338
-2.217
-0.043
0.30-0.45
-47.201
31.115
4348.247
269.040
-313.708
-92.462
-17.984
-0.914
0.45-0.60
-7.308
-156.758
269.040
5947.956
700.721
-342.839
-78.672
-2.713
0.60-0.75
-0.821
-39.058
-313.708
700.721
5878.758
1013.662
-145.751
-2.860
0.75-0.90
-0.902
-9.338
-92.462
-342.839
1013.662
4679.844
465.915
-9.180
0.90-1.25
-0.344
-2.217
-17.984
-78.672
-145.751
465.915
1335.605
34.903
1.25-2.50
-0.030
-0.043
-0.914
-2.713
-2.860
-9.180
34.903
19.497
Table Supp.XVI: Systematic covariance matrix of measured cross section in on scintillator, in units of /GeV/c/nucleon
Bin edges (GeV/c)
0.00-0.15
0.15-0.30
0.30-0.45
0.45-0.60
0.60-0.75
0.75-0.90
0.90-1.25
1.25-2.50
0.00-0.15
1581.186
5096.119
6401.031
6050.531
4214.151
2732.787
955.250
36.236
0.15-0.30
5096.119
18327.195
26728.571
28116.824
20742.179
13158.005
4370.207
161.226
0.30-0.45
6401.031
26728.571
53542.567
65838.516
54164.519
34609.724
11743.643
442.813
0.45-0.60
6050.531
28116.824
65838.516
88957.669
77342.326
50764.557
18249.458
689.458
0.60-0.75
4214.151
20742.179
54164.519
77342.326
71495.961
48206.936
18687.460
724.443
0.75-0.90
2732.787
13158.005
34609.724
50764.557
48206.936
35354.928
15091.296
591.143
0.90-1.25
955.250
4370.207
11743.643
18249.458
18687.460
15091.296
8133.526
341.419
1.25-2.50
36.236
161.226
442.813
689.458
724.443
591.143
341.419
16.250
Table Supp.XVII: Measured cross section as function of on scintillator, in units of /GeV/nucleon, and the absolute and fractional cross section uncertainties
Bin edges (GeV)
Abs. Unc.
Frac. Stat. Unc.
Frac. Sys. Unc.
Frac. Flux Unc.
0.000-0.025
3825.00
261.09
0.029
0.062
0.033
0.025-0.050
4428.16
286.72
0.028
0.059
0.033
0.050-0.100
4535.82
301.52
0.023
0.062
0.034
0.100-0.200
4059.36
285.14
0.021
0.067
0.035
0.200-0.300
3452.35
286.17
0.024
0.079
0.036
0.300-0.400
2733.16
247.43
0.028
0.086
0.036
0.400-0.500
2103.42
214.43
0.033
0.096
0.037
0.500-0.700
1412.01
153.16
0.034
0.103
0.038
0.700-1.000
718.94
89.74
0.046
0.116
0.041
1.000-1.300
331.82
54.29
0.071
0.147
0.044
1.300-2.000
90.74
24.36
0.137
0.231
0.051
2.000-3.000
21.03
7.04
0.278
0.186
0.039
Table Supp.XVIII: Statistical covariance matrix of measured cross section as function of on scintillator, in units of /GeV/nucleon
Bin edges (GeV)
0.000-0.025
0.025-0.050
0.050-0.100
0.100-0.200
0.200-0.300
0.300-0.400
0.400-0.500
0.500-0.700
0.700-1.000
1.000-1.300
1.300-2.000
2.000-3.000
0.000-0.025
12588.365
997.907
-805.851
-175.415
-12.014
-3.840
-2.954
-1.013
-1.935
-0.723
-0.531
-0.175
0.025-0.050
997.907
14929.823
1929.772
-589.284
-214.404
-36.350
-8.937
-5.562
-3.890
-1.779
-0.493
-0.030
0.050-0.100
-805.851
1929.772
10965.271
674.926
-508.532
-190.296
-62.976
-16.436
-3.694
-3.023
-1.259
-0.104
0.100-0.200
-175.415
-589.284
674.926
7118.253
814.386
-378.057
-250.650
-76.736
-19.479
-5.880
-2.364
-0.485
0.200-0.300
-12.014
-214.404
-508.532
814.386
6771.264
1416.831
-132.953
-214.847
-56.635
-19.106
-2.782
-1.670
0.300-0.400
-3.840
-36.350
-190.296
-378.057
1416.831
5865.008
1736.357
-24.934
-128.954
-45.772
-7.149
-2.457
0.400-0.500
-2.954
-8.937
-62.976
-250.650
-132.953
1736.357
4823.638
887.183
-77.544
-55.772
-11.482
0.465
0.500-0.700
-1.013
-5.562
-16.436
-76.736
-214.847
-24.934
887.183
2338.753
352.481
-49.685
-20.726
-1.956
0.700-1.000
-1.935
-3.890
-3.694
-19.479
-56.635
-128.954
-77.544
352.481
1092.546
239.344
3.234
-4.504
1.000-1.300
-0.723
-1.779
-3.023
-5.880
-19.106
-45.772
-55.772
-49.685
239.344
562.636
91.453
3.066
1.300-2.000
-0.531
-0.493
-1.259
-2.364
-2.782
-7.149
-11.482
-20.726
3.234
91.453
153.493
11.032
2.000-3.000
-0.175
-0.030
-0.104
-0.485
-1.670
-2.457
0.465
-1.956
-4.504
3.066
11.032
34.274
Table Supp.XIX: Systematic covariance matrix of measured cross section in on scintillator, in units of /GeV/nucleon
Bin edges (GeV)
0.000-0.025
0.025-0.050
0.050-0.100
0.100-0.200
0.200-0.300
0.300-0.400
0.400-0.500
0.500-0.700
0.700-1.000
1.000-1.300
1.300-2.000
2.000-3.000
0.000-0.025
55578.445
58860.557
60378.311
45220.647
34618.319
26584.728
20025.404
12986.738
6460.467
3981.279
829.538
205.817
0.025-0.050
58860.557
67278.874
71209.690
60105.923
50535.710
39818.233
31808.493
20735.959
10139.678
5164.600
1487.729
261.792
0.050-0.100
60378.311
71209.690
79947.393
69924.610
60147.726
47554.008
38176.351
25061.644
12064.101
6143.531
1774.373
308.808
0.100-0.200
45220.647
60105.923
69924.610
74185.188
71691.029
59199.546
49384.624
33309.494
16489.765
7198.661
2728.158
399.253
0.200-0.300
34618.319
50535.710
60147.726
71691.029
75124.673
63525.200
54225.183
37359.079
19135.220
8013.084
3474.311
468.633
0.300-0.400
26584.728
39818.233
47554.008
59199.546
63525.200
55354.698
46951.905
33113.395
17206.412
7264.286
3260.826
458.856
0.400-0.500
20025.404
31808.493
38176.351
49384.624
54225.183
46951.905
41157.215
28869.769
15207.015
6487.562
2953.839
418.405
0.500-0.700
12986.738
20735.959
25061.644
33309.494
37359.079
33113.395
28869.769
21118.541
11534.464
5238.876
2309.615
338.961
0.700-1.000
6460.467
10139.678
12064.101
16489.765
19135.220
17206.412
15207.015
11534.464
6960.978
3570.619
1531.486
228.184
1.000-1.300
3981.279
5164.600
6143.531
7198.661
8013.084
7264.286
6487.562
5238.876
3570.619
2385.019
913.026
154.129
1.300-2.000
829.538
1487.729
1774.373
2728.158
3474.311
3260.826
2953.839
2309.615
1531.486
913.026
439.729
62.254
2.000-3.000
205.817
261.792
308.808
399.253
468.633
458.856
418.405
338.961
228.184
154.129
62.254
15.245
Table Supp.XX: Measured cross section as function of on scintillator, in units of /GeV/c2/nucleon, and the absolute and fractional cross section uncertainties
Bin edges (GeV/c2)
Abs. Unc.
Frac. Stat. Unc.
Frac. Sys. Unc.
Frac. Flux Unc.
0.9-1.1
380.21
89.00
0.100
0.212
0.059
1.1-1.2
4969.82
394.14
0.026
0.075
0.038
1.2-1.3
10893.98
791.75
0.015
0.071
0.034
1.3-1.4
7534.12
786.69
0.031
0.100
0.033
Table Supp.XXI: Statistical covariance matrix of measured cross section as function of on scintillator, in units of /GeV/c2/nucleon
Bin edges (GeV/c2)
0.9-1.1
1.1-1.2
1.2-1.3
1.3-1.4
0.9-1.1
1434.912
298.236
-1959.309
-15.500
1.1-1.2
298.236
16108.522
-6199.017
-16343.752
1.2-1.3
-1959.309
-6199.017
28235.499
17223.717
1.3-1.4
-15.500
-16343.752
17223.717
53971.062
Table Supp.XXII: Systematic covariance matrix of measured cross section in on scintillator, in units of /GeV/c2/nucleon
Bin edges (GeV/c2)
0.9-1.1
1.1-1.2
1.2-1.3
1.3-1.4
0.9-1.1
6486.707
15615.022
35973.498
36397.745
1.1-1.2
15615.022
139234.924
211164.417
136341.941
1.2-1.3
35973.498
211164.417
598624.922
523114.324
1.3-1.4
36397.745
136341.941
523114.324
564914.576
Table Supp.XXIII: Measured cross section as function of on scintillator, in units of /GeV/nucleon, and the absolute and fractional cross section uncertainties
Bin edges (GeV)
Abs. Unc.
Frac. Stat. Unc.
Frac. Sys. Unc.
Frac. Flux Unc.
0.035-0.100
13123.56
1025.94
0.016
0.076
0.037
0.100-0.150
9902.55
655.87
0.015
0.064
0.035
0.150-0.200
6746.23
521.56
0.023
0.074
0.035
0.200-0.350
3574.69
367.65
0.032
0.098
0.037
Table Supp.XXIV: Statistical covariance matrix of measured cross section as function of on scintillator, in units of /GeV/nucleon
Bin edges (GeV)
0.035-0.100
0.100-0.150
0.150-0.200
0.200-0.350
0.035-0.100
46118.291
870.889
-2121.179
-1189.136
0.100-0.150
870.889
23295.488
2478.311
-458.209
0.150-0.200
-2121.179
2478.311
24009.621
3296.240
0.200-0.350
-1189.136
-458.209
3296.240
13381.849
Table Supp.XXV: Systematic covariance matrix of measured cross section in on scintillator, in units of /GeV/nucleon
Bin edges (GeV)
0.035-0.100
0.100-0.150
0.150-0.200
0.200-0.350
0.035-0.100
1006425.993
600004.017
464834.038
298853.945
0.100-0.150
600004.017
406873.221
299782.750
190420.988
0.150-0.200
464834.038
299782.750
248015.149
165499.617
0.200-0.350
298853.945
190420.988
165499.617
121786.467
Table Supp.XXVI: Measured cross section as function of on scintillator, in units of /degree/nucleon, and the absolute and fractional cross section uncertainties
Bin edges (degree)
Abs. Unc.
Frac. Stat. Unc.
Frac. Sys. Unc.
Frac. Flux Unc.
0-10
3.46
0.45
0.079
0.102
0.039
10-20
10.35
1.05
0.041
0.092
0.037
20-30
15.83
1.50
0.032
0.089
0.036
30-40
19.13
1.65
0.027
0.082
0.037
40-50
21.54
1.81
0.026
0.080
0.038
50-60
23.20
1.83
0.026
0.074
0.037
60-120
19.20
1.53
0.019
0.077
0.035
120-135
9.30
0.69
0.027
0.069
0.033
135-150
6.21
0.46
0.031
0.068
0.034
150-165
3.20
0.30
0.049
0.079
0.035
165-180
0.78
0.10
0.110
0.074
0.037
Table Supp.XXVII: Statistical covariance matrix of measured cross section as function of on scintillator, in units of /degree/nucleon
Bin edges (degree)
0-10
10-20
20-30
30-40
40-50
50-60
60-120
120-135
135-150
150-165
165-180
0-10
0.074
0.022
-0.002
-0.003
-0.001
-0.001
-0.000
-0.001
-0.000
-0.000
0.005
10-20
0.022
0.183
0.029
-0.007
-0.004
-0.004
-0.003
-0.002
-0.002
0.002
0.005
20-30
-0.002
0.029
0.250
0.034
-0.009
-0.006
-0.003
-0.004
-0.003
0.005
-0.000
30-40
-0.003
-0.007
0.034
0.276
0.040
-0.011
-0.005
-0.006
0.002
0.002
-0.000
40-50
-0.001
-0.004
-0.009
0.040
0.323
0.044
-0.006
-0.004
0.002
-0.003
-0.001
50-60
-0.001
-0.004
-0.006
-0.011
0.044
0.376
0.020
0.002
-0.006
-0.002
-0.000
60-120
-0.000
-0.003
-0.003
-0.005
-0.006
0.020
0.133
0.007
-0.002
0.000
0.000
120-135
-0.001
-0.002
-0.004
-0.006
-0.004
0.002
0.007
0.064
0.009
-0.001
0.000
135-150
-0.000
-0.002
-0.003
0.002
0.002
-0.006
-0.002
0.009
0.036
0.008
0.001
150-165
-0.000
0.002
0.005
0.002
-0.003
-0.002
0.000
-0.001
0.008
0.024
0.001
165-180
0.005
0.005
-0.000
-0.000
-0.001
-0.000
0.000
0.000
0.001
0.001
0.007
Table Supp.XXVIII: Systematic covariance matrix of measured cross section in on scintillator, in units of /degree/nucleon
Bin edges (degree)
0-10
10-20
20-30
30-40
40-50
50-60
60-120
120-135
135-150
150-165
165-180
0-10
0.125
0.325
0.470
0.510
0.522
0.494
0.301
0.146
0.097
0.054
0.014
10-20
0.325
0.913
1.275
1.384
1.399
1.314
0.860
0.434
0.280
0.161
0.038
20-30
0.470
1.275
1.989
2.183
2.306
2.214
1.631
0.653
0.431
0.258
0.059
30-40
0.510
1.384
2.183
2.450
2.624
2.532
1.914
0.750
0.500
0.299
0.071
40-50
0.522
1.399
2.306
2.624
2.936
2.888
2.220
0.856
0.575
0.326
0.078
50-60
0.494
1.314
2.214
2.532
2.888
2.972
2.272
0.903
0.616
0.349
0.079
60-120
0.301
0.860
1.631
1.914
2.220
2.272
2.193
0.675
0.463
0.301
0.059
120-135
0.146
0.434
0.653
0.750
0.856
0.903
0.675
0.407
0.261
0.118
0.025
135-150
0.097
0.280
0.431
0.500
0.575
0.616
0.463
0.261
0.176
0.085
0.018
150-165
0.054
0.161
0.258
0.299
0.326
0.349
0.301
0.118
0.085
0.064
0.012
165-180
0.014
0.038
0.059
0.071
0.078
0.079
0.059
0.025
0.018
0.012
0.003
Table Supp.XXIX: Measured cross section as function of on carbon, in units of /GeV/c/nucleon, and the absolute and fractional cross section uncertainties
Bin edges (GeV/c)
Abs. Unc.
Frac. Stat. Unc.
Frac. Sys. Unc.
Frac. Flux Unc.
1.5-3.0
143.43
53.59
0.348
0.137
0.038
3.0-4.0
400.66
96.71
0.207
0.124
0.038
4.0-5.0
489.84
119.50
0.183
0.162
0.039
5.0-6.0
489.52
115.11
0.170
0.163
0.037
6.0-7.0
310.21
84.33
0.194
0.191
0.037
7.0-8.5
135.12
44.89
0.257
0.210
0.038
8.5-10.0
36.97
16.68
0.364
0.267
0.041
10.0-20.0
11.32
5.78
0.446
0.247
0.038
Table Supp.XXX: Statistical covariance matrix of measured cross section as function of on carbon, in units of /GeV/c/nucleon
Bin edges (GeV/c)
1.5-3.0
3.0-4.0
4.0-5.0
5.0-6.0
6.0-7.0
7.0-8.5
8.5-10.0
10.0-20.0
1.5-3.0
2487.306
783.530
123.415
78.780
75.516
20.167
1.410
1.759
3.0-4.0
783.530
6883.567
1843.185
398.312
105.427
9.190
0.161
0.000
4.0-5.0
123.415
1843.185
7998.915
2532.020
359.777
55.429
7.510
0.000
5.0-6.0
78.780
398.312
2532.020
6906.017
2408.268
351.079
61.864
4.991
6.0-7.0
75.516
105.427
359.777
2408.268
3610.355
1147.420
152.970
34.063
7.0-8.5
20.167
9.190
55.429
351.079
1147.420
1207.419
270.781
15.516
8.5-10.0
1.410
0.161
7.510
61.864
152.970
270.781
180.813
22.407
10.0-20.0
1.759
0.000
0.000
4.991
34.063
15.516
22.407
25.537
Table Supp.XXXI: Systematic covariance matrix of measured cross section in on carbon, in units of /GeV/c/nucleon
Bin edges (GeV/c)
1.5-3.0
3.0-4.0
4.0-5.0
5.0-6.0
6.0-7.0
7.0-8.5
8.5-10.0
10.0-20.0
1.5-3.0
384.799
789.008
1193.866
1166.558
826.990
220.270
87.278
38.919
3.0-4.0
789.008
2468.666
3297.934
3441.037
2430.366
827.244
278.953
104.621
4.0-5.0
1193.866
3297.934
6281.017
5857.713
4182.090
1528.720
419.419
150.395
5.0-6.0
1166.558
3441.037
5857.713
6343.377
4461.196
1667.815
497.086
168.352
6.0-7.0
826.990
2430.366
4182.090
4461.196
3502.013
1401.819
439.792
128.544
7.0-8.5
220.270
827.244
1528.720
1667.815
1401.819
807.588
248.509
47.072
8.5-10.0
87.278
278.953
419.419
497.086
439.792
248.509
97.422
19.134
10.0-20.0
38.919
104.621
150.395
168.352
128.544
47.072
19.134
7.842
Table Supp.XXXII: Measured cross section as function of on carbon, in units of /degree/nucleon, and the absolute and fractional cross section uncertainties
Bin edges (degree)
Abs. Unc.
Frac. Stat. Unc.
Frac. Sys. Unc.
Frac. Flux Unc.
0-2
69.93
21.86
0.297
0.096
0.034
2-3
293.81
74.18
0.226
0.113
0.033
3-4
232.51
71.15
0.268
0.147
0.033
4-5
243.12
83.24
0.275
0.204
0.037
5-6
104.44
64.79
0.510
0.353
0.046
6-8
165.82
82.86
0.411
0.285
0.039
8-10
272.11
109.74
0.346
0.207
0.035
10-13
210.36
91.15
0.384
0.202
0.039
Table Supp.XXXIII: Statistical covariance matrix of measured cross section as function of on carbon, in units of /degree/nucleon
Bin edges (degree)
0-2
2-3
3-4
4-5
5-6
6-8
8-10
10-13
0-2
432.545
-42.190
-60.428
-10.381
0.256
0.206
-2.325
-2.718
2-3
-42.190
4402.124
227.802
-355.022
-55.531
-0.703
-21.100
-2.610
3-4
-60.428
227.802
3889.313
556.447
-267.531
-59.679
-5.042
-9.166
4-5
-10.381
-355.022
556.447
4479.508
604.254
-323.825
-38.103
3.448
5-6
0.256
-55.531
-267.531
604.254
2836.385
323.719
-183.679
-8.398
6-8
0.206
-0.703
-59.679
-323.825
323.719
4640.159
-126.552
-144.285
8-10
-2.325
-21.100
-5.042
-38.103
-183.679
-126.552
8881.099
-343.995
10-13
-2.718
-2.610
-9.166
3.448
-8.398
-144.285
-343.995
6510.178
Table Supp.XXXIV: Systematic covariance matrix of measured cross section in on carbon, in units of /degree/nucleon
Bin edges (degree)
0-2
2-3
3-4
4-5
5-6
6-8
8-10
10-13
0-2
45.099
92.411
103.281
114.507
74.645
105.557
149.681
52.143
2-3
92.411
1100.609
841.832
1222.754
769.793
961.137
1118.738
1053.933
3-4
103.281
841.832
1172.797
1542.172
1062.769
1138.866
1384.286
1145.364
4-5
114.507
1222.754
1542.172
2449.024
1531.587
1737.054
2156.829
1604.998
5-6
74.645
769.793
1062.769
1531.587
1361.346
1240.504
1502.525
1102.167
6-8
105.557
961.137
1138.866
1737.054
1240.504
2226.414
1880.519
1195.813
8-10
149.681
1118.738
1384.286
2156.829
1502.525
1880.519
3161.621
1418.018
10-13
52.143
1053.933
1145.364
1604.998
1102.167
1195.813
1418.018
1798.854
Table Supp.XXXV: Measured cross section as function of on carbon, in units of /GeV/c/nucleon, and the absolute and fractional cross section uncertainties
Bin edges (GeV/c)
Abs. Unc.
Frac. Stat. Unc.
Frac. Sys. Unc.
Frac. Flux Unc.
1.5-3.0
142.81
54.37
0.353
0.142
0.038
3.0-4.0
414.13
100.15
0.207
0.125
0.037
4.0-5.0
495.24
120.33
0.181
0.162
0.039
5.0-6.0
470.54
113.51
0.174
0.167
0.038
6.0-7.0
316.82
84.97
0.193
0.186
0.037
7.0-8.5
131.56
43.90
0.258
0.211
0.038
8.5-10.0
36.08
16.51
0.370
0.270
0.041
10.0-20.0
11.27
5.74
0.446
0.247
0.038
Table Supp.XXXVI: Statistical covariance matrix of measured cross section as function of on carbon, in units of /GeV/c/nucleon
Bin edges (GeV/c)
1.5-3.0
3.0-4.0
4.0-5.0
5.0-6.0
6.0-7.0
7.0-8.5
8.5-10.0
10.0-20.0
1.5-3.0
2545.244
728.621
120.277
77.608
72.794
19.444
1.364
1.702
3.0-4.0
728.621
7370.998
1832.106
356.992
93.965
8.392
0.052
0.000
4.0-5.0
120.277
1832.106
8057.985
2544.775
374.057
53.227
7.161
0.000
5.0-6.0
77.608
356.992
2544.775
6684.440
2431.505
348.631
58.569
4.882
6.0-7.0
72.794
93.965
374.057
2431.505
3735.052
1088.284
140.039
33.362
7.0-8.5
19.444
8.392
53.227
348.631
1088.284
1156.326
260.739
15.362
8.5-10.0
1.364
0.052
7.161
58.569
140.039
260.739
177.793
22.270
10.0-20.0
1.702
0.000
0.000
4.882
33.362
15.362
22.270
25.211
Table Supp.XXXVII: Systematic covariance matrix of measured cross section in on carbon, in units of /GeV/c/nucleon
Bin edges (GeV/c)
1.5-3.0
3.0-4.0
4.0-5.0
5.0-6.0
6.0-7.0
7.0-8.5
8.5-10.0
10.0-20.0
1.5-3.0
410.793
807.898
1244.792
1207.063
865.339
222.378
85.770
40.987
3.0-4.0
807.898
2659.590
3370.825
3460.466
2460.014
783.208
264.051
103.430
4.0-5.0
1244.792
3370.825
6421.428
5800.897
4234.157
1488.178
408.526
149.058
5.0-6.0
1207.063
3460.466
5800.897
6199.385
4432.492
1594.078
488.891
166.781
6.0-7.0
865.339
2460.014
4234.157
4432.492
3484.686
1332.120
428.733
129.620
7.0-8.5
222.378
783.208
1488.178
1594.078
1332.120
770.937
239.169
44.936
8.5-10.0
85.770
264.051
408.526
488.891
428.733
239.169
94.943
18.573
10.0-20.0
40.987
103.430
149.058
166.781
129.620
44.936
18.573
7.764
Table Supp.XXXVIII: Measured cross section as function of on carbon, in units of /GeV/c/nucleon, and the absolute and fractional cross section uncertainties
Bin edges (GeV/c)
Abs. Unc.
Frac. Stat. Unc.
Frac. Sys. Unc.
Frac. Flux Unc.
0.00-0.15
677.76
225.45
0.321
0.087
0.034
0.15-0.30
1738.89
427.93
0.225
0.100
0.034
0.30-0.45
3334.80
784.27
0.200
0.124
0.035
0.45-0.60
3255.16
968.88
0.227
0.193
0.037
0.60-0.75
2354.67
914.93
0.305
0.241
0.037
0.75-0.90
1095.46
966.59
0.687
0.554
0.049
0.90-1.25
732.87
537.65
0.581
0.448
0.048
1.25-2.50
41.20
64.42
1.409
0.678
0.036
Table Supp.XXXIX: Statistical covariance matrix of measured cross section as function of on carbon, in units of /GeV/c/nucleon
Bin edges (GeV/c)
0.00-0.15
0.15-0.30
0.30-0.45
0.45-0.60
0.60-0.75
0.75-0.90
0.90-1.25
1.25-2.50
0.00-0.15
47345.844
489.515
-9627.274
-1191.565
-50.835
695.864
-132.553
-2.979
0.15-0.30
489.515
152597.493
15878.159
-24434.942
-4415.122
-2630.600
-338.305
-26.218
0.30-0.45
-9627.274
15878.159
442805.481
56960.571
-47584.361
-18432.176
-3106.294
-512.456
0.45-0.60
-1191.565
-24434.942
56960.571
545345.745
82151.510
-38191.909
-22415.638
566.213
0.60-0.75
-50.835
-4415.122
-47584.361
82151.510
514382.100
160232.420
-4248.074
-2161.159
0.75-0.90
695.864
-2630.600
-18432.176
-38191.909
160232.420
565653.640
116267.363
-433.914
0.90-1.25
-132.553
-338.305
-3106.294
-22415.638
-4248.074
116267.363
181284.881
-260.193
1.25-2.50
-2.979
-26.218
-512.456
566.213
-2161.159
-433.914
-260.193
3369.229
Table Supp.XL: Systematic covariance matrix of measured cross section in on carbon, in units of /GeV/c/nucleon
Bin edges (GeV/c)
0.00-0.15
0.15-0.30
0.30-0.45
0.45-0.60
0.60-0.75
0.75-0.90
0.90-1.25
1.25-2.50
0.00-0.15
3483.817
7652.058
8866.626
10183.622
11849.515
6912.592
2468.776
265.614
0.15-0.30
7652.058
30530.330
51863.562
66554.567
71581.100
50684.480
18484.932
1839.939
0.30-0.45
8866.626
51863.562
172270.470
234351.239
208147.109
144317.649
56989.645
6228.014
0.45-0.60
10183.622
66554.567
234351.239
393376.163
322202.135
212486.586
91525.906
9190.991
0.60-0.75
11849.515
71581.100
208147.109
322202.135
322712.829
223779.297
80646.181
9352.017
0.75-0.90
6912.592
50684.480
144317.649
212486.586
223779.297
368643.495
152778.165
12440.530
0.90-1.25
2468.776
18484.932
56989.645
91525.906
80646.181
152778.165
107781.804
5769.398
1.25-2.50
265.614
1839.939
6228.014
9190.991
9352.017
12440.530
5769.398
780.369
Table Supp.XLI: Measured cross section as function of on carbon, in units of /GeV/nucleon, and the absolute and fractional cross section uncertainties
Bin edges (GeV)
Abs. Unc.
Frac. Stat. Unc.
Frac. Sys. Unc.
Frac. Flux Unc.
0.000-0.025
4110.92
1313.92
0.309
0.082
0.034
0.025-0.050
3738.85
1125.78
0.289
0.086
0.035
0.050-0.100
3372.90
968.01
0.257
0.127
0.033
0.100-0.200
4499.60
1037.27
0.198
0.119
0.035
0.200-0.300
2654.05
855.20
0.271
0.175
0.036
0.300-0.400
2401.01
861.33
0.280
0.224
0.039
0.400-0.500
1622.89
738.87
0.352
0.289
0.042
0.500-0.700
934.89
545.84
0.465
0.353
0.040
0.700-1.000
786.73
497.09
0.515
0.366
0.039
1.000-1.300
508.34
308.25
0.541
0.274
0.040
1.300-2.000
104.02
162.03
1.255
0.923
0.059
2.000-3.000
43.44
76.15
1.619
0.673
0.050
Table Supp.XLII: Statistical covariance matrix of measured cross section as function of on carbon, in units of /GeV/nucleon
Bin edges (GeV)
0.000-0.025
0.025-0.050
0.050-0.100
0.100-0.200
0.200-0.300
0.300-0.400
0.400-0.500
0.500-0.700
0.700-1.000
1.000-1.300
1.300-2.000
2.000-3.000
0.000-0.025
1612047.844
133164.747
-109292.560
-38037.712
-210.854
-289.388
-431.586
-381.587
1410.826
-116.093
-134.401
-15.298
0.025-0.050
133164.747
1163631.354
296929.122
-89658.591
-29868.450
-4855.439
-2137.794
-1577.626
-2178.074
-485.529
-223.131
12.313
0.050-0.100
-109292.560
296929.122
753462.588
147506.891
-58070.191
-21930.282
-6742.827
-1558.373
317.631
-580.345
-609.480
-76.275
0.100-0.200
-38037.712
-89658.591
147506.891
790275.558
111043.502
-56840.469
-38915.673
-5121.184
-3538.403
-2738.221
-473.804
-314.496
0.200-0.300
-210.854
-29868.450
-58070.191
111043.502
516648.021
193831.617
-9914.202
-26131.027
-9527.948
-4605.887
-2429.364
-225.566
0.300-0.400
-289.388
-4855.439
-21930.282
-56840.469
193831.617
453257.205
226912.682
727.533
-25604.708
-10358.162
2497.816
-92.988
0.400-0.500
-431.586
-2137.794
-6742.827
-38915.673
-9914.202
226912.682
325672.916
114465.431
-2753.532
-9681.002
-1603.063
-511.652
0.500-0.700
-381.587
-1577.626
-1558.373
-5121.184
-26131.027
727.533
114465.431
188992.547
64966.679
-2230.532
-223.786
-666.490
0.700-1.000
1410.826
-2178.074
317.631
-3538.403
-9527.948
-25604.708
-2753.532
64966.679
163968.352
51804.379
591.175
-1196.626
1.000-1.300
-116.093
-485.529
-580.345
-2738.221
-4605.887
-10358.162
-9681.002
-2230.532
51804.379
75645.608
8609.031
-672.953
1.300-2.000
-134.401
-223.131
-609.480
-473.804
-2429.364
2497.816
-1603.063
-223.786
591.175
8609.031
17036.574
2099.067
2.000-3.000
-15.298
12.313
-76.275
-314.496
-225.566
-92.988
-511.652
-666.490
-1196.626
-672.953
2099.067
4943.006
Table Supp.XLIII: Systematic covariance matrix of measured cross section in on carbon, in units of /GeV/nucleon
Bin edges (GeV)
0.000-0.025
0.025-0.050
0.050-0.100
0.100-0.200
0.200-0.300
0.300-0.400
0.400-0.500
0.500-0.700
0.700-1.000
1.000-1.300
1.300-2.000
2.000-3.000
0.000-0.025
114340.749
63203.907
97883.668
69702.441
50788.032
44606.610
50119.145
27594.492
15002.767
9359.854
2927.239
1444.850
0.025-0.050
63203.907
103757.689
84392.474
109039.744
61996.950
53071.693
63755.278
53044.149
28270.909
14167.656
3437.170
2164.095
0.050-0.100
97883.668
84392.474
183575.702
170724.672
142519.813
153118.040
139533.540
99833.908
67543.256
30334.664
12124.226
4509.597
0.100-0.200
69702.441
109039.744
170724.672
285646.828
223066.738
226804.698
203762.849
146664.829
78950.233
38488.714
19109.338
6346.318
0.200-0.300
50788.032
61996.950
142519.813
223066.738
214718.388
225859.884
194853.625
120137.142
64661.826
32947.723
16705.759
4606.379
0.300-0.400
44606.610
53071.693
153118.040
226804.698
225859.884
288638.745
230674.942
132653.732
72541.441
34292.653
21857.936
5416.617
0.400-0.500
50119.145
63755.278
139533.540
203762.849
194853.625
230674.942
220250.698
124449.181
63894.843
32171.484
19459.809
5250.944
0.500-0.700
27594.492
53044.149
99833.908
146664.829
120137.142
132653.732
124449.181
108949.639
72984.339
34427.668
17917.460
5931.924
0.700-1.000
15002.767
28270.909
67543.256
78950.233
64661.826
72541.441
63894.843
72984.339
83134.974
34268.597
17608.447
5894.400
1.000-1.300
9359.854
14167.656
30334.664
38488.714
32947.723
34292.653
32171.484
34427.668
34268.597
19372.429
10260.940
3053.558
1.300-2.000
2927.239
3437.170
12124.226
19109.338
16705.759
21857.936
19459.809
17917.460
17608.447
10260.940
9218.640
1777.178
2.000-3.000
1444.850
2164.095
4509.597
6346.318
4606.379
5416.617
5250.944
5931.924
5894.400
3053.558
1777.178
855.347
Table Supp.XLIV: Measured cross section as function of on carbon, in units of /GeV/c2/nucleon, and the absolute and fractional cross section uncertainties
Bin edges (GeV/c2)
Abs. Unc.
Frac. Stat. Unc.
Frac. Sys. Unc.
Frac. Flux Unc.
0.9-1.1
935.92
613.41
0.627
0.191
0.043
1.1-1.2
5238.76
1031.06
0.175
0.091
0.036
1.2-1.3
8434.70
2309.31
0.200
0.187
0.033
1.3-1.4
4744.74
3791.22
0.529
0.599
0.033
Table Supp.XLV: Statistical covariance matrix of measured cross section as function of on carbon, in units of /GeV/c2/nucleon
Bin edges (GeV/c2)
0.9-1.1
1.1-1.2
1.2-1.3
1.3-1.4
0.9-1.1
344280.921
-5955.534
-433736.932
-328835.505
1.1-1.2
-5955.534
837000.556
82998.926
-910335.711
1.2-1.3
-433736.932
82998.926
2848202.794
1532250.771
1.3-1.4
-328835.505
-910335.711
1532250.771
6306221.739
Table Supp.XLVI: Systematic covariance matrix of measured cross section in on carbon, in units of /GeV/c2/nucleon
Bin edges (GeV/c2)
0.9-1.1
1.1-1.2
1.2-1.3
1.3-1.4
0.9-1.1
31991.340
34754.971
26908.976
39260.342
1.1-1.2
34754.971
226074.839
269792.794
290485.892
1.2-1.3
26908.976
269792.794
2484692.008
4127535.293
1.3-1.4
39260.342
290485.892
4127535.293
8067146.466
Table Supp.XLVII: Measured cross section as function of on carbon, in units of /GeV/nucleon, and the absolute and fractional cross section uncertainties
Bin edges (GeV)
Abs. Unc.
Frac. Stat. Unc.
Frac. Sys. Unc.
Frac. Flux Unc.
0.035-0.100
11544.77
2671.16
0.176
0.151
0.036
0.100-0.150
9366.27
1783.83
0.132
0.137
0.034
0.150-0.200
5705.08
1763.73
0.226
0.211
0.033
0.200-0.350
2730.47
1583.72
0.425
0.394
0.040
Table Supp.XLVIII: Statistical covariance matrix of measured cross section as function of on carbon, in units of /GeV/nucleon
Bin edges (GeV)
0.035-0.100
0.100-0.150
0.150-0.200
0.200-0.350
0.035-0.100
4110120.545
450633.521
-366102.636
-6362.214
0.100-0.150
450633.521
1529252.308
596865.376
246606.388
0.150-0.200
-366102.636
596865.376
1657591.298
826260.188
0.200-0.350
-6362.214
246606.388
826260.188
1349320.553
Table Supp.XLIX: Systematic covariance matrix of measured cross section in on carbon, in units of /GeV/nucleon
Bin edges (GeV)
0.035-0.100
0.100-0.150
0.150-0.200
0.200-0.350
0.035-0.100
3024981.510
1978891.970
1702989.640
1319045.699
0.100-0.150
1978891.970
1652801.001
1398786.930
954689.298
0.150-0.200
1702989.640
1398786.930
1453140.559
1071815.858
0.200-0.350
1319045.699
954689.298
1071815.858
1158852.632
Table Supp.L: Measured cross section as function of on carbon, in units of /degree/nucleon, and the absolute and fractional cross section uncertainties
Bin edges (degree)
Abs. Unc.
Frac. Stat. Unc.
Frac. Sys. Unc.
Frac. Flux Unc.
0-10
3.68
5.99
1.483
0.671
0.045
10-20
9.04
6.38
0.627
0.325
0.040
20-30
14.15
5.91
0.339
0.244
0.035
30-40
16.26
5.52
0.279
0.194
0.037
40-50
21.86
6.14
0.228
0.163
0.036
50-60
18.12
5.63
0.256
0.176
0.034
60-120
17.45
4.32
0.207
0.135
0.035
120-135
9.75
3.15
0.291
0.141
0.033
135-150
8.14
2.79
0.310
0.146
0.033
150-165
5.01
3.21
0.556
0.319
0.039
165-180
1.05
0.91
0.768
0.395
0.036
Table Supp.LI: Statistical covariance matrix of measured cross section as function of on carbon, in units of /degree/nucleon
Bin edges (degree)
0-10
10-20
20-30
30-40
40-50
50-60
60-120
120-135
135-150
150-165
165-180
0-10
29.766
12.455
4.832
-1.353
2.463
-0.442
-0.606
-0.302
-0.460
-0.539
0.102
10-20
12.455
32.119
11.299
-0.769
-0.780
-1.218
-0.439
0.010
-0.135
0.286
2.196
20-30
4.832
11.299
23.034
5.013
-1.963
-1.259
-0.814
-0.799
-0.565
0.421
0.728
30-40
-1.353
-0.769
5.013
20.496
7.417
-0.553
-0.845
-0.311
0.136
-0.222
-0.201
40-50
2.463
-0.780
-1.963
7.417
24.897
6.425
-0.456
-0.672
-0.583
-1.089
-0.313
50-60
-0.442
-1.218
-1.259
-0.553
6.425
21.543
4.262
-0.433
-0.423
-0.570
-0.167
60-120
-0.606
-0.439
-0.814
-0.845
-0.456
4.262
13.098
1.406
-0.111
-0.194
-0.021
120-135
-0.302
0.010
-0.799
-0.311
-0.672
-0.433
1.406
8.040
1.280
0.071
0.060
135-150
-0.460
-0.135
-0.565
0.136
-0.583
-0.423
-0.111
1.280
6.378
4.357
0.394
150-165
-0.539
0.286
0.421
-0.222
-1.089
-0.570
-0.194
0.071
4.357
7.762
0.096
165-180
0.102
2.196
0.728
-0.201
-0.313
-0.167
-0.021
0.060
0.394
0.096
0.653
Table Supp.LII: Systematic covariance matrix of measured cross section in on carbon, in units of /degree/nucleon
Bin edges (degree)
0-10
10-20
20-30
30-40
40-50
50-60
60-120
120-135
135-150
150-165
165-180
0-10
6.099
2.112
3.025
2.738
2.224
2.087
1.429
1.276
1.283
1.506
0.034
10-20
2.112
8.617
9.250
7.393
8.503
7.705
4.256
2.782
2.277
1.852
0.710
20-30
3.025
9.250
11.938
9.913
10.228
8.821
5.209
3.110
2.750
1.823
0.670
30-40
2.738
7.393
9.913
9.939
8.952
7.789
4.739
2.801
2.587
1.857
0.574
40-50
2.224
8.503
10.228
8.952
12.744
10.942
6.933
3.974
3.154
1.512
0.677
50-60
2.087
7.705
8.821
7.789
10.942
10.147
6.381
3.840
2.837
1.708
0.712
60-120
1.429
4.256
5.209
4.739
6.933
6.381
5.548
2.655
1.714
0.957
0.559
120-135
1.276
2.782
3.110
2.801
3.974
3.840
2.655
1.883
1.275
1.207
0.335
135-150
1.283
2.277
2.750
2.587
3.154
2.837
1.714
1.275
1.417
0.745
0.186
150-165
1.506
1.852
1.823
1.857
1.512
1.708
0.957
1.207
0.745
2.546
0.259
165-180
0.034
0.710
0.670
0.574
0.677
0.712
0.559
0.335
0.186
0.259
0.173
Table Supp.LIII: Measured cross section as function of on water, in units of /GeV/c/nucleon, and the absolute and fractional cross section uncertainties
Bin edges (GeV/c)
Abs. Unc.
Frac. Stat. Unc.
Frac. Sys. Unc.
Frac. Flux Unc.
1.5-3.0
117.95
52.87
0.410
0.180
0.035
3.0-4.0
185.58
88.01
0.386
0.276
0.048
4.0-5.0
457.01
118.99
0.211
0.153
0.041
5.0-6.0
476.40
113.68
0.187
0.148
0.037
6.0-7.0
340.82
84.27
0.207
0.135
0.035
7.0-8.5
162.09
46.27
0.233
0.165
0.032
8.5-10.0
46.21
16.77
0.317
0.176
0.031
10.0-20.0
6.09
2.91
0.438
0.192
0.037
Table Supp.LIV: Statistical covariance matrix of measured cross section as function of on water, in units of /GeV/c/nucleon
Bin edges (GeV/c)
1.5-3.0
3.0-4.0
4.0-5.0
5.0-6.0
6.0-7.0
7.0-8.5
8.5-10.0
10.0-20.0
1.5-3.0
2344.004
445.008
69.019
37.629
28.309
10.974
8.907
0.011
3.0-4.0
445.008
5127.450
2079.943
557.499
60.656
35.261
3.708
1.132
4.0-5.0
69.019
2079.943
9264.813
3453.632
698.630
141.989
30.908
2.745
5.0-6.0
37.629
557.499
3453.632
7926.040
3136.162
481.482
55.213
7.682
6.0-7.0
28.309
60.656
698.630
3136.162
4992.546
1267.690
85.475
1.391
7.0-8.5
10.974
35.261
141.989
481.482
1267.690
1425.398
217.459
10.233
8.5-10.0
8.907
3.708
30.908
55.213
85.475
217.459
215.068
20.762
10.0-20.0
0.011
1.132
2.745
7.682
1.391
10.233
20.762
7.127
Table Supp.LV: Systematic covariance matrix of measured cross section in on water, in units of /GeV/c/nucleon
Bin edges (GeV/c)
1.5-3.0
3.0-4.0
4.0-5.0
5.0-6.0
6.0-7.0
7.0-8.5
8.5-10.0
10.0-20.0
1.5-3.0
451.412
564.022
898.038
799.031
682.157
419.447
119.619
9.347
3.0-4.0
564.022
2619.122
2753.930
2802.366
1580.375
770.858
208.530
26.336
4.0-5.0
898.038
2753.930
4893.632
4338.470
2681.647
1244.144
288.103
47.295
5.0-6.0
799.031
2802.366
4338.470
4998.182
2697.240
1079.987
305.276
52.912
6.0-7.0
682.157
1580.375
2681.647
2697.240
2109.131
974.516
247.648
36.237
7.0-8.5
419.447
770.858
1244.144
1079.987
974.516
715.744
182.693
18.250
8.5-10.0
119.619
208.530
288.103
305.276
247.648
182.693
66.308
4.025
10.0-20.0
9.347
26.336
47.295
52.912
36.237
18.250
4.025
1.361
Table Supp.LVI: Measured cross section as function of on water, in units of /degree/nucleon, and the absolute and fractional cross section uncertainties
Bin edges (degree)
Abs. Unc.
Frac. Stat. Unc.
Frac. Sys. Unc.
Frac. Flux Unc.
0-2
63.72
18.14
0.260
0.117
0.031
2-3
217.48
63.11
0.271
0.103
0.035
3-4
246.44
72.74
0.267
0.125
0.033
4-5
207.57
88.04
0.382
0.184
0.034
5-6
136.66
83.70
0.536
0.296
0.037
6-8
236.70
102.60
0.366
0.233
0.040
8-10
290.88
114.06
0.340
0.195
0.039
10-13
14.67
57.44
3.399
1.945
0.181
Table Supp.LVII: Statistical covariance matrix of measured cross section as function of on water, in units of /degree/nucleon
Bin edges (degree)
0-2
2-3
3-4
4-5
5-6
6-8
8-10
10-13
0-2
273.470
54.585
-101.543
-17.484
-0.727
-4.685
-0.455
0.011
2-3
54.585
3478.295
496.736
-513.517
-80.607
-13.769
-12.044
0.139
3-4
-101.543
496.736
4336.745
942.105
-394.960
-115.405
5.655
0.149
4-5
-17.484
-513.517
942.105
6294.647
1188.026
-463.504
-39.117
0.892
5-6
-0.727
-80.607
-394.960
1188.026
5373.660
607.700
-342.608
-2.822
6-8
-4.685
-13.769
-115.405
-463.504
607.700
7487.508
-398.111
-72.215
8-10
-0.455
-12.044
5.655
-39.117
-342.608
-398.111
9799.885
587.996
10-13
0.011
0.139
0.149
0.892
-2.822
-72.215
587.996
2485.525
Table Supp.LVIII: Systematic covariance matrix of measured cross section in on water, in units of /degree/nucleon
Bin edges (degree)
0-2
2-3
3-4
4-5
5-6
6-8
8-10
10-13
0-2
55.609
108.738
139.883
81.848
35.719
28.759
40.840
-6.741
2-3
108.738
504.494
552.733
601.157
570.449
631.701
410.197
287.381
3-4
139.883
552.733
954.832
802.914
660.357
1116.479
944.109
450.452
4-5
81.848
601.157
802.914
1456.929
1320.732
1478.837
1299.382
751.433
5-6
35.719
570.449
660.357
1320.732
1632.620
1328.831
1269.663
881.853
6-8
28.759
631.701
1116.479
1478.837
1328.831
3040.213
1943.068
1180.314
8-10
40.840
410.197
944.109
1299.382
1269.663
1943.068
3209.779
1043.855
10-13
-6.741
287.381
450.452
751.433
881.853
1180.314
1043.855
814.089
Table Supp.LIX: Measured cross section as function of on water, in units of /GeV/c/nucleon, and the absolute and fractional cross section uncertainties
Bin edges (GeV/c)
Abs. Unc.
Frac. Stat. Unc.
Frac. Sys. Unc.
Frac. Flux Unc.
1.5-3.0
136.29
60.24
0.389
0.210
0.035
3.0-4.0
209.53
91.74
0.357
0.253
0.046
4.0-5.0
467.09
122.37
0.211
0.155
0.041
5.0-6.0
454.55
110.72
0.192
0.149
0.037
6.0-7.0
332.04
82.82
0.211
0.134
0.034
7.0-8.5
150.87
44.38
0.239
0.171
0.032
8.5-10.0
44.53
16.29
0.319
0.180
0.031
10.0-20.0
6.13
2.91
0.436
0.189
0.037
Table Supp.LX: Statistical covariance matrix of measured cross section as function of on water, in units of /GeV/c/nucleon
Bin edges (GeV/c)
1.5-3.0
3.0-4.0
4.0-5.0
5.0-6.0
6.0-7.0
7.0-8.5
8.5-10.0
10.0-20.0
1.5-3.0
2806.437
504.890
73.486
37.165
29.685
10.703
9.867
0.011
3.0-4.0
504.890
5594.629
2192.711
520.469
52.881
35.865
3.809
1.132
4.0-5.0
73.486
2192.711
9743.624
3427.026
667.524
136.501
30.407
2.822
5.0-6.0
37.165
520.469
3427.026
7644.453
2938.764
447.993
53.709
7.692
6.0-7.0
29.685
52.881
667.524
2938.764
4887.686
1195.760
81.566
1.344
7.0-8.5
10.703
35.865
136.501
447.993
1195.760
1302.963
209.148
9.855
8.5-10.0
9.867
3.809
30.407
53.709
81.566
209.148
201.152
20.494
10.0-20.0
0.011
1.132
2.822
7.692
1.344
9.855
20.494
7.146
Table Supp.LXI: Systematic covariance matrix of measured cross section in on water, in units of /GeV/c/nucleon
Bin edges (GeV/c)
1.5-3.0
3.0-4.0
4.0-5.0
5.0-6.0
6.0-7.0
7.0-8.5
8.5-10.0
10.0-20.0
1.5-3.0
822.289
462.724
1028.704
801.765
665.651
470.679
127.720
9.731
3.0-4.0
462.724
2820.764
2891.273
2824.462
1605.847
795.496
223.430
27.984
4.0-5.0
1028.704
2891.273
5230.407
4401.956
2668.438
1195.644
289.928
49.303
5.0-6.0
801.765
2824.462
4401.956
4615.427
2549.872
1005.696
294.413
50.238
6.0-7.0
665.651
1605.847
2668.438
2549.872
1972.173
891.953
230.546
34.929
7.0-8.5
470.679
795.496
1195.644
1005.696
891.953
666.928
168.923
17.475
8.5-10.0
127.720
223.430
289.928
294.413
230.546
168.923
64.052
3.808
10.0-20.0
9.731
27.984
49.303
50.238
34.929
17.475
3.808
1.345
Table Supp.LXII: Measured cross section as function of on water, in units of /GeV/c/nucleon, and the absolute and fractional cross section uncertainties
Bin edges (GeV/c)
Abs. Unc.
Frac. Stat. Unc.
Frac. Sys. Unc.
Frac. Flux Unc.
0.00-0.15
427.07
156.83
0.350
0.110
0.031
0.15-0.30
1552.75
434.21
0.252
0.122
0.030
0.30-0.45
3698.80
892.81
0.212
0.115
0.035
0.45-0.60
3113.42
1107.87
0.288
0.209
0.035
0.60-0.75
762.06
764.44
0.739
0.678
0.047
0.75-0.90
2313.61
1115.44
0.419
0.239
0.032
0.90-1.25
1015.62
585.68
0.541
0.201
0.038
1.25-2.50
61.79
101.64
0.926
1.360
0.066
Table Supp.LXIII: Statistical covariance matrix of measured cross section as function of on water, in units of /GeV/c/nucleon
Bin edges (GeV/c)
0.00-0.15
0.15-0.30
0.30-0.45
0.45-0.60
0.60-0.75
0.75-0.90
0.90-1.25
1.25-2.50
0.00-0.15
22384.290
309.360
-7344.185
-1230.080
-94.202
-98.135
-6.266
1.649
0.15-0.30
309.360
152790.960
14256.803
-30091.672
-6430.353
-2133.393
-3061.313
-32.386
0.30-0.45
-7344.185
14256.803
617215.664
92003.011
-20825.426
-38780.595
-3925.249
-1075.423
0.45-0.60
-1230.080
-30091.672
92003.011
805716.499
171697.794
-44210.017
-7286.457
778.975
0.60-0.75
-94.202
-6430.353
-20825.426
171697.794
317423.898
241253.824
4577.656
-1266.640
0.75-0.90
-98.135
-2133.393
-38780.595
-44210.017
241253.824
938404.156
35594.495
-1501.990
0.90-1.25
-6.266
-3061.313
-3925.249
-7286.457
4577.656
35594.495
301365.386
99.880
1.25-2.50
1.649
-32.386
-1075.423
778.975
-1266.640
-1501.990
99.880
3273.325
Table Supp.LXIV: Systematic covariance matrix of measured cross section in on water, in units of /GeV/c/nucleon
Bin edges (GeV/c)
0.00-0.15
0.15-0.30
0.30-0.45
0.45-0.60
0.60-0.75
0.75-0.90
0.90-1.25
1.25-2.50
0.00-0.15
2212.331
7014.185
6289.850
3963.270
-1784.760
340.915
597.445
-91.941
0.15-0.30
7014.185
35749.178
50405.043
58067.522
33792.236
35975.418
6890.791
1602.846
0.30-0.45
6289.850
50405.043
179890.379
203145.934
115557.035
120354.622
27245.951
10487.937
0.45-0.60
3963.270
58067.522
203145.934
421666.486
253933.394
248251.930
32377.946
25258.683
0.60-0.75
-1784.760
33792.236
115557.035
253933.394
266938.915
244228.251
45765.171
16013.665
0.75-0.90
340.915
35975.418
120354.622
248251.930
244228.251
305802.129
47834.834
14707.867
0.90-1.25
597.445
6890.791
27245.951
32377.946
45765.171
47834.834
41657.051
893.402
1.25-2.50
-91.941
1602.846
10487.937
25258.683
16013.665
14707.867
893.402
7058.065
Table Supp.LXV: Measured cross section as function of on water, in units of /GeV/nucleon, and the absolute and fractional cross section uncertainties
Bin edges (GeV)
Abs. Unc.
Frac. Stat. Unc.
Frac. Sys. Unc.
Frac. Flux Unc.
0.000-0.025
2480.15
898.11
0.346
0.106
0.031
0.025-0.050
2698.62
1003.28
0.330
0.171
0.033
0.050-0.100
3608.06
1040.14
0.268
0.106
0.028
0.100-0.200
4573.34
1179.68
0.224
0.127
0.034
0.200-0.300
3545.20
1057.43
0.253
0.158
0.034
0.300-1.300
638.77
323.90
0.375
0.341
0.038
1.300-2.000
563.66
378.38
0.613
0.275
0.035
2.000-3.000
60.16
107.17
0.885
1.546
0.072
Table Supp.LXVI: Statistical covariance matrix of measured cross section as function of on water, in units of /GeV/nucleon
Bin edges (GeV)
0.000-0.025
0.025-0.050
0.050-0.100
0.100-0.200
0.200-0.300
0.300-1.300
1.300-2.000
2.000-3.000
0.000-0.025
737910.311
134711.025
-89360.998
-31088.514
-2618.557
-324.926
-0.770
-1.189
0.025-0.050
134711.025
793841.706
333689.764
-89325.086
-44223.884
-952.144
-494.547
-5.120
0.050-0.100
-89360.998
333689.764
936646.336
126010.540
-86362.695
-7058.249
-2918.545
-90.130
0.100-0.200
-31088.514
-89325.086
126010.540
1051659.826
307358.275
-24755.356
-6781.373
-690.978
0.200-0.300
-2618.557
-44223.884
-86362.695
307358.275
803030.467
25543.239
-13033.818
172.523
0.300-1.300
-324.926
-952.144
-7058.249
-24755.356
25543.239
57416.252
1624.192
-345.051
1.300-2.000
-0.770
-494.547
-2918.545
-6781.373
-13033.818
1624.192
119223.261
93.238
2.000-3.000
-1.189
-5.120
-90.130
-690.978
172.523
-345.051
93.238
2834.882
Table Supp.LXVII: Systematic covariance matrix of measured cross section in on water, in units of /GeV/nucleon
Bin edges (GeV)
0.000-0.025
0.025-0.050
0.050-0.100
0.100-0.200
0.200-0.300
0.300-1.300
1.300-2.000
2.000-3.000
0.000-0.025
68685.777
99092.605
67287.625
59917.695
30844.096
-1265.600
8783.647
-575.413
0.025-0.050
99092.605
212727.324
129946.537
151239.000
86775.289
14457.069
1406.976
-268.952
0.050-0.100
67287.625
129946.537
145254.442
131364.523
127635.806
43360.984
15481.951
5821.559
0.100-0.200
59917.695
151239.000
131364.523
339983.217
241123.764
58008.934
7571.832
14480.329
0.200-0.300
30844.096
86775.289
127635.806
241123.764
315118.422
84308.069
15162.848
18844.419
0.300-1.300
-1265.600
14457.069
43360.984
58008.934
84308.069
47496.488
14950.425
7426.101
1.300-2.000
8783.647
1406.976
15481.951
7571.832
15162.848
14950.425
23946.121
3237.185
2.000-3.000
-575.413
-268.952
5821.559
14480.329
18844.419
7426.101
3237.185
8651.566
Table Supp.LXVIII: Measured cross section as function of on water, in units of /GeV/c2/nucleon, and the absolute and fractional cross section uncertainties
Bin edges (GeV/c2)
Abs. Unc.
Frac. Stat. Unc.
Frac. Sys. Unc.
Frac. Flux Unc.
0.9-1.1
1604.24
1413.62
0.847
0.242
0.037
1.1-1.2
7771.74
1887.69
0.206
0.129
0.034
1.2-1.3
5069.96
2456.47
0.368
0.315
0.033
1.3-1.4
1635.65
1510.53
0.665
0.641
0.035
Table Supp.LXIX: Statistical covariance matrix of measured cross section as function of on water, in units of /GeV/c2/nucleon
Bin edges (GeV/c2)
0.9-1.1
1.1-1.2
1.2-1.3
1.3-1.4
0.9-1.1
1847344.362
-656709.599
-543616.547
-214453.239
1.1-1.2
-656709.599
2563274.464
-922303.488
-458316.063
1.2-1.3
-543616.547
-922303.488
3484780.550
1620816.512
1.3-1.4
-214453.239
-458316.063
1620816.512
1183090.426
Table Supp.LXX: Systematic covariance matrix of measured cross section in on water, in units of /GeV/c2/nucleon
Bin edges (GeV/c2)
0.9-1.1
1.1-1.2
1.2-1.3
1.3-1.4
0.9-1.1
150974.241
50687.062
58336.608
39527.718
1.1-1.2
50687.062
1000092.261
133191.537
-6137.137
1.2-1.3
58336.608
133191.537
2549465.255
1600707.642
1.3-1.4
39527.718
-6137.137
1600707.642
1098601.315
Table Supp.LXXI: Measured cross section as function of on water, in units of /GeV/nucleon, and the absolute and fractional cross section uncertainties
Bin edges (GeV)
Abs. Unc.
Frac. Stat. Unc.
Frac. Sys. Unc.
Frac. Flux Unc.
0.035-0.100
14951.68
3806.97
0.227
0.116
0.032
0.100-0.150
8200.70
1951.07
0.194
0.137
0.035
0.150-0.200
6207.98
1941.76
0.264
0.168
0.034
0.200-0.350
2966.39
1310.43
0.348
0.272
0.033
Table Supp.LXXII: Statistical covariance matrix of measured cross section as function of on water, in units of /GeV/nucleon
Bin edges (GeV)
0.035-0.100
0.100-0.150
0.150-0.200
0.200-0.350
0.035-0.100
11487318.614
868059.738
-673181.424
-199663.456
0.100-0.150
868059.738
2541618.601
323855.531
-105323.874
0.150-0.200
-673181.424
323855.531
2681915.718
246201.197
0.200-0.350
-199663.456
-105323.874
246201.197
1065321.825
Table Supp.LXXIII: Systematic covariance matrix of measured cross section in on water, in units of /GeV/nucleon
Bin edges (GeV)
0.035-0.100
0.100-0.150
0.150-0.200
0.200-0.350
0.035-0.100
3005725.726
1539098.927
915615.078
671957.761
0.100-0.150
1539098.927
1265067.788
828750.051
606538.898
0.150-0.200
915615.078
828750.051
1088524.206
692340.688
0.200-0.350
671957.761
606538.898
692340.688
651915.142
Table Supp.LXXIV: Measured cross section as function of on water, in units of /degree/nucleon, and the absolute and fractional cross section uncertainties
Bin edges (degree)
Abs. Unc.
Frac. Stat. Unc.
Frac. Sys. Unc.
Frac. Flux Unc.
0-10
3.73
3.47
0.897
0.251
0.036
10-20
6.29
3.35
0.480
0.232
0.032
20-30
11.59
4.24
0.306
0.201
0.037
30-40
13.14
5.19
0.324
0.227
0.035
40-50
19.07
5.60
0.258
0.139
0.032
50-60
31.04
8.12
0.241
0.101
0.033
60-120
20.46
6.10
0.279
0.106
0.035
120-135
10.15
5.48
0.502
0.198
0.035
135-150
7.81
3.50
0.428
0.134
0.029
150-165
2.83
2.64
0.851
0.380
0.030
165-180
0.34
0.50
1.418
0.484
0.036
Table Supp.LXXV: Statistical covariance matrix of measured cross section as function of on water, in units of /degree/nucleon
Bin edges (degree)
0-10
10-20
20-30
30-40
40-50
50-60
60-120
120-135
135-150
150-165
165-180
0-10
11.170
2.498
-1.025
0.144
-0.368
-0.392
-0.315
-0.144
-0.110
-0.033
0.073
10-20
2.498
9.112
2.790
-0.615
-0.690
0.290
-1.038
-0.391
0.180
-0.065
0.913
20-30
-1.025
2.790
12.590
2.532
-0.610
-1.929
-0.328
-0.119
-0.338
-0.210
-0.030
30-40
0.144
-0.615
2.532
18.112
4.371
-1.711
1.058
-1.156
-0.422
-0.142
-0.096
40-50
-0.368
-0.690
-0.610
4.371
24.296
7.335
0.049
-0.432
0.437
-0.855
-0.024
50-60
-0.392
0.290
-1.929
-1.711
7.335
55.983
12.473
-1.267
-2.303
-1.089
0.105
60-120
-0.315
-1.038
-0.328
1.058
0.049
12.473
32.466
2.691
0.102
0.512
-0.095
120-135
-0.144
-0.391
-0.119
-1.156
-0.432
-1.267
2.691
25.957
4.903
0.174
-0.033
135-150
-0.110
0.180
-0.338
-0.422
0.437
-2.303
0.102
4.903
11.147
4.975
0.011
150-165
-0.033
-0.065
-0.210
-0.142
-0.855
-1.089
0.512
0.174
4.975
5.814
-0.011
165-180
0.073
0.913
-0.030
-0.096
-0.024
0.105
-0.095
-0.033
0.011
-0.011
0.226
Table Supp.LXXVI: Systematic covariance matrix of measured cross section in on water, in units of /degree/nucleon
Bin edges (degree)
0-10
10-20
20-30
30-40
40-50
50-60
60-120
120-135
135-150
150-165
165-180
0-10
0.874
0.417
0.892
1.532
1.083
0.835
0.382
0.989
0.189
-0.067
0.056
10-20
0.417
2.131
2.779
2.292
2.270
2.104
1.702
1.130
0.512
0.455
0.120
20-30
0.892
2.779
5.418
4.935
4.810
4.863
3.200
2.073
1.203
1.039
0.166
30-40
1.532
2.292
4.935
8.866
6.480
4.936
3.897
1.623
1.690
0.872
0.117
40-50
1.083
2.270
4.810
6.480
7.040
6.230
4.455
2.552
1.932
1.482
0.155
50-60
0.835
2.104
4.863
4.936
6.230
9.898
4.975
3.563
1.863
2.035
0.116
60-120
0.382
1.702
3.200
3.897
4.455
4.975
4.694
1.217
1.618
1.141
0.036
120-135
0.989
1.130
2.073
1.623
2.552
3.563
1.217
4.038
0.640
0.662
0.127
135-150
0.189
0.512
1.203
1.690
1.932
1.863
1.618
0.640
1.099
0.818
-0.040
150-165
-0.067
0.455
1.039
0.872
1.482
2.035
1.141
0.662
0.818
1.159
-0.015
165-180
0.056
0.120
0.166
0.117
0.155
0.116
0.036
0.127
-0.040
-0.015
0.026
Table Supp.LXXVII: Measured cross section as function of on iron, in units of /GeV/c/nucleon, and the absolute and fractional cross section uncertainties
Bin edges (GeV/c)
Abs. Unc.
Frac. Stat. Unc.
Frac. Sys. Unc.
Frac. Flux Unc.
1.5-3.0
116.83
22.82
0.152
0.123
0.039
3.0-4.0
268.85
46.29
0.106
0.136
0.041
4.0-5.0
301.84
55.47
0.097
0.156
0.045
5.0-6.0
322.48
57.36
0.088
0.155
0.043
6.0-7.0
236.20
43.60
0.092
0.160
0.038
7.0-8.5
104.17
22.50
0.117
0.182
0.037
8.5-10.0
35.62
8.17
0.141
0.181
0.037
10.0-20.0
8.56
1.97
0.165
0.160
0.036
Table Supp.LXXVIII: Statistical covariance matrix of measured cross section as function of on iron, in units of /GeV/c/nucleon
Bin edges (GeV/c)
1.5-3.0
3.0-4.0
4.0-5.0
5.0-6.0
6.0-7.0
7.0-8.5
8.5-10.0
10.0-20.0
1.5-3.0
315.869
105.314
22.345
15.804
2.906
0.259
1.159
0.243
3.0-4.0
105.314
814.581
220.469
53.732
12.553
6.185
1.503
0.499
4.0-5.0
22.345
220.469
849.305
333.122
68.504
9.452
1.780
0.440
5.0-6.0
15.804
53.732
333.122
797.696
292.874
34.524
5.772
0.967
6.0-7.0
2.906
12.553
68.504
292.874
474.114
123.750
15.375
1.503
7.0-8.5
0.259
6.185
9.452
34.524
123.750
148.134
32.875
2.247
8.5-10.0
1.159
1.503
1.780
5.772
15.375
32.875
25.134
2.980
10.0-20.0
0.243
0.499
0.440
0.967
1.503
2.247
2.980
2.002
Table Supp.LXXIX: Systematic covariance matrix of measured cross section in on iron, in units of /GeV/c/nucleon
Bin edges (GeV/c)
1.5-3.0
3.0-4.0
4.0-5.0
5.0-6.0
6.0-7.0
7.0-8.5
8.5-10.0
10.0-20.0
1.5-3.0
205.057
411.198
522.643
525.671
357.844
147.293
50.865
11.924
3.0-4.0
411.198
1328.219
1622.646
1716.459
1223.345
569.854
192.684
40.675
4.0-5.0
522.643
1622.646
2228.071
2298.227
1665.093
757.015
247.266
52.499
5.0-6.0
525.671
1716.459
2298.227
2492.373
1826.680
857.130
280.167
59.245
6.0-7.0
357.844
1223.345
1665.093
1826.680
1426.702
679.134
220.834
47.548
7.0-8.5
147.293
569.854
757.015
857.130
679.134
358.258
117.038
23.759
8.5-10.0
50.865
192.684
247.266
280.167
220.834
117.038
41.591
8.067
10.0-20.0
11.924
40.675
52.499
59.245
47.548
23.759
8.067
1.888
Table Supp.LXXX: Measured cross section as function of on iron, in units of /degree/nucleon, and the absolute and fractional cross section uncertainties
Bin edges (degree)
Abs. Unc.
Frac. Stat. Unc.
Frac. Sys. Unc.
Frac. Flux Unc.
0-2
57.81
9.20
0.127
0.096
0.034
2-3
134.08
21.30
0.128
0.094
0.036
3-4
170.17
29.69
0.130
0.117
0.036
4-5
150.80
34.52
0.157
0.167
0.037
5-6
128.51
41.05
0.203
0.247
0.039
6-8
163.18
39.09
0.139
0.195
0.041
8-10
150.52
40.93
0.175
0.208
0.045
10-13
97.89
37.08
0.268
0.268
0.053
Table Supp.LXXXI: Statistical covariance matrix of measured cross section as function of on iron, in units of /degree/nucleon
Bin edges (degree)
0-2
2-3
3-4
4-5
5-6
6-8
8-10
10-13
0-2
54.038
1.548
-13.083
-2.225
0.045
0.009
-0.008
-0.560
2-3
1.548
294.722
47.593
-35.823
-9.843
-0.361
-0.634
-1.134
3-4
-13.083
47.593
486.432
77.132
-48.142
-8.617
-0.080
-1.852
4-5
-2.225
-35.823
77.132
560.801
117.294
-35.313
-5.619
0.001
5-6
0.045
-9.843
-48.142
117.294
680.720
38.411
-31.330
-1.575
6-8
0.009
-0.361
-8.617
-35.313
38.411
516.629
-8.166
-21.606
8-10
-0.008
-0.634
-0.080
-5.619
-31.330
-8.166
691.011
-15.851
10-13
-0.560
-1.134
-1.852
0.001
-1.575
-21.606
-15.851
687.894
Table Supp.LXXXII: Systematic covariance matrix of measured cross section in on iron, in units of /degree/nucleon
Bin edges (degree)
0-2
2-3
3-4
4-5
5-6
6-8
8-10
10-13
0-2
30.528
50.989
58.155
52.156
59.051
67.665
66.932
55.487
2-3
50.989
159.060
212.872
252.762
318.832
308.256
309.224
236.358
3-4
58.155
212.872
395.244
445.472
555.057
563.320
551.134
454.471
4-5
52.156
252.762
445.472
630.696
755.249
745.566
720.905
569.497
5-6
59.051
318.832
555.057
755.249
1004.354
944.544
929.399
724.968
6-8
67.665
308.256
563.320
745.566
944.544
1011.501
961.363
765.424
8-10
66.932
309.224
551.134
720.905
929.399
961.363
984.233
773.472
10-13
55.487
236.358
454.471
569.497
724.968
765.424
773.472
686.724
Table Supp.LXXXIII: Measured cross section as function of on iron, in units of /GeV/c/nucleon, and the absolute and fractional cross section uncertainties
Bin edges (GeV/c)
Abs. Unc.
Frac. Stat. Unc.
Frac. Sys. Unc.
Frac. Flux Unc.
1.5-3.0
114.93
23.86
0.160
0.133
0.040
3.0-4.0
285.09
47.81
0.103
0.132
0.041
4.0-5.0
300.20
55.34
0.097
0.157
0.045
5.0-6.0
315.62
56.79
0.089
0.156
0.043
6.0-7.0
232.29
42.91
0.092
0.160
0.038
7.0-8.5
102.57
22.26
0.116
0.183
0.037
8.5-10.0
34.29
7.68
0.143
0.172
0.037
10.0-20.0
8.70
1.97
0.164
0.156
0.036
Table Supp.LXXXIV: Statistical covariance matrix of measured cross section as function of on iron, in units of /GeV/c/nucleon
Bin edges (GeV/c)
1.5-3.0
3.0-4.0
4.0-5.0
5.0-6.0
6.0-7.0
7.0-8.5
8.5-10.0
10.0-20.0
1.5-3.0
336.966
105.591
21.222
16.807
2.719
0.226
1.198
0.310
3.0-4.0
105.591
860.377
225.133
54.398
11.506
5.621
1.457
0.513
4.0-5.0
21.222
225.133
852.767
332.012
69.832
9.101
1.624
0.369
5.0-6.0
16.807
54.398
332.012
789.184
285.431
34.752
6.190
0.965
6.0-7.0
2.719
11.506
69.832
285.431
456.056
120.873
15.158
1.557
7.0-8.5
0.226
5.621
9.101
34.752
120.873
142.721
30.721
2.031
8.5-10.0
1.198
1.457
1.624
6.190
15.158
30.721
24.113
2.917
10.0-20.0
0.310
0.513
0.369
0.965
1.557
2.031
2.917
2.045
Table Supp.LXXXV: Systematic covariance matrix of measured cross section in on iron, in units of /GeV/c/nucleon
Bin edges (GeV/c)
1.5-3.0
3.0-4.0
4.0-5.0
5.0-6.0
6.0-7.0
7.0-8.5
8.5-10.0
10.0-20.0
1.5-3.0
232.325
457.975
581.593
576.180
381.001
165.652
55.418
13.358
3.0-4.0
457.975
1425.191
1674.184
1767.028
1267.987
602.910
194.546
43.654
4.0-5.0
581.593
1674.184
2209.657
2242.767
1589.613
712.797
227.146
51.563
5.0-6.0
576.180
1767.028
2242.767
2435.665
1763.682
826.869
259.459
57.703
6.0-7.0
381.001
1267.987
1589.613
1763.682
1385.463
664.782
203.946
46.508
7.0-8.5
165.652
602.910
712.797
826.869
664.782
352.611
106.696
23.186
8.5-10.0
55.418
194.546
227.146
259.459
203.946
106.696
34.872
7.187
10.0-20.0
13.358
43.654
51.563
57.703
46.508
23.186
7.187
1.851
Table Supp.LXXXVI: Measured cross section as function of on iron, in units of /GeV/c/nucleon, and the absolute and fractional cross section uncertainties
Bin edges (GeV/c)
Abs. Unc.
Frac. Stat. Unc.
Frac. Sys. Unc.
Frac. Flux Unc.
0.00-0.15
383.24
78.77
0.175
0.108
0.036
0.15-0.30
1292.12
180.71
0.108
0.089
0.034
0.30-0.45
2057.62
342.26
0.108
0.126
0.036
0.45-0.60
2510.77
486.56
0.108
0.161
0.038
0.60-0.75
1657.69
500.94
0.157
0.258
0.040
0.75-0.90
1144.28
456.20
0.209
0.339
0.044
0.90-1.25
537.52
222.14
0.280
0.304
0.049
1.25-2.50
30.88
29.66
0.858
0.432
0.044
Table Supp.LXXXVII: Statistical covariance matrix of measured cross section as function of on iron, in units of /GeV/c/nucleon
Bin edges (GeV/c)
0.00-0.15
0.15-0.30
0.30-0.45
0.45-0.60
0.60-0.75
0.75-0.90
0.90-1.25
1.25-2.50
0.00-0.15
4508.029
200.588
-1057.726
-151.445
-11.493
-13.006
-3.431
-0.124
0.15-0.30
200.588
19354.213
2200.287
-3066.130
-782.930
-151.086
-68.478
-17.264
0.30-0.45
-1057.726
2200.287
49488.545
5599.511
-4144.878
-1804.099
-554.261
-9.056
0.45-0.60
-151.445
-3066.130
5599.511
73629.427
11005.561
-5077.959
-1892.165
-35.771
0.60-0.75
-11.493
-782.930
-4144.878
11005.561
67610.981
16189.200
-3072.318
-34.839
0.75-0.90
-13.006
-151.086
-1804.099
-5077.959
16189.200
57364.592
12622.564
-456.645
0.90-1.25
-3.431
-68.478
-554.261
-1892.165
-3072.318
12622.564
22709.915
626.156
1.25-2.50
-0.124
-17.264
-9.056
-35.771
-34.839
-456.645
626.156
701.992
Table Supp.LXXXVIII: Systematic covariance matrix of measured cross section in on iron, in units of /GeV/c/nucleon
Bin edges (GeV/c)
0.00-0.15
0.15-0.30
0.30-0.45
0.45-0.60
0.60-0.75
0.75-0.90
0.90-1.25
1.25-2.50
0.00-0.15
1697.438
3083.106
1352.142
982.632
1042.083
-44.294
526.367
59.871
0.15-0.30
3083.106
13303.600
22528.156
32586.614
29441.668
25380.953
9590.877
498.537
0.30-0.45
1352.142
22528.156
67655.950
99661.336
101743.975
87615.854
33418.402
1559.410
0.45-0.60
982.632
32586.614
99661.336
163108.310
160333.855
143991.058
52913.450
2540.412
0.60-0.75
1042.083
29441.668
101743.975
160333.855
183327.323
157677.680
64102.260
3163.920
0.75-0.90
-44.294
25380.953
87615.854
143991.058
157677.680
150753.848
59087.249
3359.485
0.90-1.25
526.367
9590.877
33418.402
52913.450
64102.260
59087.249
26635.988
1593.865
1.25-2.50
59.871
498.537
1559.410
2540.412
3163.920
3359.485
1593.865
177.810
Table Supp.LXXXIX: Measured cross section as function of on iron, in units of /GeV/nucleon, and the absolute and fractional cross section uncertainties
Bin edges (GeV)
Abs. Unc.
Frac. Stat. Unc.
Frac. Sys. Unc.
Frac. Flux Unc.
0.000-0.025
2203.06
440.60
0.169
0.108
0.036
0.025-0.050
2393.39
403.92
0.143
0.090
0.036
0.050-0.100
2621.21
406.66
0.124
0.094
0.034
0.100-0.200
2548.13
407.20
0.106
0.120
0.036
0.200-0.300
2512.02
439.28
0.120
0.127
0.037
0.300-0.400
1831.97
413.22
0.137
0.179
0.038
0.400-0.500
1192.24
352.42
0.168
0.243
0.040
0.500-0.700
857.58
322.78
0.198
0.320
0.042
0.700-1.000
571.66
224.01
0.223
0.323
0.044
1.000-1.300
314.24
136.57
0.325
0.289
0.048
1.300-2.000
70.95
65.02
0.684
0.610
0.075
2.000-3.000
29.19
30.93
0.929
0.509
0.047
Table Supp.XC: Statistical covariance matrix of measured cross section as function of on iron, in units of /GeV/nucleon
Bin edges (GeV)
0.000-0.025
0.025-0.050
0.050-0.100
0.100-0.200
0.200-0.300
0.300-0.400
0.400-0.500
0.500-0.700
0.700-1.000
1.000-1.300
1.300-2.000
2.000-3.000
0.000-0.025
137801.601
29581.907
-13084.445
-4487.854
-351.306
-215.348
-2.885
-7.405
-35.435
-7.505
-0.332
0.429
0.025-0.050
29581.907
116449.941
35811.441
-7818.177
-4115.050
-518.530
-213.727
-80.378
-16.845
-31.024
-30.061
-9.789
0.050-0.100
-13084.445
35811.441
105091.742
16546.048
-9383.267
-3935.939
-1127.083
-283.563
-95.588
-32.006
-96.217
-56.591
0.100-0.200
-4487.854
-7818.177
16546.048
72901.198
16065.321
-4398.396
-4091.900
-1297.178
-553.793
-505.000
45.509
40.002
0.200-0.300
-351.306
-4115.050
-9383.267
16065.321
91346.779
24554.767
187.068
-3523.817
-1354.187
-687.084
-330.202
-250.335
0.300-0.400
-215.348
-518.530
-3935.939
-4398.396
24554.767
63156.008
22886.304
-1436.591
-2212.579
-645.433
-61.612
260.211
0.400-0.500
-2.885
-213.727
-1127.083
-4091.900
187.068
22886.304
40333.847
13802.060
-1188.428
-1911.245
-151.578
107.033
0.500-0.700
-7.405
-80.378
-283.563
-1297.178
-3523.817
-1436.591
13802.060
28940.832
6654.313
-614.375
-178.851
-102.142
0.700-1.000
-35.435
-16.845
-95.588
-553.793
-1354.187
-2212.579
-1188.428
6654.313
16190.031
6244.640
105.428
-42.257
1.000-1.300
-7.505
-31.024
-32.006
-505.000
-687.084
-645.433
-1911.245
-614.375
6244.640
10412.006
1945.571
-12.112
1.300-2.000
-0.332
-30.061
-96.217
45.509
-330.202
-61.612
-151.578
-178.851
105.428
1945.571
2354.592
478.895
2.000-3.000
0.429
-9.789
-56.591
40.002
-250.335
260.211
107.033
-102.142
-42.257
-12.112
478.895
735.750
Table Supp.XCI: Systematic covariance matrix of measured cross section in on iron, in units of /GeV/nucleon
Bin edges (GeV)
0.000-0.025
0.025-0.050
0.050-0.100
0.100-0.200
0.200-0.300
0.300-0.400
0.400-0.500
0.500-0.700
0.700-1.000
1.000-1.300
1.300-2.000
2.000-3.000
0.000-0.025
56330.153
41854.391
28615.528
11777.222
8987.773
2808.922
3952.899
1414.203
-441.422
1719.485
404.092
-120.953
0.025-0.050
41854.391
46697.584
43841.747
39293.903
35734.056
34708.185
28744.777
26472.560
16308.957
7832.234
2691.034
871.441
0.050-0.100
28615.528
43841.747
60283.640
67369.854
63426.373
62541.414
53859.168
50007.653
31908.075
14771.552
5183.326
1710.945
0.100-0.200
11777.222
39293.903
67369.854
92910.828
88557.671
89883.663
78305.677
73333.008
45901.172
20886.720
7572.366
2500.306
0.200-0.300
8987.773
35734.056
63426.373
88557.671
101623.257
98829.623
86403.079
79752.621
51111.939
22341.626
8140.579
2902.191
0.300-0.400
2808.922
34708.185
62541.414
89883.663
98829.623
107593.652
90251.175
81170.858
53030.603
22342.842
8164.355
3128.716
0.400-0.500
3952.899
28744.777
53859.168
78305.677
86403.079
90251.175
83869.271
76341.753
49259.257
22398.760
9132.650
3139.109
0.500-0.700
1414.203
26472.560
50007.653
73333.008
79752.621
81170.858
76341.753
75245.661
48525.106
22687.294
9375.036
3072.433
0.700-1.000
-441.422
16308.957
31908.075
45901.172
51111.939
53030.603
49259.257
48525.106
33989.888
15320.991
6322.854
2224.255
1.000-1.300
1719.485
7832.234
14771.552
20886.720
22341.626
22342.842
22398.760
22687.294
15320.991
8239.954
3609.320
1099.543
1.300-2.000
404.092
2691.034
5183.326
7572.366
8140.579
8164.355
9132.650
9375.036
6322.854
3609.320
1872.378
567.369
2.000-3.000
-120.953
871.441
1710.945
2500.306
2902.191
3128.716
3139.109
3072.433
2224.255
1099.543
567.369
221.141
Table Supp.XCII: Measured cross section as function of on iron, in units of /GeV/c2/nucleon, and the absolute and fractional cross section uncertainties
Bin edges (GeV/c2)
Abs. Unc.
Frac. Stat. Unc.
Frac. Sys. Unc.
Frac. Flux Unc.
0.9-1.1
311.04
166.76
0.474
0.250
0.058
1.1-1.2
3578.05
568.58
0.132
0.089
0.037
1.2-1.3
6517.70
1370.61
0.096
0.187
0.037
1.3-1.4
4762.99
1879.65
0.178
0.352
0.037
Table Supp.XCIII: Statistical covariance matrix of measured cross section as function of on iron, in units of /GeV/c2/nucleon
Bin edges (GeV/c2)
0.9-1.1
1.1-1.2
1.2-1.3
1.3-1.4
0.9-1.1
21751.952
8816.208
-32096.118
-11418.298
1.1-1.2
8816.208
221945.211
-113809.407
-238691.744
1.2-1.3
-32096.118
-113809.407
388748.322
294208.988
1.3-1.4
-11418.298
-238691.744
294208.988
717522.632
Table Supp.XCIV: Systematic covariance matrix of measured cross section in on iron, in units of /GeV/c2/nucleon
Bin edges (GeV/c2)
0.9-1.1
1.1-1.2
1.2-1.3
1.3-1.4
0.9-1.1
6057.167
7556.637
35126.356
46543.098
1.1-1.2
7556.637
101332.959
-9217.793
-109601.685
1.2-1.3
35126.356
-9217.793
1489829.153
1981530.923
1.3-1.4
46543.098
-109601.685
1981530.923
2815551.855
Table Supp.XCV: Measured cross section as function of on iron, in units of /GeV/nucleon, and the absolute and fractional cross section uncertainties
Bin edges (GeV)
Abs. Unc.
Frac. Stat. Unc.
Frac. Sys. Unc.
Frac. Flux Unc.
0.035-0.100
9611.08
1423.80
0.080
0.125
0.036
0.100-0.150
6490.73
926.72
0.067
0.126
0.037
0.150-0.200
4801.53
909.68
0.098
0.162
0.037
0.200-0.350
1964.13
829.17
0.206
0.368
0.042
Table Supp.XCVI: Statistical covariance matrix of measured cross section as function of on iron, in units of /GeV/nucleon
Bin edges (GeV)
0.035-0.100
0.100-0.150
0.150-0.200
0.200-0.350
0.035-0.100
592308.755
144789.490
-51192.110
-29375.688
0.100-0.150
144789.490
190306.593
62421.208
-9576.103
0.150-0.200
-51192.110
62421.208
219623.729
60254.833
0.200-0.350
-29375.688
-9576.103
60254.833
163896.809
Table Supp.XCVII: Systematic covariance matrix of measured cross section in on iron, in units of /GeV/nucleon
Bin edges (GeV)
0.035-0.100
0.100-0.150
0.150-0.200
0.200-0.350
0.035-0.100
1434906.838
857837.924
660551.198
539981.697
0.100-0.150
857837.924
668506.151
580579.025
474120.643
0.150-0.200
660551.198
580579.025
607902.437
539205.808
0.200-0.350
539981.697
474120.643
539205.808
523625.100
Table Supp.XCVIII: Measured cross section as function of on iron, in units of /degree/nucleon, and the absolute and fractional cross section uncertainties
Bin edges (degree)
Abs. Unc.
Frac. Stat. Unc.
Frac. Sys. Unc.
Frac. Flux Unc.
0-10
4.28
1.82
0.389
0.168
0.041
10-20
7.60
2.13
0.212
0.183
0.037
20-30
10.16
2.16
0.131
0.167
0.036
30-40
12.09
2.40
0.116
0.161
0.037
40-50
13.99
2.73
0.106
0.164
0.039
50-60
17.22
3.09
0.104
0.146
0.038
60-120
13.65
2.38
0.106
0.138
0.038
120-135
6.63
1.69
0.186
0.174
0.035
135-150
3.66
1.17
0.253
0.197
0.038
150-165
1.87
1.02
0.492
0.242
0.037
165-180
1.14
1.36
1.096
0.467
0.037
Table Supp.XCIX: Statistical covariance matrix of measured cross section as function of on iron, in units of /degree/nucleon
Bin edges (degree)
0-10
10-20
20-30
30-40
40-50
50-60
60-120
120-135
135-150
150-165
165-180
0-10
2.778
0.967
-0.097
-0.023
0.009
-0.055
-0.044
-0.026
0.019
0.025
-0.002
10-20
0.967
2.596
0.658
-0.123
-0.184
-0.099
-0.044
-0.046
-0.028
-0.018
-0.009
20-30
-0.097
0.658
1.783
0.606
-0.124
-0.171
-0.084
-0.066
-0.008
0.012
-0.018
30-40
-0.023
-0.123
0.606
1.968
0.855
-0.186
-0.160
-0.086
0.021
0.026
-0.030
40-50
0.009
-0.184
-0.124
0.855
2.216
1.051
-0.123
-0.053
-0.005
-0.029
-0.025
50-60
-0.055
-0.099
-0.171
-0.186
1.051
3.212
0.896
-0.133
-0.121
-0.077
0.003
60-120
-0.044
-0.044
-0.084
-0.160
-0.123
0.896
2.110
0.287
-0.036
-0.009
0.051
120-135
-0.026
-0.046
-0.066
-0.086
-0.053
-0.133
0.287
1.519
0.433
0.039
-0.130
135-150
0.019
-0.028
-0.008
0.021
-0.005
-0.121
-0.036
0.433
0.859
0.425
0.122
150-165
0.025
-0.018
0.012
0.026
-0.029
-0.077
-0.009
0.039
0.425
0.842
0.660
165-180
-0.002
-0.009
-0.018
-0.030
-0.025
0.003
0.051
-0.130
0.122
0.660
1.562
Table Supp.C: Systematic covariance matrix of measured cross section in on iron, in units of /degree/nucleon
Bin edges (degree)
0-10
10-20
20-30
30-40
40-50
50-60
60-120
120-135
135-150
150-165
165-180
0-10
0.519
0.817
0.997
1.074
1.244
1.284
0.896
0.666
0.352
0.211
-0.162
10-20
0.817
1.934
2.154
2.341
2.542
2.253
1.340
1.150
0.608
0.430
-0.239
20-30
0.997
2.154
2.885
3.148
3.495
3.379
2.171
1.630
0.949
0.583
-0.198
30-40
1.074
2.341
3.148
3.808
4.236
4.240
2.849
1.777
1.019
0.621
-0.090
40-50
1.244
2.542
3.495
4.236
5.253
5.456
3.638
2.285
1.325
0.718
-0.088
50-60
1.284
2.253
3.379
4.240
5.456
6.333
4.491
2.476
1.388
0.696
0.002
60-120
0.896
1.340
2.171
2.849
3.638
4.491
3.552
1.600
0.835
0.391
0.091
120-135
0.666
1.150
1.630
1.777
2.285
2.476
1.600
1.327
0.754
0.425
-0.112
135-150
0.352
0.608
0.949
1.019
1.325
1.388
0.835
0.754
0.520
0.270
-0.067
150-165
0.211
0.430
0.583
0.621
0.718
0.696
0.391
0.425
0.270
0.205
-0.028
165-180
-0.162
-0.239
-0.198
-0.090
-0.088
0.002
0.091
-0.112
-0.067
-0.028
0.284
Table Supp.CI: Measured cross section as function of on lead, in units of /GeV/c/nucleon, and the absolute and fractional cross section uncertainties
Bin edges (GeV/c)
Abs. Unc.
Frac. Stat. Unc.
Frac. Sys. Unc.
Frac. Flux Unc.
1.5-3.0
57.22
14.78
0.222
0.131
0.040
3.0-4.0
169.13
31.67
0.138
0.126
0.042
4.0-5.0
208.37
36.80
0.107
0.141
0.043
5.0-6.0
206.20
37.95
0.100
0.154
0.042
6.0-7.0
133.72
26.25
0.115
0.159
0.040
7.0-8.5
61.02
12.21
0.133
0.150
0.039
8.5-10.0
20.70
4.78
0.178
0.146
0.042
10.0-20.0
3.54
1.29
0.307
0.196
0.059
Table Supp.CII: Statistical covariance matrix of measured cross section as function of on lead, in units of /GeV/c/nucleon
Bin edges (GeV/c)
1.5-3.0
3.0-4.0
4.0-5.0
5.0-6.0
6.0-7.0
7.0-8.5
8.5-10.0
10.0-20.0
1.5-3.0
162.019
55.143
10.979
2.356
5.699
0.630
0.112
0.017
3.0-4.0
55.143
546.846
159.863
29.564
7.808
2.796
0.687
0.060
4.0-5.0
10.979
159.863
494.840
173.574
38.342
11.228
3.055
0.185
5.0-6.0
2.356
29.564
173.574
426.939
169.281
25.683
3.167
0.484
6.0-7.0
5.699
7.808
38.342
169.281
236.627
68.538
7.526
0.549
7.0-8.5
0.630
2.796
11.228
25.683
68.538
65.416
15.972
1.145
8.5-10.0
0.112
0.687
3.055
3.167
7.526
15.972
13.637
1.904
10.0-20.0
0.017
0.060
0.185
0.484
0.549
1.145
1.904
1.183
Table Supp.CIII: Systematic covariance matrix of measured cross section in on lead, in units of /GeV/c/nucleon
Bin edges (GeV/c)
1.5-3.0
3.0-4.0
4.0-5.0
5.0-6.0
6.0-7.0
7.0-8.5
8.5-10.0
10.0-20.0
1.5-3.0
56.444
138.926
180.808
195.336
116.599
37.107
11.447
3.040
3.0-4.0
138.926
456.300
585.215
618.568
366.751
130.067
36.735
9.805
4.0-5.0
180.808
585.215
859.583
899.855
540.719
203.785
51.933
14.063
5.0-6.0
195.336
618.568
899.855
1013.175
637.749
241.083
66.174
16.345
6.0-7.0
116.599
366.751
540.719
637.749
452.536
178.971
53.757
11.877
7.0-8.5
37.107
130.067
203.785
241.083
178.971
83.684
24.919
4.785
8.5-10.0
11.447
36.735
51.933
66.174
53.757
24.919
9.164
1.611
10.0-20.0
3.040
9.805
14.063
16.345
11.877
4.785
1.611
0.483
Table Supp.CIV: Measured cross section as function of on lead, in units of /degree/nucleon, and the absolute and fractional cross section uncertainties
Bin edges (degree)
Abs. Unc.
Frac. Stat. Unc.
Frac. Sys. Unc.
Frac. Flux Unc.
0-2
32.71
6.87
0.179
0.110
0.035
2-3
83.11
16.21
0.166
0.103
0.036
3-4
81.92
17.97
0.176
0.131
0.036
4-5
93.94
21.24
0.177
0.141
0.036
5-6
82.57
23.50
0.218
0.183
0.038
6-8
83.06
22.10
0.190
0.187
0.042
8-10
96.34
26.31
0.201
0.185
0.045
10-13
88.49
28.00
0.250
0.194
0.045
Table Supp.CV: Statistical covariance matrix of measured cross section as function of on lead, in units of /degree/nucleon
Bin edges (degree)
0-2
2-3
3-4
4-5
5-6
6-8
8-10
10-13
0-2
34.123
1.170
-7.061
-1.132
0.053
-0.004
-0.048
-0.190
2-3
1.170
189.638
30.525
-21.629
-6.990
-0.080
-0.095
-0.407
3-4
-7.061
30.525
207.225
34.916
-21.579
-4.114
-0.110
-0.681
4-5
-1.132
-21.629
34.916
275.591
60.008
-17.741
-2.978
0.399
5-6
0.053
-6.990
-21.579
60.008
323.349
15.500
-15.806
-1.288
6-8
-0.004
-0.080
-4.114
-17.741
15.500
248.413
-1.075
-14.438
8-10
-0.048
-0.095
-0.110
-2.978
-15.806
-1.075
375.065
-9.371
10-13
-0.190
-0.407
-0.681
0.399
-1.288
-14.438
-9.371
489.807
Table Supp.CVI: Systematic covariance matrix of measured cross section in on lead, in units of /degree/nucleon
Bin edges (degree)
0-2
2-3
3-4
4-5
5-6
6-8
8-10
10-13
0-2
13.053
21.354
24.029
25.945
26.727
23.505
22.209
25.444
2-3
21.354
73.124
82.686
85.119
105.230
101.031
112.547
94.467
3-4
24.029
82.686
115.798
129.470
151.397
152.158
161.481
151.063
4-5
25.945
85.119
129.470
175.384
180.866
177.610
196.907
183.731
5-6
26.727
105.230
151.397
180.866
229.048
221.694
233.313
216.679
6-8
23.505
101.031
152.158
177.610
221.694
240.058
258.273
236.181
8-10
22.209
112.547
161.481
196.907
233.313
258.273
317.068
269.857
10-13
25.444
94.467
151.063
183.731
216.679
236.181
269.857
294.391
Table Supp.CVII: Measured cross section as function of on lead, in units of /GeV/c/nucleon, and the absolute and fractional cross section uncertainties
Bin edges (GeV/c)
Abs. Unc.
Frac. Stat. Unc.
Frac. Sys. Unc.
Frac. Flux Unc.
1.5-3.0
62.81
15.69
0.214
0.129
0.040
3.0-4.0
170.55
32.40
0.138
0.131
0.042
4.0-5.0
205.44
37.10
0.109
0.144
0.044
5.0-6.0
204.29
37.49
0.101
0.153
0.042
6.0-7.0
130.24
25.40
0.116
0.157
0.040
7.0-8.5
60.09
11.91
0.132
0.148
0.039
8.5-10.0
20.73
4.66
0.175
0.141
0.041
10.0-20.0
3.55
1.28
0.304
0.195
0.059
Table Supp.CVIII: Statistical covariance matrix of measured cross section as function of on lead, in units of /GeV/c/nucleon
Bin edges (GeV/c)
1.5-3.0
3.0-4.0
4.0-5.0
5.0-6.0
6.0-7.0
7.0-8.5
8.5-10.0
10.0-20.0
1.5-3.0
180.102
54.791
10.594
2.700
5.881
0.643
0.111
0.018
3.0-4.0
54.791
553.360
147.805
33.256
8.554
4.122
0.910
0.062
4.0-5.0
10.594
147.805
501.413
175.103
38.949
10.598
3.017
0.187
5.0-6.0
2.700
33.256
175.103
423.991
159.229
24.427
3.065
0.470
6.0-7.0
5.881
8.554
38.949
159.229
227.923
68.353
7.886
0.515
7.0-8.5
0.643
4.122
10.598
24.427
68.353
62.634
15.833
1.209
8.5-10.0
0.111
0.910
3.017
3.065
7.886
15.833
13.109
1.902
10.0-20.0
0.018
0.062
0.187
0.470
0.515
1.209
1.902
1.169
Table Supp.CIX: Systematic covariance matrix of measured cross section in on lead, in units of /GeV/c/nucleon
Bin edges (GeV/c)
1.5-3.0
3.0-4.0
4.0-5.0
5.0-6.0
6.0-7.0
7.0-8.5
8.5-10.0
10.0-20.0
1.5-3.0
65.945
156.648
196.080
208.037
121.268
40.055
12.698
3.241
3.0-4.0
156.648
496.145
613.874
627.753
362.434
128.593
36.249
9.914
4.0-5.0
196.080
613.874
875.271
890.815
528.535
204.789
52.470
14.028
5.0-6.0
208.037
627.753
890.815
981.148
610.077
238.019
65.819
16.173
6.0-7.0
121.268
362.434
528.535
610.077
417.195
168.414
50.493
11.430
7.0-8.5
40.055
128.593
204.789
238.019
168.414
79.260
23.105
4.764
8.5-10.0
12.698
36.249
52.470
65.819
50.493
23.105
8.596
1.597
10.0-20.0
3.241
9.914
14.028
16.173
11.430
4.764
1.597
0.479
Table Supp.CX: Measured cross section as function of on lead, in units of /GeV/c/nucleon, and the absolute and fractional cross section uncertainties
Bin edges (GeV/c)
Abs. Unc.
Frac. Stat. Unc.
Frac. Sys. Unc.
Frac. Flux Unc.
0.00-0.15
236.50
63.46
0.238
0.124
0.036
0.15-0.30
713.67
131.67
0.151
0.107
0.036
0.30-0.45
1294.09
207.18
0.114
0.112
0.036
0.45-0.60
1179.81
261.53
0.146
0.167
0.038
0.60-0.75
928.01
303.17
0.205
0.255
0.041
0.75-0.90
663.67
249.94
0.255
0.277
0.047
0.90-1.25
538.56
154.85
0.224
0.181
0.044
1.25-2.50
46.26
28.11
0.548
0.262
0.046
Table Supp.CXI: Statistical covariance matrix of measured cross section as function of on lead, in units of /GeV/c/nucleon
Bin edges (GeV/c)
0.00-0.15
0.15-0.30
0.30-0.45
0.45-0.60
0.60-0.75
0.75-0.90
0.90-1.25
1.25-2.50
0.00-0.15
3168.718
396.989
-682.793
-135.891
-4.150
-15.259
-2.058
-2.887
0.15-0.30
396.989
11544.339
1232.806
-1676.433
-454.364
-54.702
-41.615
-5.107
0.30-0.45
-682.793
1232.806
21839.737
3944.473
-2826.174
-928.275
-216.527
-6.595
0.45-0.60
-135.891
-1676.433
3944.473
29715.318
7674.514
-1779.356
-1087.723
-45.942
0.60-0.75
-4.150
-454.364
-2826.174
7674.514
36030.549
7778.024
-1015.831
-92.489
0.75-0.90
-15.259
-54.702
-928.275
-1779.356
7778.024
28589.494
5302.666
-387.123
0.90-1.25
-2.058
-41.615
-216.527
-1087.723
-1015.831
5302.666
14519.371
454.036
1.25-2.50
-2.887
-5.107
-6.595
-45.942
-92.489
-387.123
454.036
643.079
Table Supp.CXII: Systematic covariance matrix of measured cross section in on lead, in units of /GeV/c/nucleon
Bin edges (GeV/c)
0.00-0.15
0.15-0.30
0.30-0.45
0.45-0.60
0.60-0.75
0.75-0.90
0.90-1.25
1.25-2.50
0.00-0.15
858.314
1541.536
1477.698
858.624
566.947
760.244
425.940
31.396
0.15-0.30
1541.536
5793.906
9326.513
10708.725
10733.551
8355.208
3623.301
211.474
0.30-0.45
1477.698
9326.513
21083.833
26557.906
27334.872
20448.934
8612.808
492.206
0.45-0.60
858.624
10708.725
26557.906
38682.204
41349.523
30321.221
12514.317
663.020
0.60-0.75
566.947
10733.551
27334.872
41349.523
55883.369
40454.619
18278.196
831.407
0.75-0.90
760.244
8355.208
20448.934
30321.221
40454.619
33878.710
16027.219
756.951
0.90-1.25
425.940
3623.301
8612.808
12514.317
18278.196
16027.219
9459.079
337.098
1.25-2.50
31.396
211.474
492.206
663.020
831.407
756.951
337.098
147.264
Table Supp.CXIII: Measured cross section as function of on lead, in units of /GeV/nucleon, and the absolute and fractional cross section uncertainties
Bin edges (GeV)
Abs. Unc.
Frac. Stat. Unc.
Frac. Sys. Unc.
Frac. Flux Unc.
0.000-0.025
1377.45
360.28
0.232
0.120
0.036
0.025-0.050
1545.90
318.03
0.180
0.099
0.035
0.050-0.100
1340.67
278.06
0.173
0.114
0.036
0.100-0.200
1540.32
254.33
0.120
0.113
0.036
0.200-0.300
1192.87
255.96
0.146
0.157
0.038
0.300-0.400
814.78
218.51
0.196
0.183
0.037
0.400-0.500
742.47
209.57
0.199
0.201
0.038
0.500-0.700
505.16
181.41
0.230
0.276
0.043
0.700-1.000
362.55
129.20
0.246
0.258
0.045
1.000-1.300
334.27
104.12
0.260
0.172
0.039
1.300-2.000
89.19
52.40
0.490
0.324
0.058
2.000-3.000
79.01
76.23
0.918
0.296
0.045
Table Supp.CXIV: Statistical covariance matrix of measured cross section as function of on lead, in units of /GeV/nucleon
Bin edges (GeV)
0.000-0.025
0.025-0.050
0.050-0.100
0.100-0.200
0.200-0.300
0.300-0.400
0.400-0.500
0.500-0.700
0.700-1.000
1.000-1.300
1.300-2.000
2.000-3.000
0.000-0.025
102365.910
23995.884
-8159.314
-2931.052
-204.852
-174.866
-70.549
16.612
-62.726
20.284
-16.180
-17.044
0.025-0.050
23995.884
77779.070
23456.388
-4519.319
-2625.286
-478.484
-167.234
-45.000
-40.480
-32.874
-9.654
-3.802
0.050-0.100
-8159.314
23456.388
54101.847
9375.054
-4821.719
-1589.678
-712.645
-145.199
-39.017
-73.589
-28.538
1.758
0.100-0.200
-2931.052
-4519.319
9375.054
34308.499
8233.980
-2135.072
-2573.844
-749.455
-244.834
-143.762
-5.293
-19.055
0.200-0.300
-204.852
-2625.286
-4821.719
8233.980
30482.401
12298.839
895.149
-1464.890
-410.208
-23.786
-38.294
-19.719
0.300-0.400
-174.866
-478.484
-1589.678
-2135.072
12298.839
25629.989
14476.309
-2.271
-1103.469
-592.153
-234.311
-10.325
0.400-0.500
-70.549
-167.234
-712.645
-2573.844
895.149
14476.309
21746.274
8145.249
-370.599
-900.004
-166.443
-70.245
0.500-0.700
16.612
-45.000
-145.199
-749.455
-1464.890
-2.271
8145.249
13530.088
3797.890
-616.488
-17.299
-106.552
0.700-1.000
-62.726
-40.480
-39.017
-244.834
-410.208
-1103.469
-370.599
3797.890
7975.856
2679.136
-63.894
-319.962
1.000-1.300
20.284
-32.874
-73.589
-143.762
-23.786
-592.153
-900.004
-616.488
2679.136
7526.346
591.026
-223.317
1.300-2.000
-16.180
-9.654
-28.538
-5.293
-38.294
-234.311
-166.443
-17.299
-63.894
591.026
1912.384
306.063
2.000-3.000
-17.044
-3.802
1.758
-19.055
-19.719
-10.325
-70.245
-106.552
-319.962
-223.317
306.063
5262.012
Table Supp.CXV: Systematic covariance matrix of measured cross section in on lead, in units of /GeV/nucleon
Bin edges (GeV)
0.000-0.025
0.025-0.050
0.050-0.100
0.100-0.200
0.200-0.300
0.300-0.400
0.400-0.500
0.500-0.700
0.700-1.000
1.000-1.300
1.300-2.000
2.000-3.000
0.000-0.025
27438.389
20614.170
15391.629
11891.348
4765.830
3573.036
3746.310
3030.552
2372.444
2054.434
-71.575
595.811
0.025-0.050
20614.170
23365.053
19586.410
18309.054
13307.121
10080.808
10051.827
9511.742
5927.853
4205.073
556.662
1133.213
0.050-0.100
15391.629
19586.410
23217.530
24616.084
22049.533
16620.749
16862.697
14612.344
8927.013
5825.351
994.784
995.743
0.100-0.200
11891.348
18309.054
24616.084
30375.661
27380.065
22412.748
22350.023
19200.507
11450.749
6802.159
1607.278
1210.251
0.200-0.300
4765.830
13307.121
22049.533
27380.065
35034.638
24271.171
23806.637
20699.693
12851.084
7331.150
2153.086
978.034
0.300-0.400
3573.036
10080.808
16620.749
22412.748
24271.171
22118.452
21160.786
18779.817
11030.151
6022.207
2193.369
719.037
0.400-0.500
3746.310
10051.827
16862.697
22350.023
23806.637
21160.786
22174.645
19688.088
11706.085
6521.884
2398.046
567.351
0.500-0.700
3030.552
9511.742
14612.344
19200.507
20699.693
18779.817
19688.088
19381.297
12112.459
6186.160
2733.678
593.115
0.700-1.000
2372.444
5927.853
8927.013
11450.749
12851.084
11030.151
11706.085
12112.459
8715.631
4576.629
2066.718
543.318
1.000-1.300
2054.434
4205.073
5825.351
6802.159
7331.150
6022.207
6521.884
6186.160
4576.629
3313.826
1091.299
224.801
1.300-2.000
-71.575
556.662
994.784
1607.278
2153.086
2193.369
2398.046
2733.678
2066.718
1091.299
833.186
15.014
2.000-3.000
595.811
1133.213
995.743
1210.251
978.034
719.037
567.351
593.115
543.318
224.801
15.014
548.266
Table Supp.CXVI: Measured cross section as function of on lead, in units of /GeV/c2/nucleon, and the absolute and fractional cross section uncertainties
Bin edges (GeV/c2)
Abs. Unc.
Frac. Stat. Unc.
Frac. Sys. Unc.
Frac. Flux Unc.
0.9-1.1
324.04
158.71
0.422
0.248
0.055
1.1-1.2
986.81
257.24
0.237
0.108
0.046
1.2-1.3
3802.07
617.99
0.091
0.135
0.037
1.3-1.4
5092.70
1400.14
0.161
0.223
0.032
Table Supp.CXVII: Statistical covariance matrix of measured cross section as function of on lead, in units of /GeV/c2/nucleon
Bin edges (GeV/c2)
0.9-1.1
1.1-1.2
1.2-1.3
1.3-1.4
0.9-1.1
18723.909
10639.010
-18411.776
-28099.433
1.1-1.2
10639.010
54830.704
23209.963
-124904.569
1.2-1.3
-18411.776
23209.963
119494.363
55595.419
1.3-1.4
-28099.433
-124904.569
55595.419
674041.129
Table Supp.CXVIII: Systematic covariance matrix of measured cross section in on lead, in units of /GeV/c2/nucleon
Bin edges (GeV/c2)
0.9-1.1
1.1-1.2
1.2-1.3
1.3-1.4
0.9-1.1
6465.812
5506.681
2629.126
6224.264
1.1-1.2
5506.681
11343.237
18638.835
14533.237
1.2-1.3
2629.126
18638.835
262420.462
543487.733
1.3-1.4
6224.264
14533.237
543487.733
1286338.954
Table Supp.CXIX: Measured cross section as function of on lead, in units of /GeV/nucleon, and the absolute and fractional cross section uncertainties
Bin edges (GeV)
Abs. Unc.
Frac. Stat. Unc.
Frac. Sys. Unc.
Frac. Flux Unc.
0.035-0.100
5058.30
762.04
0.113
0.099
0.037
0.100-0.150
3560.00
528.69
0.091
0.117
0.038
0.150-0.200
2718.88
550.67
0.126
0.158
0.038
0.200-0.350
2145.01
624.92
0.169
0.237
0.038
Table Supp.CXX: Statistical covariance matrix of measured cross section as function of on lead, in units of /GeV/nucleon
Bin edges (GeV)
0.035-0.100
0.100-0.150
0.150-0.200
0.200-0.350
0.035-0.100
327493.820
72027.359
-23454.488
-22608.464
0.100-0.150
72027.359
104866.238
29191.098
-8581.637
0.150-0.200
-23454.488
29191.098
117994.805
28803.449
0.200-0.350
-22608.464
-8581.637
28803.449
131287.372
Table Supp.CXXI: Systematic covariance matrix of measured cross section in on lead, in units of /GeV/nucleon
Bin edges (GeV)
0.035-0.100
0.100-0.150
0.150-0.200
0.200-0.350
0.035-0.100
253210.315
191336.076
166383.958
172831.262
0.100-0.150
191336.076
174649.446
165733.149
176988.883
0.150-0.200
166383.958
165733.149
185243.795
198764.255
0.200-0.350
172831.262
176988.883
198764.255
259233.214
Table Supp.CXXII: Measured cross section as function of on lead, in units of /degree/nucleon, and the absolute and fractional cross section uncertainties
Bin edges (degree)
Abs. Unc.
Frac. Stat. Unc.
Frac. Sys. Unc.
Frac. Flux Unc.
0-10
2.76
1.21
0.404
0.168
0.040
10-20
5.72
1.58
0.215
0.173
0.038
20-30
6.08
1.36
0.154
0.162
0.039
30-40
8.29
1.52
0.119
0.140
0.038
40-50
8.20
1.60
0.121
0.154
0.039
50-60
7.04
1.63
0.155
0.171
0.041
60-120
6.42
1.24
0.141
0.133
0.038
120-135
4.46
0.93
0.170
0.122
0.035
135-150
3.19
0.79
0.193
0.153
0.034
150-165
1.74
0.68
0.345
0.180
0.036
165-180
0.34
0.34
0.945
0.363
0.043
Table Supp.CXXIII: Statistical covariance matrix of measured cross section as function of on lead, in units of /degree/nucleon
Bin edges (degree)
0-10
10-20
20-30
30-40
40-50
50-60
60-120
120-135
135-150
150-165
165-180
0-10
1.239
0.505
0.026
-0.019
-0.031
-0.034
-0.027
-0.016
-0.013
0.027
-0.003
10-20
0.505
1.513
0.471
-0.038
-0.117
-0.084
-0.043
-0.035
-0.030
-0.002
-0.004
20-30
0.026
0.471
0.873
0.417
-0.011
-0.092
-0.050
-0.030
-0.010
0.011
0.003
30-40
-0.019
-0.038
0.417
0.973
0.511
0.052
-0.092
-0.054
0.002
0.000
-0.012
40-50
-0.031
-0.117
-0.011
0.511
0.978
0.615
0.085
-0.018
-0.021
-0.012
-0.014
50-60
-0.034
-0.084
-0.092
0.052
0.615
1.199
0.446
-0.006
-0.069
-0.025
-0.013
60-120
-0.027
-0.043
-0.050
-0.092
0.085
0.446
0.814
0.157
0.007
-0.005
0.026
120-135
-0.016
-0.035
-0.030
-0.054
-0.018
-0.006
0.157
0.576
0.237
0.006
0.061
135-150
-0.013
-0.030
-0.010
0.002
-0.021
-0.069
0.007
0.237
0.381
0.185
0.011
150-165
0.027
-0.002
0.011
0.000
-0.012
-0.025
-0.005
0.006
0.185
0.360
-0.003
165-180
-0.003
-0.004
0.003
-0.012
-0.014
-0.013
0.026
0.061
0.011
-0.003
0.101
Table Supp.CXXIV: Systematic covariance matrix of measured cross section in on lead, in units of /degree/nucleon
Bin edges (degree)
0-10
10-20
20-30
30-40
40-50
50-60
60-120
120-135
135-150
150-165
165-180
0-10
0.214
0.349
0.382
0.450
0.476
0.398
0.283
0.215
0.192
0.089
-0.001
10-20
0.349
0.981
0.884
0.904
0.855
0.675
0.447
0.387
0.329
0.152
-0.018
20-30
0.382
0.884
0.974
1.055
1.026
0.838
0.531
0.455
0.369
0.175
-0.004
30-40
0.450
0.904
1.055
1.344
1.395
1.255
0.828
0.522
0.446
0.207
0.020
40-50
0.476
0.855
1.026
1.395
1.592
1.447
0.979
0.552
0.484
0.231
0.010
50-60
0.398
0.675
0.838
1.255
1.447
1.456
0.971
0.433
0.386
0.183
0.037
60-120
0.283
0.447
0.531
0.828
0.979
0.971
0.725
0.301
0.294
0.128
0.020
120-135
0.215
0.387
0.455
0.522
0.552
0.433
0.301
0.297
0.238
0.117
-0.004
135-150
0.192
0.329
0.369
0.446
0.484
0.386
0.294
0.238
0.239
0.122
-0.008
150-165
0.089
0.152
0.175
0.207
0.231
0.183
0.128
0.117
0.122
0.098
-0.004
165-180
-0.001
-0.018
-0.004
0.020
0.010
0.037
0.020
-0.004
-0.008
-0.004
0.015
K Tables of Ratios of cross sections
Table Supp.CXXV: Measured cross section ratio of carbon over scintillator in , and the absolute and fractional cross section ratio uncertainties
Bin edges (GeV/c)
Ratio
Abs. Unc.
Frac. Stat. Unc.
Frac. Sys. Unc.
Frac. Flux Unc.
1.5-3.0
1.11
0.411
0.350
0.122
0.004
3.0-4.0
1.20
0.279
0.209
0.104
0.003
4.0-5.0
1.02
0.229
0.184
0.129
0.005
5.0-6.0
0.95
0.213
0.171
0.144
0.002
6.0-7.0
0.77
0.197
0.195
0.166
0.008
7.0-8.5
0.74
0.239
0.258
0.194
0.020
8.5-10.0
0.67
0.304
0.366
0.265
0.025
10.0-20.0
1.18
0.610
0.450
0.251
0.016
Table Supp.CXXVI: Statistical covariance matrix of measured cross section ratio of carbon over scintillator in
Bin edges (GeV/c)
1.5-3.0
3.0-4.0
4.0-5.0
5.0-6.0
6.0-7.0
7.0-8.5
8.5-10.0
10.0-20.0
1.5-3.0
0.1507
0.0181
0.0020
0.0012
0.0015
0.0009
0.0002
0.0014
3.0-4.0
0.0181
0.0626
0.0115
0.0023
0.0008
0.0002
0.0000
0.0000
4.0-5.0
0.0020
0.0115
0.0352
0.0103
0.0019
0.0006
0.0003
0.0000
5.0-6.0
0.0012
0.0023
0.0103
0.0265
0.0116
0.0037
0.0022
0.0010
6.0-7.0
0.0015
0.0008
0.0019
0.0116
0.0225
0.0156
0.0069
0.0088
7.0-8.5
0.0009
0.0002
0.0006
0.0037
0.0156
0.0366
0.0270
0.0089
8.5-10.0
0.0002
0.0000
0.0003
0.0022
0.0069
0.0270
0.0607
0.0427
10.0-20.0
0.0014
0.0000
0.0000
0.0010
0.0088
0.0089
0.0427
0.2838
Table Supp.CXXVII: Systematic covariance matrix of measured cross section ratio of carbon over scintillator in
Bin edges (GeV/c)
1.5-3.0
3.0-4.0
4.0-5.0
5.0-6.0
6.0-7.0
7.0-8.5
8.5-10.0
10.0-20.0
1.5-3.0
0.018
0.013
0.012
0.013
0.012
0.008
0.014
0.032
3.0-4.0
0.013
0.015
0.012
0.014
0.013
0.010
0.014
0.030
4.0-5.0
0.012
0.012
0.017
0.016
0.015
0.013
0.013
0.028
5.0-6.0
0.013
0.014
0.016
0.019
0.016
0.014
0.016
0.032
6.0-7.0
0.012
0.013
0.015
0.016
0.016
0.015
0.017
0.030
7.0-8.5
0.008
0.010
0.013
0.014
0.015
0.021
0.022
0.026
8.5-10.0
0.014
0.014
0.013
0.016
0.017
0.022
0.032
0.038
10.0-20.0
0.032
0.030
0.028
0.032
0.030
0.026
0.038
0.089
Table Supp.CXXVIII: Measured cross section ratio of carbon over scintillator in , and the absolute and fractional cross section ratio uncertainties
Bin edges (degree)
Ratio
Abs. Unc.
Frac. Stat. Unc.
Frac. Sys. Unc.
Frac. Flux Unc.
0-2
0.76
0.233
0.299
0.072
0.004
2-3
1.31
0.331
0.228
0.109
0.004
3-4
0.84
0.248
0.270
0.123
0.004
4-5
0.86
0.286
0.277
0.181
0.002
5-6
0.40
0.244
0.511
0.319
0.011
6-8
0.72
0.356
0.412
0.274
0.011
8-10
1.58
0.636
0.349
0.201
0.009
10-13
1.88
0.811
0.388
0.191
0.010
Table Supp.CXXIX: Statistical covariance matrix of measured cross section ratio of carbon over scintillator in
Bin edges (degree)
0-2
2-3
3-4
4-5
5-6
6-8
8-10
10-13
0-2
0.0513
-0.0020
-0.0024
-0.0004
0.0000
0.0000
-0.0001
-0.0003
2-3
-0.0020
0.0892
0.0037
-0.0056
-0.0010
-0.0000
-0.0005
-0.0001
3-4
-0.0024
0.0037
0.0509
0.0071
-0.0037
-0.0009
-0.0001
-0.0003
4-5
-0.0004
-0.0056
0.0071
0.0574
0.0083
-0.0050
-0.0008
0.0001
5-6
0.0000
-0.0010
-0.0037
0.0083
0.0429
0.0054
-0.0041
-0.0003
6-8
0.0000
-0.0000
-0.0009
-0.0050
0.0054
0.0879
-0.0032
-0.0056
8-10
-0.0001
-0.0005
-0.0001
-0.0008
-0.0041
-0.0032
0.3035
-0.0178
10-13
-0.0003
-0.0001
-0.0003
0.0001
-0.0003
-0.0056
-0.0178
0.5289
Table Supp.CXXX: Systematic covariance matrix of measured cross section ratio of carbon over scintillator in
Bin edges (degree)
0-2
2-3
3-4
4-5
5-6
6-8
8-10
10-13
0-2
0.003
0.001
0.002
0.002
0.002
0.002
0.006
0.001
2-3
0.001
0.020
0.009
0.015
0.010
0.014
0.023
0.035
3-4
0.002
0.009
0.010
0.014
0.011
0.012
0.019
0.024
4-5
0.002
0.015
0.014
0.024
0.016
0.021
0.036
0.037
5-6
0.002
0.010
0.011
0.016
0.017
0.016
0.026
0.026
6-8
0.002
0.014
0.012
0.021
0.016
0.039
0.042
0.040
8-10
0.006
0.023
0.019
0.036
0.026
0.042
0.101
0.062
10-13
0.001
0.035
0.024
0.037
0.026
0.040
0.062
0.129
Table Supp.CXXXI: Measured cross section ratio of carbon over scintillator in , and the absolute and fractional cross section ratio uncertainties
Bin edges (GeV/c)
Ratio
Abs. Unc.
Frac. Stat. Unc.
Frac. Sys. Unc.
Frac. Flux Unc.
1.5-3.0
1.07
0.404
0.355
0.128
0.005
3.0-4.0
1.21
0.281
0.209
0.102
0.003
4.0-5.0
1.03
0.229
0.183
0.128
0.005
5.0-6.0
0.92
0.212
0.175
0.149
0.002
6.0-7.0
0.80
0.202
0.194
0.163
0.007
7.0-8.5
0.74
0.239
0.260
0.194
0.020
8.5-10.0
0.67
0.306
0.372
0.267
0.025
10.0-20.0
1.19
0.613
0.449
0.251
0.016
Table Supp.CXXXII: Statistical covariance matrix of measured cross section ratio of carbon over scintillator in
Bin edges (GeV/c)
1.5-3.0
3.0-4.0
4.0-5.0
5.0-6.0
6.0-7.0
7.0-8.5
8.5-10.0
10.0-20.0
1.5-3.0
0.1447
0.0160
0.0019
0.0011
0.0014
0.0008
0.0002
0.0013
3.0-4.0
0.0160
0.0639
0.0111
0.0020
0.0007
0.0001
0.0000
0.0000
4.0-5.0
0.0019
0.0111
0.0353
0.0103
0.0020
0.0006
0.0003
0.0000
5.0-6.0
0.0011
0.0020
0.0103
0.0259
0.0119
0.0038
0.0021
0.0010
6.0-7.0
0.0014
0.0007
0.0020
0.0119
0.0239
0.0153
0.0065
0.0089
7.0-8.5
0.0008
0.0001
0.0006
0.0038
0.0153
0.0367
0.0271
0.0091
8.5-10.0
0.0002
0.0000
0.0003
0.0021
0.0065
0.0271
0.0620
0.0436
10.0-20.0
0.0013
0.0000
0.0000
0.0010
0.0089
0.0091
0.0436
0.2857
Table Supp.CXXXIII: Systematic covariance matrix of measured cross section ratio of carbon over scintillator in
Bin edges (GeV/c)
1.5-3.0
3.0-4.0
4.0-5.0
5.0-6.0
6.0-7.0
7.0-8.5
8.5-10.0
10.0-20.0
1.5-3.0
0.019
0.012
0.013
0.013
0.013
0.009
0.014
0.033
3.0-4.0
0.012
0.015
0.012
0.014
0.013
0.009
0.013
0.028
4.0-5.0
0.013
0.012
0.017
0.016
0.015
0.013
0.013
0.028
5.0-6.0
0.013
0.014
0.016
0.019
0.017
0.014
0.016
0.032
6.0-7.0
0.013
0.013
0.015
0.017
0.017
0.015
0.017
0.031
7.0-8.5
0.009
0.009
0.013
0.014
0.015
0.020
0.022
0.025
8.5-10.0
0.014
0.013
0.013
0.016
0.017
0.022
0.032
0.038
10.0-20.0
0.033
0.028
0.028
0.032
0.031
0.025
0.038
0.090
Table Supp.CXXXIV: Measured cross section ratio of carbon over scintillator in , and the absolute and fractional cross section ratio uncertainties
Bin edges (GeV/c)
Ratio
Abs. Unc.
Frac. Stat. Unc.
Frac. Sys. Unc.
Frac. Flux Unc.
0.00-0.15
1.07
0.355
0.323
0.070
0.003
0.15-0.30
0.80
0.192
0.226
0.080
0.002
0.30-0.45
0.99
0.224
0.201
0.103
0.003
0.45-0.60
0.92
0.255
0.228
0.160
0.004
0.60-0.75
0.84
0.314
0.306
0.212
0.008
0.75-0.90
0.65
0.579
0.688
0.569
0.039
0.90-1.25
1.33
0.945
0.586
0.399
0.021
1.25-2.50
1.97
3.141
1.434
0.693
0.021
Table Supp.CXXXV: Statistical covariance matrix of measured cross section ratio of carbon over scintillator in
Bin edges (GeV/c)
0.00-0.15
0.15-0.30
0.30-0.45
0.45-0.60
0.60-0.75
0.75-0.90
0.90-1.25
1.25-2.50
0.00-0.15
0.1200
0.0004
-0.0045
-0.0005
-0.0000
0.0007
-0.0004
-0.0002
0.15-0.30
0.0004
0.0328
0.0022
-0.0032
-0.0007
-0.0007
-0.0003
-0.0006
0.30-0.45
-0.0045
0.0022
0.0396
0.0048
-0.0051
-0.0032
-0.0017
-0.0073
0.45-0.60
-0.0005
-0.0032
0.0048
0.0437
0.0083
-0.0064
-0.0115
0.0076
0.60-0.75
-0.0000
-0.0007
-0.0051
0.0083
0.0667
0.0340
-0.0028
-0.0370
0.75-0.90
0.0007
-0.0007
-0.0032
-0.0064
0.0340
0.1992
0.1252
-0.0123
0.90-1.25
-0.0004
-0.0003
-0.0017
-0.0115
-0.0028
0.1252
0.6101
-0.0227
1.25-2.50
-0.0002
-0.0006
-0.0073
0.0076
-0.0370
-0.0123
-0.0227
7.9959
Table Supp.CXXXVI: Systematic covariance matrix of measured cross section ratio of carbon over scintillator in
Bin edges (GeV/c)
0.00-0.15
0.15-0.30
0.30-0.45
0.45-0.60
0.60-0.75
0.75-0.90
0.90-1.25
1.25-2.50
0.00-0.15
0.006
0.003
0.002
0.002
0.004
0.003
0.002
0.020
0.15-0.30
0.003
0.004
0.004
0.005
0.008
0.011
0.014
0.041
0.30-0.45
0.002
0.004
0.010
0.013
0.014
0.025
0.031
0.097
0.45-0.60
0.002
0.005
0.013
0.021
0.022
0.034
0.043
0.131
0.60-0.75
0.004
0.008
0.014
0.022
0.032
0.047
0.048
0.164
0.75-0.90
0.003
0.011
0.025
0.034
0.047
0.136
0.162
0.355
0.90-1.25
0.002
0.014
0.031
0.043
0.048
0.162
0.283
0.461
1.25-2.50
0.020
0.041
0.097
0.131
0.164
0.355
0.461
1.868
Table Supp.CXXXVII: Measured cross section ratio of carbon over scintillator in , and the absolute and fractional cross section ratio uncertainties
Bin edges (GeV)
Ratio
Abs. Unc.
Frac. Stat. Unc.
Frac. Sys. Unc.
Frac. Flux Unc.
0.000-0.025
1.08
0.344
0.311
0.068
0.003
0.025-0.050
0.86
0.256
0.290
0.062
0.003
0.050-0.100
0.76
0.214
0.259
0.111
0.003
0.100-0.200
1.12
0.250
0.199
0.099
0.003
0.200-0.300
0.77
0.238
0.272
0.146
0.004
0.300-0.400
0.87
0.296
0.282
0.191
0.003
0.400-0.500
0.75
0.321
0.354
0.239
0.005
0.500-0.700
0.66
0.380
0.467
0.336
0.018
0.700-1.000
1.09
0.704
0.518
0.387
0.029
1.000-1.300
1.47
0.903
0.548
0.274
0.022
1.300-2.000
1.13
1.733
1.264
0.878
0.022
2.000-3.000
2.46
4.688
1.695
0.871
0.033
Table Supp.CXXXVIII: Statistical covariance matrix of measured cross section ratio of carbon over scintillator in
Bin edges (GeV)
0.000-0.025
0.025-0.050
0.050-0.100
0.100-0.200
0.200-0.300
0.300-0.400
0.400-0.500
0.500-0.700
0.700-1.000
1.000-1.300
1.300-2.000
2.000-3.000
0.000-0.025
0.1131
0.0081
-0.0065
-0.0025
-0.0000
-0.0000
-0.0001
-0.0001
0.0005
-0.0001
-0.0004
-0.0002
0.025-0.050
0.0081
0.0629
0.0155
-0.0052
-0.0020
-0.0004
-0.0002
-0.0003
-0.0007
-0.0003
-0.0006
0.0002
0.050-0.100
-0.0065
0.0155
0.0388
0.0083
-0.0038
-0.0018
-0.0007
-0.0002
0.0001
-0.0004
-0.0015
-0.0010
0.100-0.200
-0.0025
-0.0052
0.0083
0.0501
0.0080
-0.0051
-0.0045
-0.0009
-0.0012
-0.0020
-0.0013
-0.0044
0.200-0.300
-0.0000
-0.0020
-0.0038
0.0080
0.0440
0.0203
-0.0013
-0.0054
-0.0038
-0.0039
-0.0076
-0.0037
0.300-0.400
-0.0000
-0.0004
-0.0018
-0.0051
0.0203
0.0601
0.0381
0.0002
-0.0128
-0.0109
0.0098
-0.0019
0.400-0.500
-0.0001
-0.0002
-0.0007
-0.0045
-0.0013
0.0381
0.0709
0.0375
-0.0018
-0.0130
-0.0081
-0.0134
0.500-0.700
-0.0001
-0.0003
-0.0002
-0.0009
-0.0054
0.0002
0.0375
0.0953
0.0637
-0.0046
-0.0017
-0.0267
0.700-1.000
0.0005
-0.0007
0.0001
-0.0012
-0.0038
-0.0128
-0.0018
0.0637
0.3184
0.2083
0.0089
-0.0939
1.000-1.300
-0.0001
-0.0003
-0.0004
-0.0020
-0.0039
-0.0109
-0.0130
-0.0046
0.2083
0.6520
0.2704
-0.1106
1.300-2.000
-0.0004
-0.0006
-0.0015
-0.0013
-0.0076
0.0098
-0.0081
-0.0017
0.0089
0.2704
2.0261
1.2873
2.000-3.000
-0.0002
0.0002
-0.0010
-0.0044
-0.0037
-0.0019
-0.0134
-0.0267
-0.0939
-0.1106
1.2873
17.3908
Table Supp.CXXXIX: Systematic covariance matrix of measured cross section ratio of carbon over scintillator in
Bin edges (GeV)
0.000-0.025
0.025-0.050
0.050-0.100
0.100-0.200
0.200-0.300
0.300-0.400
0.400-0.500
0.500-0.700
0.700-1.000
1.000-1.300
1.300-2.000
2.000-3.000
0.000-0.025
0.005
0.001
0.003
0.002
0.002
0.002
0.004
0.002
-0.001
0.003
-0.000
0.023
0.025-0.050
0.001
0.003
0.002
0.003
0.001
0.001
0.003
0.005
0.005
0.007
0.006
0.034
0.050-0.100
0.003
0.002
0.007
0.007
0.007
0.009
0.011
0.013
0.017
0.019
0.030
0.070
0.100-0.200
0.002
0.003
0.007
0.012
0.011
0.013
0.015
0.020
0.024
0.028
0.054
0.124
0.200-0.300
0.002
0.001
0.007
0.011
0.013
0.016
0.017
0.019
0.025
0.029
0.057
0.105
0.300-0.400
0.002
0.001
0.009
0.013
0.016
0.028
0.026
0.027
0.034
0.035
0.087
0.137
0.400-0.500
0.004
0.003
0.011
0.015
0.017
0.026
0.032
0.031
0.035
0.036
0.083
0.144
0.500-0.700
0.002
0.005
0.013
0.020
0.019
0.027
0.031
0.049
0.072
0.066
0.129
0.244
0.700-1.000
-0.001
0.005
0.017
0.024
0.025
0.034
0.035
0.072
0.178
0.145
0.257
0.462
1.000-1.300
0.003
0.007
0.019
0.028
0.029
0.035
0.036
0.066
0.145
0.163
0.271
0.506
1.300-2.000
-0.000
0.006
0.030
0.054
0.057
0.087
0.083
0.129
0.257
0.271
0.979
0.596
2.000-3.000
0.023
0.034
0.070
0.124
0.105
0.137
0.144
0.244
0.462
0.506
0.596
4.588
Table Supp.CXL: Measured cross section ratio of carbon over scintillator in , and the absolute and fractional cross section ratio uncertainties
Bin edges (GeV/c2)
Ratio
Abs. Unc.
Frac. Stat. Unc.
Frac. Sys. Unc.
Frac. Flux Unc.
0.9-1.1
1.66
1.128
0.636
0.237
0.019
1.1-1.2
1.05
0.202
0.177
0.075
0.002
1.2-1.3
0.84
0.220
0.201
0.167
0.006
1.3-1.4
0.58
0.454
0.531
0.571
0.009
Table Supp.CXLI: Statistical covariance matrix of measured cross section ratio of carbon over scintillator in
Bin edges (GeV/c2)
0.9-1.1
1.1-1.2
1.2-1.3
1.3-1.4
0.9-1.1
1.1178
-0.0021
-0.0769
-0.0717
1.1-1.2
-0.0021
0.0348
0.0017
-0.0224
1.2-1.3
-0.0769
0.0017
0.0286
0.0188
1.3-1.4
-0.0717
-0.0224
0.0188
0.0955
Table Supp.CXLII: Systematic covariance matrix of measured cross section ratio of carbon over scintillator in
Bin edges (GeV/c2)
0.9-1.1
1.1-1.2
1.2-1.3
1.3-1.4
0.9-1.1
0.155
0.004
0.005
0.002
1.1-1.2
0.004
0.006
0.002
0.004
1.2-1.3
0.005
0.002
0.020
0.044
1.3-1.4
0.002
0.004
0.044
0.110
Table Supp.CXLIII: Measured cross section ratio of carbon over scintillator in , and the absolute and fractional cross section ratio uncertainties
Bin edges (GeV)
Ratio
Abs. Unc.
Frac. Stat. Unc.
Frac. Sys. Unc.
Frac. Flux Unc.
0.035-0.100
0.87
0.190
0.177
0.128
0.002
0.100-0.150
0.95
0.167
0.133
0.115
0.003
0.150-0.200
0.85
0.255
0.227
0.194
0.008
0.200-0.350
0.80
0.450
0.427
0.364
0.021
Table Supp.CXLIV: Statistical covariance matrix of measured cross section ratio of carbon over scintillator in
Bin edges (GeV)
0.035-0.100
0.100-0.150
0.150-0.200
0.200-0.350
0.035-0.100
0.0236
0.0034
-0.0041
-0.0001
0.100-0.150
0.0034
0.0160
0.0090
0.0073
0.150-0.200
-0.0041
0.0090
0.0375
0.0362
0.200-0.350
-0.0001
0.0073
0.0362
0.1174
Table Supp.CXLV: Systematic covariance matrix of measured cross section ratio of carbon over scintillator in
Bin edges (GeV)
0.035-0.100
0.100-0.150
0.150-0.200
0.200-0.350
0.035-0.100
0.012
0.011
0.015
0.024
0.100-0.150
0.011
0.012
0.017
0.023
0.150-0.200
0.015
0.017
0.027
0.039
0.200-0.350
0.024
0.023
0.039
0.085
Table Supp.CXLVI: Measured cross section ratio of carbon over scintillator in , and the absolute and fractional cross section ratio uncertainties
Bin edges (degree)
Ratio
Abs. Unc.
Frac. Stat. Unc.
Frac. Sys. Unc.
Frac. Flux Unc.
0-10
1.06
1.715
1.486
0.652
0.013
10-20
0.87
0.604
0.629
0.302
0.007
20-30
0.85
0.348
0.341
0.229
0.004
30-40
0.84
0.282
0.280
0.183
0.009
40-50
1.10
0.297
0.231
0.142
0.007
50-60
0.82
0.245
0.258
0.153
0.007
60-120
0.90
0.211
0.209
0.106
0.003
120-135
1.01
0.315
0.293
0.108
0.003
135-150
1.27
0.426
0.312
0.119
0.009
150-165
1.63
1.047
0.559
0.316
0.007
165-180
1.69
1.465
0.777
0.389
0.017
Table Supp.CXLVII: Statistical covariance matrix of measured cross section ratio of carbon over scintillator in
Bin edges (degree)
0-10
10-20
20-30
30-40
40-50
50-60
60-120
120-135
135-150
150-165
165-180
0-10
2.4667
0.3428
0.0833
-0.0202
0.0355
-0.0057
-0.0090
-0.0090
-0.0207
-0.0504
0.0468
10-20
0.3428
0.2965
0.0649
-0.0038
-0.0037
-0.0053
-0.0022
0.0001
-0.0020
0.0089
0.3371
20-30
0.0833
0.0649
0.0837
0.0156
-0.0059
-0.0034
-0.0025
-0.0050
-0.0053
0.0082
0.0700
30-40
-0.0202
-0.0038
0.0156
0.0558
0.0193
-0.0013
-0.0023
-0.0017
0.0011
-0.0037
-0.0167
40-50
0.0355
-0.0037
-0.0059
0.0193
0.0640
0.0146
-0.0012
-0.0035
-0.0046
-0.0178
-0.0252
50-60
-0.0057
-0.0053
-0.0034
-0.0013
0.0146
0.0445
0.0099
-0.0020
-0.0030
-0.0084
-0.0121
60-120
-0.0090
-0.0022
-0.0025
-0.0023
-0.0012
0.0099
0.0354
0.0075
-0.0009
-0.0033
-0.0018
120-135
-0.0090
0.0001
-0.0050
-0.0017
-0.0035
-0.0020
0.0075
0.0872
0.0207
0.0024
0.0100
135-150
-0.0207
-0.0020
-0.0053
0.0011
-0.0046
-0.0030
-0.0009
0.0207
0.1586
0.2220
0.0990
150-165
-0.0504
0.0089
0.0082
-0.0037
-0.0178
-0.0084
-0.0033
0.0024
0.2220
0.8311
0.0499
165-180
0.0468
0.3371
0.0700
-0.0167
-0.0252
-0.0121
-0.0018
0.0100
0.0990
0.0499
1.7155
Table Supp.CXLVIII: Systematic covariance matrix of measured cross section ratio of carbon over scintillator in
Bin edges (degree)
0-10
10-20
20-30
30-40
40-50
50-60
60-120
120-135
135-150
150-165
165-180
0-10
0.475
0.048
0.047
0.036
0.027
0.023
0.023
0.021
0.036
0.129
0.004
10-20
0.048
0.068
0.045
0.032
0.036
0.028
0.018
0.022
0.027
0.043
0.102
20-30
0.047
0.045
0.038
0.027
0.025
0.019
0.013
0.015
0.021
0.030
0.057
30-40
0.036
0.032
0.027
0.024
0.018
0.014
0.010
0.011
0.017
0.030
0.045
40-50
0.027
0.036
0.025
0.018
0.024
0.019
0.011
0.014
0.017
0.018
0.051
50-60
0.023
0.028
0.019
0.014
0.019
0.016
0.009
0.012
0.014
0.019
0.042
60-120
0.023
0.018
0.013
0.010
0.011
0.009
0.009
0.009
0.008
0.017
0.043
120-135
0.021
0.022
0.015
0.011
0.014
0.012
0.009
0.012
0.011
0.023
0.047
135-150
0.036
0.027
0.021
0.017
0.017
0.014
0.008
0.011
0.023
0.014
0.028
150-165
0.129
0.043
0.030
0.030
0.018
0.019
0.017
0.023
0.014
0.265
0.099
165-180
0.004
0.102
0.057
0.045
0.051
0.042
0.043
0.047
0.028
0.099
0.430
Table Supp.CXLIX: Measured cross section ratio of water over scintillator in , and the absolute and fractional cross section ratio uncertainties
Bin edges (GeV/c)
Ratio
Abs. Unc.
Frac. Stat. Unc.
Frac. Sys. Unc.
Frac. Flux Unc.
1.5-3.0
0.89
0.393
0.412
0.163
0.005
3.0-4.0
0.55
0.255
0.387
0.264
0.023
4.0-5.0
0.94
0.235
0.211
0.132
0.008
5.0-6.0
0.92
0.209
0.188
0.127
0.005
6.0-7.0
0.87
0.207
0.208
0.116
0.006
7.0-8.5
0.91
0.255
0.234
0.153
0.009
8.5-10.0
0.85
0.307
0.320
0.167
0.006
10.0-20.0
0.65
0.309
0.441
0.172
0.016
Table Supp.CL: Statistical covariance matrix of measured cross section ratio of water over scintillator in
Bin edges (GeV/c)
1.5-3.0
3.0-4.0
4.0-5.0
5.0-6.0
6.0-7.0
7.0-8.5
8.5-10.0
10.0-20.0
1.5-3.0
0.1333
0.0098
0.0011
0.0005
0.0005
0.0005
0.0012
0.0000
3.0-4.0
0.0098
0.0444
0.0126
0.0032
0.0005
0.0006
0.0002
0.0004
4.0-5.0
0.0011
0.0126
0.0397
0.0138
0.0037
0.0016
0.0012
0.0006
5.0-6.0
0.0005
0.0032
0.0138
0.0299
0.0154
0.0052
0.0020
0.0016
6.0-7.0
0.0005
0.0005
0.0037
0.0154
0.0326
0.0181
0.0040
0.0004
7.0-8.5
0.0005
0.0006
0.0016
0.0052
0.0181
0.0454
0.0225
0.0062
8.5-10.0
0.0012
0.0002
0.0012
0.0020
0.0040
0.0225
0.0739
0.0410
10.0-20.0
0.0000
0.0004
0.0006
0.0016
0.0004
0.0062
0.0410
0.0830
Table Supp.CLI: Systematic covariance matrix of measured cross section ratio of water over scintillator in
Bin edges (GeV/c)
1.5-3.0
3.0-4.0
4.0-5.0
5.0-6.0
6.0-7.0
7.0-8.5
8.5-10.0
10.0-20.0
1.5-3.0
0.021
0.009
0.009
0.007
0.010
0.015
0.014
0.005
3.0-4.0
0.009
0.021
0.013
0.013
0.009
0.010
0.009
0.006
4.0-5.0
0.009
0.013
0.016
0.012
0.010
0.011
0.009
0.007
5.0-6.0
0.007
0.013
0.012
0.014
0.009
0.008
0.008
0.007
6.0-7.0
0.010
0.009
0.010
0.009
0.010
0.011
0.010
0.007
7.0-8.5
0.015
0.010
0.011
0.008
0.011
0.020
0.016
0.008
8.5-10.0
0.014
0.009
0.009
0.008
0.010
0.016
0.020
0.006
10.0-20.0
0.005
0.006
0.007
0.007
0.007
0.008
0.006
0.013
Table Supp.CLII: Measured cross section ratio of water over scintillator in , and the absolute and fractional cross section ratio uncertainties
Bin edges (degree)
Ratio
Abs. Unc.
Frac. Stat. Unc.
Frac. Sys. Unc.
Frac. Flux Unc.
0-2
0.69
0.193
0.261
0.108
0.009
2-3
0.96
0.274
0.272
0.086
0.007
3-4
0.90
0.263
0.269
0.116
0.005
4-5
0.74
0.304
0.383
0.150
0.004
5-6
0.52
0.309
0.537
0.258
0.014
6-8
1.03
0.441
0.367
0.221
0.008
8-10
1.78
0.686
0.343
0.178
0.007
10-13
0.13
0.512
3.400
1.891
0.150
Table Supp.CLIII: Statistical covariance matrix of measured cross section ratio of water over scintillator in
Bin edges (degree)
0-2
2-3
3-4
4-5
5-6
6-8
8-10
10-13
0-2
0.0319
0.0026
-0.0040
-0.0007
-0.0000
-0.0002
-0.0000
0.0000
2-3
0.0026
0.0681
0.0080
-0.0081
-0.0013
-0.0003
-0.0003
0.0000
3-4
-0.0040
0.0080
0.0582
0.0122
-0.0055
-0.0018
0.0001
0.0000
4-5
-0.0007
-0.0081
0.0122
0.0803
0.0161
-0.0072
-0.0009
0.0000
5-6
-0.0000
-0.0013
-0.0055
0.0161
0.0776
0.0100
-0.0079
-0.0001
6-8
-0.0002
-0.0003
-0.0018
-0.0072
0.0100
0.1428
-0.0106
-0.0028
8-10
-0.0000
-0.0003
0.0001
-0.0009
-0.0079
-0.0106
0.3704
0.0322
10-13
0.0000
0.0000
0.0000
0.0000
-0.0001
-0.0028
0.0322
0.2003
Table Supp.CLIV: Systematic covariance matrix of measured cross section ratio of water over scintillator in
Bin edges (degree)
0-2
2-3
3-4
4-5
5-6
6-8
8-10
10-13
0-2
0.005
0.004
0.004
0.001
0.000
0.000
0.001
-0.002
2-3
0.004
0.007
0.006
0.005
0.006
0.009
0.005
0.008
3-4
0.004
0.006
0.011
0.007
0.006
0.015
0.018
0.010
4-5
0.001
0.005
0.007
0.012
0.012
0.016
0.015
0.018
5-6
0.000
0.006
0.006
0.012
0.018
0.015
0.017
0.024
6-8
0.000
0.009
0.015
0.016
0.015
0.052
0.039
0.035
8-10
0.001
0.005
0.018
0.015
0.017
0.039
0.100
0.037
10-13
-0.002
0.008
0.010
0.018
0.024
0.035
0.037
0.062
Table Supp.CLV: Measured cross section ratio of water over scintillator in , and the absolute and fractional cross section ratio uncertainties
Bin edges (GeV/c)
Ratio
Abs. Unc.
Frac. Stat. Unc.
Frac. Sys. Unc.
Frac. Flux Unc.
1.5-3.0
0.99
0.431
0.390
0.193
0.005
3.0-4.0
0.60
0.260
0.358
0.241
0.020
4.0-5.0
0.96
0.240
0.212
0.133
0.008
5.0-6.0
0.88
0.204
0.193
0.128
0.005
6.0-7.0
0.86
0.208
0.211
0.116
0.007
7.0-8.5
0.87
0.251
0.240
0.162
0.010
8.5-10.0
0.83
0.303
0.321
0.171
0.006
10.0-20.0
0.66
0.312
0.439
0.171
0.016
Table Supp.CLVI: Statistical covariance matrix of measured cross section ratio of water over scintillator in
Bin edges (GeV/c)
1.5-3.0
3.0-4.0
4.0-5.0
5.0-6.0
6.0-7.0
7.0-8.5
8.5-10.0
10.0-20.0
1.5-3.0
0.1490
0.0105
0.0011
0.0005
0.0006
0.0004
0.0013
0.0000
3.0-4.0
0.0105
0.0463
0.0129
0.0029
0.0004
0.0006
0.0002
0.0004
4.0-5.0
0.0011
0.0129
0.0413
0.0136
0.0036
0.0016
0.0012
0.0006
5.0-6.0
0.0005
0.0029
0.0136
0.0291
0.0148
0.0050
0.0020
0.0016
6.0-7.0
0.0006
0.0004
0.0036
0.0148
0.0332
0.0178
0.0040
0.0004
7.0-8.5
0.0004
0.0006
0.0016
0.0050
0.0178
0.0434
0.0225
0.0061
8.5-10.0
0.0013
0.0002
0.0012
0.0020
0.0040
0.0225
0.0715
0.0414
10.0-20.0
0.0000
0.0004
0.0006
0.0016
0.0004
0.0061
0.0414
0.0843
Table Supp.CLVII: Systematic covariance matrix of measured cross section ratio of water over scintillator in
Bin edges (GeV/c)
1.5-3.0
3.0-4.0
4.0-5.0
5.0-6.0
6.0-7.0
7.0-8.5
8.5-10.0
10.0-20.0
1.5-3.0
0.037
0.006
0.010
0.007
0.010
0.018
0.016
0.006
3.0-4.0
0.006
0.021
0.013
0.013
0.009
0.010
0.009
0.006
4.0-5.0
0.010
0.013
0.016
0.012
0.010
0.010
0.009
0.007
5.0-6.0
0.007
0.013
0.012
0.013
0.009
0.008
0.008
0.007
6.0-7.0
0.010
0.009
0.010
0.009
0.010
0.011
0.009
0.007
7.0-8.5
0.018
0.010
0.010
0.008
0.011
0.020
0.016
0.008
8.5-10.0
0.016
0.009
0.009
0.008
0.009
0.016
0.020
0.006
10.0-20.0
0.006
0.006
0.007
0.007
0.007
0.008
0.006
0.013
Table Supp.CLVIII: Measured cross section ratio of water over scintillator in , and the absolute and fractional cross section ratio uncertainties
Bin edges (GeV/c)
Ratio
Abs. Unc.
Frac. Stat. Unc.
Frac. Sys. Unc.
Frac. Flux Unc.
0.00-0.15
0.66
0.239
0.352
0.096
0.011
0.15-0.30
0.71
0.196
0.253
0.110
0.005
0.30-0.45
1.08
0.256
0.213
0.103
0.005
0.45-0.60
0.88
0.294
0.289
0.172
0.004
0.60-0.75
0.28
0.276
0.740
0.641
0.016
0.75-0.90
1.40
0.670
0.421
0.228
0.010
0.90-1.25
1.88
1.082
0.545
0.187
0.014
1.25-2.50
2.94
4.698
0.959
1.279
0.055
Table Supp.CLIX: Statistical covariance matrix of measured cross section ratio of water over scintillator in
Bin edges (GeV/c)
0.00-0.15
0.15-0.30
0.30-0.45
0.45-0.60
0.60-0.75
0.75-0.90
0.90-1.25
1.25-2.50
0.00-0.15
0.0533
0.0002
-0.0033
-0.0005
-0.0001
-0.0001
-0.0000
0.0001
0.15-0.30
0.0002
0.0321
0.0019
-0.0039
-0.0011
-0.0006
-0.0026
-0.0007
0.30-0.45
-0.0033
0.0019
0.0531
0.0075
-0.0023
-0.0068
-0.0021
-0.0149
0.45-0.60
-0.0005
-0.0039
0.0075
0.0640
0.0179
-0.0075
-0.0038
0.0104
0.60-0.75
-0.0001
-0.0011
-0.0023
0.0179
0.0436
0.0540
0.0031
-0.0223
0.75-0.90
-0.0001
-0.0006
-0.0068
-0.0075
0.0540
0.3466
0.0398
-0.0432
0.90-1.25
-0.0000
-0.0026
-0.0021
-0.0038
0.0031
0.0398
1.0485
0.0088
1.25-2.50
0.0001
-0.0007
-0.0149
0.0104
-0.0223
-0.0432
0.0088
7.9464
Table Supp.CLX: Systematic covariance matrix of measured cross section ratio of water over scintillator in
Bin edges (GeV/c)
0.00-0.15
0.15-0.30
0.30-0.45
0.45-0.60
0.60-0.75
0.75-0.90
0.90-1.25
1.25-2.50
0.00-0.15
0.004
0.004
0.001
0.000
-0.001
-0.001
0.000
-0.015
0.15-0.30
0.004
0.006
0.004
0.004
0.004
0.008
0.008
0.006
0.30-0.45
0.001
0.004
0.012
0.011
0.009
0.019
0.021
0.059
0.45-0.60
0.000
0.004
0.011
0.023
0.020
0.029
0.008
0.206
0.60-0.75
-0.001
0.004
0.009
0.020
0.033
0.043
0.014
0.205
0.75-0.90
-0.001
0.008
0.019
0.029
0.043
0.102
0.050
0.192
0.90-1.25
0.000
0.008
0.021
0.008
0.014
0.050
0.123
-0.226
1.25-2.50
-0.015
0.006
0.059
0.206
0.205
0.192
-0.226
14.125
Table Supp.CLXI: Measured cross section ratio of water over scintillator in , and the absolute and fractional cross section ratio uncertainties
Bin edges (GeV)
Ratio
Abs. Unc.
Frac. Stat. Unc.
Frac. Sys. Unc.
Frac. Flux Unc.
0.000-0.025
0.65
0.232
0.348
0.091
0.010
0.025-0.050
0.61
0.225
0.331
0.163
0.005
0.050-0.100
0.79
0.225
0.269
0.093
0.008
0.100-0.200
1.12
0.285
0.225
0.117
0.005
0.200-0.300
1.03
0.295
0.254
0.133
0.003
0.300-1.300
0.60
0.291
0.376
0.309
0.007
1.300-2.000
6.21
4.215
0.628
0.257
0.028
2.000-3.000
2.11
3.800
0.967
1.520
0.077
Table Supp.CLXII: Statistical covariance matrix of measured cross section ratio of water over scintillator in
Bin edges (GeV)
0.000-0.025
0.025-0.050
0.050-0.100
0.100-0.200
0.200-0.300
0.300-1.300
1.300-2.000
2.000-3.000
0.000-0.025
0.0505
0.0079
-0.0051
-0.0020
-0.0002
-0.0001
-0.0000
-0.0000
0.025-0.050
0.0079
0.0409
0.0165
-0.0050
-0.0029
-0.0002
-0.0012
-0.0000
0.050-0.100
-0.0051
0.0165
0.0452
0.0068
-0.0055
-0.0014
-0.0070
-0.0007
0.100-0.200
-0.0020
-0.0050
0.0068
0.0641
0.0219
-0.0057
-0.0184
-0.0060
0.200-0.300
-0.0002
-0.0029
-0.0055
0.0219
0.0683
0.0069
-0.0417
0.0018
0.300-1.300
-0.0001
-0.0002
-0.0014
-0.0057
0.0069
0.0505
0.0168
-0.0113
1.300-2.000
-0.0000
-0.0012
-0.0070
-0.0184
-0.0417
0.0168
15.2090
0.0360
2.000-3.000
-0.0000
-0.0000
-0.0007
-0.0060
0.0018
-0.0113
0.0360
4.1625
Table Supp.CLXIII: Systematic covariance matrix of measured cross section ratio of water over scintillator in
Bin edges (GeV)
0.000-0.025
0.025-0.050
0.050-0.100
0.100-0.200
0.200-0.300
0.300-1.300
1.300-2.000
2.000-3.000
0.000-0.025
0.003
0.005
0.003
0.002
0.001
-0.001
0.009
-0.009
0.025-0.050
0.005
0.010
0.005
0.007
0.004
0.003
0.017
-0.002
0.050-0.100
0.003
0.005
0.005
0.004
0.004
0.007
0.016
0.014
0.100-0.200
0.002
0.007
0.004
0.017
0.012
0.011
0.031
0.059
0.200-0.300
0.001
0.004
0.004
0.012
0.019
0.016
0.019
0.082
0.300-1.300
-0.001
0.003
0.007
0.011
0.016
0.034
0.075
0.147
1.300-2.000
0.009
0.017
0.016
0.031
0.019
0.075
2.555
0.282
2.000-3.000
-0.009
-0.002
0.014
0.059
0.082
0.147
0.282
10.275
Table Supp.CLXIV: Measured cross section ratio of water over scintillator in , and the absolute and fractional cross section ratio uncertainties
Bin edges (GeV/c2)
Ratio
Abs. Unc.
Frac. Stat. Unc.
Frac. Sys. Unc.
Frac. Flux Unc.
0.9-1.1
2.88
2.560
0.852
0.250
0.023
1.1-1.2
1.54
0.367
0.208
0.115
0.007
1.2-1.3
0.51
0.239
0.369
0.296
0.008
1.3-1.4
0.20
0.184
0.666
0.613
0.015
Table Supp.CLXV: Statistical covariance matrix of measured cross section ratio of water over scintillator in
Bin edges (GeV/c2)
0.9-1.1
1.1-1.2
1.2-1.3
1.3-1.4
0.9-1.1
6.0348
-0.2345
-0.0974
-0.0478
1.1-1.2
-0.2345
0.1030
-0.0183
-0.0113
1.2-1.3
-0.0974
-0.0183
0.0347
0.0201
1.3-1.4
-0.0478
-0.0113
0.0201
0.0183
Table Supp.CLXVI: Systematic covariance matrix of measured cross section ratio of water over scintillator in
Bin edges (GeV/c2)
0.9-1.1
1.1-1.2
1.2-1.3
1.3-1.4
0.9-1.1
0.521
0.012
0.008
0.002
1.1-1.2
0.012
0.032
0.000
-0.001
1.2-1.3
0.008
0.000
0.022
0.018
1.3-1.4
0.002
-0.001
0.018
0.015
Table Supp.CLXVII: Measured cross section ratio of water over scintillator in , and the absolute and fractional cross section ratio uncertainties
Bin edges (GeV)
Ratio
Abs. Unc.
Frac. Stat. Unc.
Frac. Sys. Unc.
Frac. Flux Unc.
0.035-0.100
1.14
0.282
0.227
0.096
0.007
0.100-0.150
0.84
0.189
0.195
0.113
0.002
0.150-0.200
0.91
0.278
0.265
0.154
0.003
0.200-0.350
0.85
0.365
0.350
0.250
0.010
Table Supp.CLXVIII: Statistical covariance matrix of measured cross section ratio of water over scintillator in
Bin edges (GeV)
0.035-0.100
0.100-0.150
0.150-0.200
0.200-0.350
0.035-0.100
0.0676
0.0068
-0.0075
-0.0044
0.100-0.150
0.0068
0.0268
0.0048
-0.0031
0.150-0.200
-0.0075
0.0048
0.0576
0.0103
0.200-0.350
-0.0044
-0.0031
0.0103
0.0880
Table Supp.CLXIX: Systematic covariance matrix of measured cross section ratio of water over scintillator in
Bin edges (GeV)
0.035-0.100
0.100-0.150
0.150-0.200
0.200-0.350
0.035-0.100
0.012
0.007
0.007
0.011
0.100-0.150
0.007
0.009
0.009
0.014
0.150-0.200
0.007
0.009
0.020
0.023
0.200-0.350
0.011
0.014
0.023
0.045
Table Supp.CLXX: Measured cross section ratio of water over scintillator in , and the absolute and fractional cross section ratio uncertainties
Bin edges (degree)
Ratio
Abs. Unc.
Frac. Stat. Unc.
Frac. Sys. Unc.
Frac. Flux Unc.
0-10
1.01
0.940
0.901
0.251
0.010
10-20
0.59
0.312
0.482
0.211
0.013
20-30
0.73
0.255
0.308
0.170
0.007
30-40
0.68
0.266
0.325
0.219
0.005
40-50
0.87
0.254
0.260
0.131
0.008
50-60
1.34
0.345
0.243
0.085
0.006
60-120
1.08
0.318
0.279
0.090
0.003
120-135
1.11
0.585
0.503
0.165
0.007
135-150
1.30
0.582
0.429
0.132
0.009
150-165
0.94
0.860
0.853
0.336
0.008
165-180
0.50
0.752
1.423
0.487
0.014
Table Supp.CLXXI: Statistical covariance matrix of measured cross section ratio of water over scintillator in
Bin edges (degree)
0-10
10-20
20-30
30-40
40-50
50-60
60-120
120-135
135-150
150-165
165-180
0-10
0.8207
0.0635
-0.0173
0.0020
-0.0045
-0.0046
-0.0045
-0.0042
-0.0049
-0.0030
0.0294
10-20
0.0635
0.0816
0.0165
-0.0030
-0.0030
0.0012
-0.0052
-0.0040
0.0028
-0.0020
0.1282
20-30
-0.0173
0.0165
0.0498
0.0082
-0.0017
-0.0052
-0.0011
-0.0008
-0.0035
-0.0044
-0.0028
30-40
0.0020
-0.0030
0.0082
0.0487
0.0103
-0.0038
0.0029
-0.0065
-0.0036
-0.0024
-0.0074
40-50
-0.0045
-0.0030
-0.0017
0.0103
0.0514
0.0145
0.0001
-0.0021
0.0033
-0.0130
-0.0017
50-60
-0.0046
0.0012
-0.0052
-0.0038
0.0145
0.1063
0.0286
-0.0060
-0.0166
-0.0156
0.0068
60-120
-0.0045
-0.0052
-0.0011
0.0029
0.0001
0.0286
0.0914
0.0155
0.0009
0.0090
-0.0075
120-135
-0.0042
-0.0040
-0.0008
-0.0065
-0.0021
-0.0060
0.0155
0.3089
0.0888
0.0063
-0.0054
135-150
-0.0049
0.0028
-0.0035
-0.0036
0.0033
-0.0166
0.0009
0.0888
0.3099
0.2742
0.0028
150-165
-0.0030
-0.0020
-0.0044
-0.0024
-0.0130
-0.0156
0.0090
0.0063
0.2742
0.6408
-0.0054
165-180
0.0294
0.1282
-0.0028
-0.0074
-0.0017
0.0068
-0.0075
-0.0054
0.0028
-0.0054
0.5064
Table Supp.CLXXII: Systematic covariance matrix of measured cross section ratio of water over scintillator in
Bin edges (degree)
0-10
10-20
20-30
30-40
40-50
50-60
60-120
120-135
135-150
150-165
165-180
0-10
0.064
0.006
0.011
0.021
0.013
0.009
0.006
0.021
0.005
-0.007
0.017
10-20
0.006
0.016
0.012
0.008
0.007
0.004
0.006
0.009
0.006
0.012
0.014
20-30
0.011
0.012
0.015
0.013
0.010
0.007
0.006
0.010
0.008
0.014
0.010
30-40
0.021
0.008
0.013
0.022
0.014
0.009
0.008
0.007
0.013
0.009
0.006
40-50
0.013
0.007
0.010
0.014
0.013
0.009
0.008
0.009
0.012
0.013
0.005
50-60
0.009
0.004
0.007
0.009
0.009
0.013
0.007
0.010
0.009
0.014
-0.000
60-120
0.006
0.006
0.006
0.008
0.008
0.007
0.009
0.006
0.009
0.003
0.000
120-135
0.021
0.009
0.010
0.007
0.009
0.010
0.006
0.033
0.003
0.016
0.016
135-150
0.005
0.006
0.008
0.013
0.012
0.009
0.009
0.003
0.029
0.032
-0.013
150-165
-0.007
0.012
0.014
0.009
0.013
0.014
0.003
0.016
0.032
0.100
-0.008
165-180
0.017
0.014
0.010
0.006
0.005
-0.000
0.000
0.016
-0.013
-0.008
0.059
Table Supp.CLXXIII: Measured cross section ratio of iron over scintillator in , and the absolute and fractional cross section ratio uncertainties
Bin edges (GeV/c)
Ratio
Abs. Unc.
Frac. Stat. Unc.
Frac. Sys. Unc.
Frac. Flux Unc.
1.5-3.0
0.86
0.163
0.157
0.105
0.004
3.0-4.0
0.78
0.125
0.110
0.116
0.007
4.0-5.0
0.62
0.102
0.099
0.132
0.009
5.0-6.0
0.62
0.098
0.090
0.130
0.006
6.0-7.0
0.60
0.100
0.095
0.136
0.005
7.0-8.5
0.59
0.114
0.120
0.152
0.015
8.5-10.0
0.66
0.139
0.147
0.150
0.012
10.0-20.0
0.94
0.218
0.174
0.154
0.005
Table Supp.CLXXIV: Statistical covariance matrix of measured cross section ratio of iron over scintillator in
Bin edges (GeV/c)
1.5-3.0
3.0-4.0
4.0-5.0
5.0-6.0
6.0-7.0
7.0-8.5
8.5-10.0
10.0-20.0
1.5-3.0
0.0184
0.0023
0.0003
0.0002
0.0001
0.0000
0.0002
0.0002
3.0-4.0
0.0023
0.0074
0.0013
0.0003
0.0001
0.0001
0.0001
0.0002
4.0-5.0
0.0003
0.0013
0.0038
0.0013
0.0004
0.0001
0.0001
0.0001
5.0-6.0
0.0002
0.0003
0.0013
0.0031
0.0014
0.0004
0.0002
0.0002
6.0-7.0
0.0001
0.0001
0.0004
0.0014
0.0033
0.0018
0.0007
0.0004
7.0-8.5
0.0000
0.0001
0.0001
0.0004
0.0018
0.0050
0.0035
0.0014
8.5-10.0
0.0002
0.0001
0.0001
0.0002
0.0007
0.0035
0.0095
0.0060
10.0-20.0
0.0002
0.0002
0.0001
0.0002
0.0004
0.0014
0.0060
0.0266
Table Supp.CLXXV: Systematic covariance matrix of measured cross section ratio of iron over scintillator in
Bin edges (GeV/c)
1.5-3.0
3.0-4.0
4.0-5.0
5.0-6.0
6.0-7.0
7.0-8.5
8.5-10.0
10.0-20.0
1.5-3.0
0.008
0.006
0.005
0.005
0.005
0.004
0.005
0.008
3.0-4.0
0.006
0.008
0.007
0.007
0.007
0.007
0.008
0.011
4.0-5.0
0.005
0.007
0.007
0.006
0.006
0.006
0.007
0.009
5.0-6.0
0.005
0.007
0.006
0.007
0.006
0.007
0.007
0.010
6.0-7.0
0.005
0.007
0.006
0.006
0.007
0.007
0.007
0.010
7.0-8.5
0.004
0.007
0.006
0.007
0.007
0.008
0.008
0.011
8.5-10.0
0.005
0.008
0.007
0.007
0.007
0.008
0.010
0.012
10.0-20.0
0.008
0.011
0.009
0.010
0.010
0.011
0.012
0.021
Table Supp.CLXXVI: Measured cross section ratio of iron over scintillator in , and the absolute and fractional cross section ratio uncertainties
Bin edges (degree)
Ratio
Abs. Unc.
Frac. Stat. Unc.
Frac. Sys. Unc.
Frac. Flux Unc.
0-2
0.62
0.093
0.130
0.076
0.002
2-3
0.59
0.090
0.132
0.078
0.002
3-4
0.62
0.102
0.133
0.096
0.001
4-5
0.53
0.113
0.161
0.138
0.004
5-6
0.48
0.143
0.207
0.212
0.003
6-8
0.71
0.159
0.143
0.173
0.002
8-10
0.94
0.241
0.182
0.181
0.003
10-13
0.89
0.321
0.275
0.234
0.006
Table Supp.CLXXVII: Statistical covariance matrix of measured cross section ratio of iron over scintillator in
Bin edges (degree)
0-2
2-3
3-4
4-5
5-6
6-8
8-10
10-13
0-2
0.0065
0.0001
-0.0005
-0.0001
0.0000
0.0000
-0.0000
-0.0001
2-3
0.0001
0.0060
0.0008
-0.0006
-0.0002
-0.0000
-0.0000
-0.0000
3-4
-0.0005
0.0008
0.0069
0.0010
-0.0007
-0.0001
-0.0000
-0.0001
4-5
-0.0001
-0.0006
0.0010
0.0074
0.0016
-0.0005
-0.0001
0.0000
5-6
0.0000
-0.0002
-0.0007
0.0016
0.0100
0.0006
-0.0007
-0.0001
6-8
0.0000
-0.0000
-0.0001
-0.0005
0.0006
0.0104
-0.0002
-0.0009
8-10
-0.0000
-0.0000
-0.0000
-0.0001
-0.0007
-0.0002
0.0291
-0.0009
10-13
-0.0001
-0.0000
-0.0001
0.0000
-0.0001
-0.0009
-0.0009
0.0599
Table Supp.CLXXVIII: Systematic covariance matrix of measured cross section ratio of iron over scintillator in
Bin edges (degree)
0-2
2-3
3-4
4-5
5-6
6-8
8-10
10-13
0-2
0.002
0.001
0.001
0.001
0.002
0.002
0.003
0.004
2-3
0.001
0.002
0.002
0.003
0.004
0.004
0.006
0.007
3-4
0.001
0.002
0.004
0.004
0.005
0.006
0.009
0.011
4-5
0.001
0.003
0.004
0.005
0.007
0.008
0.011
0.013
5-6
0.002
0.004
0.005
0.007
0.010
0.011
0.016
0.018
6-8
0.002
0.004
0.006
0.008
0.011
0.015
0.019
0.023
8-10
0.003
0.006
0.009
0.011
0.016
0.019
0.029
0.032
10-13
0.004
0.007
0.011
0.013
0.018
0.023
0.032
0.043
Table Supp.CLXXIX: Measured cross section ratio of iron over scintillator in , and the absolute and fractional cross section ratio uncertainties
Bin edges (GeV/c)
Ratio
Abs. Unc.
Frac. Stat. Unc.
Frac. Sys. Unc.
Frac. Flux Unc.
1.5-3.0
0.82
0.164
0.164
0.114
0.005
3.0-4.0
0.81
0.126
0.107
0.113
0.006
4.0-5.0
0.61
0.102
0.100
0.133
0.009
5.0-6.0
0.61
0.098
0.091
0.132
0.006
6.0-7.0
0.61
0.101
0.095
0.137
0.005
7.0-8.5
0.60
0.115
0.120
0.152
0.015
8.5-10.0
0.65
0.134
0.150
0.144
0.013
10.0-20.0
0.95
0.219
0.174
0.150
0.004
Table Supp.CLXXX: Statistical covariance matrix of measured cross section ratio of iron over scintillator in
Bin edges (GeV/c)
1.5-3.0
3.0-4.0
4.0-5.0
5.0-6.0
6.0-7.0
7.0-8.5
8.5-10.0
10.0-20.0
1.5-3.0
0.0181
0.0021
0.0003
0.0002
0.0001
0.0000
0.0002
0.0002
3.0-4.0
0.0021
0.0075
0.0013
0.0003
0.0001
0.0001
0.0001
0.0002
4.0-5.0
0.0003
0.0013
0.0037
0.0013
0.0004
0.0001
0.0001
0.0001
5.0-6.0
0.0002
0.0003
0.0013
0.0031
0.0014
0.0004
0.0002
0.0002
6.0-7.0
0.0001
0.0001
0.0004
0.0014
0.0033
0.0018
0.0007
0.0004
7.0-8.5
0.0000
0.0001
0.0001
0.0004
0.0018
0.0051
0.0034
0.0013
8.5-10.0
0.0002
0.0001
0.0001
0.0002
0.0007
0.0034
0.0093
0.0060
10.0-20.0
0.0002
0.0002
0.0001
0.0002
0.0004
0.0013
0.0060
0.0275
Table Supp.CLXXXI: Systematic covariance matrix of measured cross section ratio of iron over scintillator in
Bin edges (GeV/c)
1.5-3.0
3.0-4.0
4.0-5.0
5.0-6.0
6.0-7.0
7.0-8.5
8.5-10.0
10.0-20.0
1.5-3.0
0.009
0.006
0.006
0.005
0.005
0.005
0.006
0.009
3.0-4.0
0.006
0.008
0.007
0.007
0.007
0.008
0.008
0.012
4.0-5.0
0.006
0.007
0.007
0.006
0.006
0.006
0.006
0.009
5.0-6.0
0.005
0.007
0.006
0.006
0.006
0.007
0.007
0.009
6.0-7.0
0.005
0.007
0.006
0.006
0.007
0.007
0.007
0.010
7.0-8.5
0.005
0.008
0.006
0.007
0.007
0.008
0.008
0.011
8.5-10.0
0.006
0.008
0.006
0.007
0.007
0.008
0.009
0.011
10.0-20.0
0.009
0.012
0.009
0.009
0.010
0.011
0.011
0.021
Table Supp.CLXXXII: Measured cross section ratio of iron over scintillator in , and the absolute and fractional cross section ratio uncertainties
Bin edges (GeV/c)
Ratio
Abs. Unc.
Frac. Stat. Unc.
Frac. Sys. Unc.
Frac. Flux Unc.
0.00-0.15
0.58
0.115
0.179
0.084
0.003
0.15-0.30
0.59
0.078
0.110
0.074
0.001
0.30-0.45
0.59
0.089
0.111
0.100
0.001
0.45-0.60
0.70
0.121
0.111
0.132
0.001
0.60-0.75
0.62
0.168
0.161
0.217
0.003
0.75-0.90
0.70
0.263
0.215
0.306
0.008
0.90-1.25
1.01
0.395
0.293
0.260
0.008
1.25-2.50
1.50
1.483
0.912
0.390
0.014
Table Supp.CLXXXIII: Statistical covariance matrix of measured cross section ratio of iron over scintillator in
Bin edges (GeV/c)
0.00-0.15
0.15-0.30
0.30-0.45
0.45-0.60
0.60-0.75
0.75-0.90
0.90-1.25
1.25-2.50
0.00-0.15
0.0109
0.0001
-0.0005
-0.0001
-0.0000
-0.0000
-0.0000
-0.0000
0.15-0.30
0.0001
0.0042
0.0003
-0.0004
-0.0001
-0.0000
-0.0001
-0.0004
0.30-0.45
-0.0005
0.0003
0.0043
0.0005
-0.0004
-0.0003
-0.0003
-0.0001
0.45-0.60
-0.0001
-0.0004
0.0005
0.0061
0.0012
-0.0009
-0.0010
-0.0005
0.60-0.75
-0.0000
-0.0001
-0.0004
0.0012
0.0100
0.0037
-0.0022
-0.0006
0.75-0.90
-0.0000
-0.0000
-0.0003
-0.0009
0.0037
0.0229
0.0145
-0.0136
0.90-1.25
-0.0000
-0.0001
-0.0003
-0.0010
-0.0022
0.0145
0.0872
0.0567
1.25-2.50
-0.0000
-0.0004
-0.0001
-0.0005
-0.0006
-0.0136
0.0567
1.8586
Table Supp.CLXXXIV: Systematic covariance matrix of measured cross section ratio of iron over scintillator in
Bin edges (GeV/c)
0.00-0.15
0.15-0.30
0.30-0.45
0.45-0.60
0.60-0.75
0.75-0.90
0.90-1.25
1.25-2.50
0.00-0.15
0.002
0.001
0.000
0.000
0.001
-0.000
0.002
0.001
0.15-0.30
0.001
0.002
0.002
0.003
0.004
0.006
0.008
0.011
0.30-0.45
0.000
0.002
0.004
0.005
0.007
0.011
0.013
0.018
0.45-0.60
0.000
0.003
0.005
0.009
0.011
0.019
0.021
0.032
0.60-0.75
0.001
0.004
0.007
0.011
0.018
0.027
0.032
0.043
0.75-0.90
-0.000
0.006
0.011
0.019
0.027
0.046
0.051
0.078
0.90-1.25
0.002
0.008
0.013
0.021
0.032
0.051
0.069
0.100
1.25-2.50
0.001
0.011
0.018
0.032
0.043
0.078
0.100
0.340
Table Supp.CLXXXV: Measured cross section ratio of iron over scintillator in , and the absolute and fractional cross section ratio uncertainties
Bin edges (GeV)
Ratio
Abs. Unc.
Frac. Stat. Unc.
Frac. Sys. Unc.
Frac. Flux Unc.
0.000-0.025
0.56
0.108
0.172
0.084
0.003
0.025-0.050
0.54
0.088
0.147
0.071
0.003
0.050-0.100
0.57
0.086
0.127
0.082
0.002
0.100-0.200
0.62
0.090
0.109
0.096
0.001
0.200-0.300
0.72
0.115
0.124
0.099
0.002
0.300-0.400
0.67
0.138
0.141
0.149
0.002
0.400-0.500
0.58
0.159
0.174
0.211
0.002
0.500-0.700
0.62
0.211
0.203
0.275
0.005
0.700-1.000
0.81
0.298
0.230
0.286
0.007
1.000-1.300
1.05
0.438
0.339
0.244
0.006
1.300-2.000
0.82
0.721
0.704
0.524
0.033
2.000-3.000
0.80
0.898
1.010
0.489
0.021
Table Supp.CLXXXVI: Statistical covariance matrix of measured cross section ratio of iron over scintillator in
Bin edges (GeV)
0.000-0.025
0.025-0.050
0.050-0.100
0.100-0.200
0.200-0.300
0.300-0.400
0.400-0.500
0.500-0.700
0.700-1.000
1.000-1.300
1.300-2.000
2.000-3.000
0.000-0.025
0.0094
0.0017
-0.0007
-0.0003
-0.0000
-0.0000
-0.0000
-0.0000
-0.0000
-0.0000
-0.0000
0.0000
0.025-0.050
0.0017
0.0063
0.0018
-0.0004
-0.0003
-0.0000
-0.0000
-0.0000
-0.0000
-0.0000
-0.0001
-0.0001
0.050-0.100
-0.0007
0.0018
0.0053
0.0009
-0.0006
-0.0003
-0.0001
-0.0000
-0.0000
-0.0000
-0.0002
-0.0003
0.100-0.200
-0.0003
-0.0004
0.0009
0.0046
0.0011
-0.0004
-0.0005
-0.0002
-0.0002
-0.0004
0.0001
0.0003
0.200-0.300
-0.0000
-0.0003
-0.0006
0.0011
0.0081
0.0026
0.0000
-0.0007
-0.0006
-0.0007
-0.0011
-0.0020
0.300-0.400
-0.0000
-0.0000
-0.0003
-0.0004
0.0026
0.0090
0.0041
-0.0004
-0.0011
-0.0008
-0.0003
0.0026
0.400-0.500
-0.0000
-0.0000
-0.0001
-0.0005
0.0000
0.0041
0.0102
0.0049
-0.0008
-0.0031
-0.0009
0.0014
0.500-0.700
-0.0000
-0.0000
-0.0000
-0.0002
-0.0007
-0.0004
0.0049
0.0157
0.0068
-0.0015
-0.0015
-0.0020
0.700-1.000
-0.0000
-0.0000
-0.0000
-0.0002
-0.0006
-0.0011
-0.0008
0.0068
0.0348
0.0295
0.0017
-0.0016
1.000-1.300
-0.0000
-0.0000
-0.0000
-0.0004
-0.0007
-0.0008
-0.0031
-0.0015
0.0295
0.1264
0.0751
-0.0011
1.300-2.000
-0.0000
-0.0001
-0.0002
0.0001
-0.0011
-0.0003
-0.0009
-0.0015
0.0017
0.0751
0.3339
0.1520
2.000-3.000
0.0000
-0.0001
-0.0003
0.0003
-0.0020
0.0026
0.0014
-0.0020
-0.0016
-0.0011
0.1520
0.6530
Table Supp.CLXXXVII: Systematic covariance matrix of measured cross section ratio of iron over scintillator in
Bin edges (GeV)
0.000-0.025
0.025-0.050
0.050-0.100
0.100-0.200
0.200-0.300
0.300-0.400
0.400-0.500
0.500-0.700
0.700-1.000
1.000-1.300
1.300-2.000
2.000-3.000
0.000-0.025
0.002
0.001
0.001
0.000
0.000
-0.000
0.000
0.000
-0.000
0.002
0.002
-0.002
0.025-0.050
0.001
0.001
0.001
0.001
0.001
0.002
0.002
0.003
0.004
0.005
0.007
0.004
0.050-0.100
0.001
0.001
0.002
0.002
0.003
0.004
0.004
0.006
0.008
0.009
0.012
0.010
0.100-0.200
0.000
0.001
0.002
0.004
0.004
0.005
0.006
0.009
0.012
0.014
0.019
0.015
0.200-0.300
0.000
0.001
0.003
0.004
0.005
0.007
0.008
0.011
0.015
0.015
0.021
0.020
0.300-0.400
-0.000
0.002
0.004
0.005
0.007
0.010
0.011
0.015
0.020
0.021
0.028
0.030
0.400-0.500
0.000
0.002
0.004
0.006
0.008
0.011
0.015
0.019
0.026
0.027
0.042
0.037
0.500-0.700
0.000
0.003
0.006
0.009
0.011
0.015
0.019
0.029
0.037
0.038
0.060
0.049
0.700-1.000
-0.000
0.004
0.008
0.012
0.015
0.020
0.026
0.037
0.054
0.051
0.077
0.069
1.000-1.300
0.002
0.005
0.009
0.014
0.015
0.021
0.027
0.038
0.051
0.066
0.091
0.066
1.300-2.000
0.002
0.007
0.012
0.019
0.021
0.028
0.042
0.060
0.077
0.091
0.185
0.122
2.000-3.000
-0.002
0.004
0.010
0.015
0.020
0.030
0.037
0.049
0.069
0.066
0.122
0.153
Table Supp.CLXXXVIII: Measured cross section ratio of iron over scintillator in , and the absolute and fractional cross section ratio uncertainties
Bin edges (GeV/c2)
Ratio
Abs. Unc.
Frac. Stat. Unc.
Frac. Sys. Unc.
Frac. Flux Unc.
0.9-1.1
0.56
0.291
0.488
0.170
0.013
1.1-1.2
0.70
0.113
0.136
0.086
0.002
1.2-1.3
0.65
0.123
0.098
0.162
0.002
1.3-1.4
0.60
0.220
0.182
0.319
0.003
Table Supp.CLXXXIX: Statistical covariance matrix of measured cross section ratio of iron over scintillator in
Bin edges (GeV/c2)
0.9-1.1
1.1-1.2
1.2-1.3
1.3-1.4
0.9-1.1
0.0757
0.0031
-0.0058
-0.0026
1.1-1.2
0.0031
0.0090
-0.0022
-0.0059
1.2-1.3
-0.0058
-0.0022
0.0040
0.0037
1.3-1.4
-0.0026
-0.0059
0.0037
0.0118
Table Supp.CXC: Systematic covariance matrix of measured cross section ratio of iron over scintillator in
Bin edges (GeV/c2)
0.9-1.1
1.1-1.2
1.2-1.3
1.3-1.4
0.9-1.1
0.009
0.002
0.004
0.006
1.1-1.2
0.002
0.004
-0.001
-0.004
1.2-1.3
0.004
-0.001
0.011
0.019
1.3-1.4
0.006
-0.004
0.019
0.036
Table Supp.CXCI: Measured cross section ratio of iron over scintillator in , and the absolute and fractional cross section ratio uncertainties
Bin edges (GeV)
Ratio
Abs. Unc.
Frac. Stat. Unc.
Frac. Sys. Unc.
Frac. Flux Unc.
0.035-0.100
0.74
0.101
0.083
0.110
0.001
0.100-0.150
0.67
0.083
0.070
0.102
0.002
0.150-0.200
0.69
0.121
0.102
0.142
0.001
0.200-0.350
0.55
0.217
0.210
0.332
0.003
Table Supp.CXCII: Statistical covariance matrix of measured cross section ratio of iron over scintillator in
Bin edges (GeV)
0.035-0.100
0.100-0.150
0.150-0.200
0.200-0.350
0.035-0.100
0.0037
0.0011
-0.0006
-0.0006
0.100-0.150
0.0011
0.0022
0.0009
-0.0003
0.150-0.200
-0.0006
0.0009
0.0050
0.0024
0.200-0.350
-0.0006
-0.0003
0.0024
0.0134
Table Supp.CXCIII: Systematic covariance matrix of measured cross section ratio of iron over scintillator in
Bin edges (GeV)
0.035-0.100
0.100-0.150
0.150-0.200
0.200-0.350
0.035-0.100
0.007
0.004
0.005
0.008
0.100-0.150
0.004
0.005
0.006
0.010
0.150-0.200
0.005
0.006
0.010
0.017
0.200-0.350
0.008
0.010
0.017
0.034
Table Supp.CXCIV: Measured cross section ratio of iron over scintillator in , and the absolute and fractional cross section ratio uncertainties
Bin edges (degree)
Ratio
Abs. Unc.
Frac. Stat. Unc.
Frac. Sys. Unc.
Frac. Flux Unc.
0-10
1.12
0.484
0.403
0.153
0.002
10-20
0.71
0.190
0.218
0.153
0.006
20-30
0.65
0.130
0.137
0.147
0.001
30-40
0.62
0.116
0.121
0.141
0.001
40-50
0.61
0.106
0.111
0.134
0.003
50-60
0.73
0.115
0.109
0.114
0.001
60-120
0.73
0.111
0.109
0.106
0.002
120-135
0.74
0.178
0.189
0.149
0.002
135-150
0.63
0.193
0.256
0.171
0.006
150-165
0.62
0.341
0.496
0.242
0.006
165-180
1.64
1.981
1.107
0.482
0.017
Table Supp.CXCV: Statistical covariance matrix of measured cross section ratio of iron over scintillator in
Bin edges (degree)
0-10
10-20
20-30
30-40
40-50
50-60
60-120
120-135
135-150
150-165
165-180
0-10
0.2045
0.0238
-0.0016
-0.0003
0.0001
-0.0006
-0.0006
-0.0007
0.0009
0.0022
-0.0007
10-20
0.0238
0.0242
0.0039
-0.0006
-0.0008
-0.0004
-0.0002
-0.0005
-0.0005
-0.0005
-0.0012
20-30
-0.0016
0.0039
0.0079
0.0020
-0.0003
-0.0005
-0.0003
-0.0005
-0.0001
0.0003
-0.0016
30-40
-0.0003
-0.0006
0.0020
0.0057
0.0019
-0.0004
-0.0004
-0.0005
0.0002
0.0004
-0.0022
40-50
0.0001
-0.0008
-0.0003
0.0019
0.0046
0.0019
-0.0003
-0.0003
-0.0000
-0.0004
-0.0016
50-60
-0.0006
-0.0004
-0.0005
-0.0004
0.0019
0.0063
0.0020
-0.0006
-0.0009
-0.0011
0.0002
60-120
-0.0006
-0.0002
-0.0003
-0.0004
-0.0003
0.0020
0.0063
0.0017
-0.0003
-0.0002
0.0039
120-135
-0.0007
-0.0005
-0.0005
-0.0005
-0.0003
-0.0006
0.0017
0.0196
0.0083
0.0014
-0.0208
135-150
0.0009
-0.0005
-0.0001
0.0002
-0.0000
-0.0009
-0.0003
0.0083
0.0259
0.0242
0.0300
150-165
0.0022
-0.0005
0.0003
0.0004
-0.0004
-0.0011
-0.0002
0.0014
0.0242
0.0940
0.3147
165-180
-0.0007
-0.0012
-0.0016
-0.0022
-0.0016
0.0002
0.0039
-0.0208
0.0300
0.3147
3.3000
Table Supp.CXCVI: Systematic covariance matrix of measured cross section ratio of iron over scintillator in
Bin edges (degree)
0-10
10-20
20-30
30-40
40-50
50-60
60-120
120-135
135-150
150-165
165-180
0-10
0.030
0.014
0.012
0.011
0.010
0.011
0.011
0.014
0.010
0.012
-0.043
10-20
0.014
0.012
0.009
0.008
0.008
0.007
0.006
0.009
0.007
0.011
-0.015
20-30
0.012
0.009
0.009
0.008
0.007
0.006
0.006
0.009
0.008
0.010
-0.007
30-40
0.011
0.008
0.008
0.008
0.007
0.006
0.006
0.008
0.006
0.009
0.000
40-50
0.010
0.008
0.007
0.007
0.007
0.006
0.005
0.008
0.007
0.008
-0.003
50-60
0.011
0.007
0.006
0.006
0.006
0.007
0.006
0.008
0.007
0.006
0.001
60-120
0.011
0.006
0.006
0.006
0.005
0.006
0.006
0.007
0.005
0.006
0.005
120-135
0.014
0.009
0.009
0.008
0.008
0.008
0.007
0.012
0.010
0.011
-0.009
135-150
0.010
0.007
0.008
0.006
0.007
0.007
0.005
0.010
0.011
0.011
-0.011
150-165
0.012
0.011
0.010
0.009
0.008
0.006
0.006
0.011
0.011
0.022
-0.003
165-180
-0.043
-0.015
-0.007
0.000
-0.003
0.001
0.005
-0.009
-0.011
-0.003
0.626
Table Supp.CXCVII: Measured cross section ratio of lead over scintillator in , and the absolute and fractional cross section ratio uncertainties
Bin edges (GeV/c)
Ratio
Abs. Unc.
Frac. Stat. Unc.
Frac. Sys. Unc.
Frac. Flux Unc.
1.5-3.0
0.43
0.108
0.225
0.109
0.007
3.0-4.0
0.50
0.088
0.140
0.106
0.008
4.0-5.0
0.43
0.069
0.108
0.120
0.008
5.0-6.0
0.40
0.066
0.102
0.129
0.004
6.0-7.0
0.35
0.060
0.117
0.130
0.006
7.0-8.5
0.34
0.062
0.134
0.117
0.017
8.5-10.0
0.38
0.083
0.182
0.120
0.023
10.0-20.0
0.38
0.133
0.310
0.166
0.035
Table Supp.CXCVIII: Statistical covariance matrix of measured cross section ratio of lead over scintillator in
Bin edges (GeV/c)
1.5-3.0
3.0-4.0
4.0-5.0
5.0-6.0
6.0-7.0
7.0-8.5
8.5-10.0
10.0-20.0
1.5-3.0
0.0094
0.0012
0.0002
0.0000
0.0001
0.0000
0.0000
0.0000
3.0-4.0
0.0012
0.0049
0.0010
0.0002
0.0001
0.0000
0.0000
0.0000
4.0-5.0
0.0002
0.0010
0.0022
0.0007
0.0002
0.0001
0.0001
0.0000
5.0-6.0
0.0000
0.0002
0.0007
0.0017
0.0009
0.0003
0.0001
0.0001
6.0-7.0
0.0001
0.0001
0.0002
0.0009
0.0016
0.0010
0.0004
0.0002
7.0-8.5
0.0000
0.0000
0.0001
0.0003
0.0010
0.0021
0.0017
0.0007
8.5-10.0
0.0000
0.0000
0.0001
0.0001
0.0004
0.0017
0.0048
0.0038
10.0-20.0
0.0000
0.0000
0.0000
0.0001
0.0002
0.0007
0.0038
0.0139
Table Supp.CXCIX: Systematic covariance matrix of measured cross section ratio of lead over scintillator in
Bin edges (GeV/c)
1.5-3.0
3.0-4.0
4.0-5.0
5.0-6.0
6.0-7.0
7.0-8.5
8.5-10.0
10.0-20.0
1.5-3.0
0.002
0.002
0.002
0.002
0.002
0.001
0.001
0.002
3.0-4.0
0.002
0.003
0.002
0.002
0.002
0.001
0.002
0.002
4.0-5.0
0.002
0.002
0.003
0.003
0.002
0.002
0.001
0.002
5.0-6.0
0.002
0.002
0.003
0.003
0.002
0.002
0.002
0.002
6.0-7.0
0.002
0.002
0.002
0.002
0.002
0.002
0.002
0.002
7.0-8.5
0.001
0.001
0.002
0.002
0.002
0.002
0.002
0.002
8.5-10.0
0.001
0.002
0.001
0.002
0.002
0.002
0.002
0.002
10.0-20.0
0.002
0.002
0.002
0.002
0.002
0.002
0.002
0.004
Table Supp.CC: Measured cross section ratio of lead over scintillator in , and the absolute and fractional cross section ratio uncertainties
Bin edges (degree)
Ratio
Abs. Unc.
Frac. Stat. Unc.
Frac. Sys. Unc.
Frac. Flux Unc.
0-2
0.35
0.070
0.180
0.084
0.006
2-3
0.37
0.069
0.168
0.081
0.003
3-4
0.30
0.063
0.178
0.109
0.003
4-5
0.34
0.072
0.179
0.113
0.006
5-6
0.31
0.084
0.220
0.154
0.006
6-8
0.36
0.090
0.192
0.159
0.003
8-10
0.59
0.156
0.205
0.165
0.002
10-13
0.78
0.237
0.255
0.162
0.005
Table Supp.CCI: Statistical covariance matrix of measured cross section ratio of lead over scintillator in
Bin edges (degree)
0-2
2-3
3-4
4-5
5-6
6-8
8-10
10-13
0-2
0.0040
0.0001
-0.0003
-0.0000
0.0000
-0.0000
-0.0000
-0.0000
2-3
0.0001
0.0038
0.0005
-0.0003
-0.0001
-0.0000
-0.0000
-0.0000
3-4
-0.0003
0.0005
0.0029
0.0005
-0.0003
-0.0001
-0.0000
-0.0000
4-5
-0.0000
-0.0003
0.0005
0.0037
0.0008
-0.0003
-0.0001
0.0000
5-6
0.0000
-0.0001
-0.0003
0.0008
0.0047
0.0003
-0.0004
-0.0000
6-8
-0.0000
-0.0000
-0.0001
-0.0003
0.0003
0.0048
-0.0000
-0.0006
8-10
-0.0000
-0.0000
-0.0000
-0.0001
-0.0004
-0.0000
0.0148
-0.0005
10-13
-0.0000
-0.0000
-0.0000
0.0000
-0.0000
-0.0006
-0.0005
0.0400
Table Supp.CCII: Systematic covariance matrix of measured cross section ratio of lead over scintillator in
Bin edges (degree)
0-2
2-3
3-4
4-5
5-6
6-8
8-10
10-13
0-2
0.001
0.001
0.001
0.001
0.001
0.001
0.001
0.002
2-3
0.001
0.001
0.001
0.001
0.001
0.001
0.002
0.002
3-4
0.001
0.001
0.001
0.001
0.001
0.002
0.002
0.003
4-5
0.001
0.001
0.001
0.001
0.002
0.002
0.003
0.004
5-6
0.001
0.001
0.001
0.002
0.002
0.003
0.004
0.005
6-8
0.001
0.001
0.002
0.002
0.003
0.003
0.005
0.006
8-10
0.001
0.002
0.002
0.003
0.004
0.005
0.010
0.010
10-13
0.002
0.002
0.003
0.004
0.005
0.006
0.010
0.016
Table Supp.CCIII: Measured cross section ratio of lead over scintillator in , and the absolute and fractional cross section ratio uncertainties
Bin edges (GeV/c)
Ratio
Abs. Unc.
Frac. Stat. Unc.
Frac. Sys. Unc.
Frac. Flux Unc.
1.5-3.0
0.46
0.110
0.216
0.107
0.007
3.0-4.0
0.49
0.088
0.140
0.111
0.009
4.0-5.0
0.42
0.069
0.111
0.122
0.009
5.0-6.0
0.40
0.065
0.102
0.128
0.004
6.0-7.0
0.34
0.060
0.117
0.128
0.007
7.0-8.5
0.35
0.061
0.134
0.116
0.017
8.5-10.0
0.39
0.083
0.179
0.116
0.021
10.0-20.0
0.38
0.134
0.308
0.164
0.034
Table Supp.CCIV: Statistical covariance matrix of measured cross section ratio of lead over scintillator in
Bin edges (GeV/c)
1.5-3.0
3.0-4.0
4.0-5.0
5.0-6.0
6.0-7.0
7.0-8.5
8.5-10.0
10.0-20.0
1.5-3.0
0.0098
0.0011
0.0002
0.0000
0.0001
0.0000
0.0000
0.0000
3.0-4.0
0.0011
0.0047
0.0009
0.0002
0.0001
0.0001
0.0000
0.0000
4.0-5.0
0.0002
0.0009
0.0022
0.0007
0.0002
0.0001
0.0001
0.0000
5.0-6.0
0.0000
0.0002
0.0007
0.0017
0.0008
0.0003
0.0001
0.0001
6.0-7.0
0.0001
0.0001
0.0002
0.0008
0.0016
0.0010
0.0004
0.0001
7.0-8.5
0.0000
0.0001
0.0001
0.0003
0.0010
0.0021
0.0017
0.0008
8.5-10.0
0.0000
0.0000
0.0001
0.0001
0.0004
0.0017
0.0048
0.0038
10.0-20.0
0.0000
0.0000
0.0000
0.0001
0.0001
0.0008
0.0038
0.0139
Table Supp.CCV: Systematic covariance matrix of measured cross section ratio of lead over scintillator in
Bin edges (GeV/c)
1.5-3.0
3.0-4.0
4.0-5.0
5.0-6.0
6.0-7.0
7.0-8.5
8.5-10.0
10.0-20.0
1.5-3.0
0.002
0.002
0.002
0.002
0.002
0.001
0.001
0.002
3.0-4.0
0.002
0.003
0.003
0.002
0.002
0.002
0.002
0.002
4.0-5.0
0.002
0.003
0.003
0.002
0.002
0.002
0.001
0.002
5.0-6.0
0.002
0.002
0.002
0.003
0.002
0.002
0.002
0.002
6.0-7.0
0.002
0.002
0.002
0.002
0.002
0.002
0.002
0.002
7.0-8.5
0.001
0.002
0.002
0.002
0.002
0.002
0.001
0.002
8.5-10.0
0.001
0.002
0.001
0.002
0.002
0.001
0.002
0.002
10.0-20.0
0.002
0.002
0.002
0.002
0.002
0.002
0.002
0.004
Table Supp.CCVI: Measured cross section ratio of lead over scintillator in , and the absolute and fractional cross section ratio uncertainties
Bin edges (GeV/c)
Ratio
Abs. Unc.
Frac. Stat. Unc.
Frac. Sys. Unc.
Frac. Flux Unc.
0.00-0.15
0.36
0.093
0.240
0.093
0.004
0.15-0.30
0.33
0.057
0.152
0.086
0.001
0.30-0.45
0.38
0.056
0.116
0.089
0.001
0.45-0.60
0.33
0.067
0.148
0.134
0.002
0.60-0.75
0.35
0.103
0.207
0.215
0.010
0.75-0.90
0.40
0.141
0.258
0.239
0.009
0.90-1.25
0.98
0.274
0.234
0.151
0.006
1.25-2.50
2.14
1.439
0.601
0.306
0.030
Table Supp.CCVII: Statistical covariance matrix of measured cross section ratio of lead over scintillator in
Bin edges (GeV/c)
0.00-0.15
0.15-0.30
0.30-0.45
0.45-0.60
0.60-0.75
0.75-0.90
0.90-1.25
1.25-2.50
0.00-0.15
0.0076
0.0003
-0.0003
-0.0001
-0.0000
-0.0000
-0.0000
-0.0002
0.15-0.30
0.0003
0.0025
0.0002
-0.0002
-0.0001
-0.0000
-0.0000
-0.0001
0.30-0.45
-0.0003
0.0002
0.0019
0.0003
-0.0003
-0.0002
-0.0001
-0.0001
0.45-0.60
-0.0001
-0.0002
0.0003
0.0024
0.0008
-0.0003
-0.0006
-0.0006
0.60-0.75
-0.0000
-0.0001
-0.0003
0.0008
0.0051
0.0018
-0.0007
-0.0016
0.75-0.90
-0.0000
-0.0000
-0.0002
-0.0003
0.0018
0.0107
0.0059
-0.0108
0.90-1.25
-0.0000
-0.0000
-0.0001
-0.0006
-0.0007
0.0059
0.0530
0.0383
1.25-2.50
-0.0002
-0.0001
-0.0001
-0.0006
-0.0016
-0.0108
0.0383
1.6442
Table Supp.CCVIII: Systematic covariance matrix of measured cross section ratio of lead over scintillator in
Bin edges (GeV/c)
0.00-0.15
0.15-0.30
0.30-0.45
0.45-0.60
0.60-0.75
0.75-0.90
0.90-1.25
1.25-2.50
0.00-0.15
0.001
0.001
0.000
0.000
0.000
0.001
0.003
0.004
0.15-0.30
0.001
0.001
0.001
0.001
0.001
0.002
0.003
0.002
0.30-0.45
0.000
0.001
0.001
0.001
0.002
0.003
0.004
0.006
0.45-0.60
0.000
0.001
0.001
0.002
0.003
0.004
0.005
0.006
0.60-0.75
0.000
0.001
0.002
0.003
0.006
0.007
0.007
0.005
0.75-0.90
0.001
0.002
0.003
0.004
0.007
0.009
0.011
0.008
0.90-1.25
0.003
0.003
0.004
0.005
0.007
0.011
0.022
0.029
1.25-2.50
0.004
0.002
0.006
0.006
0.005
0.008
0.029
0.427
Table Supp.CCIX: Measured cross section ratio of lead over scintillator in , and the absolute and fractional cross section ratio uncertainties
Bin edges (GeV)
Ratio
Abs. Unc.
Frac. Stat. Unc.
Frac. Sys. Unc.
Frac. Flux Unc.
0.000-0.025
0.36
0.089
0.234
0.089
0.003
0.025-0.050
0.35
0.069
0.183
0.073
0.001
0.050-0.100
0.30
0.060
0.175
0.096
0.002
0.100-0.200
0.38
0.058
0.122
0.091
0.001
0.200-0.300
0.35
0.068
0.148
0.125
0.002
0.300-0.400
0.30
0.075
0.198
0.150
0.003
0.400-0.500
0.36
0.094
0.201
0.166
0.005
0.500-0.700
0.36
0.121
0.233
0.238
0.010
0.700-1.000
0.51
0.171
0.251
0.226
0.007
1.000-1.300
1.03
0.318
0.271
0.148
0.009
1.300-2.000
0.95
0.531
0.508
0.231
0.017
2.000-3.000
3.01
3.221
0.989
0.412
0.050
Table Supp.CCX: Statistical covariance matrix of measured cross section ratio of lead over scintillator in
Bin edges (GeV)
0.000-0.025
0.025-0.050
0.050-0.100
0.100-0.200
0.200-0.300
0.300-0.400
0.400-0.500
0.500-0.700
0.700-1.000
1.000-1.300
1.300-2.000
2.000-3.000
0.000-0.025
0.0069
0.0014
-0.0005
-0.0002
-0.0000
-0.0000
-0.0000
0.0000
-0.0000
0.0000
-0.0000
-0.0002
0.025-0.050
0.0014
0.0042
0.0012
-0.0003
-0.0002
-0.0000
-0.0000
-0.0000
-0.0000
-0.0000
-0.0000
-0.0000
0.050-0.100
-0.0005
0.0012
0.0027
0.0005
-0.0003
-0.0001
-0.0001
-0.0000
-0.0000
-0.0001
-0.0001
0.0000
0.100-0.200
-0.0002
-0.0003
0.0005
0.0022
0.0006
-0.0002
-0.0003
-0.0001
-0.0001
-0.0001
-0.0000
-0.0002
0.200-0.300
-0.0000
-0.0002
-0.0003
0.0006
0.0027
0.0013
0.0001
-0.0003
-0.0002
-0.0000
-0.0001
-0.0002
0.300-0.400
-0.0000
-0.0000
-0.0001
-0.0002
0.0013
0.0036
0.0026
-0.0000
-0.0006
-0.0007
-0.0009
-0.0001
0.400-0.500
-0.0000
-0.0000
-0.0001
-0.0003
0.0001
0.0026
0.0052
0.0028
-0.0003
-0.0013
-0.0009
-0.0013
0.500-0.700
0.0000
-0.0000
-0.0000
-0.0001
-0.0003
-0.0000
0.0028
0.0072
0.0038
-0.0014
-0.0001
-0.0029
0.700-1.000
-0.0000
-0.0000
-0.0000
-0.0001
-0.0002
-0.0006
-0.0003
0.0038
0.0161
0.0115
-0.0010
-0.0170
1.000-1.300
0.0000
-0.0000
-0.0001
-0.0001
-0.0000
-0.0007
-0.0013
-0.0014
0.0115
0.0777
0.0194
-0.0262
1.300-2.000
-0.0000
-0.0000
-0.0001
-0.0000
-0.0001
-0.0009
-0.0009
-0.0001
-0.0010
0.0194
0.2330
0.1241
2.000-3.000
-0.0002
-0.0000
0.0000
-0.0002
-0.0002
-0.0001
-0.0013
-0.0029
-0.0170
-0.0262
0.1241
8.8446
Table Supp.CCXI: Systematic covariance matrix of measured cross section ratio of lead over scintillator in
Bin edges (GeV)
0.000-0.025
0.025-0.050
0.050-0.100
0.100-0.200
0.200-0.300
0.300-0.400
0.400-0.500
0.500-0.700
0.700-1.000
1.000-1.300
1.300-2.000
2.000-3.000
0.000-0.025
0.001
0.001
0.001
0.001
0.000
0.000
0.001
0.001
0.001
0.002
0.001
0.008
0.025-0.050
0.001
0.001
0.001
0.001
0.001
0.001
0.001
0.001
0.001
0.002
0.002
0.005
0.050-0.100
0.001
0.001
0.001
0.001
0.001
0.001
0.001
0.002
0.002
0.004
0.002
0.005
0.100-0.200
0.001
0.001
0.001
0.001
0.001
0.001
0.002
0.002
0.003
0.005
0.004
0.012
0.200-0.300
0.000
0.001
0.001
0.001
0.002
0.002
0.002
0.003
0.004
0.004
0.004
0.002
0.300-0.400
0.000
0.001
0.001
0.001
0.002
0.002
0.003
0.003
0.004
0.005
0.006
0.008
0.400-0.500
0.001
0.001
0.001
0.002
0.002
0.003
0.004
0.005
0.006
0.007
0.009
0.012
0.500-0.700
0.001
0.001
0.002
0.002
0.003
0.003
0.005
0.007
0.009
0.008
0.014
0.005
0.700-1.000
0.001
0.001
0.002
0.003
0.004
0.004
0.006
0.009
0.013
0.011
0.019
0.011
1.000-1.300
0.002
0.002
0.004
0.005
0.004
0.005
0.007
0.008
0.011
0.023
0.013
0.061
1.300-2.000
0.001
0.002
0.002
0.004
0.004
0.006
0.009
0.014
0.019
0.013
0.048
0.000
2.000-3.000
0.008
0.005
0.005
0.012
0.002
0.008
0.012
0.005
0.011
0.061
0.000
1.531
Table Supp.CCXII: Measured cross section ratio of lead over scintillator in , and the absolute and fractional cross section ratio uncertainties
Bin edges (GeV/c2)
Ratio
Abs. Unc.
Frac. Stat. Unc.
Frac. Sys. Unc.
Frac. Flux Unc.
0.9-1.1
0.58
0.267
0.432
0.148
0.013
1.1-1.2
0.20
0.051
0.239
0.088
0.011
1.2-1.3
0.38
0.056
0.092
0.113
0.003
1.3-1.4
0.63
0.165
0.164
0.204
0.005
Table Supp.CCXIII: Statistical covariance matrix of measured cross section ratio of lead over scintillator in
Bin edges (GeV/c2)
0.9-1.1
1.1-1.2
1.2-1.3
1.3-1.4
0.9-1.1
0.0636
0.0039
-0.0033
-0.0063
1.1-1.2
0.0039
0.0023
0.0005
-0.0031
1.2-1.3
-0.0033
0.0005
0.0012
0.0007
1.3-1.4
-0.0063
-0.0031
0.0007
0.0107
Table Supp.CCXIV: Systematic covariance matrix of measured cross section ratio of lead over scintillator in
Bin edges (GeV/c2)
0.9-1.1
1.1-1.2
1.2-1.3
1.3-1.4
0.9-1.1
0.007
0.001
-0.000
-0.001
1.1-1.2
0.001
0.000
-0.000
-0.001
1.2-1.3
-0.000
-0.000
0.002
0.005
1.3-1.4
-0.001
-0.001
0.005
0.016
Table Supp.CCXV: Measured cross section ratio of lead over scintillator in , and the absolute and fractional cross section ratio uncertainties
Bin edges (GeV)
Ratio
Abs. Unc.
Frac. Stat. Unc.
Frac. Sys. Unc.
Frac. Flux Unc.
0.035-0.100
0.39
0.055
0.114
0.084
0.002
0.100-0.150
0.36
0.048
0.092
0.094
0.003
0.150-0.200
0.40
0.074
0.128
0.132
0.004
0.200-0.350
0.62
0.168
0.172
0.210
0.003
Table Supp.CCXVI: Statistical covariance matrix of measured cross section ratio of lead over scintillator in
Bin edges (GeV)
0.035-0.100
0.100-0.150
0.150-0.200
0.200-0.350
0.035-0.100
0.0020
0.0006
-0.0003
-0.0005
0.100-0.150
0.0006
0.0011
0.0004
-0.0003
0.150-0.200
-0.0003
0.0004
0.0026
0.0012
0.200-0.350
-0.0005
-0.0003
0.0012
0.0114
Table Supp.CCXVII: Systematic covariance matrix of measured cross section ratio of lead over scintillator in
Bin edges (GeV)
0.035-0.100
0.100-0.150
0.150-0.200
0.200-0.350
0.035-0.100
0.001
0.001
0.001
0.003
0.100-0.150
0.001
0.001
0.002
0.004
0.150-0.200
0.001
0.002
0.003
0.006
0.200-0.350
0.003
0.004
0.006
0.017
Table Supp.CCXVIII: Measured cross section ratio of lead over scintillator in , and the absolute and fractional cross section ratio uncertainties
Bin edges (degree)
Ratio
Abs. Unc.
Frac. Stat. Unc.
Frac. Sys. Unc.
Frac. Flux Unc.
0-10
0.75
0.329
0.412
0.159
0.004
10-20
0.54
0.141
0.219
0.141
0.002
20-30
0.38
0.079
0.157
0.135
0.001
30-40
0.43
0.071
0.122
0.113
0.004
40-50
0.38
0.067
0.124
0.127
0.004
50-60
0.31
0.066
0.158
0.145
0.005
60-120
0.34
0.062
0.142
0.112
0.004
120-135
0.49
0.097
0.172
0.098
0.001
135-150
0.53
0.124
0.196
0.126
0.003
150-165
0.58
0.222
0.349
0.148
0.003
165-180
0.50
0.514
0.953
0.365
0.025
Table Supp.CCXIX: Statistical covariance matrix of measured cross section ratio of lead over scintillator in
Bin edges (degree)
0-10
10-20
20-30
30-40
40-50
50-60
60-120
120-135
135-150
150-165
165-180
0-10
0.0945
0.0129
0.0004
-0.0003
-0.0004
-0.0004
-0.0004
-0.0005
-0.0006
0.0025
-0.0011
10-20
0.0129
0.0140
0.0028
-0.0002
-0.0005
-0.0003
-0.0002
-0.0004
-0.0005
-0.0000
-0.0006
20-30
0.0004
0.0028
0.0036
0.0014
-0.0000
-0.0003
-0.0002
-0.0002
-0.0001
0.0002
0.0003
30-40
-0.0003
-0.0002
0.0014
0.0027
0.0012
0.0001
-0.0003
-0.0003
0.0000
0.0000
-0.0009
40-50
-0.0004
-0.0005
-0.0000
0.0012
0.0022
0.0012
0.0002
-0.0001
-0.0002
-0.0002
-0.0010
50-60
-0.0004
-0.0003
-0.0003
0.0001
0.0012
0.0024
0.0010
-0.0000
-0.0005
-0.0004
-0.0009
60-120
-0.0004
-0.0002
-0.0002
-0.0003
0.0002
0.0010
0.0023
0.0009
0.0001
-0.0001
0.0021
120-135
-0.0005
-0.0004
-0.0002
-0.0003
-0.0001
-0.0000
0.0009
0.0071
0.0043
0.0002
0.0100
135-150
-0.0006
-0.0005
-0.0001
0.0000
-0.0002
-0.0005
0.0001
0.0043
0.0109
0.0104
0.0028
150-165
0.0025
-0.0000
0.0002
0.0000
-0.0002
-0.0004
-0.0001
0.0002
0.0104
0.0416
-0.0017
165-180
-0.0011
-0.0006
0.0003
-0.0009
-0.0010
-0.0009
0.0021
0.0100
0.0028
-0.0017
0.2299
Table Supp.CCXX: Systematic covariance matrix of measured cross section ratio of lead over scintillator in