[1]\fnmPaola \surBorri
[2]\fnmPaul \surVerkade
1]\orgdivSchool of Biosciences, \orgnameCardiff University, \orgaddress\streetMuseum Avenue, \cityCardiff, \postcodeCF10 3AX, \countryUK
2]\orgdivSchool of Biochemistry, \orgnameUniversity of Bristol, \orgaddress\streetUniversity Walk, \cityBristol, \countryUK
3]\orgdivSchool of Physics and Astronomy, \orgnameCardiff University, \orgaddress\streetThe Parade, \cityCardiff, \postcodeCF24 3AA, \countryUK
4]Present Address: \orgdivDepartment of Chemistry, \orgnameUmeå University, \cityUmeå, \postcode90187, \countrySweden
5]Present Address: \orgdivSchool of Medicine, \orgnameUniversity of Nottingham, \cityNottingham, \postcodeNG7 2RD, \countryUK
Correlative light electron microscopy using small gold nanoparticles as single probes
Abstract
Correlative light electron microscopy (CLEM) requires the availability of robust probes which are visible both in light and electron microscopy. Here we demonstrate a CLEM approach using small gold nanoparticles as a single probe. Individual gold nanoparticles bound to the epidermal growth factor protein were located with nanometric precision background-free in human cancer cells by light microscopy using resonant four-wave-mixing (FWM), and were correlatively mapped with high accuracy to the corresponding transmission electron microscopy images. We used nanoparticles of 10 nm and 5 nm radius, and show a correlation accuracy below 60 nm over an area larger than 10 µm size, without the need for additional fiducial markers. Correlation accuracy was improved to below 40 nm by reducing systematic errors, while the localisation precision is below 10 nm. Polarisation-resolved FWM correlates with nanoparticle shapes, promising for multiplexing by shape recognition in future applications. Owing to the photostability of gold nanoparticles and the applicability of FWM microscopy to living cells, FWM-CLEM opens up a powerful alternative to fluorescence-based methods.
keywords:
correlative microscopy, four-wave mixing, electron microscopy, gold nanoparticles1 Introduction
Correlative light electron microscopy (CLEM) combines the strengths of light microscopy (LM) and electron microscopy (EM) and is receiving growing attention in the life sciences, especially after the recent revolutionary developments of super-resolution (SR) light microscopy and cryo-EM AndoJPDAP18 ; BookVerkade21 . CLEM aims to combine the live cell imaging capability, large field of views, and molecular specificity of LM with the spatial resolution and ultrastructural information of EM, to pin-point specific events and visualise molecular components in the context of the underlying intracellular structure at nanometric to atomic resolution. To highlight biomolecules of interest and determine their position with high accuracy in this context, they need to be labelled with probes that are visible both in the light microscope (typically by fluorescence) and in the electron microscope (electron dense material). The production and detection of appropriate probes for each imaging modality is one of the key aspects in any correlative microscopy workflow.
A commonly used approach is to combine a fluorescent moiety together with a gold nanoparticle (AuNP) BrownProtoplasma2010 ; TannerMCB21 . Such dual probes can be made fairly easily and are also available commercially. For example, we have used an Alexa594 fluorescent dye and a 5 nm diameter AuNP coupled to the ligand transferrin (Tf), a molecule that normally recycles between the plasma membrane and early endosomes. Importantly, we showed that such a conjugate was trafficking as expected, i.e. the function of Tf was not perturbed by the probe BrownProtoplasma2010 . However, the fluorescence of Tf-Alexa594 with the AuNP was diminished compared to Tf-Alexa594. Indeed, fluorescence quenching, due to nonradiative transfer in the vicinity of a AuNP, is a well documented effect, which can significantly reduce the applicability of these probes in CLEM workflows KandelaScanning07 ; MilesSR17 . Moreover, we have shown recently that the integrity of this type of dual probes inside cells, and in turn their ability to correlatively report the location of the same molecule, should be seriously questioned GiannakopoulouNS20 .
Ideally one would like to use a single probe that is visible both in the light and in the electron microscope. Semiconductor nanocrystals, also called quantum dots (QDs), do represent a single CLEM probe as they harbour an electron dense core that also emits fluorescence GiepmansNM05 . However, QDs typically contain cyto-toxic atoms (e.g. Cd or As). In turn, they require a protective shell coating for bio-applications which can double the probe size GiepmansNM05 . Moreover, QDs have an intermittent ‘on-off’ emission (i.e. they blink) YuangACSNano18 . This limits their application e.g. in time-course experiments aimed at tracking the same probe over time, whereby blinking causes problems when trying to reconnect positions to generate long trajectories.
Alternately, there have been some developments toward using fluorophores as single probes KukulskiJCB11 ; JohnsonSR15 . However, this is challenging since the fixation and staining protocols for EM are often not compatible with retaining fluorescence emission. Fluorescence imaging after sample preparation for EM is key to minimise the uncertainty regarding the relative positions of fluorescent labels and EM structural features, due to the anisotropic shrinking and deformations caused by the sample processing steps. With the advent of cryo-EM which can directly image biomaterials without staining and offers the best approach to preserve the native cellular ultrastructure, workflows have been developed to perform light microscopy at cryogenic temperature SartoriJSB07 ; TuijtelSC19 . Notably, cryo-LM has the added benefit of an increased photostability of organic fluorophores at low temperature, which has been exploited to achieve super-resolution fluorescence microscopyHoffmanScience20 ; TuijtelSC19 , reducing the resolution gap between LM and EM modalities. However, cryo-LM is technically challenging, often requiring sophisticated custom setups with highly stable cryostages, and specific high NA long-working-distance air objectives to avoid sample devitrification. Moreover, the requirement for high light intensities onto the sample to achieve SR can cause sample devitrification and damage, and preclude subsequent imaging using cryo-EM. It is also important to point out that to achieve the highest correlation accuracy between LM and EM images, the addition of spherical bead fiducial markers that are visible in both modalities is typically required KukulskiJCB11 ; TuijtelSC19 . By measuring and matching the coordinates of the centroid of each fiducial marker in the LM image and the EM image, one can calculate the transformation between the two images, which takes into account changes in magnification, rotation, and distortions. However, introducing fiducials adds further steps to the sample preparation protocols, increasing complexity and possible artefacts by induced modifications.
Another approach would be to use small AuNPs as single probes. These are easily visible in EM, and exhibit strong light scattering and absorption at their localised surface plasmon resonance (LSPR). They are photostable, and the achievable photon fluxes are governed by the incident photon fluxes and the AuNP optical extinction cross-section, a significant advantage compared to fluorophores which can emit a maximum of one photon per excited-state lifetime. However, when small AuNPs are embedded inside scattering and autofluorescing cellular environments, it is challenging to distinguish them against this background using conventional one-photon (i.e. linear) optical microscopy methods. Recently, we developed a multiphoton LM technique which exploits the four-wave mixing (FWM) nonlinearity of AuNPs, triply resonant to the LSPR. With this method we were able to detect individual small (down to 5 nm radius) AuNPs inside scattering cells GiannakopoulouNS20 ; ZoriniantsPRX17 and tissues PopeSPIE21 completely free from background, at imaging speeds and excitation powers compatible with live cell imaging, with a sensitivity limited only by photon shot noise.
Here, we demonstrate a CLEM workflow using individual small AuNPs as single probes of the epidermal growth factor (EGF) protein in mammalian cancer cells, imaged by FWM in LM and correlatively by transmission EM. Owing to the high photostability of AuNPs under ambient conditions, cryo-LM is not required in this workflow. To preserve the cellular ultrastructure and avoid artefacts from chemical fixation, we use vitrification by high-pressure freezing (HPF), followed by freeze substitution and resin embedding without additional heavy metal stains VerkadeJM08 ; vanWeeringMCB10 . Importantly, sections are imaged by FWM after sample preparation for EM, and a direct correlation with high accuracy is demonstrated using the very same AuNP observed under both modalities, without the need for additional fiducial markers.
2 Results
2.1 Background-free four-wave mixing microscopy on EM-ready sections
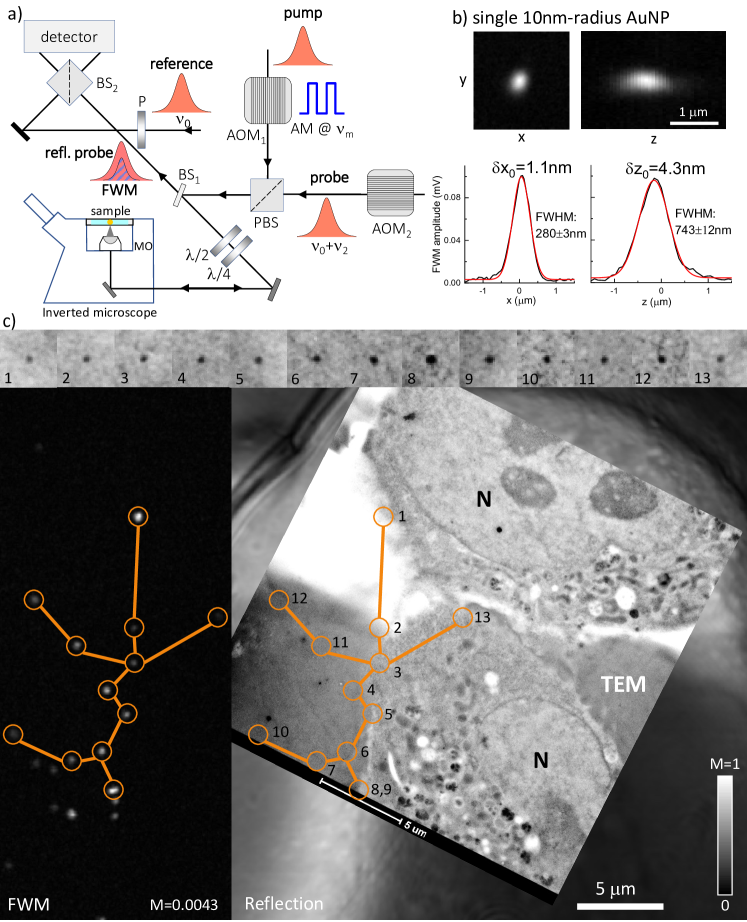
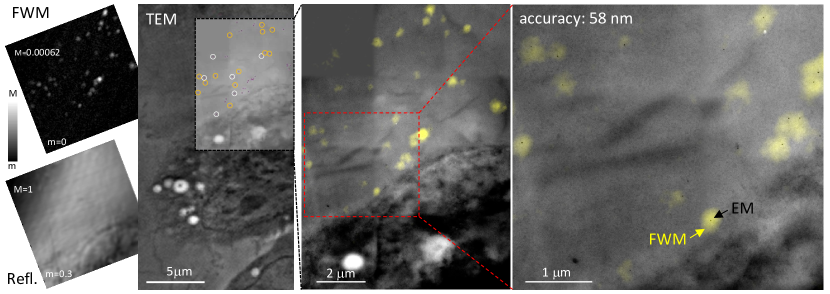
In its general form, FWM is a third-order nonlinear light-matter interaction phenomenon wherein three light fields interact in a medium to generate a fourth wave. Here, we use a scheme where all waves have the same center frequency, and two of the incident light fields are identical (two-beam degenerate FWM). A sketch of the experimental setup implementing the FWM technique is shown in Fig. 1a. It exploits a combination of short optical pulses of about 150 fs duration, called pump, probe and reference, generated by the same laser source (see also Methods). All pulses have the same center optical frequency, in resonance with the localised surface plasmon of nominally spherical small AuNPs. The detected FWM can be understood as a pump-induced change in the AuNP dielectric function, which manifests as a change in the scattering of the probe beam ZoriniantsPRX17 . Pump and probe pulses are focused onto the sample using a high numerical aperture (NA) microscope objective (MO), and the FWM signal is collected by the same objective in reflection (epi-geometry). To distinguish FWM from pump and probe beams, a heterodyne detection scheme is implemented, wherein the pump is amplitude modulated (at ), the probe is radio-frequency shifted (by ), and the interference between FWM and reference fields is detected at the appropriate radio-frequency side-bands (modulo the laser repetition rate ZoriniantsPRX17 ). We have shown previously that the maximum FWM field amplitude is detected when the probe pulse arrives about 0.5 ps after the pump pulse, which corresponds to the time needed for the free electron gas in the metal to reach the highest temperature (due the transfer of energy from the pump absorption) before starting to cool down via electron-phonon scattering MasiaPRB12 . As a result of this detection scheme, FWM is free from both linear scattering and incoherent (e.g. autofluorescence) background, and is temporally separated from instantaneous as well as long-lived non-linearities. Such exquisite background-free contrast is showcased in Fig. 1c, where FWM was acquired on AuNPs of nominal 10 nm radius bound to the epidermal growth factor protein in HeLa cells, measured on 300 nm thin sections ready for EM analysis, prepared using cell fixation by high-pressure freezing followed by freeze substitution and resin embedding (see Methods). Although these samples are embedded in LowicrylHM20 resin without addition of any electron dense staining agents, the sections create a strong background in the linear response, as shown in the confocal reflectance image acquired simultaneously with FWM in Fig. 1c. Yet, FWM is free from background and clearly shows the location of individual AuNPs (highlighted by the orange circles in Fig. 1c). The identical AuNP spatial pattern is found in the transmission EM (TEM) of the same section, correlatively measured after FWM imaging (see Methods), showcasing the suitability of AuNPs as single probes visible with high contrast in both FWM and EM. Notably, it is possible to locate the centroid position of single AuNPs in a FWM image with a localisation precision much better than the diffraction-limited spatial resolution, as shown in Fig. 1b. Gaussian fits of one-dimensional line-profiles along and at the -position in the centre of a single AuNP provide a centroid localisation precision of about 1 nm in plane and 4 nm axially for the signal-to-noise ratio in the data. Furthermore, the FWM field phase in reflection encodes the axial displacement between particle and the focus center, thus it can be used to determine the particle coordinate without axial scanning ZoriniantsPRX17 . The linear dependence of the FWM phase versus measured on a set of AuNPs is reported on the Supplementary Information (SI) Fig. LABEL:S-zdep.
2.2 FWM is sensitive to the AuNP shape
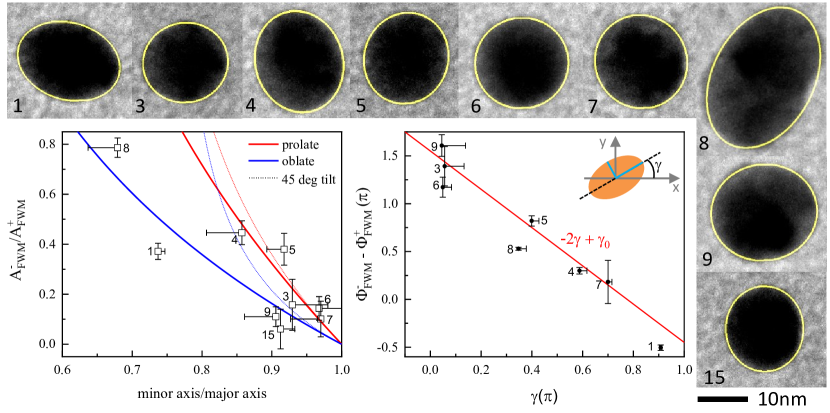
It was shown in our previous work ZoriniantsPRX17 that using a polarisation-resolved configuration in the FWM field detection provides additional information on the AuNP shape and orientation. In this configuration, probe and pump beams, linearly polarised in the laboratory system, are transformed into circularly polarised beams at the sample by a combination of and waveplates (see also Fig. 1a). We then use a dual-polarisation balanced detection (see Methods) which allows us to detect the co- and cross-circularly polarised components of the reflected probe and FWM fields relative to the incident circularly polarized probe, having amplitudes (phases) indicated as and ( and ), respectively, where () refers to the co (cross) polarised component. Notably, we found, with the aid of numerical simulations of the detected FWM field spatial pattern compared with the experiments, that the cross-polarised component is strongly sensitive to small AuNP shape asymmetries, which are always present in these nominally-spherical AuNPs consistent with their morphology observed in TEM. Using an ellipsoid model to account for deviations from spherical shapes, the calculations showed that the amplitude ratio at the AuNP center is proportional to the AuNP ellipticity, and that the phase reports the in-plane particle orientation ZoriniantsPRX17 .
Using the CLEM workflow, here we have correlatively analysed the measured FWM field ratio and the AuNP shape obtained with TEM, and compared the results with the ellipsoid model previously developed. Fig. 2 shows high-magnification TEM images on a selection of the AuNPs seen in Fig. 1c, as indicated by the corresponding numbers. An ellipse was fitted to these images as shown by the yellow lines (see also Methods). The corresponding major and minor axis and the orientation angle were obtained (see sketch in Fig. 2) and the dependence of the measured FWM field ratio at the AuNP center is shown in the plots, for both amplitude and phase components. Error bars in the measured FWM field ratio represent the shot-noise in regions away from the AuNPs while the horizontal error bars were obtained by changing the threshold levels used to fit an ellipse to the TEM images (see Methods). For this analysis, we ensured that the selected NPs were sufficiently in focus (see SI Fig. LABEL:S-ratiovsz), to justify comparing the experimentally measured FWM ratio with the ellipsoid model. The latter was developed assuming a prolate or an oblate NP shape, with semi-axis or along the directions, respectively. We also considered the case of a tilted ellipsoid rotated by 45 degrees in the plane, and calculated the projected semi-axis along accordingly (see SI section LABEL:S-TEMellipse). The corresponding amplitude ratios derived from such model are shown in Fig. 2 as labelled. Generally, the experimental data agree well with the model, taking into account that the TEM used here is an in-plane projection of the 3D shape, hence we cannot tell if a NP is oblate or prolate and how its axes are orientated. Notably, NPs number 1 and 15 show a darker contrast in TEM, consistent with having an oblate shape with the long c-axis out of plane. Regarding the NP in-plane orientation, the experimental FWM ratio phase exhibits a good agreement with the dependence , where is a rotation offset, as predicted by the ellipsoid model ZoriniantsPRX17 .
2.3 FWM-EM correlation accuracy
The correlation accuracy between locating the same AuNP in FWM and in TEM was evaluated as follows. The centroid position coordinates of each individual AuNP in a FWM image were obtained using a two-dimensional Gaussian fit of the profile (see Methods). The corresponding AuNP coordinates in the EM were assigned by examining zooms at the particle location and positioning the particle centre based on shape geometry. The two sets of coordinates were then compared using a linear transformation matrix. Specifically, the coordinates of each AuNP in the FWM image were transformed into the reference system of the EM using an affine transformation , including shear, scaling, rotation and translation, so that where is the coordinate vector in the FWM image and is the coordinate vector in the EM image. For more than 3 AuNPs, the system is overdetermined and is calculated by minimising the sum of the squared deviations over all particle coordinates (see also Methods). As a measure of the correlation accuracy we then evaluate the quantity where is the total number of AuNPs being compared and denotes the individual i-th particle.
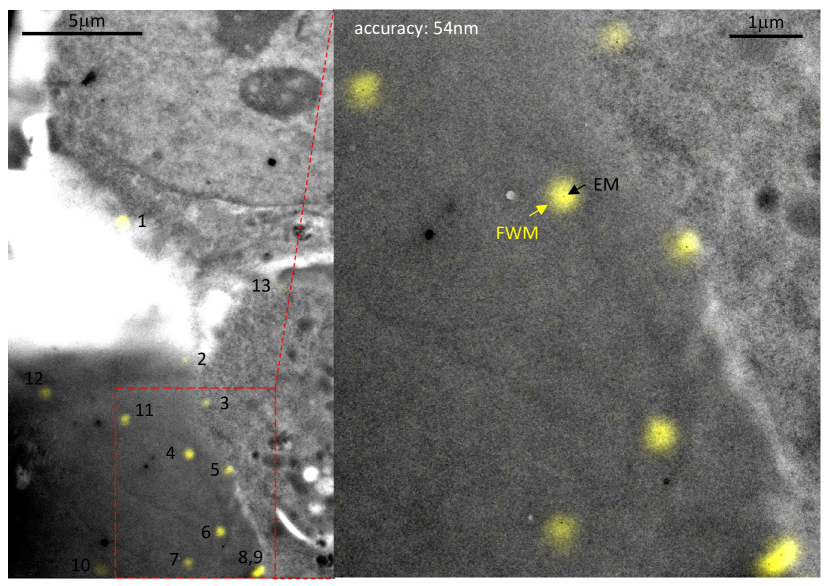
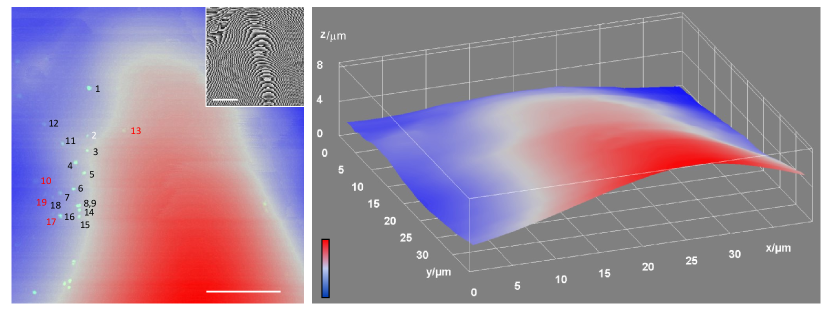
Fig. 3 shows an example of this analysis for the 10 nm-radius AuNPs reported in Fig. 1c, where the transformed FWM image has been overlaid to the EM image. A zoom of the overlay is given in Fig. 3 to showcase the overlap between an individual AuNP in FWM (yellow spots) and EM (black spots). A correlation accuracy of 94 nm is found when including all numbered particles in Fig. 1c, which reduces to 54 nm when excluding AuNPs 2, 10 and 13. These three particles have a FWM amplitude below a third of the typical maximum value observed. A high-magnification TEM inspection of AuNP 2 shows a weak contrast (see SI Fig. LABEL:S-TEMAuNP2), hence an atypical structure, while AuNP 10 and 13 have a low FWM amplitude because they are significantly out of focus, as demonstrated by an analysis of the point-spread-function (PSF) width and the error in the centroid localisation precision (see SI Section LABEL:S-CLEMaccuracy, Fig. LABEL:S-PSF20nm). When particles are out of focus, not only the localisation precision decreases but their location is also affected by additional uncertainties, including objective aberrations and deformations of the pioloform layer supporting the resin section which change from FWM in water to EM in vacuum (see Methods). Notably, by exploiting the topography information encoded in the detected phase of the reflected probe field, we reconstructed a height profile of the resin section for the region in Fig. 1c, showing that there is a vertical tilt/bending of the pioloform layer, and AuNP 10 and 13 are indeed located at significantly different heights compared to the other particles (see SI Section LABEL:S-CLEMaccuracy, and Fig. 4 which shows AuNP 10 being 1.9 µm below and AuNP 13 being 0.8 µm above AuNP 5). This also explains why, despite the resin section being only 300 nm thick, hence smaller the axial extension of the PSF in FWM imaging (as shown in Fig. 1b), we do have issues of AuNPs being out of focus.
It should be highlighted that a correlation accuracy of 54 nm is remarkably small considering the large size ( µm) of the region over which the correlation is carried out. An additional example using a different, slightly smaller, EM region (centred around AuNPs 8 and 9) is shown in Fig. LABEL:S-20nm_correlation_ED, giving a correlation accuracy of 43 nm, when excluding AuNP 17 and 19 from the analysis after consistently applying the same out-of-focus criteria mentioned above (see SI Section LABEL:S-CLEMaccuracy, Fig. LABEL:S-PSF20nm for details).
We also investigated HeLa cells incubated with 5 nm-radius AuNPs. It was shown in our previous work MasiaPRB12 that the FWM field amplitude scales almost proportionally with the AuNP volume. Therefore, the signal to noise ratio, and in turn the localisation precision, is decreased by about 8-fold compared to using 10nm-radius AuNPs under identical excitation and detection conditions. Still, individual nanoparticles of this small size can be clearly resolved in FWM microscopy, above noise and background-free, as we showed in Ref. GiannakopoulouNS20 . An example of CLEM with FWM imaging using 5 nm-radius AuNPs in HeLa cells is shown in Fig. 5. Several AuNPs are clearly visible in both FWM and TEM. A few AuNPs are too close to be spatially distinguished in the FWM image, but 19 individual AuNPs are available for position analysis. This resulted in a correlation accuracy of 58 nm, whereby 13 individual AuNPs were used for the correlation (see orange circles in Fig. 5), and 6 nanoparticles were excluded (white circles in Fig. 5) based on the out-of-focus criteria discussed previously (see SI Section.LABEL:S-CLEMaccuracy, Fig. LABEL:S-PSF10nm). Another example showing an adjacent region is provided in Fig. LABEL:S-CLEM10nm. Merging both regions results in a correlation accuracy of 63 nm (see SI section LABEL:S-CLEMaccuracy).
We should note that the value scales with the number of particles included in the analysis and the number of parameters in the transformation according to . In other words, decreasing the number of particles in the analysis decreases the quantity (as stated above, if =3 the M=6 parameters of are fully determined from linear algebra and ). To account for this, we can calculate a corrected correlation accuracy as . This is found to be 65 nm both for the 10 nm-radius AuNPs in Fig. 3 and for the 5 nm-radius AuNPs in Fig. 5.
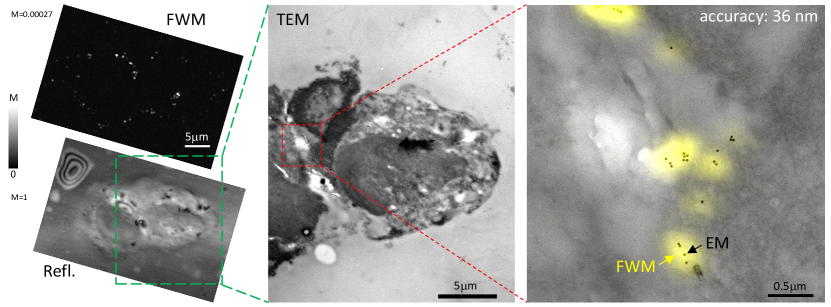
Considering that the shot-noise limited precision in locating the centroid position of a AuNP in focus by FWM is only a few nanometres (see Fig. 1b), the measured values of , even after excluding AuNPs which are too out of focus, are limited by systematic errors, i.e. is dominated by accuracy rather than precision. To address this point, we performed FWM-CLEM using 10 nm-radius AuNPs whereby the coordinates of the particles in FWM were measured in 3D with a fine axial scan (50 nm step size in ), such that the coordinates at the plane of optimum focus are accurately determined and systematics from e.g. out-of-focus aberrations are eliminated. These results are summarized in Fig. 6. Notably, here we observe AuNPs which have been internalised inside the cells (instead of being outside or at the cell surface, as in Fig. 1c). AuNPs form small clusters and are no longer resolved as individual particles in FWM. Therefore, in this case, we determined the centroid position of the cluster in 3D from the FWM z-stack (see Methods), and compared its 2D in-plane coordinates with the position of the geometrical centre of the cluster in TEM (which is a 2D transmission projection) for the correlation analysis. The resulting correlation accuracy for the six clusters shown in Fig. 6 is 36 nm. Another example correlating 10 clusters is provided in Fig. LABEL:S-SM20nm_cluster, for which an accuracy of 44 nm is found.
3 Discussion
The demonstration of FWM-CLEM with a single AuNP probe opens new possibilities for correlative light electron microscopy workflows. As shown here, we can locate the position of a single AuNP with nanometric precision at ambient conditions, without the need for cryo light microscopy, owing to the background-free and photostable FWM response of individual AuNPs which do not photobleach. The very same AuNP is well visible in EM due to its electron dense composition, offering high correlation accuracy without the need for additional fiducials. We have shown proof-of-principle results with 10 nm-radius and 5 nm-radius AuNPs bound to the EGF protein in HeLa cells, using FWM directly on 300 nm thin sections prepared for EM by high pressure freezing, freeze substitution and LowicrylHM20 resin embedding without using heavy metal stains.
Generally, we found a correlation accuracy limited by systematics, in the range of 60 nm or less over areas larger than 10 µm. Systematic errors included a bending of pioloform layer supporting the resin section, which changes from FWM in water to TEM in vacuum. This is difficult to correct for by coordinate transformations, and likely to require non-trivial methods beyond the linear transformation used by us. Importantly, systematics can be improved in future experimental designs, such that a correlation uncertainty eventually limited only by localisation precision from photon shot-noise, and hence down to 5-10 nm (or even lower by measuring longer, considering the photostability of AuNPs) could be reached. Moreover, since a single probe is used, as soon as this is identified from FWM into the TEM image, its relationship with the cellular ultrastructure is unambiguously determined. We should also highlight that FWM is compatible with live cell imaging PopeSPIE21 , hence can be applied from the start of a CLEM workflow, before cell fixation, as well as post fixation.
The detection of individual AuNPs with FWM lends itself to applications in single particle tracking (SPT) inside living cells ManzoRPP15 , to follow e.g. the entry and intracellular pathways of single molecules tagged with AuNPs, from proteins to drugs. A related application is following the fate of individual virions LiuCR20 to gain spatio-temporal insights into fundamental mechanisms of virus transport and infection occurring in live cells. Combined with existing strategies to label with or even encapsulate AuNPs inside virions ZhangNT17 , FWM opens the exciting prospect to track single virions over long observation times, background-free and deep inside living cells and tissues, to then pin-point events of interest (e.g. genome release) in the context of the cellular ultrastructure by CLEM.
While in the present demonstration we have shown AuNPs probes down to 5 nm radius, we emphasise that smaller probes could be used. In fact, in our previous work MasiaOL09 we reported FWM microscopy with 2.5nm radius AuNPs immunostaining the Golgi apparatus of HepG2 cells, where nanoparticles were detected as clusters in the focal volume. The FWM field amplitude scales proportionally with the NP volume and with the number of isolated particles in the focal volume, thus 8 AuNPs of 2.5nm-radius provide the same FWM signal as a single 5nm-radius AuNPs under the same excitation and detection conditions. The FWM amplitude signal-to-noise ratio scales as with () being the intensity of the pump (probe) beam at the sample and the integration time ZoriniantsPRX17 , hence to detect a single 2.5 nm radius AuNP (instead of a cluster) one can increase the excitation power and integration time accordingly. However, these conditions might prevent the applicability of the technique to living cells, due to nanoparticle heating under high power illumination and/or integration times becoming too long for the dynamics under observation. Alternatively, 2.5 nm radius silver nanoparticles can be used, as these have a 10-fold larger polarisability compared to a AuNP of equal radius (and correspondingly will exhibit higher FWM), owing to their sharper LSPR in the absence of interband transitions, as was seen in their photothermal response BerciaudPRB06 .
Another interesting consideration is the sensitivity of polarisation-resolved FWM to the shape and orientation of individual AuNPs, as we have shown here and previously ZoriniantsPRX17 . From a single particle tracking standpoint, this opens the exciting prospect of tracking particle rotations as well as translations, while for imaging it provides an opportunity for multiplexing by size and shape recognition. Finally, we highlight the recent demonstration that AuNPs can be synthesised directly inside cells and attached to specific biomolecules using genetic tagging JangNM20 . This could bring a "bioimaging revolution" to FWM microscopy and FWM-CLEM, similar to the advent of fluorescent proteins in fluorescence microscopy.
References
- (1) Ando, T. et al. The 2018 correlative microscopy techniques roadmap. J. Phys. D: Appl. Phys. 51, 443001 (2018).
- (2) Müller-Reichert, T. & Verkade, P. (eds.) Correlative Light and Electron Microscopy, vol. 162 of Methods in Cell Biology (Academic Press, Elsevier, 2021).
- (3) Brown, E. & Verkade, P. The use of markers for correlative light electron microscopy. Protoplasma 244, 91–97 (2010).
- (4) Tanner, H., Hodgson, L., Mantell, J. & Verkade, P. Fluorescent platinum nanoclusters as correlative light electron microscopy probes. Methods Cell Biol. 162, 39–68 (2021).
- (5) Kandela, I. K. & Albrecht, R. M. Fluorescence quenching by colloidal heavy metals nanoparticles: Implications for correlative fluorescence and electron microscopy studies. Scanning 29, 152–161 (2007).
- (6) Miles, B. T. et al. Direct evidence of lack of colocalisation of fluorescently labelled gold labels used in correlative light electron microscopy. Scientific Reports 7, 44666 (2017).
- (7) Giannakopoulou, N. et al. Four-wave-mixing microscopy reveals non-colocalisation between gold nanoparticles and fluorophore conjugates inside cells. Nanoscale 12, 4622–4635 (2020).
- (8) Giepmans, B. N. G., Deerinck, T. J., Smarr, B. L., Jones, Y. Z. & Ellisman, M. H. Correlated light and electron microscopic imaging of multiple endogenous proteins using quantum dots. Nature Methods 2, 743–749 (2005).
- (9) Yuan, G., Gomez, D. E., Kirkwood, N., Boldt, K. & Mulvaney, P. Two mechanisms determine quantum dot blinking. ACS Nano 12, 3397–3405 (2018).
- (10) Kukulski, W. et al. Correlated fluorescence and 3D electron microscopy with high sensitivity and spatial precision. J. Cell Biol. 192, 111–119 (2011).
- (11) Johnson, E. et al. Correlative in-resin super-resolution and electron microscopy using standard fluorescent proteins. Scientific Reports 5, 9583 (2015).
- (12) Sartori, A. et al. Correlative microscopy: Bridging the gap between fluorescence light microscopy and cryo-electron tomography. Journal of Structural Biology 160, 135–145 (2007).
- (13) Tuijtel, M. W., Koster, A. J., Jakobs, S., Faas, F. G. A. & Sharp, T. H. Correlative cryo super-resolution light and electron microscopy on mammalian cells using fluorescent proteins. Scientific reports 9, 1369 (2019).
- (14) Hoffman, D. P. et al. Correlative three-dimensional super-resolution and block-face electron microscopy of whole vitreously frozen cells. Science 367, eaaz5357 (2020).
- (15) Zoriniants, G., Masia, F., Giannakopoulou, N., Langbein, W. & Borri, P. Background-free 3D nanometric localization and sub-nm asymmetry detection of single plasmonic nanoparticles by four-wave mixing interferometry with optical vortices. Phys. Rev. X 7, 041022 (2017).
- (16) Pope, I. et al. Background-free 3D four-wave mixing microscopy of single gold nanoparticles inside biological systems. Proc. SPIE 11922, 119220Q 1–3 (2021).
- (17) Verkade, P. Moving EM: the rapid transfer system as a new tool for correlative light and electron microscopy and high throughput for high-pressure freezing. Journal of Microscopy 230, 317–328 (2008).
- (18) van Weering, J. R. et al. Intracellular membrane traffic at high resolution. Methods Cell Biol. 96, 619–648 (2010).
- (19) Masia, F., Langbein, W. & Borri, P. Measurement of the dynamics of plasmons inside individual gold nanoparticles using a femtosecond phase-resolved microscope. Phys. Rev. B 85, 235403 (2012).
- (20) Manzo, C. & Garcia-Parajo, M. F. A review of progress in single particle tracking: from methods to biophysical insights. Rep. Prog. Phys. 78, 124601 (2015).
- (21) Liu, S.-L. et al. Single-virus tracking: From imaging methodologies to virological applications. Chem. Rev. 120, 1936–1979 (2020).
- (22) Zhang, W. et al. Encapsulation of inorganic nanomaterials inside virus-based nanoparticles for bioimaging. Nanotheranostics 1, 358–368 (2017).
- (23) Masia, F., Langbein, W., Watson, P. & Borri, P. Resonant four-wave mixing of gold nanoparticles for three-dimensional cell microscopy. Opt. Lett. 34, 1816–1818 (2009).
- (24) Berciaud, S., Lasne, D., Blab, G. A., Cognet, L. & Lounis, B. Photothermal heterodyne imaging of individual metallic nanoparticles: Theory versus experiment. Phys. Rev. B 73, 045424 (2006).
- (25) Jiang, Z. et al. Genetically encoded tags for direct synthesis of EM-visible gold nanoparticles in cells. Nature Methods 17, 937–946 (2020).
- (26) URL https://imagej.net/.
- (27) Hodgson, L., Verkade, P. & Yamauchi, Y. Correlative light and electron microscopy of influenza virus entry and budding. Methods Mol Biol. 1836, 237–260 (2018).
4 Methods
FWM set-up. FWM microscopy was performed using a home built set-up, as described in detail in our recent works GiannakopoulouNS20 ; ZoriniantsPRX17 . Briefly, optical pulses of 150 fs duration centered at 550 nm wavelength with =80 MHz repetition rate were provided by the signal output of an optical parametric oscillator (Spectra Physics Inspire HF 100) pumped by a frequency-doubled femtosecond Ti:Sa laser (Spectra Physics Mai Tai HP). The output was split into three beams having the same center optical frequency, resulting in a triply degenerate FWM scheme. One beam acts as a pump and excites the AuNP at the LSPR, with an intensity that is modulated at =0.4 MHz by an acousto-optic modulator (AOM). The change in the AuNP optical properties induced by this excitation is resonantly probed by a second pulse at an adjustable delay time after the pump pulse. Pump and probe pulses are recombined into the same spatial mode and focused onto the sample by a 60 water-immersion objective of 1.27 NA (Nikon CFI Plan Apochromat lambda series MRD70650) mounted onto a commercial inverted microscope (Nikon Ti-U) with a 1.5 tube lens. The sample is positioned and moved with respect to the focal volume of the objective by scanning a sample stage with nanometric position precision (MadCityLabs NanoLP200). A FWM field (proportional to the pump induced change of the probe reflected field) is collected by the same objective (epi-detection), together with the probe reflected field, transmitted by an 80:20 (T:R) beam splitter (BS1 in Fig. 1) used to couple the incident beams into the microscope, and recombined in a 50:50 beam splitter (BS2) with a reference pulse field of adjustable delay. The resulting interference is detected by two pairs of balanced Si photodiodes (Hamamatsu S5973-02). A heterodyne scheme discriminates the FWM field from pump and probe pulses and detects the amplitude and phase of the field. In this scheme, the probe optical frequency is upshifted by a radio frequency amount (=82 MHz), and the interference of the FWM with the unshifted reference field is detected. As a result of the amplitude modulation of the pump at and the frequency shift of the probe by , this interference gives rise to a beat note at , with two sidebands at , and replica separated by the repetition rate of the pulse train frequency comb. A multi-channel lock-in amplifier (Zurich Instruments HF2LI) enables the simultaneous detection of the carrier at =2 MHz and the sidebands at MHz. As described in our previous work ZoriniantsPRX17 the set-up also features a dual polarization scheme. Briefly, in this scheme, probe and pump beams, linearly polarised horizontally (H) and vertically (V) respectively in the laboratory system, are transformed into cross-circularly polarized beams at the sample by a combination of and waveplates (see Fig. 1a). The reflected probe and FWM fields collected by the microscope objective travel backwards through the same waveplates, such that the probe reflected by a planar surface returns V polarized in the laboratory system. The reference beam is polarised at 45 degree (using a polariser) prior to recombining with the epi-detected signal via the non-polarizing beamsplitter BS2. A Wollaston prism vertically separates H and V polarizations for each arm of the interferometer after BS2. Two pairs of balanced photodiodes then provide polarization resolved detection, the bottom (top) pair detecting the current difference (for common-mode noise rejection) of the V (H) polarised interferometer arms. The measured interference corresponds to the co- and cross-circularly polarised components of the reflected probe and FWM fields relative to the incident circularly polarized probe, having amplitudes (phases) indicated as and ( and ), respectively, where () refers to the co (cross) polarised component.
The results in Fig. 1b,c refer to the co-polarised component and the acquisition parameters were as follows: pump-probe delay time of 0.5 ps, b) pump (probe) power at the sample of 100 µW (50 µW), 3 ms-pixel dwell time, pixel size in plane of 21 nm and z stacks over 3 µm in 75 nm z steps; c) pump (probe) power at the sample of 80 µW (40 µW), 1 ms-pixel dwell time, pixel size in plane of 72 nm. The FWM is shown as a maximum amplitude projection for two planes 0.5 µm separated in .
The results in Fig. 5 refer to the co-polarised component and the acquisition parameters were as follows: pump-probe delay time of 0.5 ps, pump (probe) power at the sample of 100 µW (50 µW), 3 ms-pixel dwell time, pixel size in plane: 43 nm.
The results in Fig. 6 refer to the co-polarised component and the acquisition parameters were as follows. 2D overview: pump-probe delay time of 0.5 ps, pump (probe) power at the sample of 20 µW (10 µW), 1 ms pixel dwell time, pixel size in plane 72 nm. 3D stack: pump-probe delay time of 0.5 ps, pump (probe) power at the sample of 20 µW (10 µW), 1 ms pixel dwell time, pixel size in plane 80 nm, 50 nm step size in and 61 z-steps (3 µm total range).
Sample preparation. HeLa cells were grown on 1.5 mm wide sapphire discs (Leica Microsystems) VerkadeJM08 . Following a 2-hour serum starvation, EGF-coupled to 5 or 10 nm radius AuNP was allowed to internalise into the HeLa cells for 20 minutes BrownProtoplasma2010 . After a brief rinse in 20% BSA in growth medium, the disc was placed in a 0.1 mm deep membrane carrier and high pressure frozen (EMPACT2 + RTS, Leica Microsystems) VerkadeJM08 . The frozen carrier was transferred under liquid nitrogen to an automated freeze substitution device (AFS2 + FSP, Leica Microsystems). Freeze substitution to Lowicryl HM20 was performed as described in vanWeeringMCB10 with the exception that any heavy metal stain was omitted. Following UV polymerisation of the resin, 300 nm resin sections were cut and mounted onto copper slot grids on a layer of pioloform. For FWM imaging, the copper grids were mounted in water between a glass coverslip (Menzel Gläser, 24 mm24 mm, # 1.5) and a slide (Menzel Gläser, 76 mm26 mm1.0 mm) inside a 0.12 mm thick (13 mm chamber diameter) imaging gasket (Grace Bio-Labs, SecureSealTM). The copper grid was orientated such that the 300 nm sections were facing the coverslip.
Data analysis. The experimental shot noise was evaluated by taking the statistical distribution of the measured FWM field (both in the in-phase and in-quadrature components detected by the lock-in amplifier) in a spatial region where no FWM is present. The standard deviation of this distribution was deduced and was found to be identical in both components, as well as for the co-polarised and cross-circularly polarised components, as expected for an experimental noise dominated by the shot noise in the reference beam ZoriniantsPRX17 . The error bars in the FWM field ratio in Fig. 2 are calculated by propagating the errors from the experimental shot noise in the co- and cross-circularly polarised components, and are shown as two standard deviations. The FWM field ratios in Fig. 2 were measured from the two in-plane data sets 0.5 µm apart in forming the overview in Fig. 1c. Notably, the FWM ratio values are slightly dependent on the axial position of the AuNP. Hence, care was taken to consider the ratio only for NPs that were in focus, based on the maximum co-polarised FWM amplitude detected and on the width of the point-spread function (see SI Fig. LABEL:S-ratiovsz).
The fitted ellipses to the TEM images in Fig. 2 are obtained using the "Analyse particles - fit ellipse" command in the freely available Java-based image analysis program ImageJ ImageJ . This command measures and fits objects in thresholded images. It works by scanning the selection until it finds the edge of an object. It then provides the major and minor semi-axis and the orientation angle of the best fitting ellipse. The orientation angle is calculated between the major axis and a line parallel to the -axis of the image (see sketch in Fig. 2). For the ellipses shown by the yellow lines in the TEM images in Fig. 2, the "auto-threshold" default option was applied. To estimate the error bars in the fitted aspect ratios and in the angle , TEM images were re-fitted using a different threshold such that the area of the fitted ellipse was 80% of the area obtained with auto-threshold, as shown in SI Fig. LABEL:S-ellipse. The horizontal errors bars in Fig. 2 are the single-sided distances between the values using the auto-threshold option and the re-fitted values.
Centroid fitting. To determine the centroid position of the NPs, we have fitted the spatially resolved FWM field with a Gaussian complex function given by
| (1) |
where is the amplitude of the signal at the peak, its phase, a mean width of the peak, and the coordinates of the centroid, the ellipticity of the peak and the orientation.
Affine transformation. We use the linear transformation between the coordinates of image A and the coordinates of image B
| (2) |
with the shear (), scaling (), rotation () and translation (), given by
| (3) |
where and are the component of the translation vector between the two systems, the rotation angle, and the scaling factors and the shear between the transformed axes.
To determine the transformation parameters, we identify the same objects (i.e., nanoparticles) in the two images and estimate their coordinates. We then perform a nonlinear least-squares fitting of the parameters, minimising the quantity
| (4) |
where counts the objects. Knowing , the image A can be transformed into the reference system of image B by transforming the coordinate of each pixel in A and interpolating the corresponding intensity to map the position of the pixels in B.
For the case of nanoparticle clusters in FWM, the centroid coordinate position of each nanoparticle cluster from the FWM z-stack was calculated using the "3D object counter" plugin in ImageJ.
TEM. Following the FWM analysis, the grids were recovered for TEM analysis by flooding the space between the coverslip and slide with excess water and gently lifting the coverslip HodgsonMMB18 . The grid was subsequently dried and transferred to a 120kV or 200kV transmission EM (Tecnai12 or Tecnai20 respectively, FEI, now Thermo Scientific). The site of interest was retraced using the outline of the sections and calculating the approximate position of the cell(s) of interest. Overview images were collected, followed by subsequent zooms into the area of interest. No fiducials were added, as they are not required in the reported single AuNP probe CLEM. An example of this workflow is described in Fig. LABEL:S-workflow.
Acknowledgements
This work was funded by the UK EPSRC Research Council (Grants EP/I005072/1, EP/I016260/1, EP/L001470/1, and EP/M028313/1) and the UK BBSRC Research Council (Grants BBL014181/1, BB/M001969/1).
Authors’ contributions
P. B., W. L. and P.V. conceived the technique and designed the experiments. W.L. designed the FWM experimental setup and wrote the FWM acquisition software. I.P. performed all FWM experiments and most of the data analysis. F.M. contributed to the correlation analysis and wrote the corresponding analysis software. L.P. contributed to NP shape analysis and wrote the corresponding analysis software. P.B. performed part of the analysis and wrote the manuscript. P.V. performed the internalisation experiments and EM processing. H. T., K. P. A., J. M. and P. V. performed the EM analysis. P.V. contributed to writing parts of the manuscript. All authors discussed and interpreted the results and commented on the manuscript.
Additional information
Supplementary Information is available for this paper.