Distribution Aware Metrics for Conditional Natural Language Generation
Abstract
Traditional automated metrics for evaluating conditional natural language generation use pairwise comparisons between a single generated text and the best-matching gold-standard ground truth text. When multiple ground truths are available, scores are aggregated using an average or max operation across references. While this approach works well when diversity in the ground truth data (i.e. dispersion of the distribution of conditional texts) can be ascribed to noise, such as in automated speech recognition, it does not allow for robust evaluation in the case where diversity in the ground truths represents signal for the model. In this work we argue that existing metrics are not appropriate for domains such as visual description or summarization where ground truths are semantically diverse, and where the diversity in those captions captures useful additional information about the context. We propose a novel paradigm for multi-candidate evaluation of conditional language generation models, and a new family of metrics that compare the distributions of reference and model-generated caption sets using small sample sets of each. We demonstrate the utility of our approach with a case study in visual description: where we show that existing models optimize for single-description quality over diversity, and gain some insights into how sampling methods and temperature impact description quality and diversity.
1 Introduction
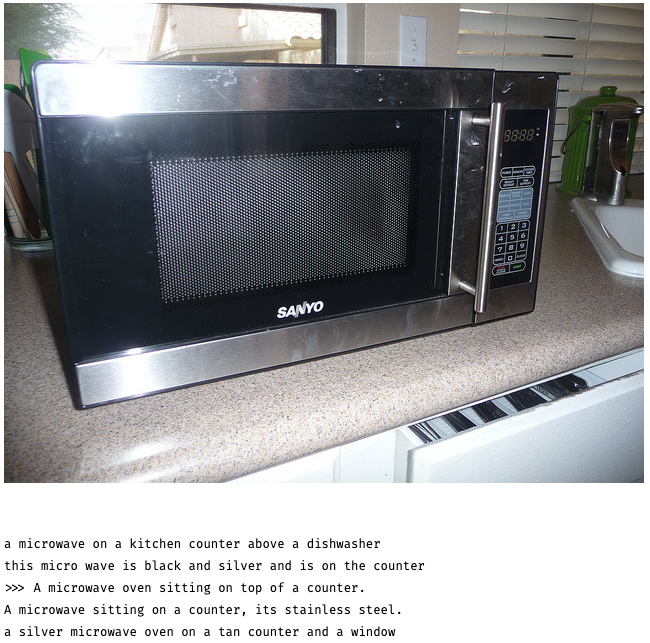
Recent models for conditional language generation, particularly in the field of visual description, have shown dramatic improvements in both fluency and the ability to ground generated language in context [23, 48, 25, 10]. Standard metrics for these tasks such as BLEU, ROUGE, METEOR, and CIDEr, compare a generated text with a reference set of texts and compute some measure of quality for the generated text. By construction of these metrics, a model will achieve the best performance by generating a single high-scoring text. In contrast, it has been widely observed that large language models such as GPT-3 [7] or LAMDA [39] generate the most realistic texts at temperatures close to one, where the set of potential texts generated is often very diverse. More significantly, if we look at an example of an image from MS-COCO and its set of reference captions (Figure 1), we notice that each (human-generated) reference contains a unique subset of the overall information in the image:
| “A woman in a red robe is sitting at a dining table." |
| “A woman in a red flowered shawl sits at a table while a man wearing jeans is in the kitchen looking at her." |
| “A person sits at a table and another person stands in the kitchen." |
| “A woman is sitting at a table wearing a robe while a man is cooking." |
| “Man and woman in a kitchen looking in the same direction." |
Important features like the red robe, the man, the gaze of the two people etc, are mentioned only in one or a few captions. Metrics that encourage generating information from only one of these captions will generally fail to capture much of the important detail in the image. This holds for more than just image description. For many conditional language generation tasks such as video captioning, abstractive summarization, translation, and open-ended question-answering, it is often beneficial to be able to sample from a diverse distribution of generated outputs.
If we compute a caption from a state-of-the-art model [48] (under standard metrics) we get:
| "A woman sitting in a kitchen next to a man." |
And we see that only information common to most or all of the reference captions is preserved. This is intuitive, since including more information runs the risk that no reference caption contains that information, leading to a low score. Note that this caption may not actually be the most likely (highest expected similarity to a reference caption), because e.g. the BLEU score also includes a term encouraging longer texts. It seems the designers of these metrics are already aware that direct use of shortest distance to a reference caption favors generated captions which are even shorter and more impoverished. However, the (log-) text length heuristic in standard metrics is a poor proxy for actual diversity. Instead of generating a variety of captions, taking 10 samples from the state-of-the-art model, yields only 10 repetitions of the above caption.
Thus, we encounter an issue in the evaluation of conditional text generation models from multiple sampled texts. When several ground truths are available, typically the metric score is based on the maximum score with some ground truth. This leads to an issue, shown earlier, where the model is encouraged to produce a text with the lowest expected distance (max pairwise score for a particular -gram as in BLEU) to a reference text, i.e. near a strong mode in the training text distribution. Changing the metric aggregation method, say from max score over reference examples to average or sum (ROUGE), does not change the situation substantially. The model will still be encouraged to produce a single output with high average scores to nearby references, which will be maximized at a smoothed mode in the training text distribution. Failure modes of other methods of aggregation are discussed in both Caglayan et al. [8] and Yeh et al. [46], including issues with multi-modal reference distributions and single outlier texts.
Such an over-reliance on simple aggregations for multiple candidates and references has, over time, compounded into several issues: The first, discussed further in section 3, is that, as observed in visual description by Chan et al. [9] and dialog generation by Caglayan et al. [8], human performance on datasets with existing metrics is often lower than model performance, even though human-generated captions tend to receive higher scores under human evaluation. The second, discussed in section 2, is that diversity of candidate texts is largely relegated to secondary and reference-unaware measures, encouraging models to diverge from ground truth distributions to hit diversity targets.
In this work, we aim to solve these problems by introducing several novel automated ways of measuring the performance of conditional text generation models based on measuring the divergence between samples from two text distributions. While some recent methods have been designed to closely measure the divergence between full distributions of text data in the unconditional case [29], no such methods exist for the conditional generation case, which operates on the level of 10s of reference samples and candidates. Our contributions are summarized as follows:
-
1.
We introduce a new paradigm for the evaluation of conditional text generation models based on sampling from both candidate and reference distributions.
-
2.
We introduce two new families of metrics extending existing semantic distances, triangle-rank metrics, and kernel-based metrics, designed to measure the divergence between small text samples from candidate and reference distributions.
-
3.
We explore how our new metrics behave in the context of visual description (both image and video description) and show that by measuring distributional effects, we can capture nuances in the data that existing metrics cannot explore.
2 Related Work
This work is not the first to notice the shortcomings of traditional metrics for the automated evaluation of conditional language generation models. In visual dialog, Caglayan et al. [8] find that a number of the automated metrics proposed for visual dialog do not match well with human judgment, while in visual description, Chan et al. [9] find that current automated metrics do not assign high scores to human-generated descriptions. This work not only quantifies such issues but proposes a method for addressing these cases without developing novel metrics for measuring text semantic distance. In this section, we review related works, roughly divided into three groups; methods for evaluating text quality, text diversity and distribution aware metrics.
Measuring the Quality of Generated Text:
The evaluation of machine-generated text has long been an active area of research, which has continuously evolved to keep pace with accelerating advances in text generation. As a consequence of the tools available and the state of early text generation approaches, classical measures have primarily focused on evaluating the quality of generated text with respect to ground truth references using surface-level text statistics. Most notably, these include -gram matching based metrics like BLEU [26], METEOR [3], ROUGE [20], and CIDEr [41]. More recently, the rapid progress enabled by large-scale language models has motivated new evaluation techniques which go beyond superficial n-gram statistics and toward measures that aim to capture the underlying semantics of language [37, 11, 47, 35]. These approaches leverage high dimensional representations of generated and reference text provided by a state-of-the-art language model, such as BERT [12] in the case of BERTScore [47] and BLEURT [35]. While such methods are focused on measuring the semantic distance between two pairs of natural language texts, the evaluation of the diversity of the generated captions has largely been done independently of quality.
Measuring the Diversity of Generated Text:
Until recently, measures of diversity for generated text have been largely secondary to measures of quality, since the pursuit of human-like generated text has been the primary focus of the field. In fact, many diversity measures quantify surface-level statistics of the generated text, such as metrics based on the number of unique tokens, unique sentences, or unigram frequency statistics, such as Zipf coefficients [17]. Similarly, -gram-based diversity measures such as self-BLEU [49], compute scores between samples from a model. Unfortunately, these approaches do not consider the diversity of a model’s outputs with respect to the diversity of human references. Such measures are also primarily focused on the diversity of the vocabulary, rather than the aggregate semantic diversity, a factor that our proposed work aims to address.
Distribution Aware Measures of Generated Text:
Recently, MAUVE, proposed by Pillutla et al. [29], addresses the single-text evaluation paradigm by measuring the divergence between multi-candidate samples and multiple ground truths using density estimates in a text embedding space. Such an approach has the power to measure both dispersion of the text and the quality of the generated text simultaneously. In this respect, MAUVE is the most similar work to ours, in that it proposed a distribution-aware metric. That being said, MAUVE is designed for the setting of unconditional text generation, where many ground truth samples are available, and the entire dataset of human reference texts is compared to model outputs. Unfortunately, while MAUVE works well in these scenarios, it does not work well when only a few references are available (due to its K-means distributional approximation) (see appendix B.5). Such a low-reference scenario is common in conditional NLG, making MAUVE unsuitable for many potential applications.
3 Methods
In this section, we introduce our two primary contributions. First, we introduce and demonstrate the need for a paradigm for multiple candidate evaluation for conditional language generation, and second, we introduce several simple augmentations to existing pairwise metrics, designed to alleviate the sensitivity issues induced by evaluating conditional language generation models with only a single candidate text. Our family of augmented metrics, which we dub Triangle-Rank Metrics (TRMs), represents the first step towards optimizing metrics that force models not only to generate samples at the locus of a distribution but also with sufficient variance, hopefully alleviating the field-wide issues that optimizing standard pairwise-metrics can induce.
3.1 Multiple Candidate/Multiple Reference Evaluation
Traditionally, most methods for conditional language generation have been designed to sample a single candidate example using beam search, designed to be a maximum likelihood sample of the data. This single candidate is compared against the reference data. Unfortunately, as discussed in section 1, models can easily exploit such aggregations. For example, when the best score amongst the ground truths is chosen (the “min-distance" aggregate), models generate texts optimizing the expected minimum distance to the reference distribution. Such a text is, by definition, the mode of the distribution. While we don’t know exactly what this looks like in the case of natural language, the mode likely represents some amount of central tendency. In practice, we observe such central captions tend to be bland and uninformative, as demonstrated in Chan et al. [9] for visual description, Yang et al. [45] for image generation, and appendix B.3.
Thus, a single candidate may not be sufficient to understand if the model has learned to approximate the reference distribution. Consequently, we aim to develop methods that can sample several suitable candidate texts, each with high accuracy, while matching the diversity of the ground truth distribution. In this work, to extend methods to multiple candidate generation, we leverage temperature-based sampling or nucleus sampling (as indicated) to produce multiple candidates from each model’s distribution. While beam search is another method for generating multiple candidates, Vijayakumar et al. [42] noted that diversity among beams is relatively poor, leading to samples that are less true to the candidate distribution of the model. This gives us a model which generates multiple candidate samples, and requires an evaluation metric which compares multiple candidate samples to multiple reference samples.
Note that a sampling approach to generating diverse captions does not preclude a future effort toward generating single “omnibus” captions, which capture detail from many diverse captions. However, such captions will be much longer than typical human captions, and will score poorly under the standard metrics, as they would be quite different from (much more detailed than) individual reference captions. A path toward such omnibus captions (assuming they are practically useful), would be to first generate diverse human-like captions, and then summarize a set of them into a single text. The present work still supports the first step of diverse caption set generation and optimization.
Extending Existing Metrics for Multi-Candidate Evaluation
Currently, no standard pairwise metrics (BLEU, METEOR, CIDEr, ROUGE, CIDEr, SPICE) support a comparison between multiple candidates and multiple references, and the most efficient extension of existing metrics to multi-candidate, multi-reference situations is a non-trivial task. In this work, we naively extend the existing pairwise metrics [26, 1, 20, 41, 47] to multiple candidates through the use of mean aggregation. Thus, for a standard pairwise score , set of candidates and a set of references , we assign the output score as:
| (1) |
3.2 Triangle-Rank Metrics (TRMs)
Existing metrics for semantic similarity are extremely powerful for determining pairwise semantic distances between two utterances [26, 1, 20, 41, 2], thus, it makes little sense to discard the existing research when extending metrics to a multiple-candidate evaluation. How, then, can we leverage already strong pairwise tools in a multiple candidate scenario? Unfortunately, many statistical techniques for measuring the distances between samples require points to lie in a metric space [4] - however, most text distances neither respect symmetry nor triangle inequality.
We propose an answer based on an application of the triangle-rank statistic for statistical testing proposed by Liu and Modarres [24]. The triangle-rank statistic has several promising properties: it neither requires symmetry nor the triangle inequality in the metric space (it only requires ), and it is computed using only pairwise distances, meaning that we can easily reuse existing text semantic distance functions when computing the statistic.
For the purpose of explanation, it can be helpful to think of texts as points on an arbitrary manifold (based on the selected text distance function). To compute the triangle-rank statistic for a given distance , a set of candidates and a set of references , we first extract all directed triangles , such that one point lies in the set , and two points lie in the set or two points lie in and one point lies in . We refer to the edge between points from the same distribution as and the other two edges as and . We then compute the score for each of the edges. For , let
| (2) |
We then compute indicators for each triangle as follows:
| (3) | ||||
These indicators represent the rank of the same-sample edge (if it is the smallest, largest, or middle-sized edge). The statistic for the sample , is then computed as:
| (4) | ||||
An intuition for how this statistic measures difference is given in Figure 2. Because this statistic takes into account the full distribution through triplets of samples, it does not suffer from the issues with aggregation discussed in section 1 and earlier in this section. Not only does it solve these issues, the TRM extensions build on the existing pairwise metrics, allowing us to increase the sensitivity of the metrics while retaining the existing semantic distance measure and intuitions.
3.3 Kernel-Based Metrics
While TRMs represent one method of augmenting existing pairwise metrics, a second possible approach relies on representing utterances as points in the embedding space of a model, particularly a large pre-trained model such as BERT [12] or GPT [7]. Evaluating the distance between two distributions based on representative samples on a Euclidean manifold is relatively well studied. One option, MAUVE, introduced by Pillutla et al. [29], uses a K-Means density estimator to estimate the distribution of the points on this manifold and then computes a fixed divergence (such as Kullbeck-Libeller) between the two density estimates. While MAUVE can be powerful when you have a large number of samples, it can struggle to correctly estimate the density when there are few samples, such as in the case of conditional language generation, as the K-means density estimator is poorly suited to such situations. Several possible extensions to MAUVE could be considered as an alternative family of distribution-aware metrics, which we dub “Kernel-Based Metrics" (KBMs).
Frechet BERT Distance
Well known in the GAN literature, the Frechet Inception Distance [34] represents the squared Wasserstein distance between multidimensional Gaussian distributions fitted to the components of the input. In the Frechet BERT Distance metric, we replace the Inception embeddings with those from a pre-trained BERT model [12]. See appendix A.6 for details.
MMD-BERT
A related, and often-used metric is the maximum mean discrepancy distance function [19], which leverages a density estimate of the data, and computes the maximum mean discrepancy between the density estimates for each sample. In our case, we leverage a Gaussian kernel estimate over the embeddings generated by a pre-trained BERT model [12]. See appendix A.7 for details.
4 Case Study: Visual Description
| Dataset | Model | BERT [47] | CIDEr-D [41] | BLEU@4 [26] | METEOR [3] | ROUGE-L [20] |
|---|---|---|---|---|---|---|
| MSR-VTT | TVT [10] | 0.6582 | 0.4098 | 0.7813 | 0.4573 | 0.4771 |
| O2NA [23] | 0.6455 | 0.4574 | 0.7959 | 0.5646 | 0.5938 | |
| Human | 0.5153 | 0.5314 | 0.8291 | 0.5306 | 0.5669 | |
| MS-COCO | CLIPCap [25] | 0.5581 | 0.8223 | 0.8788 | 0.7483 | 0.7985 |
| VLP [48] | 0.5925 | 0.7424 | 0.8593 | 0.6644 | 0.7706 | |
| Human | 0.6406 | 0.6686 | 0.8743 | 0.6358 | 0.6841 |
Visual description is a challenging conditional natural language task, which requires that a model produce a natural language description of a visual context containing objects, actions, and relationships present in a scene. Data sets for visual description often set themselves apart from other datasets for conditional natural language generation (such as those for translation and summarization), as they contain more than one ground truth sample, making it possible to evaluate visual description models using reference data that has already been collected. In this set of experiments, which look at two datasets for visual description, MSCOCO (image description) [21] and MSR-VTT [44] (video-description) (full dataset details in appendix A.2), we demonstrate that current metrics are not sensitive enough to evaluate the performance of several existing models with our new metrics. We then demonstrate quantitatively how a multi-candidate evaluation paradigm can close this gap, and how a more sensitive metric, such as TRMs or KBMs, can provide new model insights.
Existing single-ground truth comparison is not sensitive enough
A natural first question to ask when evaluating the performance of a metric is, “given the existing data, is the metric sensitive enough to distinguish between a model and a reference distribution?" To answer this question, we evaluated the p-values for several existing metrics on a single video. The results, shown in Table 1 demonstrate that using a single description for the candidate dataset is insufficient to tell even known different distributions apart, motivating a transition to a paradigm with significantly more sensitivity. This is a similar result to the observations made in Yeh et al. [46] and Liu et al. [22] for dialog generation: most metrics are unable to produce significant results using existing techniques. Thus, even for standard metrics, it makes sense to sample more than one ideal candidate description and aggregate the metric score across these candidate descriptions.
TRM and KBM metrics are more sensitive than naive aggregation
In section 3, we proposed several new metrics which can be leveraged by switching to multi-candidate evaluation. Figure 3 shows the sensitivity of both the newly introduced metrics and existing metrics using the naive aggregation schemes discussed in section 3, as we increase the number of candidate samples from the model. While the sensitivity increases for all models to significance, our proposed metrics are much more sensitive with fewer candidate and reference descriptions. As an additional check, when tested on human captions, our metrics do not consider the two distributions significantly different (, see appendix B.4). Our proposed metrics do not alter the manifold: so, for example, and METEOR measure the same underlying intuitive divergences (n-gram recall with some additional synonym matching), however, our TRM method increases the sensitivity of the test, allowing us to measure the full distribution divergence, instead of using naive aggregates. It is useful to note that when computing the metrics for a practitioner, computing the p-value of the data is unnecessary (we need only sample enough candidates so we can be sure of the statistical significance of the metric).

Multi-candidate evaluation illustrates a diversity vs. likelihood trade-off
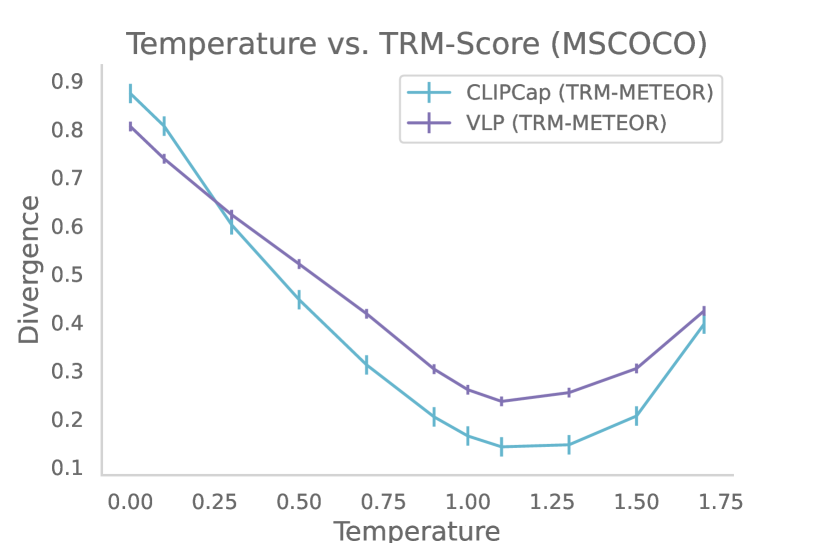
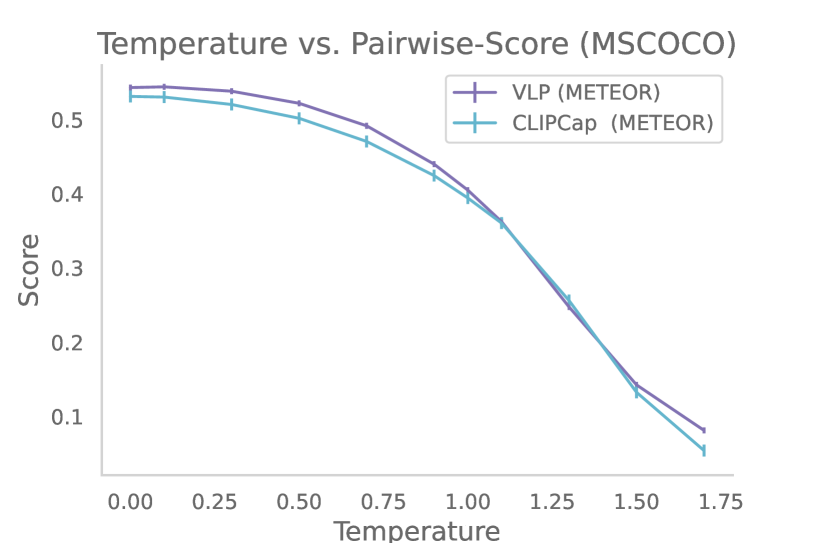
A metric’s sensitivity to the full distribution has the power to give us novel insights into the visual description task. Consider the two models, VLP [48], a standard transformer-based model pre-trained on large-scale vision and language data, and CLIPCap [25], a transformer-based model which is initialized with a large language model, and uses prefix-tuning with CLIP [30] embeddings (Additional details in appendix A.3). While VLP [48] outperforms CLIPcap [25] in the standard scoring methods, CLIPcap outperforms VLP in the metric. Why is there such an inversion? We can begin to understand the results when looking a bit closer at Figure 5, which plots sampling temperature from the model, against the performance on the and standard METEOR metrics. We can see that at low temperatures, where the model is sampling from single maximum-likelihood estimates, VLP outperforms the CLIPcap method. As the temperature increases, we see that there is an inversion in the model performance, and at higher temperatures, CLIPcap outperforms VLP. On the other hand, in the standard METEOR metric, as we increase temperature, performance monotonically decreases, giving little insight. Figure 5 illustrates that captures a subtlety in the model comparisons that METEOR does not capture alone: while VLP produces better descriptions at low temperatures, it becomes less fluent (likelihood) on average as we introduce diversity, leading to a change in position. The result is also visible in qualitative samples, given in Figure 4, where we see TRM metrics prioritize both diversity and likelihood.
Sampling algorithms matter
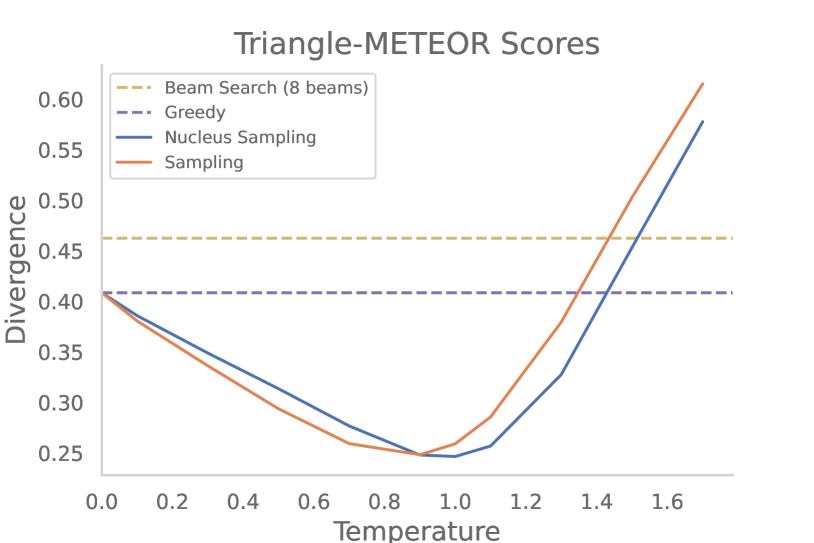
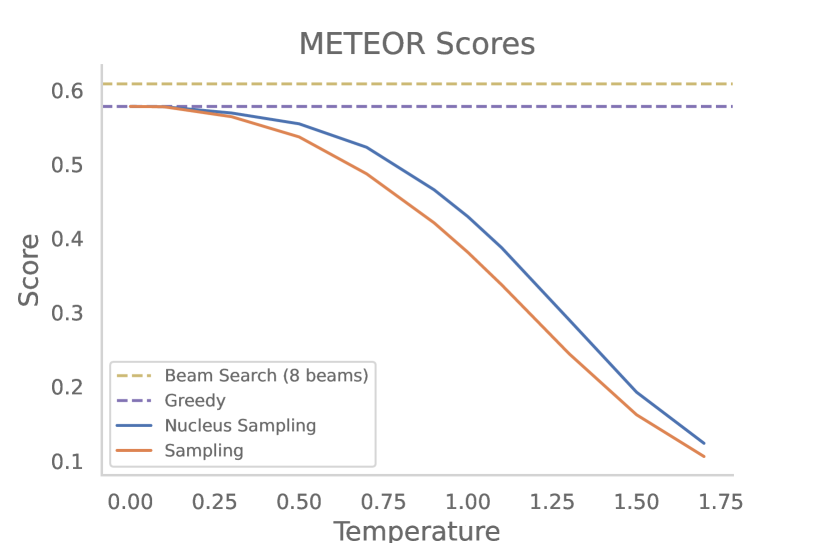
Not only does the temperature of the generation process matter when correctly trading off between diversity and description correctness (as seen in the previous discussion), but the sampling process itself matters. Figure 6 shows the performance at different temperatures of the Nucleus sampling method [17] vs. standard sampling, beam search, and greedy, approaches. While maximum-likelihood methods achieve the best METEOR scores, they have relatively high divergence, as they sample only a single description. From Figure 6 we can further see that illustrates how Nucleus sampling allows models to achieve higher temperatures than standard sampling without diverging significantly from the distribution. METEOR alone does not indicate such an effect and only monotonically decreases.
5 Discussion, Limitations & Social Impact
Kernel-Based Metrics (KBMs) vs. Triangle-Rank Metrics (TRMs)
A natural question to ask is: "which metric should practitioners choose when evaluating conditional language models?" While all of these metrics represent an improvement over standard scores, there are pros and cons to each. The KBMs have one major, distinct, advantage over the TRMs in that they are naturally differentiable. KBMs also have downsides. The first is that, unlike the TRMs, they require both a pre-trained BERT model and a kernel-density estimator which both have complex behavior affecting the performance of the model. The TRMs, however, can be specified on top of existing natural language distance functions, improving the ability of the user to intuit the model performance. Additionally, TRMs are bounded and have p-values that can be computed analytically. Finally, because the TRMs do not need a density estimate, they can be more sensitive with small sample sizes (see Figure 3), which is essential for conditional language generation where we have only a few gold-standard samples. Table 2 demonstrates another key benefit of TRMs: efficiency. The time per sample to compute TRMs, while higher than single metric standards, is lower than KBMs on average. In the case of Mauve, computing the p-values is largely intractable (See appendix B.5).
Perplexity
Although not normally presented in existing research, we acknowledge that perplexity is another alternative metric to the above methods, as it represents the overall likelihood of the test distribution under the existing data. While we strongly believe that methods for conditional language generation should report the perplexity of their models, it has also been noted by Theis et al. [38] that perplexity can suffer from several issues in the evaluation of generative models. For example, a lookup table storing sufficiently many training examples will produce convincing results but have poor perplexity on the test data. On the other hand, van den Oord and Dambre [40] demonstrates that even in situations where the perplexity is high, models may not generate high-quality test samples.
A Discussion on Human Correlation
In this work, we do not provide any experiments correlating our metric scores with human judgments. The reason is two-fold. First, humans are relatively poor at measuring the semantic distance between two distributions in the presence of distractors [13]. Automated metrics represent a key method for bridging this gap: methods such as TRMs allow us to overcome any deficiencies in human judgment and sensitivity. The second is that the TRM-metrics build on existing, well-established measures with strong human correlation [41, 20, 1, 26]. Because we do not alter the distance manifold, our contributions only serve to increase the sensitivity of existing measures of semantic similarity, rather than replace the measures altogether.
A Note on Reference-Free Metrics
Some metrics, such as CLIP-score [16] for visual description, are immune to ground truth aggregation effects as they are computed in a reference-free way, and focus on pre-trained models’ ability to ground vision and language information. Unfortunately, such large, black-box, models represent a liability as a metric as their capabilities are largely unknown, and untested [15, 8]. Further, the metric is only as good as the model, and CLIP has been known to suffer from numerous issues including counting, attribute-association, and spatial reasoning [5, 32].
| METEOR | CIDEr | MMD-BERT | FID-BERT | MAUVE | |||
|---|---|---|---|---|---|---|---|
| Samples/Sec | 298.4 18.3 | 161.18 21.2 | 131.23 12.6 | 97.54 9.1 | 53.76 38.7 | 17.45 4.6 | 2.29 0.78 |
| Wall Time (Min) | 2.26 | 4.18 | 5.14 | 6.92 | 12.55 | 38.68 | 294.78 |
Limitations
While multi-candidate evaluation of conditional language generation models represents a significantly more robust paradigm, it still has several drawbacks. One of the core drawbacks is the availability of multi-reference data. Outside the field of visual description, it is often not a standard practice to collect more than one gold-standard reference (even in fields such as summarization, where it makes sense to do so). Additionally, multi-candidate evaluation is less efficient than existing evaluation techniques, which may encourage an unintended reduction in evaluation. Further, such multi-candidate evaluation methods are somewhat less interpretable than single caption metrics, as they incorporate several axes at once, whereas existing pairwise metrics describe only a single axes of semantic similarity at any time. Still, existing metrics are often used as a “single number" for determining the quality of a model, a task that is better ascribed to multi-candidate metrics.
Social Impact
As a whole, optimizing distribution-aware metrics has the potential to produce more diverse outputs while retaining fluency. Such models will lead to visual description models which represent a wider array of viewpoints while retaining factual correctness. In the short-term, however, optimizing diversity at the cost of fluency or correctness has the potential to increase hallucination in conditional models, the ramifications of which are well-explored in Ji et al. [18]. Because as a community we have optimized for pairwise metrics, some regression may occur as we increase diversity, leading to perceptible decreases in quality over existing models.
6 Conclusion
In this work, we have introduced a robust framework for multi-candidate evaluation of conditional language generation models, shown that existing metrics for semantic similarity can be seamlessly extended to this framework, and demonstrated through a case study of visual description that multi-candidate evaluation paired with more sensitive distribution-aware metrics has the power to provide novel insights into existing models and methods. This paper does not represent the end of the journey, however, towards distribution-aware metrics for conditional text generation. It remains exciting and necessary for future work to explore how a wider range of existing generation techniques and models perform under this new paradigm, and, as data availability expands, to understand the implications of distribution-aware evaluation in fields beyond visual description. Our proposed methods represent a step toward a more robust evaluation paradigm, and we hope that our results, code, and data (To be released soon), will inspire further research into this exciting area of conditional language generation.
References
References
- Agarwal and Lavie [2008] A. Agarwal and A. Lavie. Meteor, m-bleu and m-ter: Evaluation metrics for high-correlation with human rankings of machine translation output. In Proceedings of the Third Workshop on Statistical Machine Translation, pages 115–118, 2008.
- Anderson et al. [2016] P. Anderson, B. Fernando, M. Johnson, and S. Gould. Spice: Semantic propositional image caption evaluation. In European conference on computer vision, pages 382–398. Springer, 2016.
- Banerjee and Lavie [2005] S. Banerjee and A. Lavie. Meteor: An automatic metric for mt evaluation with improved correlation with human judgments. In Proceedings of the acl workshop on intrinsic and extrinsic evaluation measures for machine translation and/or summarization, pages 65–72, 2005.
- Basseville [2013] M. Basseville. Divergence measures for statistical data processing—an annotated bibliography. Signal Processing, 93(4):621–633, 2013.
- Blattmann et al. [2022] A. Blattmann, R. Rombach, K. Oktay, and B. Ommer. Retrieval-augmented diffusion models. arXiv preprint arXiv:2204.11824, 2022.
- Bojanowski et al. [2017] P. Bojanowski, E. Grave, A. Joulin, and T. Mikolov. Enriching word vectors with subword information. Transactions of the association for computational linguistics, 5:135–146, 2017.
- Brown et al. [2020] T. Brown, B. Mann, N. Ryder, M. Subbiah, J. D. Kaplan, P. Dhariwal, A. Neelakantan, P. Shyam, G. Sastry, A. Askell, et al. Language models are few-shot learners. Advances in neural information processing systems, 33:1877–1901, 2020.
- Caglayan et al. [2020] O. Caglayan, P. Madhyastha, and L. Specia. Curious case of language generation evaluation metrics: A cautionary tale. arXiv preprint arXiv:2010.13588, 2020.
- Chan et al. [2022] D. M. Chan, A. Myers, S. Vijayanarasimhan, D. A. Ross, B. Seybold, and J. F. Canny. What’s in a caption? dataset-specific linguistic diversity and its effect on visual description models and metrics. arXiv preprint arXiv:2205.06253, 2022.
- Chen et al. [2018] M. Chen, Y. Li, Z. Zhang, and S. Huang. Tvt: Two-view transformer network for video captioning. In Asian Conference on Machine Learning, pages 847–862. PMLR, 2018.
- Clark et al. [2019] E. Clark, A. Celikyilmaz, and N. A. Smith. Sentence mover’s similarity: Automatic evaluation for multi-sentence texts. In Proceedings of the 57th Annual Meeting of the Association for Computational Linguistics, pages 2748–2760, 2019.
- Devlin et al. [2018] J. Devlin, M.-W. Chang, K. Lee, and K. Toutanova. Bert: Pre-training of deep bidirectional transformers for language understanding. arXiv preprint arXiv:1810.04805, 2018.
- Durga [1980] R. Durga. Semantic distance and semantic judgment. Outstanding Dissertations in Bilingual Education Recognized by the National Advisory Council on Bilingual Education, 1979, page 15, 1980.
- Fisher [1992] R. A. Fisher. Statistical methods for research workers. In Breakthroughs in statistics, pages 66–70. Springer, 1992.
- Floridi and Chiriatti [2020] L. Floridi and M. Chiriatti. Gpt-3: Its nature, scope, limits, and consequences. Minds and Machines, 30(4):681–694, 2020.
- Hessel et al. [2021] J. Hessel, A. Holtzman, M. Forbes, R. L. Bras, and Y. Choi. CLIPScore: a reference-free evaluation metric for image captioning. In EMNLP, 2021.
- Holtzman et al. [2019] A. Holtzman, J. Buys, L. Du, M. Forbes, and Y. Choi. The curious case of neural text degeneration. In International Conference on Learning Representations, 2019.
- Ji et al. [2022] Z. Ji, N. Lee, R. Frieske, T. Yu, D. Su, Y. Xu, E. Ishii, Y. Bang, A. Madotto, and P. Fung. Survey of hallucination in natural language generation. arXiv preprint arXiv:2202.03629, 2022.
- Li et al. [2017] C.-L. Li, W.-C. Chang, Y. Cheng, Y. Yang, and B. Póczos. Mmd gan: Towards deeper understanding of moment matching network. Advances in neural information processing systems, 30, 2017.
- Lin [2004] C.-Y. Lin. Rouge: A package for automatic evaluation of summaries. In Text summarization branches out, pages 74–81, 2004.
- Lin et al. [2014] T.-Y. Lin, M. Maire, S. Belongie, J. Hays, P. Perona, D. Ramanan, P. Dollár, and C. L. Zitnick. Microsoft coco: Common objects in context. In European conference on computer vision, pages 740–755. Springer, 2014.
- Liu et al. [2016] C.-W. Liu, R. Lowe, I. V. Serban, M. Noseworthy, L. Charlin, and J. Pineau. How not to evaluate your dialogue system: An empirical study of unsupervised evaluation metrics for dialogue response generation. arXiv preprint arXiv:1603.08023, 2016.
- Liu et al. [2021] F. Liu, X. Ren, X. Wu, B. Yang, S. Ge, and X. Sun. O2na: An object-oriented non-autoregressive approach for controllable video captioning. arXiv preprint arXiv:2108.02359, 2021.
- Liu and Modarres [2011] Z. Liu and R. Modarres. A triangle test for equality of distribution functions in high dimensions. Journal of Nonparametric Statistics, 23(3):605–615, 2011.
- Mokady et al. [2021] R. Mokady, A. Hertz, and A. H. Bermano. Clipcap: Clip prefix for image captioning. arXiv preprint arXiv:2111.09734, 2021.
- Papineni et al. [2002] K. Papineni, S. Roukos, T. Ward, and W.-J. Zhu. Bleu: a method for automatic evaluation of machine translation. In Proceedings of the 40th annual meeting on association for computational linguistics, pages 311–318. Association for Computational Linguistics, 2002.
- Pennington et al. [2014] J. Pennington, R. Socher, and C. D. Manning. Glove: Global vectors for word representation. In Proceedings of the 2014 conference on empirical methods in natural language processing (EMNLP), pages 1532–1543, 2014.
- Perez-Martin et al. [2021] J. Perez-Martin, B. Bustos, and J. Pérez. Improving video captioning with temporal composition of a visual-syntactic embedding. In Proceedings of the IEEE/CVF Winter Conference on Applications of Computer Vision, pages 3039–3049, 2021.
- Pillutla et al. [2021] K. Pillutla, S. Swayamdipta, R. Zellers, J. Thickstun, S. Welleck, Y. Choi, and Z. Harchaoui. Mauve: Measuring the gap between neural text and human text using divergence frontiers. In M. Ranzato, A. Beygelzimer, Y. Dauphin, P. Liang, and J. W. Vaughan, editors, Advances in Neural Information Processing Systems, volume 34, pages 4816–4828. Curran Associates, Inc., 2021. URL https://proceedings.neurips.cc/paper/2021/file/260c2432a0eecc28ce03c10dadc078a4-Paper.pdf.
- Radford et al. [2021a] A. Radford, J. W. Kim, C. Hallacy, A. Ramesh, G. Goh, S. Agarwal, G. Sastry, A. Askell, P. Mishkin, J. Clark, G. Krueger, and I. Sutskever. Learning transferable visual models from natural language supervision. In M. Meila and T. Zhang, editors, Proceedings of the 38th International Conference on Machine Learning, ICML 2021, 18-24 July 2021, Virtual Event, volume 139 of Proceedings of Machine Learning Research, pages 8748–8763. PMLR, 2021a. URL http://proceedings.mlr.press/v139/radford21a.html.
- Radford et al. [2021b] A. Radford, J. W. Kim, C. Hallacy, A. Ramesh, G. Goh, S. Agarwal, G. Sastry, A. Askell, P. Mishkin, J. Clark, et al. Learning transferable visual models from natural language supervision. arXiv preprint arXiv:2103.00020, 2021b.
- Ramesh et al. [2022] A. Ramesh, P. Dhariwal, A. Nichol, C. Chu, and M. Chen. Hierarchical text-conditional image generation with clip latents. arXiv preprint arXiv:2204.06125, 2022.
- Reimers and Gurevych [2019] N. Reimers and I. Gurevych. Sentence-bert: Sentence embeddings using siamese bert-networks. In Proceedings of the 2019 Conference on Empirical Methods in Natural Language Processing. Association for Computational Linguistics, 11 2019. URL https://arxiv.org/abs/1908.10084.
- Salimans et al. [2016] T. Salimans, I. Goodfellow, W. Zaremba, V. Cheung, A. Radford, and X. Chen. Improved techniques for training gans. Advances in neural information processing systems, 29, 2016.
- Sellam et al. [2020] T. Sellam, D. Das, and A. P. Parikh. Bleurt: Learning robust metrics for text generation. arXiv preprint arXiv:2004.04696, 2020.
- Sharma et al. [2018] P. Sharma, N. Ding, S. Goodman, and R. Soricut. Conceptual captions: A cleaned, hypernymed, image alt-text dataset for automatic image captioning. In Proceedings of the 56th Annual Meeting of the Association for Computational Linguistics (Volume 1: Long Papers), pages 2556–2565, 2018.
- Shimanaka et al. [2018] H. Shimanaka, T. Kajiwara, and M. Komachi. Ruse: Regressor using sentence embeddings for automatic machine translation evaluation. In Proceedings of the Third Conference on Machine Translation: Shared Task Papers, pages 751–758, 2018.
- Theis et al. [2015] L. Theis, A. v. d. Oord, and M. Bethge. A note on the evaluation of generative models. arXiv preprint arXiv:1511.01844, 2015.
- Thoppilan et al. [2022] R. Thoppilan, D. De Freitas, J. Hall, N. Shazeer, A. Kulshreshtha, H.-T. Cheng, A. Jin, T. Bos, L. Baker, Y. Du, et al. Lamda: Language models for dialog applications. arXiv preprint arXiv:2201.08239, 2022.
- van den Oord and Dambre [2015] A. van den Oord and J. Dambre. Locally-connected transformations for deep gmms. In International Conference on Machine Learning (ICML): Deep learning Workshop, pages 1–8, 2015.
- Vedantam et al. [2015] R. Vedantam, C. Lawrence Zitnick, and D. Parikh. Cider: Consensus-based image description evaluation. In Proceedings of the IEEE conference on computer vision and pattern recognition, pages 4566–4575, 2015.
- Vijayakumar et al. [2016] A. K. Vijayakumar, M. Cogswell, R. R. Selvaraju, Q. Sun, S. Lee, D. Crandall, and D. Batra. Diverse beam search: Decoding diverse solutions from neural sequence models. arXiv preprint arXiv:1610.02424, 2016.
- Wilson [2019] D. J. Wilson. The harmonic mean p-value for combining dependent tests. Proceedings of the National Academy of Sciences, 116(4):1195–1200, 2019.
- Xu et al. [2016] J. Xu, T. Mei, T. Yao, and Y. Rui. Msr-vtt: A large video description dataset for bridging video and language. In Proceedings of the IEEE conference on computer vision and pattern recognition, pages 5288–5296, 2016.
- Yang et al. [2019] D. Yang, S. Hong, Y. Jang, T. Zhao, and H. Lee. Diversity-sensitive conditional generative adversarial networks. arXiv preprint arXiv:1901.09024, 2019.
- Yeh et al. [2021] Y.-T. Yeh, M. Eskenazi, and S. Mehri. A comprehensive assessment of dialog evaluation metrics. In The First Workshop on Evaluations and Assessments of Neural Conversation Systems, pages 15–33, 2021.
- Zhang* et al. [2020] T. Zhang*, V. Kishore*, F. Wu*, K. Q. Weinberger, and Y. Artzi. Bertscore: Evaluating text generation with bert. In International Conference on Learning Representations, 2020. URL https://openreview.net/forum?id=SkeHuCVFDr.
- Zhou et al. [2020] L. Zhou, H. Palangi, L. Zhang, H. Hu, J. Corso, and J. Gao. Unified vision-language pre-training for image captioning and vqa. In Proceedings of the AAAI Conference on Artificial Intelligence, volume 34, pages 13041–13049, 2020.
- Zhu et al. [2018] Y. Zhu, S. Lu, L. Zheng, J. Guo, W. Zhang, J. Wang, and Y. Yu. Texygen: A benchmarking platform for text generation models. In The 41st International ACM SIGIR Conference on Research & Development in Information Retrieval, pages 1097–1100, 2018.
Appendix A Additional Experimental Details
In this section, we discuss additional experimental details for interested readers.
A.1 Code
We make all code/data publicly available for use at https://s3.us-west-1.wasabisys.com/anon-neurips2022/neurips.tar.gz. We hope that releasing our code, along with the JSON files containing test-set predictions for the models in question will help inspire further research and examination into the evaluation of models for visual description.
A.2 Datasets
MSR-VTT Dataset:
The MSR-VTT dataset [44] is a dataset for video description consisting of 10,000 videos, with 20 reference ground truth descriptions for each video. It was collected by downloading 118 videos for each of 257 queries from a popular video sharing website. MSR-VTT contains 41.2 hours of video, with an average clip length lying between 10 to 30 seconds. It has a vocabulary size of 21,913. For more details about the diversity of the language present in the dataset, we refer readers to Chan et al. [9].
MS-COCO Dataset:
The MS-COCO dataset [21] is a large-scale dataset for image description, object detection and segmentation. MS-COCO contains 328K images, each with 5 ground truth descriptions generated by human AMT workers. For more details about the diversity of the language present in the dataset, we refer readers to Chan et al. [9]. MS-COCO is licensed under a Creative Commons Attribution 4.0 license.
A.3 Models
This paper explores the performance of our metrics over several models: two video captioning models, and two image captioning models.
TVT
The Two-View Transformer [10] is a baseline method for video description, which consists of a transformer encoder/decoder structure. While we did not have access to the original code, we trained our own version of the model on the MSR-VTT dataset (standard splits), leveraging features from Perez-Martin et al. [28]. The model was trained for 300 epochs, with a batch size of 64, model hidden dimension of 512, 4 transformer encoder and decoder layers with 8 heads each, and dropout of 0.5. For optimization, we leveraged the Adam optimizer with a learning rate of and weight decay of with exponential learning rate decay with gamma . This model achieves a score of 56.39 on the test dataset. The model was trained using a Titan RTX-8000 GPU over the course of several hours.
O2NA
O2NA [23] is a recent approach for non-auto-regressive generation of video captions. While the method had available code and checkpoints which we used for this experiment, the method is not designed to sample more than one candidate caption at any given time. To adjust the model to sample multiple candidate captions, we made several adjustments. First, the model was modified to sample a length according to a softmax distribution over the length likelihoods (instead of using a greedy choice of length, or beam search over lengths, as proposed in the paper). Second, the model was modified to sample tokens at each non-autoregressive step from a temperature-adjusted softmax distribution instead of greedily sampling tokens. We make our modified code available as a patch to the original repository, in the hopes that other users will continue to build on these alterations.
CLIPCap
CLIPCap [25] is a recent model for image description based on using the CLIP [30] model for large vision and language pre-training as a feature encoder, and GPT [7] as a natural language decoder. CLIPCap code and MS-COCO trained model checkpoints are publicly available from the authors, however we made some alterations to support temperature-based and nucleus sampling. We make our modified code available as a patch to the original repository, in the hopes that other users will continue to build on these alterations. CLIPCap is licensed under the MIT license.
VLP
VLP [48] is a unified vision and language pre-training model, designed to perform both image captioning and visual question answering. The model is pre-trained on the Conceptual Captions [36] dataset, and fine-tuned on the MS-COCO captions dataset for image description. The authors make code and pre-trained models publicly available, however we modified the code somewhat to support additional sampling methods. We make our modified code available as a patch to the original repository, in the hopes that other users will continue to build on these alterations. VLP is licensed under the Apache License 2.0.
A.4 Distance Metrics
In this paper, we explore three base semantic metrics as distance underlying our TRM methods, CIDEr-D [41], METEOR [1], and BERT Distance [47].
CIDEr-D
CIDEr-D [41] is a n-gram-based metric designed for visual description, and based on the idea that common words are less useful in practice than uncommon words. In practice, this takes the form of a cosine similarity between TF-IDF weighted vectors representing the sentences. Because CIDEr-D is a score, and not a distance, we create a distance function: , which works as CIDEr-D is bounded by 10. Note that because CIDEr-D is 10 if and only if and only if the two sentences are equal, this fulfills the TRM requirements.
METEOR
METEOR [1] is a score which evaluates the semantic distance between two text utterances based on one-to-one matches between tokens in the candidate and reference text. The score first computes an alignment between the reference and candidate, and computes a score based on the quality of the alignment. Because METEOR is a score, and not a distance function, we use the distance , where is the METEOR score of the reference. Because METEOR is bounded at 1 if and only if the two utterances are identical, this simple transformation satisfies the requirements of the TRM adjustment. While we could explore other ways of deriving a distance from METEOR, we found that this simple approach was sufficient to demonstrate the performance of our methods.
BERT Distance
A recent method for determining the semantic distance between two samples is to leverage a pre-trained BERT embedding model to create a semantic embedding of the text, and computing the cosine distance between the test samples. In our work, we leverage the MiniLM-L6-v2 model from the sentence-transformers package by Reimers and Gurevych [33] to embed our descriptions. Because cosine distance is already a distance function, no additional transformation is necessary.
A.5 P-value Computations
For our experiments, our null hypothesis is that the candidate samples and the ground truth samples are drawn from the same distribution. Because most of the methods do not have an analytical way to compute the p-values (in fact, the TRMs are the only method which has an analytic p-value computation given in Liu and Modarres [24]), we instead must compute the p-values though sampling. We thus enumerate the value of the statistic across all of the possible candidate/reference partitions given the joint set of candidates and references, and determine the probability of observing the sampled value, or some value more extreme.
The values in Table 1 represent the p-value obtained with a single candidate sentence, and 4 ground truth candidates for MS-COCO, or 19 ground truth candidates for MSR-VTT. We reserve one gorund truth description in both datasets to serve as the “Human" performance description. For TVT, CLIPCap and VLP, we sample the descriptions using beam search with 16 beams. For O2NA, which is a non-autoregressive model, we sample according to the method suggested in the original work (see Liu et al. [23]). Because there are several thousand videos per dataset, computing all possible combinations across the dataset would be far from tractable. Thus, the p-values were computed on a per-visual-input basis, and then aggregated across videos using the harmonic mean, as suggested by Wilson [43]. Such an aggregation method is valid when the experiments are not independent (which they are not), unlike Fischer’s method [14].
Figure 3 demonstrates the log p-values for the proposed methods across several candidate samples. For MS-COCO, we use all five reference captions, and between one and ten candidate captions sampled from CLIPCap using Nucleus Sampling [17] with a temperature of 1.0, top-p of and top-k of . The caption set is generated once, meaning that the two-candidate set consists of the one-candidate set and one more additional caption. For MSR-VTT, we use 10 reference captions, and between one and seven candidate captions sampled from O2NA as described in appendix A.3 with a temperature of 1.0 for both the length and token samples. We do not go to the full 10 candidate captions for MSR-VTT due to tractability concerns, since adding an additional caption forces twice the number of partitions to be evaluated when computing p-values.
The above experiments were performed on several n2d-standard-32 cloud GCP instances, containing 32vCPUs and 128GB of RAM.
A.6 Frechet BERT Distance
The Frechet Inception Distance, originally proposed in Salimans et al. [34], has often been used for the evaluation of the distance between samples of images generated by GANs. Images are first embedded in a latent space using a pre-trained inception network, and then the Frechet distance between the generated samples and the reference samples is computed. In our work, we replace the images with text, and the inception network with a pre-trained BERT embedding network [12]. For a set of candidate samples , a set of reference samples , and a BERT embedding function , we compute the Frechet BERT Distance as:
| (5) |
where and are the covariance matrices of the and sets embedded with respectively.
To get the BERT embedding, we leverage the CLS token of a large pre-trained model, in this case, the MiniLM-L6-v2 model from the sentence-transformers package by Reimers and Gurevych [33].
The computation of p-values for the Frechet-BERT distance is largely bottle-necked by the slow performance of the sqrtm function, which, because the matrices are not symmetric, has no efficient algorithm for computation. Additionally, unlike the feature computation, this operation must occur for every partition, leading to significantly reduced efficiency compared to the other measures presented in this paper.
A.7 MMD-BERT
Another common metric in the GAN literature is the computation of a maximum-mean discrepancy between kernel-estimates of the samples introduced by Li et al. [19]. For a set of candidate samples , a set of reference samples , and a BERT embedding function , we compute the MMD-BERT distance as:
| (6) | ||||
where is a kernel function. In our experiments, we use an RBF kernel function with equal to the median distance pairwise distance divided by two.
A.8 Search Techniques
In section 3, Figure 6, we explore the performance of several different search techniques for our two-view transformer model on the MSR-VTT dataset. In this figure, we explore four decoding search techniques: Greedy Search, Beam Search, Temperature-Based Sampling, and Nucleus Sampling. For each method, and for each video in the test set, we sample 10 descriptions. For Greedy Search, we sample 10 repeated sentences. For beam search we sample the top beam search candidate, and repeat this ten times. While we did explore using the top 10 results from a larger beam search, we found that a smaller beam search and repeated values produced better METEOR scores, so we chose to compare against this. Wider beam searches did produce higher scores, but because optimizing for METEOR would be the current paradigm, we decided to include that in the referenced figure. For standard temperature based sampling, we sampled 10 results at each temperature. For Nucleus sampling, we sample 10 results at each temperature, however we freeze they hyper-paramters of top-p at and top-k at , as we found these values to generate the best scores under the standard pairwise metrics. It remains relevant future work to perform a deep-dive into the different generative methods with respect to TRMs, as there are likely many interesting lessons that can be learned.
Appendix B Additional Results
In this section we present several additional interesting results to augment those in the main discussion.
B.1 Embedding Methods for KBMs
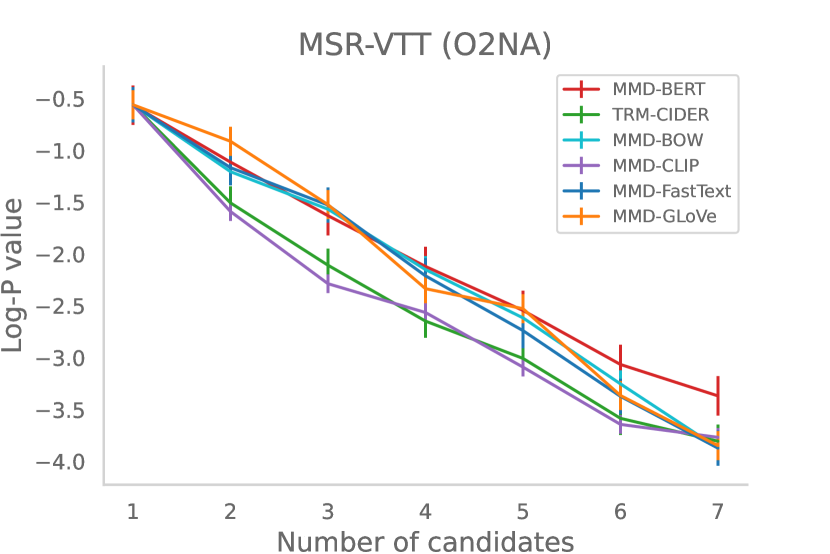
In the main work, we primarily explore a BERT-based embedding method for the kernel-based methods. Such an exploration does not preclude the use of other embedding methods, each of which has different trade-offs, when looking at the quality of the resulting metric, what the resulting metric measures, the time required to compute the embedding, and the performance when the reference distribution is limited to small numbers of human samples (such as happens in practice). Figure Figure B.1 shows a quick look at several possible choices for embedding methods in the MMD-* family, including Bag of words (with a 5K vocab), GLoVe [27], FastText [6], and CLIP [31].
While we can see that some of the methods are more sensitive to deviations in the image distributions, such methods come with additional trade-offs. CLIP-style embeddings are the most sensitive to human versus generated captions with fewer captions created, but are significantly slower to evaluate at test time (almost 4x slower) than MMD-BERT, and also produce a higher p-value when computing the leave-one scores on the human captions (which is less desirable, as the human captions are drawn from the same distribution).
Sensitivity and performance on Human-Generated Captions
Method
Log-P
Samples/Sec
TRM-CIDEr
-1.596
88.93
MMD-BERT
-1.786
56.68
MMD-CLIP
-1.887
14.41
MMD-GLoVe
-1.952
54.8
MMD-FastText
-1.954
57.45
MMD-BOW
-2.022
49.41
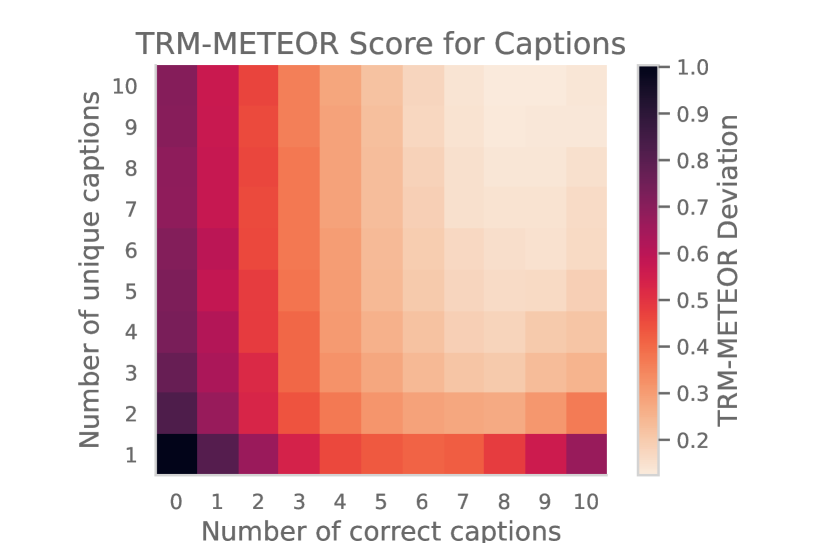
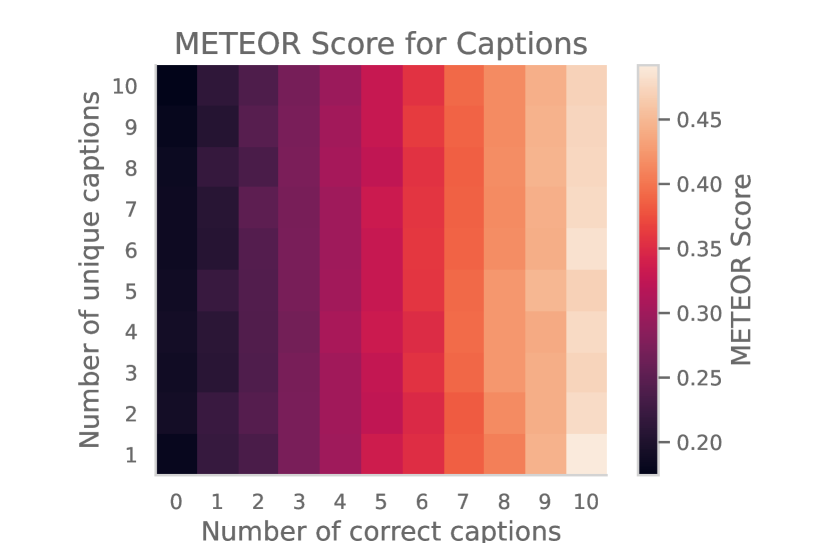
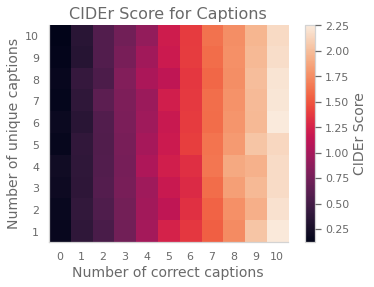
B.2 Unique vs. Correct Descriptions
In Figure B.2, we explicitly demonstrate how TRMs enable evaluation of both caption diversity and quality. We artificially generate candidates for the MSR-VTT dataset by mixing human-generated exact descriptions with human-generated descriptions from other videos. On one axis we have the number of unique descriptions and on the other axis we have the number of correct (exactly-matching) descriptions. Clearly, unlike METEOR alone, scores are affected by both correctness and diversity.
Each experiment consisted of 10 candidate captions from the MSR-VTT dataset, and 10 reference captions from the MSR-VTT dataset. We first split the 20 MSR-VTT reference captions into two sets of 10. One set of 10 captions formed the references. To select the candidate captions, we first sampled unique captions from the remaining reference set (which formed the “correct pool"), and unique captions from other videos in the dataset at random (forming the “incorrect pool"). We then selected correct captions, from the correct pool (at random) and captions from the incorrect pool (at random). This was then plotted with on the x-axis, and on the y-axis, as a heat-map, where lighter colors represent better scores (higher METEOR, or lower TRM-METEOR), and darker colors represent poor scores.
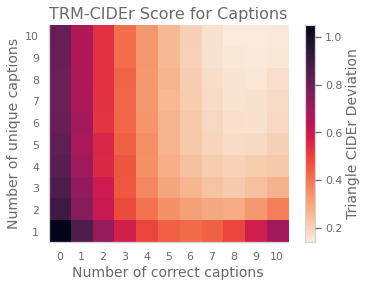
We also explored the performance of the CIDEr metric across the same axes, the results of which are shown in Figure B.3. We can see that they are largely similar to those from the METEOR metric, suggesting that regardless of the underlying metric, we are still making similar trade-offs between diversity and correctness.
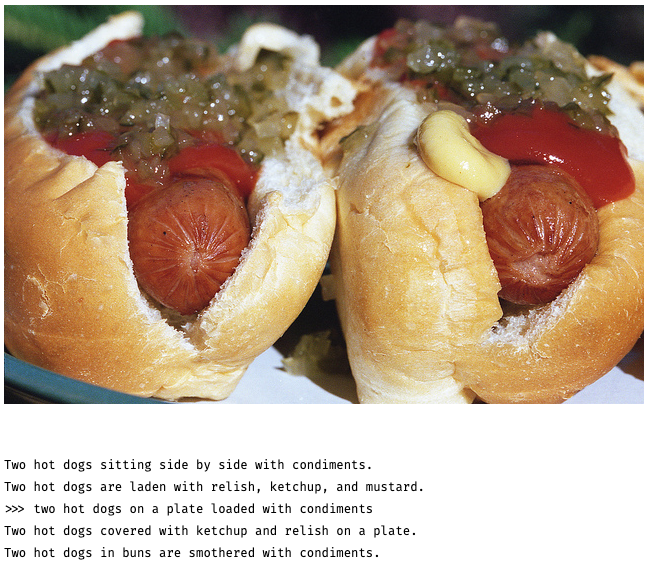
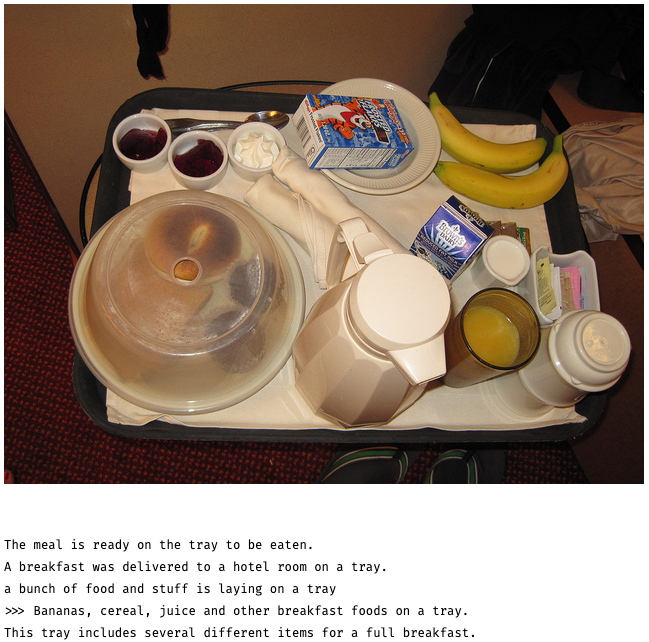
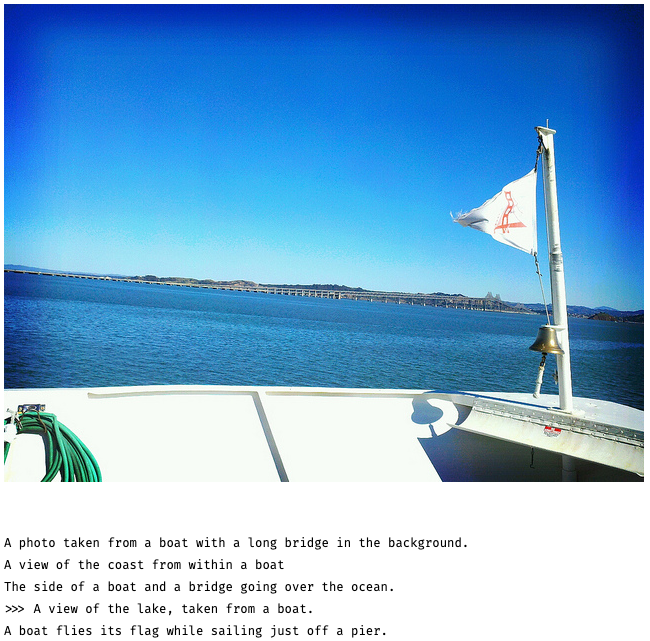
B.3 Visualizing Central Descriptions
We have found that descriptions which minimize the expected distance to the ground truth distribution are relatively sparse in detail compared to other descriptions. Figures B.4, B.5, B.6 and B.7 show qualitative examples of such descriptions for the MS-COCO dataset. Each plot shows qualitative examples of “central" captions. The caption marked with arrows is the ground truth caption which minimizes the expected METEOR distance to the other reference captions, and the other captions are the additional references in the MS-COCO dataset. Images are selected at random, and do not represent cherry-picked samples from MS-COCO.
B.4 Human p-values
Strong metrics for distributional comparison will have high sensitivity to samples coming from distinct distributions, and will produce high p-values for samples which come from the same distribution. To check that such a relationship holds, we also perform leave-one-out experiments using human-generated captions from the reference set for both MSR-VTT and MS-COCO. For MSR-VTT, we split the reference data into sets of 10 candidate samples and 10 reference samples, and compute the deviations using this partitioning. For MS-COCO, we leverage the c40 split which has 40 reference descriptions for 5000 samples of the ground truth. We partition the references for each video into groups of ten descriptions, and compute the p-values from pairs of these partitions. Table B.1 gives the performance of the metrics on this human data.
| METEOR | CIDEr | BERT | MMD-BERT | ||||
|---|---|---|---|---|---|---|---|
| MSCOCO | -0.6303 | -0.5941 | -0.5957 | -0.4742 | -0.6230 | -0.5633 | -0.6550 |
| MSR-VTT | -1.0046 | -0.9613 | -1.0224 | -0.9777 | -1.0172 | -1.040 | -1.0374 |
B.5 MAUVE performance
In the main work, we found that MAUVE was prohibitively slow to use to compute p-values for the training data. Because our p-values were computed with 10 reference sentences, and up to 10 candidate sentences, at the existing rate, it could take several years to compute the MAUVE p-values for the 50,000 sample MS-COCO dataset. In Table B.2, we present several high-variance estimates of the MAUVE p-values (computed using only 100 samples).
| Dataset | MAUVE Log p-value | METEOR Log p-value |
|---|---|---|
| MSR-VTT (O2NA) | -0.4414 | -1.7881 |
| MSR-VTT (Human Captions) | -0.1441 | -0.6037 |
| MS-COCO (CLIPCap) | -0.3980 | -2.5585 |
| MS-COCO (VLP) | -0.3234 | -2.8609 |
| MS-COCO (Human Captions) | -0.2189 | -0.7233 |
B.6 Additional Qualitative Samples