Hermeian haloes in cosmological volumes
Abstract
Recent studies based on numerical models of the Local Group predict the existence of field haloes and galaxies that have visited two distinct galaxies in the past, called Hermeian haloes. This work presents an analysis of the Hermeian haloes population in two high-resolution dark matter-only N-body simulations from the MultiDark suit (the ESMDPL, VSMDPL). Hermeian haloes make up from 0.5 to 2.5 per cent of the total number of field haloes depending on their mass. Furthermore, the results of our study suggest that at a sufficiently high resolution simulation, Hermeian haloes may be found around almost every halo, making them interesting for studies of matter exchange between galaxies. We find that about half (22 out of 49) of the selected Local Group analogues contain Hermeian haloes that passed through the haloes of both the Milky Way and M31 if the distance between the two main haloes is below 1 ; this fraction drops to one-fifth (24 out of 108) for distances of up to 1.5 . We confirm earlier findings that unlike other field haloes, Hermeians are grouped along the line connecting the primary hosts of Local Group-like systems, which should facilitate their identification in observations. The vast majority of the Hermeian haloes, whose second target is a Milky Way analogue, are currently moving away from it with increased velocity compared to remaining field halo populations. Interestingly, the obtained data admits that NGC 3109 could have passed through the Andromeda Galaxy and the Milky Way earlier.
keywords:
Local Group – galaxies:evolution – galaxies:interactions1 Introduction
The hierarchical paradigm of galaxy formation predicts that galaxies experience a lot of interactions with other galaxies on the cosmological timescale. The most common interactions are galaxy mergers, but recent studies based on cosmological simulations revealed a more complex picture. A variety of ‘pre-processed’ small haloes can be found around more massive ones. These include ‘backsplash’ haloes (sometimes also called ‘flyby’ haloes), which fell on a halo at early times and then have left it (Gill et al., 2005; Moore et al., 2004; Knebe et al., 2011a; An et al., 2019a). Studies have shown that around 10 per cent of field haloes in the Local Group (LG) can be backsplashers (Ludlow et al., 2009; Teyssier et al., 2012; Garrison-Kimmel et al., 2014; Bakels et al., 2021; Green et al., 2021). If such objects host galaxies, they will have properties that differ from field galaxies that have not experienced interactions with the MW or M31 in the past (Knebe et al., 2011a; Simpson et al., 2018; Buck et al., 2019). Simulations of the LG also revealed a class of ‘renegade’ haloes that pass through one of the LG main galaxies and are then accreted into the other (Knebe et al., 2011c; Wetzel et al., 2015). Renegade haloes differ from the rest of subhalo population by their anisotropic spatial distribution.
In a recent article Newton et al. (2022) explore and describe a new class of field haloes that passed through the haloes of both the Milky Way and the Andromeda Galaxy – the so-called Hermeian haloes (named after Hermes, the Greek god of travellers). The authors have analyzed three high resolution zoom-in constrained simulations (unlike typical simulations, constrained simulations stem from a set of constraints that can be either redshift surveys or radial peculiar velocities) of the LG from HESTIA (Libeskind et al., 2020) suite and found around one hundred such haloes in them. Hermeian haloes turned out to be interesting to investigate because of several features pointed in Newton et al. (2022). First, due to increase in the dark matter concentration, some Hermeian haloes can be used for indirect searches of dark matter particles. Second, they are clustered along the line connecting the MW and M31 and if they host galaxies, these will have chemical signatures of their past interactions. This gives a hope to distinguish Hermeian galaxies from regular field dwarfs in observations of the real LG. Also, like backsplash haloes, most of Hermeians are receding from their second targets, so they may be considered as a possible explanation for galaxies with ‘strange’ peculiar velocities, like NGC 3109 (Banik & Zhao, 2017; Banik et al., 2021). Hermeian galaxies in simulations analyzed by Newton et al. (2022) demonstrate exchange of gas and stars between the MW and M31. This indicates that such objects may facilitate the pollution of gas in galaxies with chemicals made in other galaxies. However, the first paper on Hermeian haloes (Newton et al., 2022) did not answer many questions due to a lack of statistics, because only three LG analogues were considered.
The primary aim of this paper is to further study this new class of field haloes, Hermeian haloes, and to answer questions regarding how common these haloes are in the Universe and across analogues of the Local Group. For this purpose, we first clarify and generalize the definition of these objects: in Newton et al. (2022) Hermeians were related to the Milky Way and M31, but we are going to analyze other kinds of galaxy pairs, even those that bare minimal resemblance to our LG. It is also interesting to find out how frequent Hermeians are in the Universe and in which systems they occur more often. Thus, we apply our definition of Hermeian halo to two high resolution full box cosmological simulations. We aim to verify or reproduce the conclusions of Newton et al. (2022) regarding Hermeian haloes concentrations and their anisotropic distribution in the LG with a richer sample of tens of LG analogues. We are not using constrained realizations of the Local Group, but a number of LG-like objects can be selected in our full random box dark matter-only simulations. Since selected LG analogues have some variety of their properties (e.g. MW–M31 distance), we can analyse which properties determine the presence and abundance of Hermeian haloes. Last but not least, we study the effect of numerical errors on the haloes sample and develop an algorithm for reliably detecting Hermeian haloes in simulations. One may ask why a dark matter-only simulation is sufficient for the goals of the current study. Although, there were only 4 Hermeian galaxies, which retain stars and gas, the previous work on Hermeians (Newton et al., 2022) has shown that Hermeian galaxies have the same trajectories as the dark Hermeian haloes (i.e. those without a baryonic component). Therefore, to study the spatial distribution of Hermeian galaxies and develop criteria for their identification in observations, one may use dark matter-only simulations, at least as a first approximation.
This paper is structured as follows: in Section 2 we describe the cosmological simulations analyzed in this work and the method we used to identify haloes passing through another halo. In this section we also introduce our definitions of studied halo classes. In Section 3 we summarize our main results and discuss their consequences. Finally, Section 4 draws the conclusion and identifies areas for further research.
2 Simulations and Methodology
In this section we briefly review the simulations used throughout this study, describe our algorithm for finding haloes that have passed through another halo, and define the analyzed halo classes.
2.1 Simulations and halo catalogues
We use two dark matter-only -body simulations: Very Small MultiDark Planck (VSMDPL) and Extremely Small MultiDark Planck (ESMDPL) carried out by an international consortium within the framework of the MultiDark project. Both simulations were performed with GADGET-2 code (Springel, 2005) and used Planck Cosmology (, , , , , ). The simulations were selected based on their combination of spatial resolution, volume, mass resolution and other parameters, summarized in Table 1. For ESMDPL we have 68 snapshots between z = 28 and zero with a time spacing varying from 0.009 to 0.7 Gyr and for VSMDPL we use 22 snapshots between z = 0.6 and zero with a time spacing varying from 0.2 to 0.4 Gyr. The ESMDPL simulation was set up using "constrained realization" of the initial conditions, which reproduces the real large scale environment of the LG. This simulation contains a Virgo cluster and an analog of the LG, but we are not using the fact that it is a constrained simulation in our analysis. However, as any constrained simulation it can be also used for statistics of objects in the given volume.
| Simulation | box | particles | |||||
|---|---|---|---|---|---|---|---|
| VSMDPL | 160 | 150 | 150 | 2 | 1 | ||
| ESMDPL | 64 | 70 | 150 | 1.0 | 0.5 |
The results reported here use halo data stored in catalogues created using the Consistent Trees (Behroozi et al., 2013b) and Robust Overdensity Calculation using K-Space Topologically Adaptive Refinement (ROCKSTAR; Behroozi et al. 2013a). ROCKSTAR catalogues strive to provide a smooth history of each halo, so the properties of the halo can be interpolated if it disappears (due to e.g. resolution) at some snapshot. Haloes are traced by ROCKSTAR with high accuracy: the fraction of haloes that do not have physically consistent progenitors is between 1 and 2 per cent (see Behroozi et al. 2013b, for more details).
Throughout this paper we use the virial radius defined by ROCKSTAR in terms of the virial spherical overdensity with respect to the mean background density (Behroozi et al., 2013b; Bryan & Norman, 1998). For our cosmological parameters, at the virial radius is defined as the radius of a sphere with overdensity of of the averaged matter density.
Due to the large number of VSMDPL snapshots, the structure that stores information about Hermeian haloes and their targets does not fit in memory of the computer we used. As a consequence of it, only snapshots that correspond to scale factor were analyzed for this simulation. For ESMDPL the full set of available snapshots was analysed. The VSMDPL simulation is used only to show convergence of the results.
2.2 Passage detection algorithm
The ROCKSTAR and Consistent Trees generate catalogues (hlist *.list), each of which contains all haloes from one snapshot, as well as their commonly used characteristics (see appendices of Rodríguez-Puebla et al. 2017, for an overview of the halo catalogues). The proposed catalogues store more than 80 halo characteristics. Characteristics that are used to search for haloes that have passed through other haloes are reviewed below.
ID: Halo ID that is guaranteed to be unique across all snapshots of the entire simulation.
Desc_id: Halo ID of descendant halo. A halo at one time step (a progenitor) is linked to a halo at the next time step (the descendant) if the majority of the particles in the progenitor end up in the descendant.
Pid: Parent halo ID. For field haloes (those that are not subhaloes) this is -1. Otherwise, it is the halo ID of the smallest host halo that contains this halo.
Desc_pid: Pid of descendant halo.
Using ID and Desc_id we track halo descendants throughout the simulation, and using pid and Desc_pid we register the passage of the halo through another halo. In each simulation snapshot, we select haloes whose and . These conditions mean that at the considered snapshot a halo is inside another halo and at the next one the halo (or more precisely, its descendant) is a field halo. Therefore, such objects passed through another halo. However, one would anticipate that there are haloes that enter and exit another halo during the time between successive time steps ( and ). Moreover, one might expect some subhaloes leave their hosts and enter another halo during this time ( and ). Despite these cases (as well as more sophisticated scenarios that our algorithm does not take into account) it seems that we lose a relatively small number of haloes passing through other haloes. Firstly, the simulation time steps ( Gyr for ESMDPL and Gyr for VSMDPL) are smaller than the crossing time of Milky Way-sized haloes (see An et al. 2019b, for details about the estimation). Secondly, we checked the algorithm by comparing fractions of haloes that have passed through another halo at least once in two simulations with different time step and by comparing our results with the previous work: no significant difference was observed in both cases (namely, we see the same trend, Fig. 1).
At the same time, we record the history of changes in the properties (coordinates and ) of descendants of previously selected haloes from the moment of passage through another halo to z = 0. We also track descendants of haloes that have been passed through (i.e. descendants of targets).
In this way we checked all haloes in the simulation at each time step and selected those haloes that performed exactly one or exactly two passages. From these two groups we selected for further consideration only those haloes whose virial mass did not increase by two or more times between any successive snapshots. This ensures that in most cases we look at the main trunk of the merger tree. This is an important check, because if we restrict ourselves only to the criterion for pid and desc_pid without checking the mass of the haloes, we will track the haloes with which backsplash or Hermeian candidates merge and not the backsplash and Hermeian haloes.
2.3 Definitions of halo classes
There is a degree of uncertainty around the terminology in the area of haloes passing through another halo: backsplash haloes are often called “flyby”. Moreover, the definitions of these haloes vary in the literature (Gill et al., 2005; Teyssier et al., 2012; Haggar et al., 2020; Mansfield & Kravtsov, 2020; Diemer, 2021).
In this paper, to be called backsplash, a halo must satisfy the following conditions:
-
1.
its main progenitor was within the virial radius of another more massive halo (the target) only once,
-
2.
a backsplash halo and the descendant of the target are different haloes at ,
-
3.
a backsplash halo is a field halo at
In this definition it is important to note that we consider haloes that experienced only one passage in item (i). Thus, Hermeian haloes are not backsplashers. Another choice is to consider haloes that had one or more passages, which is adopted in e.g. Diemer (2021).
To be called Hermeian, a halo must satisfy the following conditions:
-
1.
its main progenitor was within the virial radius of other haloes (the targets) exactly twice,
-
2.
the descendants of the targets are different at ,
-
3.
a Hermeian halo and the descendants of the targets are different haloes at ,
-
4.
a Hermeian halo is a field halo at (i.e. ).
The descendants of the targets of Hermeians and backsplashers may be subhaloes at z = 0. This definition of Hermeian haloes closely resembles the one in Newton et al. (2022). But it can be modified according to the purpose of a study. E.g. for the exploration of matter exchange one should not restrict the analysis to field haloes at . We have also mentioned in the Introduction that renegade haloes, which passed through one halo and become a subhalo in another one, could be quite common in the LG.
3 Results
3.1 Numerical effects
Halo finding algorithms are used to identify dark matter haloes in the distribution of simulation particles. It is well known that all halo finders miss or incorrectly identify haloes with a small number of particles. This critical number depends on the halo finder used (see for a discussion Knebe et al. 2011b). In the following we use the ROCKSTAR halo finder and start with a minimum halo size of 24 particles. In Section 3.1.1 we discuss the limitations due to mass resolution and determine the limit to which we can trust our analysis. Because of this, when investigating the Hermeian haloes, we consider only those objects which contain more than 24 particles at the moment of the first passage through another halo (i.e. the last shapshot where it is inside the virial radius of the first target). Although studies have shown that ROCKSTAR is able to identify subhaloes with 20 particles properly, in some cases it may lose tracks of haloes with less than 20-30 particles. For a detailed study of various halo finding algorithms abilities to track haloes and to recover their properties, please see Knebe et al. 2011b.
However, the ability of ROCKSTAR to track precisely backsplash or Hermeian haloes and determine their characteristics has not been explored before. Moreover, due to the specifics of Hermeian haloes (e.g. passages through another halo, which are accompanied by the destruction of external parts of the passing halo as a result of tidal interaction), this ability in relation to them may not be the same as in relation to equilibrium field haloes and subhaloes. For this reason, we carried out a special study that involves the comparison of results between two simulations with different mass resolutions and the comparison of the fraction of backsplash haloes with a previous study. We also note that the mass of a progenitor of a backsplash or Hermeian halo given by ROCKSTAR at the snapshot when it is first detected by our algorithm (i.e. the last snapshot before it leaves the virial radius of the first target) is, on average, higher than the mass at . For this reason we further discuss the impact of the number of particles at on the results, and not on earlier redshifts.
3.1.1 Simulations with different mass resolution
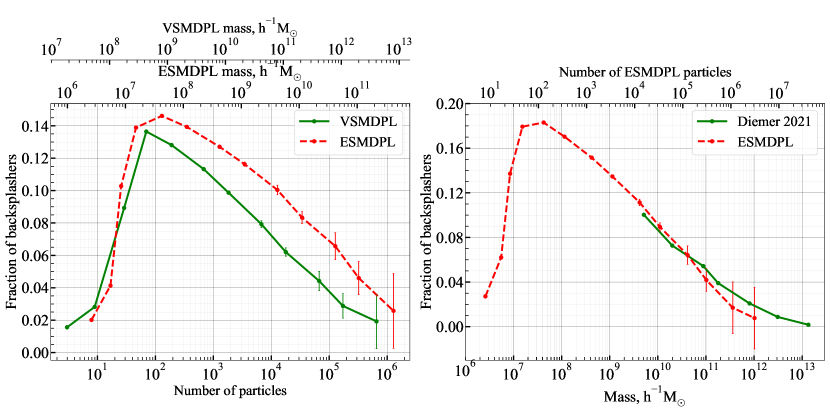
For the same halo mass, a halo from the ESMDPL simulation will contain more particles than a halo from the VSMDPL simulation (since ESMDPL has a higher mass resolution). Thus since numerical effects depend not on the mass, but on the number of particles within a halo, one might check the results of VSMDPL against those obtained from ESMDPL. In this case, at fixed halo mass, the fractions of backsplash haloes in the simulations should show the same trend and any significant discrepancies are caused by errors in the operation of the halo finding algorithm.
In the left panel of Fig. 1 we compare the fraction of backsplashers in our two simulations over about 6 Gyr (this is the interval for which we managed to analyse VSMDPL simulation). Consequently, it is unknown how many passages they performed before this period, thus here we used haloes that passed through another halo at least once, which differs from our definition given in the Section 2.3. It is seen from this Figure that each fraction has a maximum. We assume that the reason behind it is numerical errors in tracking low-mass haloes. Numerical effects should depend only on the number of particles, not mass. And it is exactly what one can see on Fig. 1, both curves have maximum corresponding to approximately 100 simulation particles, but to different masses.
Comparing fractions of backsplash haloes as a function of halo mass in the two simulations, it can be seen that they systematically differ by approximately 2 per cent (see, the left panel of Fig. 1). This difference may be caused by the fact that ESMDPL is a constrained simulation, with constrains affecting the large scale distribution of matter. As we show in Section 3.2.6, the fraction of backsplash and Harmeian haloes depend on the density of environment, so differences in the large scale structure may impact the fraction of backsplashers. Also simulations have different snapshot frequency. We conclude that one can trust the results for Hermeian haloes (from the ESMDPL simulation) that now consist of more than 100 simulation particles. The use of less massive haloes does not change results qualitatively, but they should be used with caution.
3.1.2 Comparison with previous study results
As was pointed out in the Section 2.3, definitions of backsplash halo used by different authors vary, therefore, one may experience difficulties with interpreting different findings. Thus, we compared the fractions of backsplash haloes that were found in the ESMDPL simulation with the results of a previous study (Diemer, 2021), in which backsplash haloes were determined in a way similar to the one used in this paper, but using different simulations. In order to be consistent with Diemer (2021) here we used haloes that passed through another halo at least once, which differs from our definition given in the Section 2.3. As can be seen from right panel in Fig. 1, over the mass interval where the number of backsplash haloes is sufficient for statistical errors to be small, the dependence of the fraction of backsplash haloes on mass deviates from Diemer 2021 by no more than 2 per cent. This discrepancy may be due to the chosen normalization: we have converted Diemer bound-only mass to mass used in our paper assuming NFW profile with concentration equal 10. The observed sharp decline in the fraction of the backsplash haloes at low masses (below cannot be explained by any physical effect, because there are no characteristic mass scales in the hierarchical model of structure formation (over the mass range covered, the number of dark matter haloes is a power-law function of mass), except for the mass of haloes that are forming at the considered moment (now it is approximately ). We assert that this drop is due to numerical resolution. Therefore, the mass dependence of the backsplash halo fraction should be smooth. To summarise, the right panel of Fig. 1 not only demonstrates that our findings and the results of Diemer (2021) follow the same trend, but also illustrates that ROCKSTAR tends to lose tracks of low-mass backsplash haloes: many backsplash haloes with mass (i.e. with less than particles within the virial radius) are not identified correctly.
3.2 Hermeian halo population
This section reports results on the general properties of the Hermeian population that was found in the ESMDPL simulation, their targets, and large-scale environment in which Hermeians occur. Note that all comparisons are done at z = 0 only.
3.2.1 Hermeian halo fraction and mass function
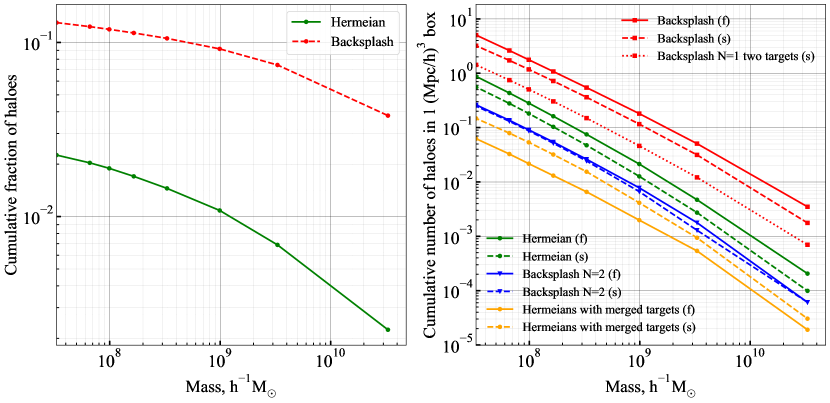
We compute the fraction of backsplash and Hermeian haloes by dividing cumulative numbers (at mass greater than ) of backsplash or Hermeian haloes by the cumulative number of all field haloes (including backsplash and Hermeian). The fractions are shown on the left panel of Figure 2. It can be seen that Hermeian haloes share above given halo mass slowly decreases with mass from almost 2.5 per cent for haloes more massive than to 0.4 per cent at . The fraction of Hermeians within the studied mass range is approximately 6 to 17 times less than that of backsplash haloes.
Besides backsplash and Hermeian haloes there are many other ‘pre-processed’ haloes that have experienced ‘complex’ interactions. We compare their abundances in the Universe on the right panel of Figure 2. The most abundant in this ‘zoo’ are backsplash haloes, which are followed by haloes that passed through a target and then became a subhalo, maybe in the same target. We denote them as “backsplash (s)” on the Figure, where “(s)” means a subhalo (and “(f)” means a field halo). If a backsplasher becomes a subhalo of a halo, which differs from the descendants of the target, we denote this as “backsplash N=1 two targets (s)”, but this can also be called a renegade halo, since it resembles a population found in Knebe et al. (2011c). We also present in this Figure mass functions for backsplashers which interacted with the same halo twice. They turned out to be less abundant than Hermeian haloes. Finally, there is a small population of haloes which passed through two distinct targets, but the targets have merged by .
3.2.2 Fraction of targets and target masses
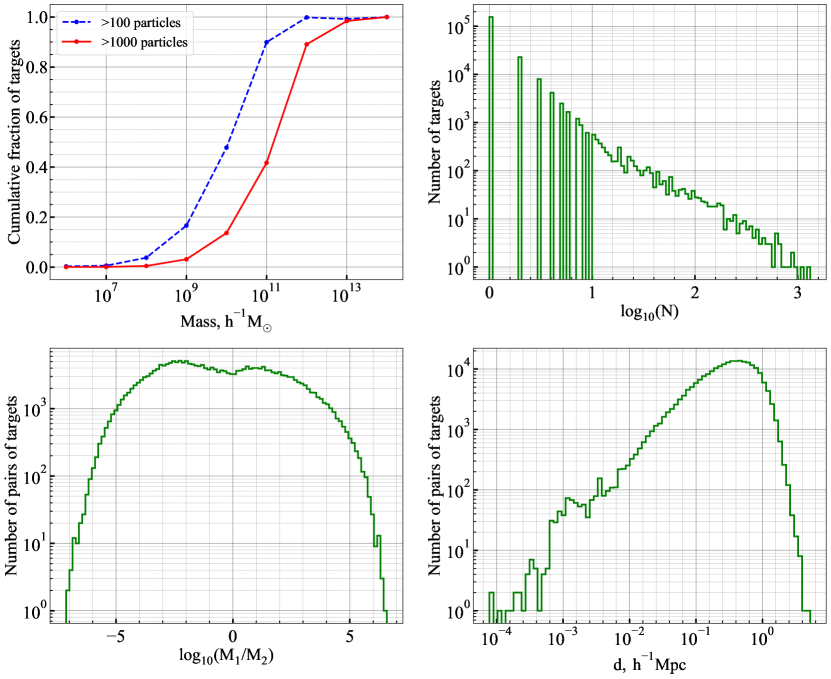
In order to examine if Hermeian haloes can participate in the exchange of matter in the Universe between two LG like haloes, we check what is the fraction of targets of Hermeians among all haloes, namely what fraction of haloes have participated in a Hermeian encounter, as a function of mass. The upper-left panel of Figure 3 shows that starting above roughly more that half haloes have participated as targets for Hermeian haloes. Noteworthy, more than 95 per cent of all haloes with the mass of at least have been targets at least once (i.e. a halo passed through them at least once). This suggests that LG-like objects have experienced Hermeian encounters with high probability. We considered two minimum Hermeian halo masses and found that increasing this by a factor of 10, the cumulative fraction of haloes that engender Hermeians does not change. These results suggest that at a sufficiently high resolution simulation the haloes of any mass will be targets. In other words, the Hermeian haloes may be present around any halo.
The lower-left panel of Figure 3 presents the distribution of the mass ratio of the pairs of haloes needed to make Hermeians. refers to the first and second halo the Hermeian encountered (the masses are given at z = 0). The histogram111We varied bin sizes and did not see a qualitative difference, special research on the bin size was not conducted. is asymmetric: on average, the first target tends to be slightly less massive than the second one.The distribution of targets mass ratio appears to be wide and flat, e.g. pairs with mass ratio below 2 occupy a small fraction of this distribution.
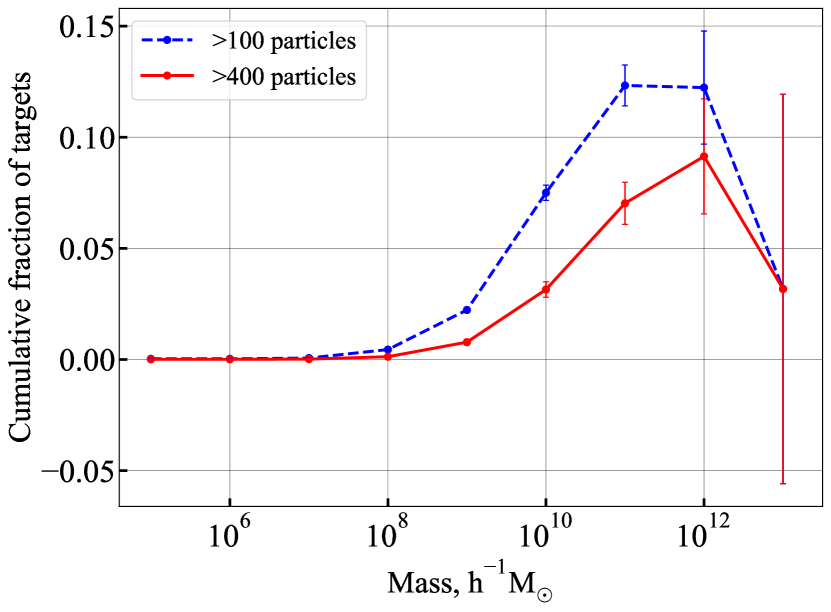
We now can restrict the mass ratio of the targets to see how well connected by Hermeians are haloes with similar masses. Figure 4 shows the cumulative fraction of targets dependent on halo mass and considers only targets from pairs with a mass ratio less than 2. In contrast with the upper-left panel of Figure 3, just approximately 12 per cent of all haloes more massive than have been targets at least once.
3.2.3 Distance between targets
The distribution of distances between targets is shown in the lower-right panel of Fig. 3. For most Hermeian haloes (60 per cent) the targets are not more than 0.4 away from each other. 94 per cent of targets are at a distance not greater than 1 from each other at redshift zero. In the article by Newton et al. (2022) approximately 90 per cent of the Hermeian haloes have been found in the implementation, where the MW and M31 analogues were closer to each other (the distance between them was nearly 0.7 Mpc). Such results are consistent with the distribution obtained in the present work.
3.2.4 Number of passages
In the upper-right panel of Fig. 3 we show the number of times a target has encountered by a Hermeian halo. Namely targets – the vast majority (77 per cent), have engendered a single Hermeian halo. In the other extreme case the maximum number of Hermeians that passed through a single halo is well over 1000. Newton et al. (2022) found that at one of the LG realizations 121 Hermeian haloes have passed through both main LG members. In our results, passages of more than 100 haloes through targets with mass about M⊙ are observed, but passages of thousands of Hermeian haloes are associated with the most massive haloes in the simulation with mass above M⊙.
3.2.5 Concentration
The inner structure of dark matter haloes is a question of great interest because it plays an important role in searches of dark matter annihilation products. For the analysis of haloes concentration, we adopted an NFW density profile (Navarro et al., 1996). It is important to mention that not all haloes are perfectly described by the NFW profile, in some cases the Einasto profile provides a more accurate approximation (Einasto, 1965; Navarro et al., 2004; Gao et al., 2008; Navarro et al., 2010; Dutton & Macciò, 2014). However, for low-mass haloes, these approximations are very similar over a wide range of distances from the center (Klypin et al., 2016). To analyze concentrations, it is more convenient to use the NFW profile, since for a given halo mass, the concentration parameter uniquely determines the distribution of the dark matter inside a halo, while the Einasto approximation contains extra parameter that affects the halo density profile and, consequently, their concentration. In addition, the use of a more accurate profile does not lead to better results: in practice, the Einasto approximation causes significant fluctuations in resulting concentration (Prada et al., 2012).
There are several ways to determine the concentration of a dark matter halo. One of the standard methods is fitting an analytical profile, followed by the determination of the concentration parameter as the ratio of the virial radius to the characteristic “scale” radius of the profile. However, this method can be quite complicated (Prada et al., 2012). The comparison of halo concentrations estimated by direct fitting the NFW approximation to halo density profiles with concentrations obtained using a profile-independent method, gives similar results for all haloes, except the most massive ones (Prada et al., 2012; Dutton & Macciò, 2014). The profile-independent method here means finding the concentrations through the ratio of the virial velocity to the maximum of the circular velocity. This approach does not require the fitting procedure of halo density profile by a certain analytical one, and in the general case, the assumption of the profile type is also not needed (Klypin et al., 2011; Prada et al., 2012; Pilipenko et al., 2017). Thus, we use concentrations defined through the ratio of maximal and virial circular velocities, found by ROCKSTAR.
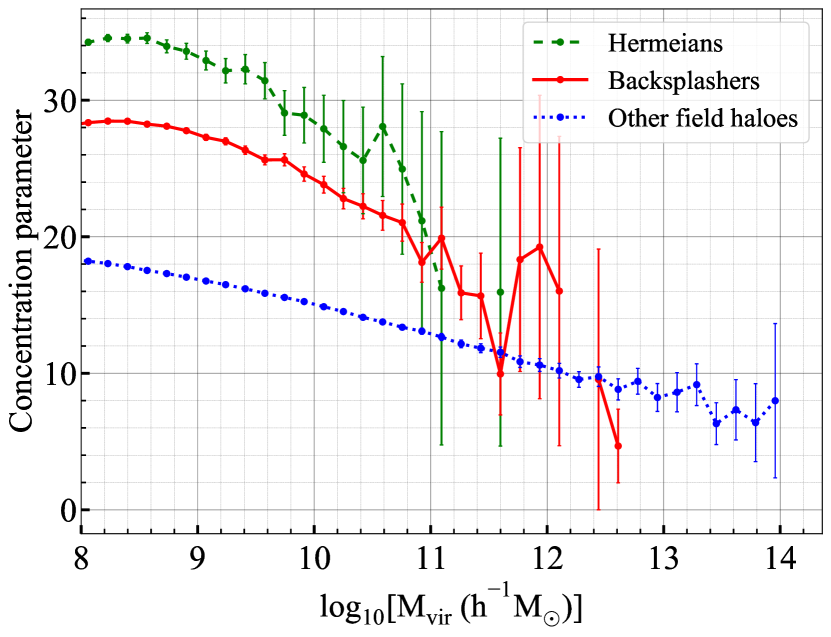
The concentration characterizes the density at the halo center, and the dark matter annihilation signal increase in approximate proportion to the cube of the concentration (Newton et al., 2022). Our analysis showed that over the mass interval, where there are enough haloes and the statistical errors are small, concentrations of Hermeians are almost 2 times higher than the concentrations of field haloes, and backsplash concentrations are one and a half times higher with respect to remaining field haloes (see Fig. 5), in agreement with previous work on the backsplash and Hermeian populations in the Local Group (Newton et al., 2022).
3.2.6 Large-scale environment
The large-scale environment has been shown to affect galaxy interactions such as mergers and flybys (L’Huillier et al., 2015; An et al., 2019a). Therefore, there is evidence to suggest that multiple interaction rate also depends on large-scale density at the considered location. In order to study how halo environment density affects the number of found Hermeians and backsplashers, we have compared dependence of the large-scale overdensity on halo mass for Hermeian, backsplash, and remaining field halo populations at z = 0. Various methods are frequently employed to define environment (Muldrew et al., 2011). In this paper, we define the large-scale overdensity using a grid-based Cloud-In-Cell (CIC) smoothing with a voxel size of 64 = 0.5 . However, a previous study demonstrated that a density field with a characteristic resolution of 8 times the halo virial radius provides a reliable picture of the environment (Lee et al., 2016). Therefore, with our basic resolution, 0.5 , this condition is satisfied for all haloes with a mass , which is enough for most Hermeians and backsplashers. Nevertheless, to consider MW-sized haloes, we need to smooth the box on scale of approximately 1.6 . For this reason, according to the procedure used by Lee et al. 2016, we employ a Gaussian smoothing approach, i.e. convolve the CIC density cube with a 3D Gaussian kernel. The kernel has the same number of voxels as CIC cube and its half-width at half-maximum (HWHM) equals 1.6 .
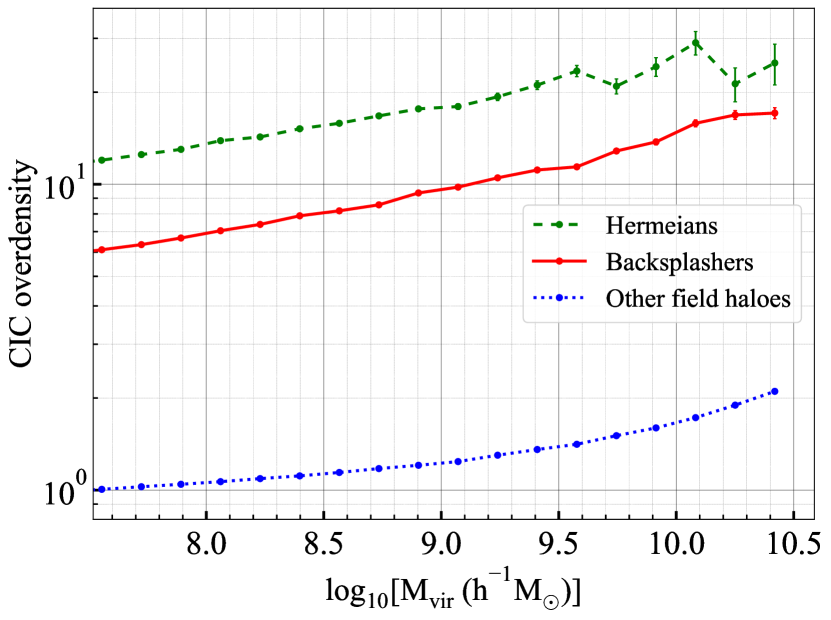
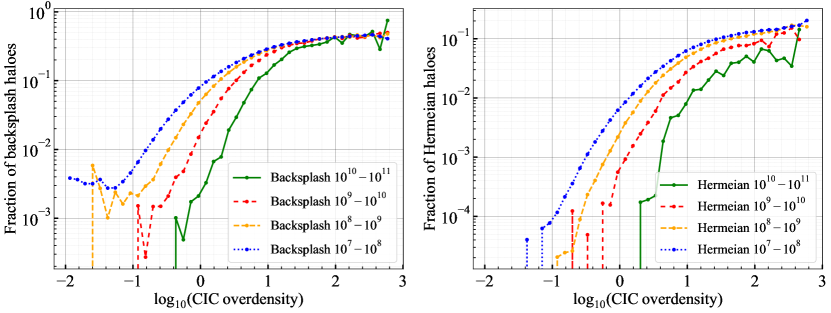
Figure 6 clearly shows that the environmental overdensity around Hermeian and backsplash haloes is significantly higher than around other field haloes. In order to check, whether more Hermeians and backsplashers tend to appear in overdense regions than in underdense ones, we study their fractions as functions of CIC overdensity. From Fig. 7, it can be seen that regardless of the considered mass interval, the fractions of both Hermeian and backsplash haloes first increase with the environment overdensity and then reach a constant value. The majority of haloes passing through other haloes are found in overdense regions, despite the fact that these kinds of halo interactions occur in a wide range of density environments.
The next section of this paper focuses on Hermeian haloes of the Local Group.
3.3 Hermeian haloes of the Local Group
As was mentioned in the introduction to this paper, for a number of reasons it may be interesting to search for Hermeian haloes in the Local Group. Therefore, in order to identify them in observations, one needs to understand how to distinguish these objects from remaining field haloes exactly within the Local Group. Moreover, it is exciting to continue the study originated by Newton et al. 2022 by making the analyzed analogues of the Local Group more numerous. Another reason for examining the Local Group is the presence of a galaxy in our cosmic neighbourhood, that has already been considered as a backsplash or Hermeian candidate (Banik et al., 2021; Newton et al., 2022) namely, NGC 3109. To reveal the observational features of the Hermeian haloes in the Local Group, we selected its analogues in the ESMDPL simulation and study the Hermeian halo population which occurs. The following sections review our main findings in this area. Note that all comparisons are done using z = 0 data only.
3.3.1 Local Group analogues
Since it as a constrained simulation, by construction, there exits a Local Group replica in the ESMDPL simulation, i.e. a pair of haloes with correct LG characteristics embedded within the appropriate large-scale environment. However, we are able to select other halo pairs with similar “internal” properties (mass, mass ratio, distance, relative velocity, etc), but not embedded in the same large-scale environment (i.e. no Virgo cluster at appropriate distance). Significant variance in the selection criteria adopted by different authors for finding LG analogues can affect the obtained results (Forero-Romero et al., 2013; Fattahi et al., 2016; Carlesi et al., 2020). Therefore, it is necessary to limit the parameters of systems similar to the LG carefully. However, the more restrictive the selection criterion, the smaller the number of LG analogues found in the simulation. We believe that at the initial stage of studying a new class of objects, it is more important to choose a simple selection criterion and to obtain a large sample than to take into account subtleties of determining observed parameters of the LG. To identify LG analogues (the LG look-alike in Sorce et al. 2022), the following criteria for choosing pairs of haloes were used (Sorce et al., 2022):
-
•
their masses are between and ,
-
•
their separation is smaller than ,
-
•
their mass ratio is smaller than 2,
-
•
there is no other halo more massive than within a sphere of radius 1.5 (the sphere is centered in a more massive halo in the pair).
Within each pair, we consider the less massive halo as the Milky Way analogue, and the more massive halo, as the Andromeda Galaxy analogue.
In the section that follows we present the summary statistics for selected LG-like systems in the ESMDPL simulation.
3.3.2 Statistics
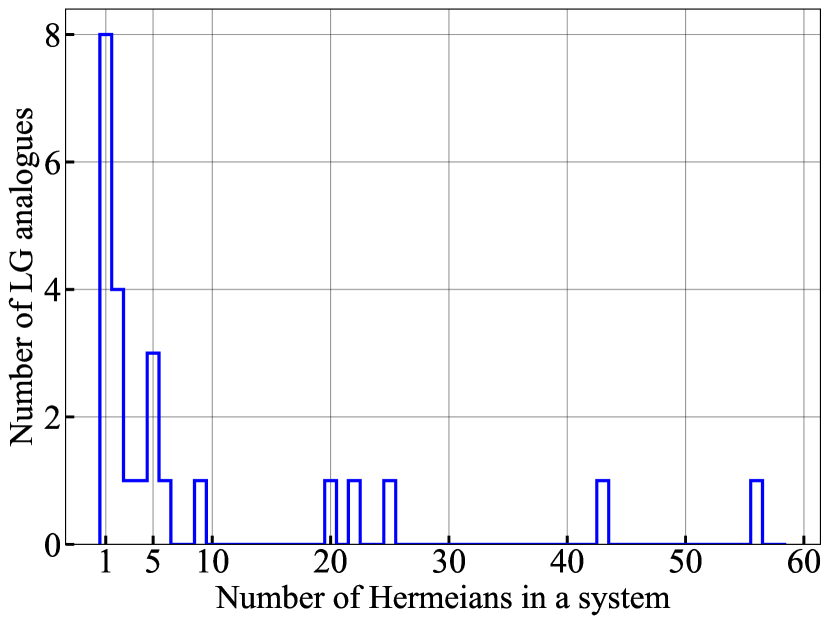
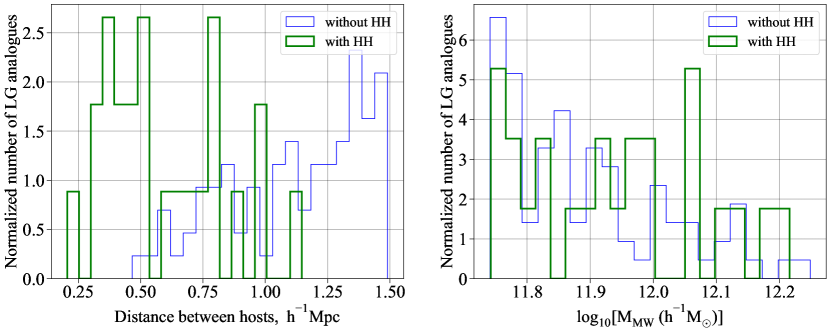
We found 108 Local Group-like pairs. Approximately 22 per cent of them contains Hermeian haloes. Altogether, 219 Hermeians were found in the Local Group-like systems. The systems contain from 1 to 56 Hermeian haloes, with an average of approximately 9 (see Fig. 8). There are two LG-like systems, both of which contain from 40 to 50 Hermeian haloes. This finding is in keeping with the results of Newton et al. 2022 where 121 Hermeian haloes were found in one LG analogue. Thus, a separate study of such systems is required in order to find out the reasons for the appearance of quite large number of haloes in them. In fact, the ESMDPL is a constrained simulation, i.e. it reproduces observed structures, in particular, the known nearby objects: the MW and M31 (i.e. the LG replica in Sorce et al. 2022). These haloes are among the targets of Hermeian haloes, approximately 200 Hermeian haloes passed through one of them. However, there are no Hermeians that passed through both the MW and M31 in this LG replica.
According to the assumptions of Newton et al. (2022), the presence of Hermeian haloes may be influenced by the masses of the Local Group hosts and their location relative to each other. We find that primary pairs of LG analogues with Hermeian haloes tend to be closer together than those of LG-like systems without Hermeians (see Fig. 9). This suggestion is consistent with the findings of Newton et al. 2022, where one HESTIA simulation yields more than 90 per cent of all the Hermeian haloes found. That Local Group has the most massive primary hosts that are likewise 20 per cent closer to each other at z = 0 than in the other simulations. But from the right panel of our Fig. 9 one can see that the mass of the MW does not play a crucial role in the presence of Hermeians.
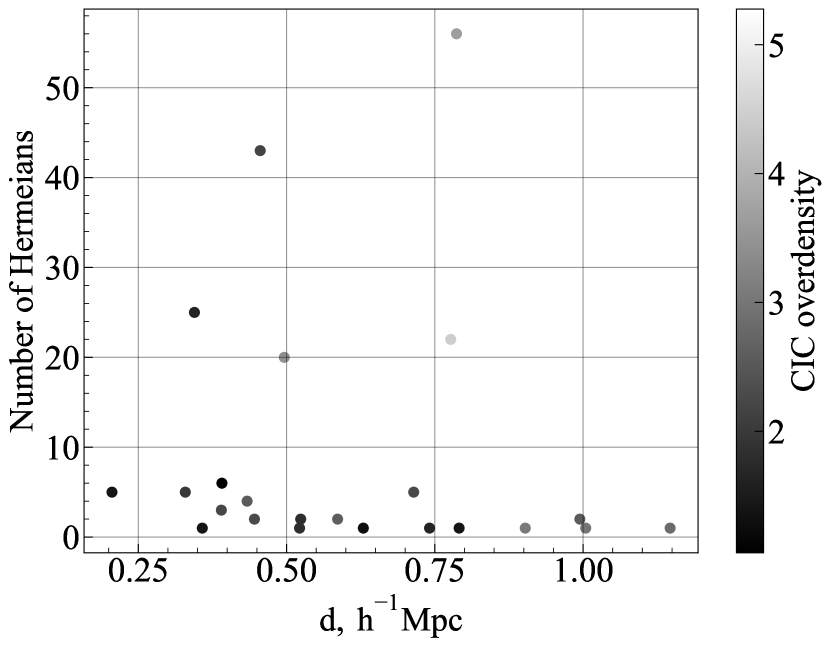
To better understand what determines the quantity of Hermeian haloes in LG-like pairs, we use Figure 10 to show the dependence of the number of Hermeians on distance between their targets and large-scale density. One can see that there is no clear trend with the overdensity of environment, however, it is possible that these results were influenced by the small sample size.
3.3.3 Spatial distribution
Like in Newton et al. (2022), in order to characterize the spatial distribution of haloes in a system, we used the angle between the direction to a considered halo and the direction to the M31 from the midpoint of the line connecting MW and M31 analogues, and we also calculated distance from a Hermeian halo to the midpoint.
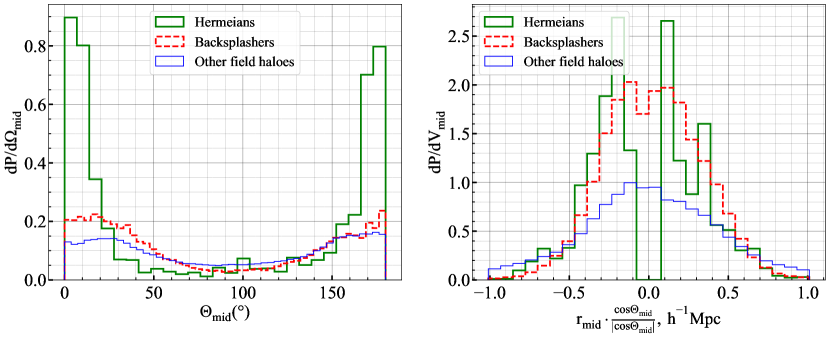
The left panel of Figure 11 shows that in contrast to other field haloes, Hermeians are grouped along the line connecting the MW and M31. The backsplash haloes have a comparable angular distribution to the field haloes that have not interacted with the primary hosts of the LG analogues, however, they are more concentrated towards the MW and M31 than other field haloes, excluding Hermeians. It is interesting to note that, similar to Newton et al. 2022, we have found that a larger fraction of backsplashers are located around the line connecting the MW and M31 analogues in the direction of the M31. It can also be seen from the right panel of Fig. 11 that they tend to be slightly less concentrated to LG midpoint than Hermeians, but significantly stronger than remaining field haloes. These findings should facilitate identification of Hermeian haloes in observations.
3.3.4 Velocity distribution
Understanding the differences in the velocity distribution of Hermeian and other field haloes might help to determine whether an observed halo belongs to Hermeian population. This part of the study is also motivated by the presence of a ‘plane of high-velocity galaxies’ of the LG (Banik & Zhao, 2017) : there are several galaxies, including the dwarf galaxy NGC 3109, that have much higher radial velocities than predicted by the standard cosmological model. Since the key feature of NGC 3109 is the unexpected high radial velocity with which it is receding from the MW (Banik et al., 2021), here, we examine only those Hermeian haloes whose second target is a MW analogue. It was chosen as the second target, because the observed high-velocity galaxy NGC 3109 is located in the direction towards the MW, not the M31. We select non-Hermeian field haloes for the analysis within a 1.5 spheres centered on MW analogues, since it is the maximum distance between Hermeian haloes and their second targets in the considered LG-like systems. A previous study has already considered NGC 3109 as a backsplasher candidate, so we adopt the same properties of this galaxy as in the work of Banik et al. 2021. The observed Galactocentric distance and radial velocity of NGC 3109 are 1.3 Mpc and 170 , respectively (Soszyński et al., 2006; Dalcanton et al., 2009; Banik et al., 2021). Nevertheless, like Banik et al. 2021, we require that NGC 3109 analogues be 1.2 Mpc away from their second targets. We compare velocity of NGC 3109 and simulated Hermeian haloes with the circular velocity of MW halo, to get rid of dimensional velocity. In order to calculate the circular velocity of MW in observations, we take the MW mass in the range (Boylan-Kolchin et al., 2013). For the simulated Hermeian haloes we take the mass of the corresponding simulated MW.
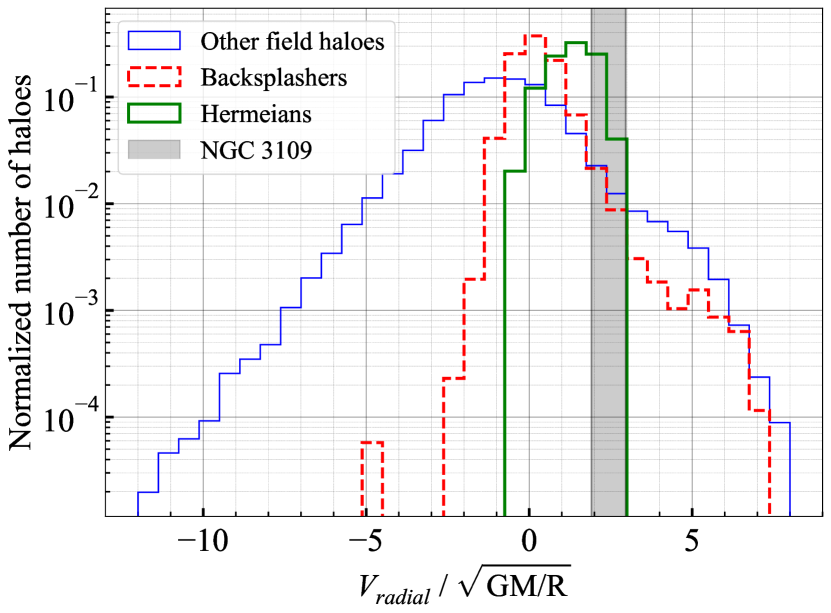
The vast majority of Hermeian haloes that passed through the M31 first and then through the MW are now moving away from their second targets, while 70 per cent of other field haloes are approaching them. The median recessional velocity of Hermeians are much higher than those of other field haloes (see Fig. 12) and backsplash haloes have somewhat smaller velocity than Hermeian ones. According to our preliminary estimates, the increase in the velocity of Hermeian haloes can be explained by a gravity assist. Moreover, backtracking of the orbits of high-velocity NGC 3109 association galaxies demonstrated that NGC 3109 could have perform two gravitational assists (Shaya & Tully, 2013). Surprisingly, our estimate showed that, on average, passing through two targets does not lead to a significant change in the halo speed. However, this result does not contradict the possibility that Hermeian haloes gain their high velocities through gravitational assists (because their speeds are not higher than the estimated maximum), but quite probably means that the increase in velocity due to the gravity assists is compensated by dynamical friction losses during the passage through another halo.
On the other hand, it can be seen in Fig. 12 that the velocity distribution of other field haloes is quite wide. Therefore, an alternative hypothesis is that Hermeians are the “tail” of this distribution. In other words, those haloes that initially have high velocities become Hermeians. The obtained velocity distribution admits that NGC 3109 can be Hermeian, consistent with the suggestion by Shaya & Tully (2013) that this galaxy could have perform two gravity assists.
3.3.5 Distance to the second targets
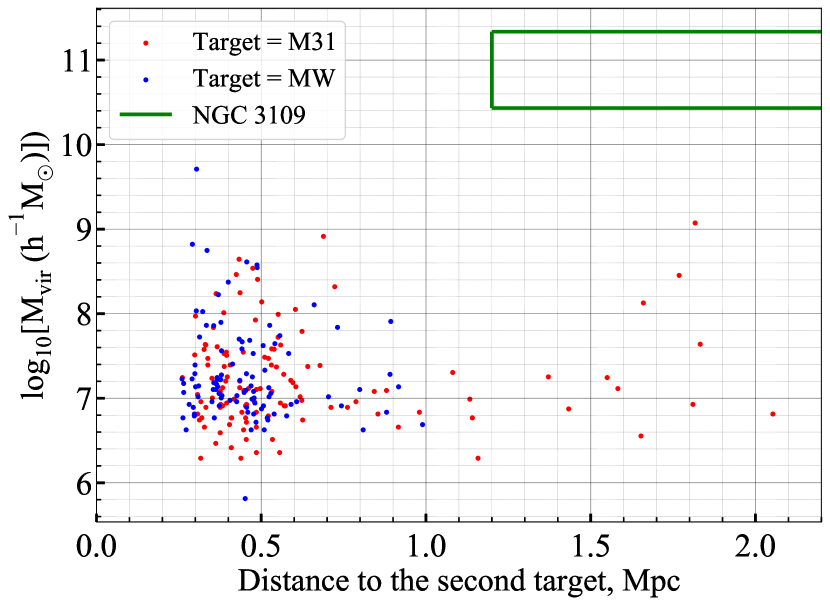
The obtained mass-distance distribution (Fig. 13) shows that all Hermeian haloes, whose second targets were MW analogues, are less massive and located at smaller distances from the second target than NGC 3109 . At the same time, 11 Hermeian haloes, that first passed through the MW and then through the M31, are approximately 1.3 to 2.1 Mpc away from their second targets. Therefore, it is sometimes possible to get Hermeians with the distance of the NGC 3109. This is a reassuring finding, since the masses of LG-like systems hosts (MW and M31) could be close to each other, which means that such a different results for them may be due to insufficient sample size. However, masses of these most distant Hermeian haloes do not exceed , which is much less than the lower boundary of the interval in which the estimated mass of NGC 3109 lie (like Banik et al. 2021, we take the mass of NGC 3109 in the range ). Thus, the question of classifying this galaxy as a Hermeian one requires further study.
4 Conclusions
In this work, to study the Hermeian haloes and the haloes they have been inside, we have used the ESMDPL simulation (we obtained the main results from it). In addition, to test the numerical effects and convergence of our algorithm, we also used the VSMDPL simulation that has a lower mass resolution but more frequent snapshots. Our research has mainly been focused on the size of Hermeian halo population and their characteristics, as well as mass and spatial distribution of their targets. Specifically, LG-like systems containing Hermeians were examined. In order to analyze the objects under study and describe their properties at z = 0, the passage detection algorithm was developed. It identifies Hermeian haloes together with their targets and selects the characteristics of these haloes from the simulation catalogues prepared by ROCKSTAR halo finder. We also carried out the study on how numerical errors affect the ability of ROCKSTAR to correctly track a halo during passages through another halo. The main results of this work can be summarized as follows.
The comparison of backsplash halo fractions identified in the two simulations allows us to conclude that ROCKSTAR does not lose tracks of haloes whose virial mass at z = 0 exceeds the mass of about 100 simulation particles during passages through another halo. Our results on the fraction of haloes that passed through another halo at least once are consistent with those of previous work. Depending on the mass range, backsplashers make up from approximately 4 to 13 per cent of all field haloes at z = 0 (up to 40 per cent in overdense regions). Compared to the size of the backsplash halo population, the Hermeian one is on average 8.5 times smaller. However, findings of this research suggest that the Hermeian haloes can be ubiquitous, with more than 95 per cent of haloes being targets for some Hermeians. It was shown that the targets of the majority (> 60 per cent) of Hermeian haloes are no more than apart at z = 0, and their mass ratio has an equal chance of falling within a quite wide range of values, but the first target is somewhat more often less massive than the second one. The study demonstrates that only one Hermeian halo passed through most of the targets, nevertheless, we find targets that have been passed through several thousand times. Approximately one in five of the selected analogues of the Local Group contains Hermeian haloes, when we considered MW–M31 pairs with distances up to . But when the distance is limited to , this fraction growths to 45 per cent. On average, about 9 Hermeians appear in the LG-like system, therefore, multiple passages with hundreds of Hermeian haloes should be considered as rare events. Hermeian haloes in LG-like pairs, as well as the entire population, are approximately twice as concentrated as remaining field halo population. The fraction of Hermeian haloes in dense local environment is higher.
In comparison with non-Hermeian field haloes, they are grouped along the line connecting the MW and M31 analogues, which on one hand should facilitate their identification in observations. On the other hand it is obviously difficult if not impossible to observe small dwarf galaxies behind M31 due to the galaxy’s high stellar density. Most of the Hermeians were found at a distance of less than 1 Mpc from their second targets, but there is a Hermeian halo more than 2 Mpc away from the second target. We find that Hermeians tend to move away from their targets and their velocities are significantly higher than those of non-Hermeian haloes. Our finding, while preliminary, suggests that the increase in the velocity of Hermeians could be attributed to the gravity assists, however, this hypothesis requires more detailed consideration. Obtained results admit that it is possible to get Hermeians with the velocity and distance of NGC 3109. Moreover, some of the investigated Hermeian haloes have more extreme values of these parameters. At the same time, masses of all these haloes are significantly smaller that estimated NGC 3109 mass. In conclusion, our findings support the hypothesis that Hermeian haloes may be found in the vicinity of the Milky Way.
Hermeian haloes and other haloes that have closely interacted with more than one target could facilitate the exchange of material between host haloes. This fact makes Hermeian and other similar halo populations important participants in the evolution of their targets. At present, formation history of a dark matter halo is described by a “merger tree” that tracks all its progenitors. However, the current thinking is that every halo in such merger tree has only one descendant. The ubiquity of Hermeian haloes in dark matter simulations indicates that halo assembly could be described more precisely not by a tree, but by a graph which can have multiple connections between haloes in both directions of time. Building such graphs based on the history of individual simulation particles inhabiting each halo would give a complete view of matter exchange between bound structures in the Universe.
Acknowledgements
The authors gratefully acknowledge the Gauss Centre for Supercomputing e.V. (www.gauss-centre.eu) for funding this project by providing computing time on the GCS Supercomputer SUPERMUC-NG at Leibniz Supercomputing Centre (www.lrz.de). We thank Peter Behroozi for creating and providing the ROCKSTAR merger trees of the VSMDPL and ESMDPL simulations. The CosmoSim database (https://www.cosmosim.org) provides access to the simulation and the ROCKSTAR data. The database is a service by the Leibniz Institute for Astrophysics Potsdam (AIP). JS acknowledges support from the French Agence Nationale de la Recherche for the LOCALIZATION project under grant agreements ANR-21-CE31-001. The work of SP was supported by LPI NNG 41-2020. GY also acknowledges the Ministerio de Ciencia e Innovación (Spain) for partial financial support under research grant PID2021-122603NB-C21.
Data Availability
The data used in this work were extracted from the VSMDPL and ESMDPL halo catalogues. Requests for access to the simulation data should be directed to MultiDark project PI. For interested readers the data that support the findings of this study (in particular, information on found Hermeian haloes) are available from Sergey Pilipenko, upon reasonable request.
References
- An et al. (2019a) An S.-H., Kim J., Moon J.-S., Yoon S.-J., 2019a, The Astrophysical Journal, 887, 59
- An et al. (2019b) An S.-H., Kim J., Moon J.-S., Yoon S.-J., 2019b, ApJ, 887, 59
- Bakels et al. (2021) Bakels L., Ludlow A. D., Power C., 2021, MNRAS, 501, 5948
- Banik & Zhao (2017) Banik I., Zhao H., 2017, Monthly Notices of the Royal Astronomical Society, 473, 4033
- Banik et al. (2021) Banik I., Haslbauer M., Pawlowski M. S., Famaey B., Kroupa P., 2021, Monthly Notices of the Royal Astronomical Society, 503, 6170
- Behroozi et al. (2013a) Behroozi P. S., Wechsler R. H., Wu H.-Y., 2013a, ApJ, 762, 109
- Behroozi et al. (2013b) Behroozi P. S., Wechsler R. H., Wu H.-Y., Busha M. T., Klypin A. A., Primack J. R., 2013b, ApJ, 763, 18
- Boylan-Kolchin et al. (2013) Boylan-Kolchin M., Bullock J. S., Sohn S. T., Besla G., van der Marel R. P., 2013, The Astrophysical Journal, 768, 140
- Bryan & Norman (1998) Bryan G. L., Norman M. L., 1998, ApJ, 495, 80
- Buck et al. (2019) Buck T., Macciò A. V., Dutton A. A., Obreja A., Frings J., 2019, MNRAS, 483, 1314
- Carlesi et al. (2020) Carlesi E., Hoffman Y., Gottlöber S., Libeskind N. I., Knebe A., Yepes G., Pilipenko S. V., 2020, MNRAS, 491, 1531
- Dalcanton et al. (2009) Dalcanton J. J., et al., 2009, ApJS, 183, 67
- Diemer (2021) Diemer B., 2021, The Astrophysical Journal, 909, 112
- Dutton & Macciò (2014) Dutton A. A., Macciò A. V., 2014, Monthly Notices of the Royal Astronomical Society, 441, 3359
- Einasto (1965) Einasto J., 1965, Trudy Astrofizicheskogo Instituta Alma-Ata, 5, 87
- Fattahi et al. (2016) Fattahi A., et al., 2016, MNRAS, 457, 844
- Forero-Romero et al. (2013) Forero-Romero J. E., Hoffman Y., Bustamante S., Gottlöber S., Yepes G., 2013, ApJ, 767, L5
- Gao et al. (2008) Gao L., Navarro J. F., Cole S., Frenk C. S., White S. D. M., Springel V., Jenkins A., Neto A. F., 2008, MNRAS, 387, 536
- Garrison-Kimmel et al. (2014) Garrison-Kimmel S., Boylan-Kolchin M., Bullock J. S., Lee K., 2014, MNRAS, 438, 2578
- Gill et al. (2005) Gill S. P. D., Knebe A., Gibson B. K., 2005, MNRAS, 356, 1327
- Green et al. (2021) Green S. B., van den Bosch F. C., Jiang F., 2021, MNRAS, 503, 4075
- Haggar et al. (2020) Haggar R., Gray M. E., Pearce F. R., Knebe A., Cui W., Mostoghiu R., Yepes G., 2020, MNRAS, 492, 6074
- Klypin et al. (2011) Klypin A. A., Trujillo-Gomez S., Primack J., 2011, ApJ, 740, 102
- Klypin et al. (2016) Klypin A., Yepes G., Gottlöber S., Prada F., Heß S., 2016, MNRAS, 457, 4340
- Knebe et al. (2011a) Knebe A., Libeskind N. I., Knollmann S. R., Martinez-Vaquero L. A., Yepes G., Gottlöber S., Hoffman Y., 2011a, MNRAS, 412, 529
- Knebe et al. (2011b) Knebe A., et al., 2011b, Monthly Notices of the Royal Astronomical Society, 415, 2293
- Knebe et al. (2011c) Knebe A., Libeskind N. I., Doumler T., Yepes G., Gottlöber S., Hoffman Y., 2011c, MNRAS, 417, L56
- L’Huillier et al. (2015) L’Huillier B., Park C., Kim J., 2015, Monthly Notices of the Royal Astronomical Society, 451, 5046
- Lee et al. (2016) Lee C. T., Primack J. R., Behroozi P., Rodríguez-Puebla A., Hellinger D., Dekel A., 2016, Monthly Notices of the Royal Astronomical Society, 466, 3834
- Libeskind et al. (2020) Libeskind N. I., et al., 2020, MNRAS, 498, 2968
- Ludlow et al. (2009) Ludlow A. D., Navarro J. F., Springel V., Jenkins A., Frenk C. S., Helmi A., 2009, ApJ, 692, 931
- Mansfield & Kravtsov (2020) Mansfield P., Kravtsov A. V., 2020, Monthly Notices of the Royal Astronomical Society, 493, 4763
- Moore et al. (2004) Moore B., Diemand J., Stadel J., 2004, in Diaferio A., ed., IAU Colloq. 195: Outskirts of Galaxy Clusters: Intense Life in the Suburbs. pp 513–518 (arXiv:astro-ph/0406615), doi:10.1017/S1743921304001127
- Muldrew et al. (2011) Muldrew S. I., et al., 2011, Monthly Notices of the Royal Astronomical Society, 419, 2670
- Navarro et al. (1996) Navarro J. F., Frenk C. S., White S. D. M., 1996, ApJ, 462, 563
- Navarro et al. (2004) Navarro J. F., et al., 2004, MNRAS, 349, 1039
- Navarro et al. (2010) Navarro J. F., et al., 2010, MNRAS, 402, 21
- Newton et al. (2022) Newton O., et al., 2022, MNRAS, 514, 3612
- Pilipenko et al. (2017) Pilipenko S. V., Sánchez-Conde M. A., Prada F., Yepes G., 2017, MNRAS, 472, 4918
- Prada et al. (2012) Prada F., Klypin A. A., Cuesta A. J., Betancort-Rijo J. E., Primack J., 2012, MNRAS, 423, 3018
- Rodríguez-Puebla et al. (2017) Rodríguez-Puebla A., Primack J. R., Avila-Reese V., Faber S. M., 2017, MNRAS, 470, 651
- Shaya & Tully (2013) Shaya E. J., Tully R. B., 2013, Monthly Notices of the Royal Astronomical Society, 436, 2096
- Simpson et al. (2018) Simpson C. M., Grand R. J. J., Gómez F. A., Marinacci F., Pakmor R., Springel V., Campbell D. J. R., Frenk C. S., 2018, MNRAS, 478, 548
- Sorce et al. (2022) Sorce J. G., et al., 2022, arXiv e-prints, p. arXiv:2207.13102
- Soszyński et al. (2006) Soszyński I., Gieren W., Pietrzyński G., Bresolin F., Kudritzki R. P., Storm J., 2006, ApJ, 648, 375
- Springel (2005) Springel V., 2005, MNRAS, 364, 1105
- Teyssier et al. (2012) Teyssier M., Johnston K. V., Kuhlen M., 2012, MNRAS, 426, 1808
- Wetzel et al. (2015) Wetzel A. R., Deason A. J., Garrison-Kimmel S., 2015, ApJ, 807, 49