Different degrees of nitrogen and carbon depletion in the warm molecular layers of protoplanetary disks
Abstract
Observations have revealed that the elemental abundances of carbon and oxygen in the warm molecular layers of some protoplanetary disks are depleted compared to those is the interstellar medium by a factor of 10-100. Meanwhile, little is known about nitrogen. To investigate the time evolution of nitrogen, carbon, and oxygen elemental abundances in disks, we develop a one-dimensional model that incorporates dust settling, turbulent diffusion of dust and ices, as well as gas-ice chemistry including the chemistry driven by stellar UV/X-rays and the galactic cosmic rays. We find that gaseous CO in the warm molecular layer is converted to \ceCO2 ice and locked up near the midplane via the combination of turbulent mixing (i.e., the vertical cold finger effect) and ice chemistry driven by stellar UV photons. On the other hand, gaseous \ceN2, the main nitrogen reservoir in the warm molecular layer, is less processed by ice chemistry, and exists as it is. Then the nitrogen depletion occurs solely by the vertical cold finger effect of \ceN2. As the binding energy of \ceN2 is lower than that of CO and \ceCO2, the degree of nitrogen depletion is smaller than that of carbon and oxygen depletion, leading to higher elemental abundance of nitrogen than that of carbon and oxygen. This evolution occurs within 1 Myr and proceeds further, when the parameter for the diffusion coefficient is 10-3. Consequently, the \ceN2H+/CO column density ratio increases with time. How the vertical transport affects the midplane ice composition is briefly discussed.
1 Introduction
Formation of planets occurs in protoplanetary disks. The elemental compositions of gas and solids in disks directly set the elemental compositions of forming planets in the disks. Understanding the elemental compositions of gas and solids in disks is thus the first step in understanding how planets acquire their compositions (e.g., Öberg & Bergin, 2021).
Recent observations have found that elemental abundances of volatile carbon and oxygen in some disks are different from those in the interstellar medium (ISM). In the three disks (TW Hya, DM Tau, and GM Aur), where gas mass is measured with the HD line observations (Bergin et al., 2013; McClure et al., 2016), the CO abundance in the warm molecular layer ( 20 K) is lower than the canonical value of by factors of 10–100 (e.g., Favre et al., 2013; Zhang et al., 2019, 2021). As CO is the major carrier of volatile carbon, a reasonable hypothesis is that volatile elemental carbon is depleted in the gas phase by similar factors. Survey observations of disks in nearby star-forming regions have found that CO emission is much weaker than expected, even when the freeze-out of CO onto dust grains and photodissociation by stellar UV photons are considered in disk models (Ansdell et al., 2016; Long et al., 2017; Miotello et al., 2017). The faint CO emission may indicate that the CO abundance in the warm molecular layer in disks is typically lower than the canonical value. Alternatively, it may indicate that gas mass of \ceH2 is lower than expected in the disks. The timescale of carbon (and oxygen) depletion has been suggested to be fast (1 Myr), based on the observations of CO isotopologues towards disks in different evolutionary stages/ages (Bergner et al., 2020b; Zhang et al., 2020). In addition, some disks show brighter \ceC2H emission than expected, indicating the C/O ratio higher than unity at least in the \ceC2H emitting regions (Bergin et al., 2016; Miotello et al., 2019; Bosman et al., 2021b). The high C/O ratio indicates that the degree of oxygen depletion is more significant than that of carbon.
There are some proposed mechanisms to explain the depletion of volatile carbon and oxygen in the warm molecular layer: conversion of CO into less volatile species through chemistry driven by cosmic-rays/X-rays (e.g., Bergin et al., 2014; Furuya & Aikawa, 2014), so-called vertical cold finger effect (e.g., Meijerink et al., 2009; Kama et al., 2016; Xu et al., 2017), and a combination of both of these (Krijt et al., 2020). The vertical cold finger effect is the phenomena as follows; Turbulence brings the gaseous molecules from the warm molecular layer to the disk midplane, where the dust temperature is low and molecules are frozen out onto large dust grains. As large dust grains are not fully coupled with the turbulent gas motion, they are settled close to the midplane, trapping ices on them. As a result, the abundances of gaseous molecules in the disk atmosphere can decrease with time.
Compared to carbon and oxygen, our understanding of the nitrogen elemental abundance in disks is rather limited. The main carrier of nitrogen in the warm molecular layer is expected to be \ceN2 or atomic N in the gas phase (e.g., Li et al., 2013), which are not directly observable. Some observational studies have concluded that the degree of nitrogen depletion is significantly smaller than that of carbon and oxygen. Cleeves et al. (2018) concluded that carbon and oxygen are depleted in the observable gas of the IM Lup disk compared to the ISM elemental abundances by a factor of 20 or even larger, whereas nitrogen is not significantly depleted (up to a factor of four compared to the ISM elemental abundance), based on the observations of CO, \ceC2H, and HCN and the physical-chemical modeling of the disk. The estimated age of IM Lup is 0.5–1 Myr (Mawet et al., 2012), again indicating the timescale of carbon and oxygen depletion is fast. Anderson et al. (2019) found that the \ceN2H+/CO flux ratio in 5–11 Myr old disks in Upper Scorpius is higher than that in 2 Myr old disks, including the IM Lup disk. The high \ceN2H+/CO flux ratio in the older disks may indicate that \ceN2, which is the parent molecule of \ceN2H+, is less impacted by the physical and chemical processes in disks, and remains in the gas phase for longer timescale than CO. It also may indicate that the degree of carbon depletion continues to be enhanced over time after 2 Myr.
In addition to the elemental composition in disks, nitrogen abundance is relevant to the measurements of the disk gas mass; Trapman et al. (2022) showed that the combination of \ceC^18O line and \ceN2H+ line can be a good prove of disk gas mass, assuming that \ceN2 is not depleted in the disk gas. One of the biggest uncertainties to measure the disk gas mass is the CO abundance in the warm molecular layer, as it is not necessarily the canonical value of 10-4 as mentioned above. As \ceN2H+ is destroyed by CO, the \ceC^18O/\ceN2H+ flux ratio is useful to constrain the CO abundance in the warm molecular layer (Trapman et al., 2022), if \ceN2 is not depleted significantly in contrast to CO.
Theoretically, the elemental abundance of nitrogen in the warm molecular layer can be reduced as well as that of carbon. CO and \ceN2 have similar volatility; laboratory experiments showed that the binding energy of \ceN2 is slightly lower than that of CO, and their sublimation temperatures should be within a few degrees of each another (Fayolle et al., 2016). Then, the \ceN2 abundance in the warm molecular layer can be reduced by the vertical cold finger effect like CO. In addition, the chemical conversion of \ceN2 to less volatile species (\ceNH3) driven by cosmic-rays/X-rays can occur after significant CO depletion (when the CO abundance becomes lower than 10-5; Furuya & Aikawa, 2014).
For quantitative understanding of the evolution of C/N/O elemental abundances in disks, models, that consider both gas-ice chemistry and the vertical cold finger effect are required. Several previous studies have investigated detailed gas-ice chemistry in turbulent disks (e.g., Semenov & Wiebe, 2011; Furuya et al., 2013; Furuya & Aikawa, 2014). In these studies, however, dust grains were assumed to be dynamically well coupled with gas, and therefore the vertical cold finger effect was not included. Other studies focused only on carbon and oxygen, and chemical processes other than adsorption and desorption of molecules were not considered (Xu et al., 2017; Krijt et al., 2018). Krijt et al. (2020) combined the dust evolution and grain surface chemistry of carbon and oxygen driven by cosmic rays, but ignored the chemistry driven by stellar UV photons; as growth and settling of dust grains proceed, UV photons penetrate deeper into the disks, driving chemistry induced by UV photons (e.g., Akimkin et al., 2013; Van Clepper et al., 2022).
In this study, we investigate the time evolution of carbon-, nitrogen-, and oxygen-bearing species in a disk, considering the vertical cold finger effect and gas-ice chemistry, which includes the chemistry driven by stellar UV/X-rays and the galactic cosmic rays. The rest of this paper is organized as follows. Our numerical model is described in Section 2, and the numerical results are presented in Section 3. We discuss the timescale of elemental depletion, the temporal evolution of column densities of gas-phase species, and the midplane ice composition in Section 4. Our findings are summarized in Section 5.
2 Model
2.1 Numerical setup
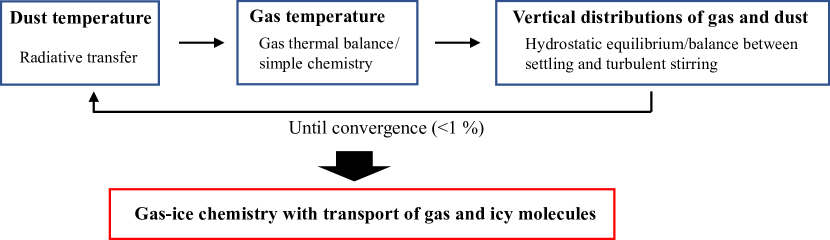
Figure 1 shows an outline of our modeling processes. We first obtain the self-consistent solution of the density and temperature profiles of the gas and dust in the vertical direction of a disk, irradiated by stellar UV and X-rays. The gas surface density profile in the disk is taken from the TW Hya disk model developed in Cleeves et al. (2015) with the global dust-to-gas mass ratio of 0.01. The size distribution of dust in an entire disk follows a power law with an index of -3.5 with minimum () and maximum radii () of 0.1 m and 1 mm, respectively. The dust size distribution is discretized into 50 logarithmically spaced bins.
Dust temperature is obtained from the radiative equilibrium using RADMC-3D code (Dullemond et al., 2012). Gas temperature is obtained by solving the steady-state balance between heating and cooling, considering simplified chemistry (Lee et al., 2021). Gas density distribution is determined from the hydrostatic equilibrium, while the distribution of dust with different radius is obtained by solving the steady-state balance between settling and turbulent stirring (e.g., Takeuchi & Lin, 2002). Our vertical gas distribution is different from that in Cleeves et al. (2015), which was calculated assuming a Gaussian profile and the parametric gas scale height. We have confirmed that the degree of carbon and nitrogen depletion discussed in Section 3 does not change significantly whether using the vertical gas distribution from the hydrostatic equilibrium or the parametric distribution in Cleeves et al. (2015). The dust settling velocity and the diffusion coefficient for turbulent stirring are given later in this section.
The input stellar spectrum is composed of the observed UV spectrum of TW Hya (Dionatos et al., 2019), added to a Black body component with the effective temperature of 4110 K (Andrews et al., 2012). As our model is one-dimensional plane-parallel, the stellar flux at a radius from the star is assumed to be absorbed at the surface of the disk and half of the flux diffuses into the vertical direction towards the midplane. The stellar flux at wavelength at the surface of the disk ( in our models) is given by
| (1) |
where is the stellar spectrum. The stellar flux at each height is calculated by RADMC-3D (Dullemond et al., 2012). The dust opacity for UV and longer wavelengths is calculated with dsharp_opac package from Birnstiel et al. (2018), assuming the dust composition listed in their Table 1. In addition to dust, we consider polycyclic aromatic hydrocarbons (PAHs) as a source of UV opacity (Weingartner & Draine, 2001) and gas heating. We assume that a PAH radius of 5 Å(Weingartner & Draine, 2001) and PAHs are always dynamically coupled with gas. The average Galactic PAH-to-dust mass ratio is 4.6 % (Draine & Li, 2007), while the PAH abundance in disks is lower than that value by a factor of 10-100 (Geers et al., 2006). In our models, PAH-to-dust mass ratio in an entire disk is assumed to be 0.05 %, i.e., 100 times lower than the Galactic average value. X-ray ionization rate is calculated by the analytical formula (Igea & Glassgold, 1999; Bai & Goodman, 2009), with the stellar X-ray luminosity of 1030 erg s-1. The non-attenuated cosmic-ray (CR) ionization rate is set to be 10-18 s-1 and the CR ionization rate of each disk position is calculated with the attenuation column of 96 g cm-2 (Umebayashi & Nakano, 1981).
Next, we solve gas and ice chemistry, considering the vertical transport of gas and ice, under the physical conditions obtained in the first step:
| (2) | |||
| (3) |
where is the number density of species , and is the height from the midplane. and represent the production rate and the loss rate, respectively, of species by chemical reactions (see Section 2.2). The second term in the left-hand side of Equation (2) describes the vertical settling of dust, while the third term describes the turbulent diffusion. The dust setting velocity is , where is the Keplerian orbital frequency (Nakagawa et al., 1981). Assuming Epstein regime, the dimensionless stopping time is defined as , where is the internal density of dust (1.68 g cm-3), is the radius of dust, is the mass density of gas, and is the local sound velocity. The diffusion coefficient is parameterized as (Shakura & Sunyaev, 1973), where is assumed to be 10-3 in this study, unless otherwise stated. The Schmidt number, , describes the strength of coupling between gas and dust and is given by (Youdin & Lithwick, 2007). For gas phase species, and .
For the numerical integration of Equation 2, the first order operator splitting method is employed; we first integrate the equation between times and without the source terms of chemical reactions. Next, we integrate the equation without the transport terms (i.e., only with the terms of chemical reactions) between times and at each height . In the time integration of the chemical reaction terms, we re-bin the dust size distribution into 8 bins (that is, icy species on 8 different dust populations are distinguished from each other) to shorten the computational time. The dust sizes for each of the 8 dust populations are (, ) = (0.10 m, 0.32 m), (0.32 m, 1.0 m), (1.0 m, 3.2 m), (3.2 m, 10 m), (10 m, 32 m), (32 m, 100 m), (100 m, 320 m), and (320 m, 1 mm), where and are the maximum and minimum radius for each dust bin, respectively. Even if we used the larger number (e.g., 12) of dust bins for re-binning, numerical results presented in Section 3 remained almost unchanged.
The averaged radius () of each dust bin for calculations of the chemistry are defined as follows (Vasyunin et al., 2011):
| (4) |
where is the number density of grains with size between and . Dividing the total mass of each dust population per unit volume () by the mean mass of one dust grain (), we can obtain the number of grains with the averaged radius of per unit volume. The temperature for each dust bin () is defined by the area-weighted average temperature (Gavino et al., 2021), because the rate coefficients of gas-dust interactions are proportional to the surface area in general:
| (5) |
2.2 Chemical reaction network
The chemical network used in this work is based on that in Furuya & Aikawa (2014), which includes gas-phase reactions, interaction between gas and (icy) grain surfaces, and grain surface reactions. UV photodissociation/photoionization rates are calculated by convolving the local radiation field and the photodissociation/photoionization cross sections (Heays et al., 2017). The self-shielding and mutual shielding factors for the photodissociation of \ceH2 and CO are taken from Visser et al. (2009). Shielding factors for \ceN2 photodissociation are taken from Li et al. (2013). The binding energies of CO, \ceCO2, \ceH2O, and \ceN2 are set at 1150 K, 2600 K, 5700 K, and 1000 K, respectively.
2.3 Initial compositions
Initially, we assume spatially uniform volatile elemental abundances throughout the disk. Our underlying initial elemental abundances for H:He:C:N:O:Na:Mg:Si:S:Fe are 1.00:9.75(-2):1.00(-4):6.00(-5):2.20(-4):2.25(-9):1.09(-8):9.74(-9):9.14(-8):2.74(-9), respectively, where means . Then the initial elemental [C/N] and [C/O] ratios are 2 and 0.5, respectively. For initial molecular abundances, we assume that all hydrogen is in \ceH2, all carbon is in CO, the remaining oxygen is in \ceH2O, and all nitrogen is in \ceN2. The other elements are assumed to exist as either atoms or atomic ions in the gas phase. All CO and \ceN2 are assumed to be initially present in the gas phase. We determine the initial partitioning of \ceH2O among ice mantles of 8 different dust populations as follows. All \ceH2O is assumed to be present in ice mantles, and the number density of \ceH2O ice on each dust population are assumed to scale with , i.e., larger sized dust grains have the larger amount of \ceH2O ice.
Our two-step approach assumes that large dust grains are already settled and the depletion of elemental carbon, nitrogen, and oxygen in the disk upper layers have not occurred yet at the beginning of our simulations. The first assumption would be verified, because observations of Class 0/I sources have found that their inner (1000 au) dense regions already contain mm-sized dust grains (e.g., Miotello et al., 2014; Harsono et al., 2018; Galametz et al., 2019). In addition, the presence of dust ring structures observed in some Class 0/I disks may indicate that dust coagulation and settling have already started in the young disks (e.g., Sheehan & Eisner, 2018; Nakatani et al., 2020; Ohashi et al., 2021). The second assumption would be justified as well, at least for carbon and nitrogen; Class 0/I disks are warmer than Class II disks (i.e., the vertical cold finger effect is less efficient) with no signs of CO freeze-out in the inner 100 au (van ’t Hoff et al., 2020) and with the CO abundance close to the canonical value (Zhang et al., 2020). As \ceN2 is more volatile than CO, it would be reasonable to assume \ceN2 is entirely present in the gas phase.
The situation for water (i.e., oxygen) is less clear. The HO emission has been detected in the inner warm (100 K) regions (inner envelope and/or a disk), where water ice has sublimated, of several Class 0 sources at spatial scales of 100 au (Persson et al., 2012; Jensen et al., 2019). Harsono et al. (2020) reported non-detection of HO emission toward Class I disks at scales of 100 au, possibly because abundant large (mm-sized or even larger) dust grains suppress the emission from inner warm disk regions. Theoretically speaking, one can consider two extreme scenarios about water in Class 0/I disks. In one scenario, due to thermal desorption and/or photodesorption of water ice, followed by photodissociation of water in the gas phase, water ice on dust grains are uncovered in the upper layers of Class 0/I disks (still, water ice can exist close to the midplane). As a result, dust coagulation and settling would not cause the depletion of volatile oxygen in the disk upper layers. In this case, the volatile oxygen abundance would be uniformly 10-4 in Class 0/I disks (oxygen in CO is not counted here). In another scenario, both thermal desorption and photodesorption are negligible, and coagulation and settling of dust covered by water ice cause the depletion of volatile oxygen in the disk upper layers. In this case, the volatile oxygen abundance scales with the local dust-to-gas mass ratio in Class 0/I disks. Reality would be somewhere between the two extremes, depending on stellar properties and disk physical structures. The former scenario is assumed in our fiducial models, while the latter scenario is discussed in Section 4.4.
3 Results
3.1 Vertical distributions of molecular abundances
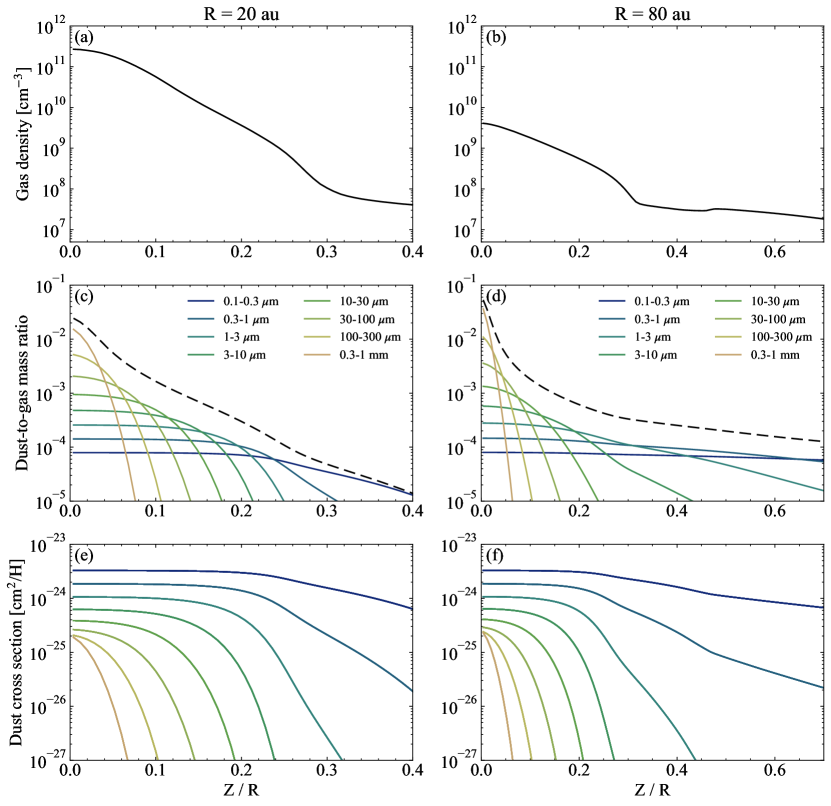
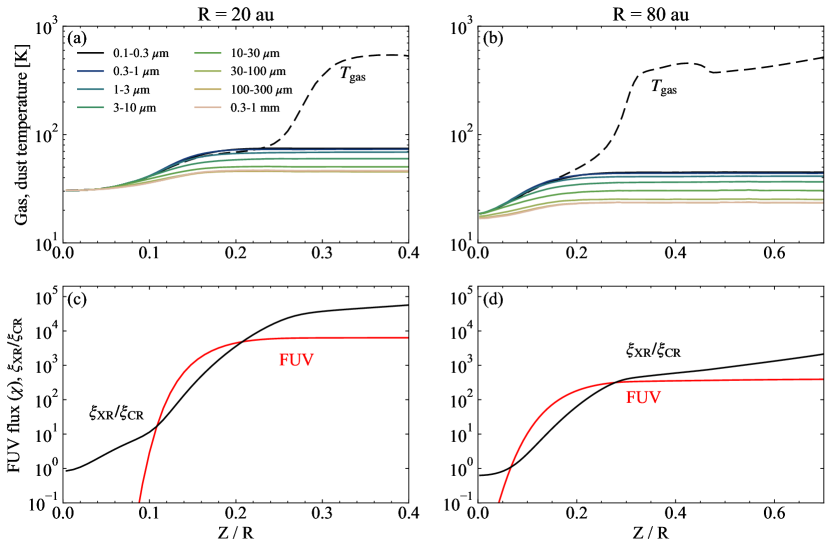
Figures 2 and 3 show the vertical physical structure of the disk at au (inside the CO snowline) and au (outside the CO snowline) as functions of . Lager dust grains tend to settle closer to the midplane (e.g., Dullemond & Dominik, 2004), and the dust mass is dominated by population with the largest size (1 mm). However, even at the disk midplane, the total cross section of dust, which is relevant with the rates of gas-dust interaction, is dominated by the population with the smallest size (1 m). The dust temperature of larger dust grains is colder than that of smaller ones in the disk upper layers (0.1 ), reflecting the different wavelength-dependency of the opacity of different sized dust grains (e.g., Wolf, 2003). Near the disk midplane, where even the sub-mm radiation becomes optically thick, the dust temperature is independent of its size. As discussed in the Appendix A, the size-dependent dust temperature is essentially important for the vertical cold finger effect. Stellar far ultraviolet (FUV) radiation starts to be attenuated at , above which the gas temperature is higher than the dust temperatures. FUV radiation can penetrate relatively deep into the disk; even at , where is the wavelength-integrated FUV flux normalized by the Draine field (Draine, 1978).
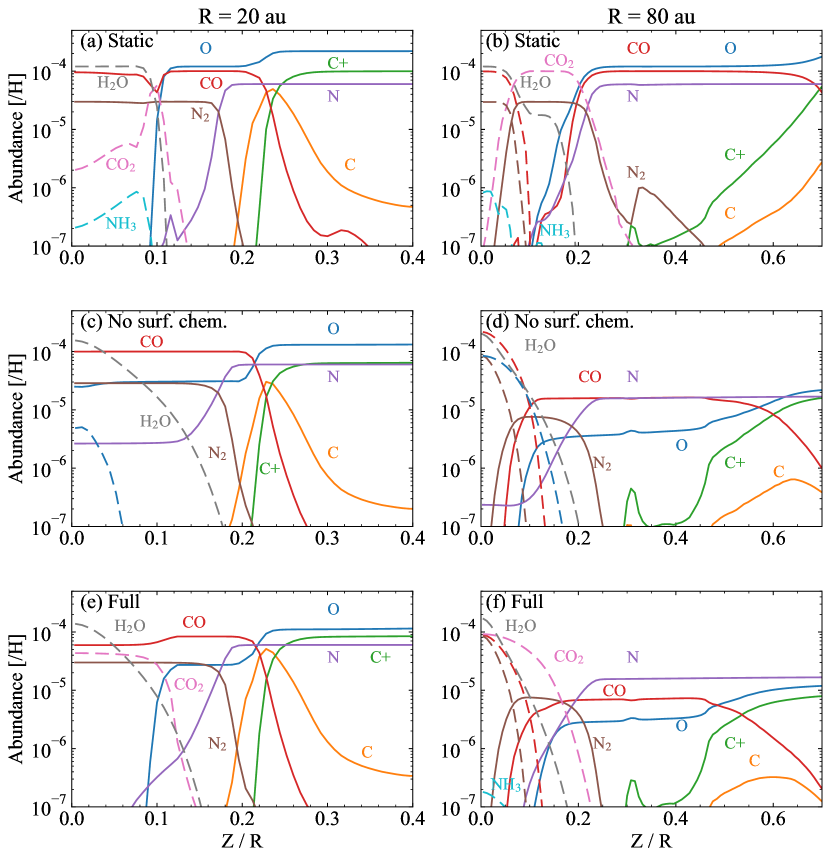
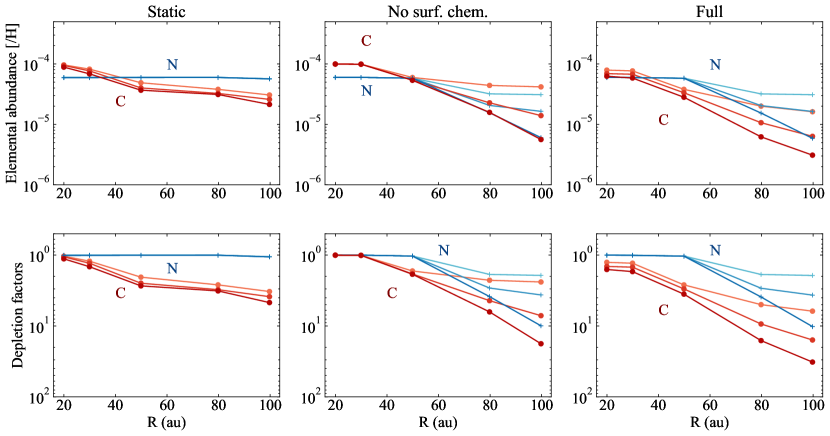
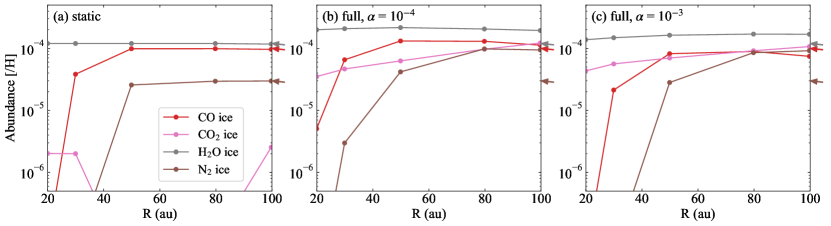
The top panels in Figure 4 show the abundances of selected species as functions of at au and au at 1 Myr in the model without any transport processes (i.e., only chemical reactions are considered; hereafter called static model). At au, gas-phase CO is abundant with the abundance of 10-4 except at , where CO is efficiently dissociated by stellar UV photons. At , where stellar UV photons are partly attenuated (), \ceCO2 ice is formed by the surface two-body reaction between CO ice and OH ice, the latter of which is formed by photodissociation of \ceH2O ice (e.g., Watanabe & Kouchi, 2002; Ioppolo et al., 2009; Oba et al., 2010; Noble et al., 2011; Eistrup et al., 2016; Bosman et al., 2018; Ruaud & Gorti, 2019; Ruaud et al., 2022). Above , the stellar UV radiation is too strong, and \ceCO2 and \ceH2O ices are destroyed and not present abundantly. The \ceCO2-rich regions also appear at au between the CO-ice rich and CO-gas rich regions (–0.2). The conversion of CO into \ceCO2 is driven by stellar UV photons, and the cosmic-ray/X-ray induced UV photons are less relevant, because the flux of the latter is lower than the former by several orders of magnitude at .
The middle panels in Figure 4 show the molecular abundances at 1 Myr in the model without surface chemistry but with the transport processes. In this model, all two-body reactions on grain surfaces and photodissociation of icy species are turned off, but adsorption of gas-phase species and thermal/non-thermal desorption of icy species are considered. At au, where the dust temperatures near the mideplane are low enough for the freeze-out of CO and \ceN2, the gas-phase abundances of CO and \ceN2 become lower than their canonical values ( and , respectively) by factors of 5 and 3, respectively, due to the vertical cold finger effect. The impact of the vertical cold finger effect is more significant for CO than \ceN2, because of the higher binding energy of CO (1150 K) than that of \ceN2 (1000 K). As a result, the elemental abundances of nitrogen and carbon become similar at au. At au, the temperatures of all dust populations are higher than the freeze-out temperature of CO and \ceN2 even at the midplane. Then the cold finger effect does not work, and the gas-phase abundances of CO and \ceN2 in the warm molecular layers are their canonical values.
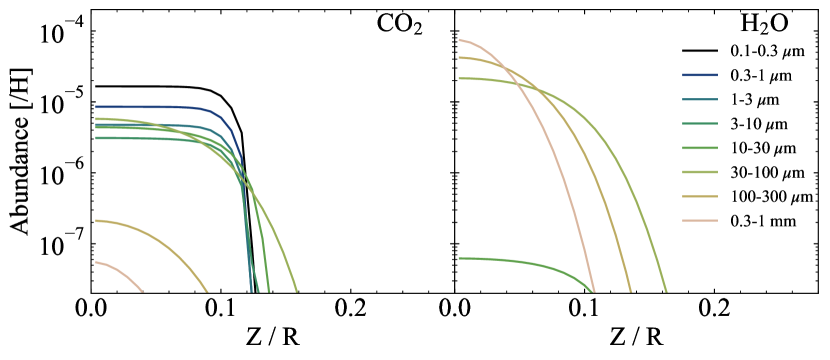
The bottom panels in Figure 4 show the molecular abundances at 1 Myr in our full model, where both transport processes and gas-ice chemistry are considered. At au, \ceCO2 ice is the major reservoir of elemental carbon and oxygen at , as well as CO ice and \ceH2O ice. \ceCO2 ice is formed by the surface reaction CO + OH \ceCO2 + H at –0.2, where stellar UV radiation is not significantly attenuated, and transported into the midplane, where UV radiation is completely shielded, by dust settling and turbulent mixing. The source of oxygen for the \ceCO2 formation is \ceH2O ice and atomic oxygen, the latter of which is transported from the disk upper layers. \ceN2 does not easily react with radical species on the grain surface in contrast to CO. Owing to the much larger binding energy of \ceCO2 (and \ceH2O) compared to that of \ceN2, elemental carbon and oxygen are easily locked up as ices near the midplane than nitrogen. Consequently, nitrogen becomes the third most abundant element in the gas phase after hydrogen and helium at au.
At au, inside the CO snowline, \ceCO2 ice is formed at by the surface reaction CO + OH \ceCO2 + H, and transported into the midplane by dust settling and turbulent mixing like at au. Because of the \ceCO2 formation, the gas-phase CO abundance becomes lower than the canonical value by a factor of 2 at 1 Myr. The abundance of \ceCO2 ice remains lower than those of CO gas and \ceH2O ice at au. The main limiting factor of the \ceCO2 formation is the amount of available oxygen for the chemistry. At 80 au (outside the CO snowline), atomic O and \ceH2O ice at are abundant enough to convert the significant fraction of CO gas into \ceCO2 ice, because CO near the midplane is frozen out onto dust grains, and thus abundant only in the gas phase at . \ceH2O ice below does not contribute to the \ceCO2 formation, because \ceH2O ice is mostly on large (100 m) dust grains, which are dynamically decoupled from the gas, and because the stellar UV radiation to dissociate \ceH2O ice is significantly attenuated. At 20 au (inside the CO snowline), however, atomic O and \ceH2O ice at are not abundant enough, because CO gas is present throughout (both in the surface layer and at the midplane). As a result, the conversion of CO gas into \ceCO2 ice is not very efficient inside the CO snowline compared to outside the CO snowline.
Our models neglect radial drift of dust grains. As discussed in Appendix B, the size of dust grains which contributes to the grain surface chemistry efficiently is 100 m, and larger dust grains do not play a significant role on the chemistry. The dimensionless stopping time of 100 m-sized dust grains is 10-3 and 5 at the midplane of au and 80 au, respectively. For a 100 m-sized dust grain, the timescale of drifting from 80 au to 30 au (i.e., around the CO snowline) is evaluated to be 1 Myr using Eqs. 17 and 18 in Brauer et al. (2008). Then the impact of radial drift on our results on the carbon and nitrogen depletion outside the CO snowline would be not significant. Inside the CO snowline, radial drift of CO-ice mantled dust grains from the outer regions, followed by the sublimation of CO ice can enhance the CO gas abundance (e.g., Krijt et al., 2020). This effect would not be negligible, as not small amount of CO is present on large dust grains (100 m).
3.2 Depletion factors of carbon and nitrogen
We define depletion factors of element X as
| (6) |
where is the initial elemental abundance of X with respect to H, and is the elemental abundance of X with respect to H in the gas above the snow surfaces of CO for carbon and \ceN2 for nitrogen (cf. Zhang et al., 2019; Krijt et al., 2020). Larger value of means that the depletion of element X in regions above the snow surface is more significant. We define the position of the CO snow surface as the height below which multilayered CO ice can be present on at least one of the 8 dust populations. We compare the total desorption rate of CO by thermal desorption and photodesorption with its adsorption rate for each dust population, assuming the gas-phase CO abundance is 10-4 and grain surfaces are covered by one-monolayer of CO ice. The snow surface of CO is defined as the height above which the desorption rate of CO is greater than the adsorption rate for all dust populations. Similar definition is applied to the snow surface of \ceN2. The positions of the snow surfaces are the same among different models as long as we adopt the same disk physical model.
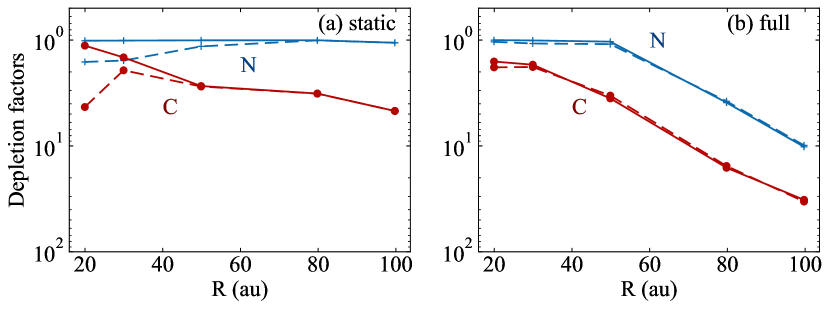
Figure 5 shows and as functions of in the static model (left panel), the model without surface chemistry (middle panel), and our full model (right model) at Myr, 0.3 Myr, and 1 Myr. As we ran our models only at = 20, 30, 50, 80, and 100 au, we cannot infer the exact radial positions of the CO and \ceN2 snowlines; the CO snowline is located at around 30 au, while the \ceN2 snowline is located at around 50 au. In the static model, is almost unity (i.e., no significant depletion) regardless of , while is 3–5 well outside the CO snowline. In the model without surface chemistry, is in the range of 2–20 outside the CO snowline, while it is close to unity inside the CO snowline. At au, the CO snow surface is close to the midplane compared to that at au, leading to the lower efficiency of the vertical cold finger effect. The radial profile of basically follows that of , and is 1–2. In the full model, is similar to that in the model without surface chemistry, because nitrogen in the warm gas is depleted only by the cold finger effect of \ceN2. in the full model is the largest (3–30) among the three models, because of the combination of the vertical cold finger effect and the surface chemistry which converts CO into \ceCO2. Consequently, can be as high as 3–5 in the full model, i.e., carbon is more depleted than nitrogen by a factor of 3 outside the CO snowline, leading to higher abundance of gas-phase nitrogen than that of gas-phase carbon. We also run some additional models to explore the parameter dependence of and , varying , , and (see the Appendix C in details). We confirmed that these parameters did not affect our qualitative chemical results. Then, the combination of the cold finger effect and the grain surface chemistry results in larger depletion of carbon than nitrogen outside the CO snowline within 1 Myr once the dust grains have settled towards the midplane, making nitrogen the third most abundant element in the gas phase after hydrogen and helium. Our full model is consistent with the observations toward the IM Lup disk with the age of 0.5–1 Myr, where carbon and oxygen are depleted compared to the ISM abundance by a factor of 20 or even larger, whereas nitrogen depletion is less significant (Cleeves et al., 2018).
4 Discussion
4.1 Timescale of elemental depletion: UV driven chemistry versus CR driven chemistry
In our full model, outside the midplane CO snowline, the volatile carbon abundance in the warm molecular layer can be reduced by a factor of more than 10 within 1 Myr due to the combination of the vertical cold finger effect and the chemical conversion of CO into \ceCO2 ice driven by stellar UV photons. On the other hand, the nitrogen abundance in the warm molecular layer is reduced solely due to the vertical cold finger effect of \ceN2. Here we discuss which processes determine the evolutionary timescale of the elemental abundances in the warm molecular layer.
When the turbulent mixing is switched off (the static model), the chemical conversion of CO into \ceCO2 ice occurs only in the limited regions (–0.2). In the full model, however, \ceCO2 ice formed at –0.2 can be transported to midplane via the turbulent mixing and dust settling, while CO near the midplane and in the disk upper layers can be transported to the regions at –0.2 via the turbulent mixing. Then, the \ceCO2-rich regions are expanded with time. The timescale of this process is limited by mixing, because the timescale of the freeze-out of CO and atomic O onto dust grains () and that of the chemistry driven by stellar UV photons () are shorter than the mixing timescale. The turbulent mixing timescale is given by . For example, is 3 yr at au, 8 yr at 50 au, and 2 yr at 100 au in our models, where is assumed to be 10-3. The freeze-out timescale is given by
| (7) |
where is the total dust cross section per hydrogen nuclei, and is the number density of hydrogen nuclei. As OH ice is produced by \ceH2O ice photodissociation, is given by
| (8) |
Cosmic-ray/X-ray induced UV photons are less important than the stellar UV; the FUV flux induced by cosmic rays in the dense molecular cloud core environment, where is 10-17 s-1, is 104 photons cm-2 s-1. As corresponds to the FUV flux of 108 photons cm-2 s-1, the cosmic-ray/X-ray induced UV photons are negligible unless s-1 (see Figure 2). Then is much shorter than and .
On the other hand, there are many previous modeling studies which show that CO is converted into less volatile species via the chemistry driven by cosmic-rays and X-rays (e.g., Bergin et al., 2014; Furuya & Aikawa, 2014). In brief, CO is destroyed by \ceHe+ to produce \ceC+ and atomic O, which are eventually locked up in icy \ceCO2, icy \ceCH4, and icy carbon-chain molecules. As these molecules are much less volatile than CO, they are present in ice mantles even inside the CO snowline. As the rate-limiting step of the CO gas reprocessing chemistry is the ionization of \ceHe by cosmic-rays/X-rays to produce \ceHe+, the timescale is given by
| (9) |
where is the abundance of species , and is the ionization rate of He atom (Furuya & Aikawa, 2014), which is a half of the ionization rate of \ceH2. Then is much larger than and . \ceN2 can also be converted into less volatile species (\ceNH3 ice) by the following pathway (Willacy, 2007; Furuya & Aikawa, 2014): \ceN2 \ceN2H+ NH. Once NH is formed, it is adsorbed onto dust grains, followed by subsequent hydrogenation to form \ceNH3 ice. The timescale of the \ceN2 conversion into \ceNH3 ice is slightly longer than , as it occurs only after the significant depletion of CO gas (when the CO abundance is lower than 10-5); otherwise \ceN2H+ is destroyed by CO and \ceN2 is reformed (Furuya & Aikawa, 2014). is much longer than and , and thus the chemistry driven by cosmic-rays (and X-rays) are less important than that driven by stellar UV photons. Even if the higher value for of 10-16 s-1 is assumed, the above conclusion holds, because is still larger than , , and . Indeed, the depletion factors of carbon and nitrogen do not change significantly between the model with s-1 and that with s-1 (see Appendix C).
4.2 Dependence on the strength of turbulence
In our models presented so far, the parameter for the vertical diffusion coefficient is assumed to be 10-3. As discussed in Section 4.1, the timescale of carbon and nitrogen depletion is mostly determined by the turbulent mixing timescale, and thus the parameter should affect the timescale and the degrees of the carbon and nitrogen depletion at given time. Recent observational studies have put constraints on the strength of the turbulence in the warm molecular layers for some disks on the basis of the molecular line observations. Flaherty et al. (2020) constrained the non-thermal gas motion () in disks around DM Tau, MWC 480, and V4046 Sgr, based on the \ce^12CO 2–1 observations and parametric disk models. Converting to by , they found that for the DM Tau disk, for the MWC 480 disk, and for the V4046 Sgr disk in the gas traced by \ce^12CO 2–1, i.e., not the disk midplane. Similar observational studies toward the disks around TW Hya and HD 162936 indicate and , respectively (Teague et al., 2016; Flaherty et al., 2017, 2018).
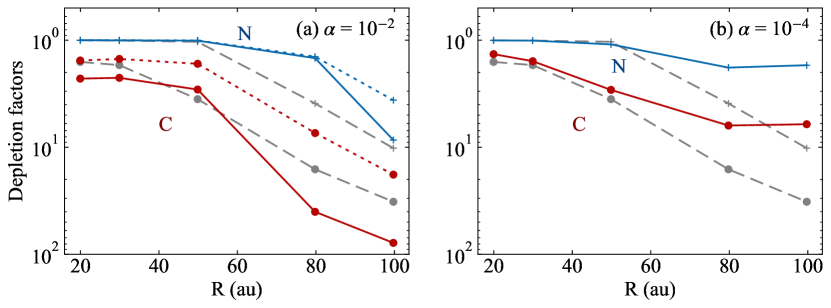
These observational studies seem to indicate that the strength of the turbulence is not strong () in disks in general, but the turbulence is strong () in some disks. To explore the impact of the value on the model results, we recalculated the entire modeling processes (Figure 1) with and as the value of parameter also affects the disk physical conditions. Figure 6 shows and in full models with (left panel) and (right panel). As the mixing timescale is inversely proportional to , already reaches 10 at 0.1 Myr at 80 au in the model with . Both and reach the steady state values within 1 Myr in the model with . In the model with , almost reaches the steady state value within 1 Myr, while does not. We reran the model with for 3 Myr, and confirmed that reaches 50 and 60 at au and au, respectively, at 3 Myr, while at au almost reaches the steady state value within 1 Myr. In the model with , the depletion factors are less than 10 even at 1 Myr, because of the long mixing timescale (e.g., longer than 1 Myr at au). Therefore, relatively large value of (10-3) is favorable for the significant depletion of carbon and making the warm molecular layer enriched in nitrogen relative to carbon within 1 Myr.
On the other hand, Anderson et al. (2019) found that \ceN2H+/\ceCO flux ratio is higher in 5-10 Myr disks than younger disks with the age of 2 Myr. If this trend primary traces the evolution of volatile elemental abundances, the depletion of carbon should continue in 5-10 Myr. Because time it takes for the depletion factors reach steady state is shorter for higher value, our model with = 10-4 or 10-3 may be more consistent with the finding by Anderson et al. (2019) rather than the model with . Taken together, to explain the observed CO (or carbon) depletion timescale by our models, the reasonable value of is 10-3.
4.3 Column densities of gas-phase molecules
Here we discuss how the column densities of gas-phase species evolve with time in our full model with . Figure 7 shows the column densities of CO and \ceN2, their protonated species (\ceHCO+ and \ceN2H+), and the prove of the elemental carbon-to-oxygen ratio in the gas-phase (hereafter ; \ceC2H and HCN) at , 0.3, 1 Myr, and 3 Myr. For comparisons, we ran an additional static model, where grain surface chemistry, except for desorption and adsorption processes, was turned off (i.e., there is no depletion of carbon, oxygen, and nitrogen in the warm molecular layers). The molecular column densities predicted by this additional model at 1 Myr is shown by black dashed lines in the figure.
The column densities of CO and \ceHCO+ decrease with time, reflecting the gradual loss of CO from the warm molecular layer via the combination of the chemical conversion of CO and the vertical cold finger effect. The \ceN2 column density decreases with time at 50 au, due to the vertical cold finger effect only. The column density of \ceN2 is larger than that of CO, indicating that \ceN2 is the second most abundant molecule in the gas-phase. The column densities of \ceN2 decrease with time, whereas the \ceN2H+ column density increases slightly with time rather than decreased. As \ceN2H+ is destroyed by CO, the decrease of the gas-phase CO abundance leads to the enhanced \ceN2H+ abundance (e.g., Aikawa et al., 2015), canceling the decrease of the gas-phase \ceN2 abundance. As a result, the column density ratio of CO to \ceN2H+ increases with time at least until 3 Myr. This result may be consistent with the observations by Anderson et al. (2019), who found that the \ceN2H+/CO flux ratio in 5–11 Myr old disks in Upper Sco is higher than that in younger disks with the age of 2 Myr. Trapman et al. (2022) showed that the combination of \ceC^18O and \ceN2H+ lines is useful to constrain disk gas mass, adopting a static thermal-chemical disk model, assuming that nitrogen is not depleted. Our results do not fully support their assumption on the non-depletion of nitrogen. However, combination of \ceC^18O and \ceN2H+ lines would be useful to constrain the disk gas mass, because the carbon depletion is more significant than the nitrogen depletion, and thus the \ceN2H+/CO ratio can be used as a probe of the carbon (CO) depletion.
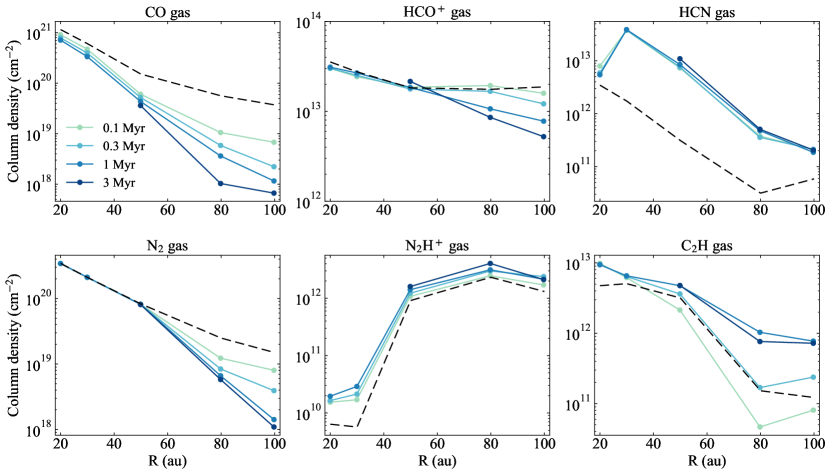
C2H is considered as a prove of , because its abundance depends on whether is higher than unity or not (e.g., Bergin et al., 2016; Miotello et al., 2017; Bosman et al., 2021b). In our full model, the \ceC2H column density increases with time by a factor of 10 at most, because becomes close to, but still lower than unity both inside and outside of the CO snowline (see panels e and f of Figure 4). The HCN column density remains almost unchanged with time in our full model. The \ceC2H and HCN column densities in our model (1012–1013 cm-2 and 1011–1013 cm-2, respectively) at 1 Myr are still one or two orders of magnitude lower than that observed in the outer regions (outside of the CO snowline) of Class II disks (Bergin et al., 2016; Bergner et al., 2020a; Guzmán et al., 2021). The underestimation of the \ceC2H and HCN column densities in our model indicates a need for additional process to make higher than unity.
The rationale for both inside and outside of the CO snow line in our model is as follows. Inside the CO snowline, only the oxygen-rich species, \ceH2O and \ceCO2, can freeze out near the midplane. Then, the gas becomes dominated by CO over time, leading to . Outside the CO snowline, there are two CO reservoirs at yr; one is the gas-phase CO in the warm molecular layer and another is the CO ice on small dust grains near the midplane. As CO is assumed to be present in the gas phase at yr, it is preferentially frozen-out onto smaller grains; smaller grains dominate dust cross section, and dust temperature does not depend on the size near the midplane. Some CO ice near the midplane is transported upward, enriching the warm molecular layers in CO. Atomic O and CO in the surface layer are consumed by the \ceCO2 formation at a similar rate, but this enrichment process partially cancels out the CO depletion in the surface layers. As a result, becomes 0.5, but does not exceed unity.
A promising process for enhancing is the destruction of carbon grains by photoablation as proposed by Bosman et al. (2021a). The carbon abundance locked up in refractory carbon dust is , where is the dust-to-gas mass ratio. To enhance considerably (2), the carbon abundance released in the gas phase should be comparable to or larger than the gas-phase carbon abundance. Then the following relation should hold, (Bosman et al., 2021a), assuming complete photoablation of refractory carbon dust. In our model with at 1 Myr, the requirement is satisfied at , even if complete photoablation of carbon grains is assumed. Below , however, stellar UV is significantly attenuated () and/or the dust temperature is too low leading to the freeze-out of gas-phase carbon. Taken together, only very limited regions (–0.2) might be able to become by the photoablation. Even if so, locally high would be smeared out by turbulent mixing in relatively short timescale (e.g., yr at au). Therefore, as noted in Van Clepper et al. (2022), carbon grain destruction may be ongoing over the course of grain growth, rather than solely after the grain growth.
4.4 Comparisons with previous studies
Krijt et al. (2020) studied the depletion of carbon and oxygen combining the dust evolution and grain surface chemistry of carbon and oxygen driven by cosmic rays, but ignored the chemistry driven by stellar UV photons. One of the most significant differences between their study and ours is that they considered the formation of pebbles from small grains in disks, while we assumed that pebbles already exist at the beginning of our simulations. In Krijt et al. (2020), the formation and the vertical settling of pebbles transport \ceH2O ice to the midplane. This process leads to , because CO is much more volatile than \ceH2O. On the other hand, in our models, we assumed that pebbles already exist at yr and the ISM-like elemental abundance throughout the disk (i.e., in the disk upper layers, where \ceH2O is efficiently dissociated by stellar UV photons). As noted in Section 2.3, what happens to water in young disks, where the growth of small dust grains have already started, remains unclear. The model by Krijt et al. (2020) would correspond to the scenario where the sublimation/photodesorption of water ice is negligible, and coagulation and settling of dust covered by water ice cause the depletion of volatile oxygen in the disk upper layers, because their model did not consider the chemistry induced by stellar UV and the disk is cold. Our model corresponds to another extreme scenario where water ice on dust grains are uncovered due to thermal desorption and/or photodesorption of water ice in the disk upper layers, and dust coagulation and settling do not cause the depletion of volatile oxygen in the disk upper layers. Reality would be somewhere between the two extremes, depending on stellar properties and disk physical structures. Note that the oxygen abundance in the disk upper layers would also be related to the photoablation of carbon grain; if the photoablation occurs efficiently during the formation and settling of pebbles, \ceH2O ice, which covers dust grains, would be photodesorbed at the same time.
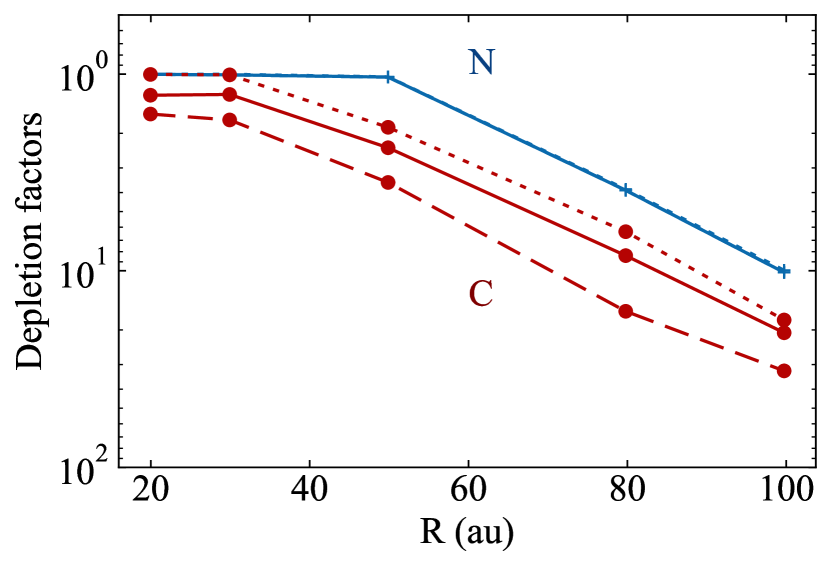
In order to check the impact of elemental oxygen abundance available for the \ceCO2 formation on our results, we reran our full model assuming that the initial \ceH2O abundance scales with the local dust-to-gas mass ratio, i.e., 10. In other words, the initial \ceH2O-to-dust mass ratio is uniform inside the disk. As is 10-3 or lower at (see Fig. 2), the elemental abundance of oxygen not locked up in CO is lower than that in our fiducial models by a factor of 10 or even larger. We confirmed that in the model with the uniform \ceH2O-to-dust mass ratio is between that in the fiducial full model and that in the model without grain surface chemistry (Figure 8). We also confirmed that at 1 Myr is close to unity as in the fiducial full model. Therefore, our qualitative chemical results are not sensitive to the initial oxygen abundance.
Regarding to at 1 Myr or later, our model predicted that becomes larger than the initial value of 0.5, but does not exceed unity. Van Clepper et al. (2022), who combined a toy model of the pebble formation and a gas-ice astrochemical model (but surface chemistry was ignored except for hydrogenation, i.e., the \ceCO2 formation does not occur in their model), also predicted that does not exceed unity. On the other hand, Krijt et al. (2020) predicted that eventually in the warm molecular layers can become larger than unity. The difference in the predicted can be explained by the cosmic-ray driven chemistry versus UV driven chemistry. The rationale why can be realized in Krijt et al. (2020) is that they assumed \ceC+, which is produced by the destruction of CO by \ceHe+, is eventually locked up in \ceCH4, while atomic O is locked up in \ceH2O and/or \ceCO2. As \ceCH4 is more volatile than \ceH2O and \ceCO2, it can be more easily go back to the gas phase and enhance in the warm molecular layer. In the model by Krijt et al. (2020), the effect of stellar UV on chemistry was neglected in contrast to our models. More comprehensive simulation with dust settling, growth, and photoablation with both CR and UV driven chemistry are required for better understanding of the evolution of carbon, nitrogen, and oxygen in protoplanetary disks.
4.5 Ice compositions in the midplane
Although the main topic of this study is the gas-phase elemental abundance in the warm molecular layers, we discuss ice compositions in the disk midplane briefly, because the chemical compositions in the warm molecular layer and those in the midplane are related to each other through the turbulent mixing. We only focus on the most abundant species in the ISM ice and cometary ice, i.e., \ceH2O, CO, and \ceCO2 for C- and O-bearing species, and \ceN2 and \ceNH3 for N-bearing species.
Figure 9 shows the total abundances of selected icy molecules (i.e., the sum of the ice abundances on 8 dust populations) in the disk midplane in the static model (left), in the full model with (middle), and in the full model with (right) at 1 Myr. In the static model, the ice composition in the midplane is mostly determined by the assumed initial compositions and the balance between adsorption and desorption, because the timescale of the chemistry driven by cosmic-rays is longer than 1 Myr for s-1 (e.g., Furuya & Aikawa, 2014). When the turbulent mixing is considered, we see the increases of the \ceH2O, CO, and \ceN2 abundances outside their snowlines by a factor of a few compared to the initial abundances, and the efficient formation of \ceCO2 ice, the abundance of which reaches more than 10 % of the \ceH2O abundance within 1 Myr. Note that \ceCO2 ice is abundantly present in the ISM ice (\ceCO2/\ceH2O 30 %; Boogert et al., 2015), while there is no \ceCO2 at the beginning of our simulations. Therefore, the impact of the vertical mixing on the abundant (10-5 per H) ice molecules in the disk midplane is limited, if ice in disks were inherited from the ISM ice.
On the other hand, if we look at the ice compositions of each dust population, the situation is different. Figure 10 shows radial profiles of abundances of selected icy molecules on small (0.1–0.32 m), middle (3.2–10 m), and large (0.32–1 mm) size dust populations in the full model with . The ice compositions are very different, depending on dust size; for the large dust population, the ice composition is dominated by \ceH2O ice as assumed in the initial conditions. On the other hand, for the small- and middle-sized dust populations, the ice compositions are significantly different from the initial compositions; \ceH2O ice is no longer the most abundant icy species, and the \ceCO2/\ceH2O abundance ratio exceeds unity. In reality, however, dust collision (coagulation and fragmentation) would average the ice mantle compositions and make the difference in the ice mantle compositions of different dust size smaller to some extent. Coupled models with dust coagulation/fragmentation and gas-ice chemistry resolving the dust size distribution are necessary for better understanding the diversity of size-dependent ice compositions.
Laboratory experiments have shown that the surface composition of dust grains affect the threshold fragmentation velocity, and thus the efficiency of collisional growth. In particular for this study, the threshold fragmentation velocity of \ceCO2 ice is lower than that of \ceH2O ice (Musiolik et al., 2016a, b). The composition of the surface of ice mantles in disks would be determined by the thermal and chemical history of icy dust grains from its formation in molecular clouds to the delivery to disks (Drozdovskaya et al., 2016; Furuya et al., 2017), and the chemistry inside disks. Although our models do not track ice layered structure, judging from the efficient formation of \ceCO2 ice, the surface of ice mantles of small- and middle-sized dust outside the CO snowline of disks may be covered by \ceCO2 ice, regardless of the initial surface composition of the ice mantles in disks. Therefore, the depletion of carbon and oxygen in the warm molecular layer may be also important for the dust coagulation/fragmentation in the disk midplane.
5 Summary
We investigated the temporal evolution of elemental abundances of volatile carbon, nitrogen, and oxygen in the warm molecular layer (20 K) of a protoplanetary disk, considering both the vertical cold finger effect and gas-ice chemistry. We developed a one-dimensional model that incorporates dust settling, turbulent diffusion of dust and ices, as well as gas-ice chemistry including the chemistry driven by stellar UV/X-rays and the galactic cosmic rays. Our main findings are summarized as follows.
-
1.
Outside the CO snowline, the elemental abundance of carbon in the warm molecular layer can be reduced by a factor of 10 via the combination of the vertical cold finger effect of CO and the chemical conversion of CO into \ceCO2 driven by stellar UV photons. On the other hand, the gaseous \ceN2, the main nitrogen reservoir in the warm molecular layer, is less processed by the stellar UV driven chemistry, and exists as it is. As the binding energy of \ceN2 is lower than that of CO and \ceCO2, the degree of nitrogen depletion in the warm molecular layer is smaller than that of carbon and oxygen, leading to higher elemental abundance of nitrogen than those of carbon and oxygen.
-
2.
The degree of carbon and nitrogen depletion and the depletion timescale are independent of the assumed cosmic-ray ionization rate, at least, when is less than 10-16 s-1, but depends on the strength of turbulence. In the case when the value for the diffusion coefficient is 10-3, the CO abundance in the warm molecular layers beyond the midplane CO snowline can become lower than the ISM abundance by a factors of 10 within 1 Myr. The CO abundance continues to decrease until at 3 Myr. On the other hand, the \ceN2 abundance reaches steady state within 1 Myr. When , both CO and \ceN2 abundance reaches state state within 1 Myr. When , the depletion factors of carbon and nitrogen are less than a factor of 5 in 1 Myr.
-
3.
As a result of more significant depletion of elemental carbon and oxygen than nitrogen, the \ceN2H+/CO column density ratio increases with time in particular for the outer disk regions (outside the \ceN2 snowline).
-
4.
In our models, elemental carbon-to-oxygen ratio in the gas phase () becomes larger than 0.5, but does not exceed unity both inside and outside of the midplane CO snowline. A promising mechanism for enhancing would be the destruction of carbon grains by photoablation during the course of grain growth (Section 4.3 and 4.4; see also Bosman et al., 2021b; Van Clepper et al., 2022).
-
5.
The compositions of ice mantles at the midplane can be different, depending on dust size. Because the largest dust grains (1 mm in our models) are settled close to the midplane and the surface area per unit gas volume is small, their ice mantle compositions do not change significantly. On the other hand, smaller grains do not preserve their initial ice compositions.
-
6.
The size dependent dust temperature (i.e., larger grains have lower temperatures, assuming the radiative equilibrium) is crucial for the efficiency of the vertical cold finger effect (see the Appendix A in details).
Appendix A Importance of size dependent dust temperature for the vertical cold finger effect
In previous studies of the vertical cold finger effect of CO, the temperature of a dust grain is independent of its size, that is dust grains with different sizes have the same temperature (e.g., Kama et al., 2016; Xu et al., 2017). Here, we show that this assumption can underestimate the impact of the vertical cold finger effect.
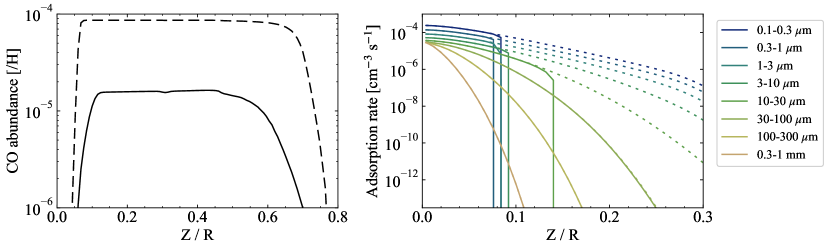
We ran the model without grain surface chemistry (see Section 3.1), employing two different assumptions for the dust temperature of the 8 dust populations. In one model, dust temperature of dust populations are calculated in the same way as in our fiducial model. Consequently, larger dust populations are colder than smaller ones. In another model, all dust populations are assumed to have the same temperature (hereafter single model), and the dust temperature is assumed to be the area-weighted temperature averaged in the range between 0.1 m and 1 mm (i.e., the entire size range in our fiducial models). The left panel of Figure A1 compares the vertical distribution of the gas-phase CO abundance in the two models at au at 1 Myr. The gas-phase CO abundance is much larger (i.e., the efficiency of the vertical cold finger effect is lower) in the single model compared to the fiducial model. As discussed in Kama et al. (2016), in the single model, the ratio of dust cross section contributed by large dust grains which are settled below the CO snow surface to the total dust cross section (denoted as ) is the critical parameter for determining the efficiency of the vertical cold finger effect. If is small, most gas-phase CO adsorb onto small grains. The CO-ice coated small grains can be transported above the CO snow surface by turbulent mixing, and the CO ice can sublimate into the gas phase. Thus the vertical cold finger effect is not efficient. As shown in Fig. 2, the total cross section is dominated by small grains in our model. Then the vertical cold finger effect is not efficient in the single model.
However, in the fiducial model, where smaller grains have higher temperatures, the net adsorption rate (i.e., the adsorption rate of gas-phase CO minus the desorption rate of CO ice) of the large dust grains can be larger than that of the small dust grains, even if (see the right panel of Fig. A1). Then the single model underestimates the efficiency of the vertical cold finger effect.
The vertical cold finger effect was originally introduced by an analogy of the radial cold finger effect (Stevenson & Lunine, 1988; Meijerink et al., 2009). As the dust temperature is essentially the same in the disk midplane irrespective of its size, the size dependent dust temperature discussed here is not relevant for the radial cold finger effect, but is critically important for the vertical cold finger effect.
Appendix B Roles of different sized dust grains in disk chemistry
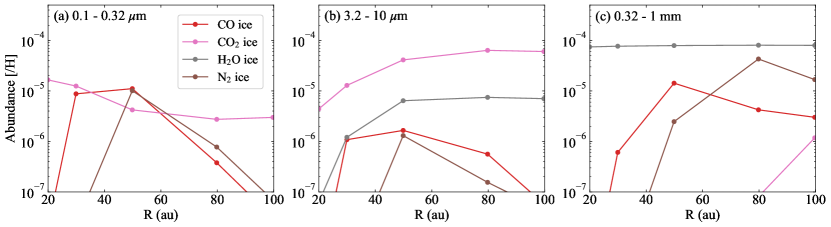
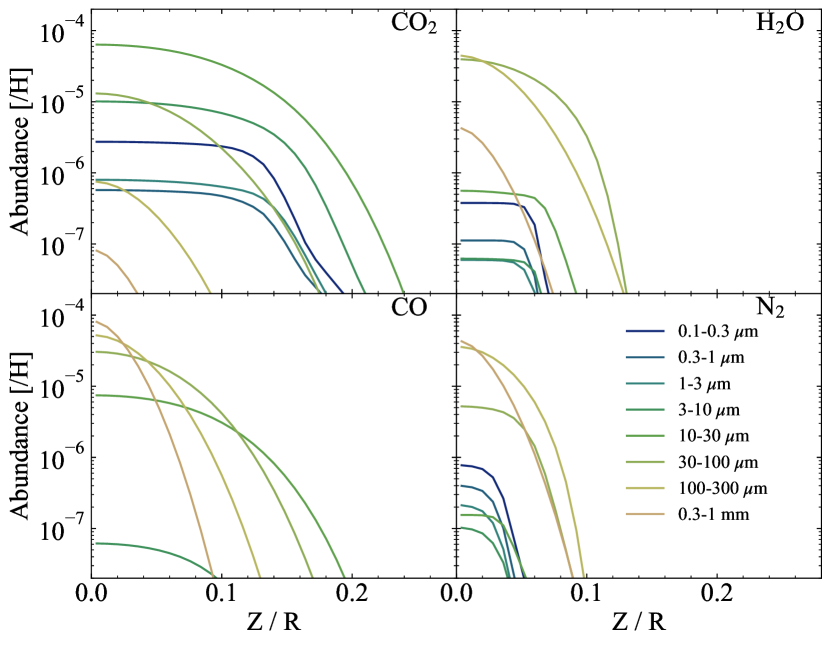
Figures A2 and A3 show the vertical distribution of the abundances of selected icy species on the 8 dust populations at au and au, respectively. At , the formation of \ceCO2 ice occurs mainly on the middle-sized grain populations (10 m), because gas-phase CO preferentially freeze out on those populations at (right panel of Fig. A1), where stellar UV is not fully shielded. Large dust populations (100 m) are dynamically decoupled from the gas, and elements locked up in \ceH2O, CO, and \ceN2 ices on the large dust grains do not contribute to the active chemistry at .
At au, on the other hand, the formation of \ceCO2 ice occurs mainly on small dust populations (1 m or less), because the dust temperatures for all dust populations are too high for the CO freeze-out, and thus dust populations with larger total cross sections (i.e., small populations) are more important for the surface chemistry. Then, the important dust size for \ceCO2 formation depends on the distance from the star. As at au, large dust populations (100 m) are dynamically decoupled from the gas, and oxygen locked up in \ceH2O ice on the large dust grains do not contribute to the chemistry at .
As discussed above, different sized dust grains contribute to the disk chemistry in the different ways. Disk chemical models often adopt the single grain approximation, where gas-ice chemistry is described assuming a single-grain size and temperature (see Gavino et al., 2021, and references therein). It is clear that the disk chemistry with turbulent mixing cannot be represented by models with the single grain approximation. The similar argument was made by Gavino et al. (2021) for the case of static disk chemical models.
Appendix C Parameter dependence
C.1 Cosmic-ray ionization rate
In the models presented in Section 3, the galactic cosmic-ray ionization rate was assumed to be s-1. Here we explore the impact of assumed values of on our results. For this sake, we reran the static model and the full model with s-1. There has been no clear observational evidence of higher value of in disks than that in the dense ISM (10-17 s-1). Cleeves et al. (2015) concluded that the emission lines of \ceHCO+ and \ceN2H+ from the TW Hya disk are best reproduced by the model with low CR ionization rate of s-1. Seifert et al. (2021) concluded that in the inner 100 au regions of the IM Lup disk is s-1 by modeling \ceHCO+ and \ceN2H+ emission, while that in the outer regions is s-1. Aikawa et al. (2021) concluded that s-1 in the disks around IM Lup, AS 209, and HD 163296 on the basis of the comparisons between observationally derived column densities of \ceHCO+, \ceN2H+, and \ceN2D+ and those predicted by a generic disk model (Aikawa et al., 2018). Then the assumed value of s-1 may be considered as an upper limit of in the Class II disk environments.
Figure A4 compares the depletion factors of carbon and nitrogen in the models with s-1 with those in the models with s-1 at 1 Myr. In the static model case, the model with s-1 shows higher depletion factors of carbon and nitrogen in particular inside the CO snowline (30 au) and \ceN2 snowline (50 au), respectively, although the depletion factors are less than 10. This is because the cosmic-ray driven chemistry converts gas-phase CO and gas-phase \ceN2 near the midplane, where stellar UV and X-ray cannot penetrate, into less volatile icy molecules. The timescale of the chemistry () is longer than 1 Myr when s-1, whereas the timescale is the order of 105 yr when s-1 (see Section 4.1). In the full model case, the assumed value of does not significantly affect the depletion factors of carbon and nitrogen, because is larger than and even when s-1. Therefore, we conclude that the cosmic-ray ionization rate is less important for the chemistry of carbon (and nitrogen) depletion in the warm gas (20 K) than had been previously thought, when the dust grains have settled and UV radiation penetrate close to the midplane. However, the cosmic-rays are the important parameter for determining the turbulence state of protoplanetary disks, since they control the ionization rate and the status of the magnetorotational instability (e.g., Sano et al., 2000). Thus the cosmic-rays still indirectly play a key role in the carbon and nitrogen depletion through turbulence.
C.2 Maximum and minimum sizes of dust grains
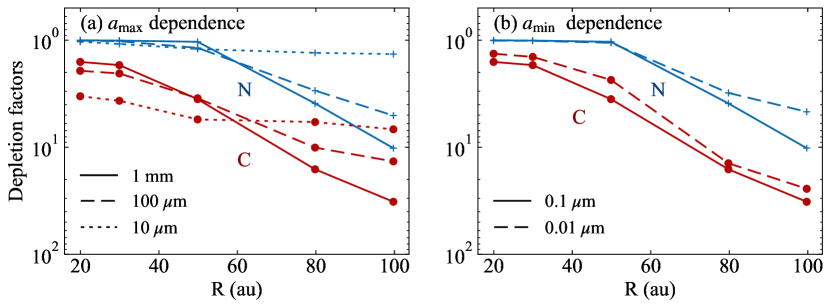
In the models presented in Section 3, the maximum size of dust grains () is fixed to be 1 mm, as often assumed in disk chemical models (e.g., Zhang et al., 2021). On the other hand, (sub)millimeter polarization observations of some disks have suggested that is 100 m (e.g., Kataoka et al., 2016, 2017). Adopting the lower value of affects the degrees of carbon and nitrogen depletion by several reasons. First, the dust temperatures are lowered, and thus the efficiency of the vertical cold finger effect is increased. Second, on the other hand, the relative fraction of the cross section of small dust grain, which are dynamically couple to the gas, to the total dust cross section increases, lowering the efficiency of the vertical cold finger effect. Third, the mass fraction of large dust grains, which are dynamically decoupled from the gas, decreases, leading to larger amount of excess oxygen to convert CO to \ceCO2 ice via the chemistry driven by stellar UV (Section 3.1). Finally, the penetration of stellar UV photons is reduced, and the chemical conversion of CO into the \ceCO2 ice becomes less efficient.
To check the impact of on our results, we recalculated the entire modeling processes (Figure 1) with = 100 m or 10 m as the value of affects the disk physical conditions. As shown in the left panel of Figure A5, the overall trends of the carbon and nitrogen depletion, that is the depletion of carbon is more significant than that of nitrogen, are not sensitive to the choice of , while the values for and are depend on . At au, both and are lowered with reducing . This indicates that the second effect is the most important for the outer regions ( au), assisted by the forth effect in the case for carbon. At au, is enhanced with reducing , while is insensitive to . This result indicates the third effect is the most important at au.
The smallest dust grains (0.1 m) in our models are not fully dynamically coupled with gas (see panel c in Figure 2). To check the impact of the presence of even smaller dust grains, we also recalculated the entire modeling processes with = 0.01 m rather than = 0.1 m. We confirmed that adopting the smaller value of does not affect the depletion factors significantly (right panel of Figure A5).
References
- Aikawa et al. (2018) Aikawa, Y., Furuya, K., Hincelin, U., & Herbst, E. 2018, ApJ, 855, 119, doi: 10.3847/1538-4357/aaad6c
- Aikawa et al. (2015) Aikawa, Y., Furuya, K., Nomura, H., & Qi, C. 2015, ApJ, 807, 120, doi: 10.1088/0004-637X/807/2/120
- Aikawa et al. (2021) Aikawa, Y., Cataldi, G., Yamato, Y., et al. 2021, ApJS, 257, 13, doi: 10.3847/1538-4365/ac143c
- Akimkin et al. (2013) Akimkin, V., Zhukovska, S., Wiebe, D., et al. 2013, ApJ, 766, 8, doi: 10.1088/0004-637X/766/1/8
- Anderson et al. (2019) Anderson, D. E., Blake, G. A., Bergin, E. A., et al. 2019, ApJ, 881, 127, doi: 10.3847/1538-4357/ab2cb5
- Andrews et al. (2012) Andrews, S. M., Wilner, D. J., Hughes, A. M., et al. 2012, ApJ, 744, 162, doi: 10.1088/0004-637X/744/2/162
- Ansdell et al. (2016) Ansdell, M., Williams, J. P., van der Marel, N., et al. 2016, ApJ, 828, 46, doi: 10.3847/0004-637X/828/1/46
- Bai & Goodman (2009) Bai, X.-N., & Goodman, J. 2009, ApJ, 701, 737, doi: 10.1088/0004-637X/701/1/737
- Bergin et al. (2014) Bergin, E. A., Cleeves, L. I., Crockett, N., & Blake, G. A. 2014, Faraday Discussions, 168, 61, doi: 10.1039/C4FD00003J
- Bergin et al. (2016) Bergin, E. A., Du, F., Cleeves, L. I., et al. 2016, ApJ, 831, 101, doi: 10.3847/0004-637X/831/1/101
- Bergin et al. (2013) Bergin, E. A., Cleeves, L. I., Gorti, U., et al. 2013, Nature, 493, 644, doi: 10.1038/nature11805
- Bergner et al. (2020a) Bergner, J. B., Öberg, K. I., Bergin, E. A., et al. 2020a, ApJ, 896, 176, doi: 10.3847/1538-4357/ab98f7
- Bergner et al. (2020b) —. 2020b, ApJ, 898, 97, doi: 10.3847/1538-4357/ab9e71
- Birnstiel et al. (2018) Birnstiel, T., Dullemond, C. P., Zhu, Z., et al. 2018, ApJ, 869, L45, doi: 10.3847/2041-8213/aaf743
- Boogert et al. (2015) Boogert, A. C. A., Gerakines, P. A., & Whittet, D. C. B. 2015, ARA&A, 53, 541, doi: 10.1146/annurev-astro-082214-122348
- Bosman et al. (2021a) Bosman, A. D., Alarcón, F., Zhang, K., & Bergin, E. A. 2021a, ApJ, 910, 3, doi: 10.3847/1538-4357/abe127
- Bosman et al. (2018) Bosman, A. D., Walsh, C., & van Dishoeck, E. F. 2018, A&A, 618, A182, doi: 10.1051/0004-6361/201833497
- Bosman et al. (2021b) Bosman, A. D., Alarcón, F., Bergin, E. A., et al. 2021b, ApJS, 257, 7, doi: 10.3847/1538-4365/ac1435
- Brauer et al. (2008) Brauer, F., Dullemond, C. P., & Henning, T. 2008, A&A, 480, 859, doi: 10.1051/0004-6361:20077759
- Cleeves et al. (2015) Cleeves, L. I., Bergin, E. A., Qi, C., Adams, F. C., & Öberg, K. I. 2015, ApJ, 799, 204, doi: 10.1088/0004-637X/799/2/204
- Cleeves et al. (2018) Cleeves, L. I., Öberg, K. I., Wilner, D. J., et al. 2018, ApJ, 865, 155, doi: 10.3847/1538-4357/aade96
- Dionatos et al. (2019) Dionatos, O., Woitke, P., Güdel, M., et al. 2019, A&A, 625, A66, doi: 10.1051/0004-6361/201832860
- Draine (1978) Draine, B. T. 1978, ApJS, 36, 595, doi: 10.1086/190513
- Draine & Li (2007) Draine, B. T., & Li, A. 2007, ApJ, 657, 810, doi: 10.1086/511055
- Drozdovskaya et al. (2016) Drozdovskaya, M. N., Walsh, C., van Dishoeck, E. F., et al. 2016, MNRAS, 462, 977, doi: 10.1093/mnras/stw1632
- Dullemond & Dominik (2004) Dullemond, C. P., & Dominik, C. 2004, A&A, 421, 1075, doi: 10.1051/0004-6361:20040284
- Dullemond et al. (2012) Dullemond, C. P., Juhasz, A., Pohl, A., et al. 2012, RADMC-3D: A multi-purpose radiative transfer tool. http://ascl.net/1202.015
- Eistrup et al. (2016) Eistrup, C., Walsh, C., & van Dishoeck, E. F. 2016, A&A, 595, A83, doi: 10.1051/0004-6361/201628509
- Favre et al. (2013) Favre, C., Cleeves, L. I., Bergin, E. A., Qi, C., & Blake, G. A. 2013, ApJ, 776, L38, doi: 10.1088/2041-8205/776/2/L38
- Fayolle et al. (2016) Fayolle, E. C., Balfe, J., Loomis, R., et al. 2016, ApJ, 816, L28, doi: 10.3847/2041-8205/816/2/L28
- Flaherty et al. (2020) Flaherty, K., Hughes, A. M., Simon, J. B., et al. 2020, ApJ, 895, 109, doi: 10.3847/1538-4357/ab8cc5
- Flaherty et al. (2018) Flaherty, K. M., Hughes, A. M., Teague, R., et al. 2018, ApJ, 856, 117, doi: 10.3847/1538-4357/aab615
- Flaherty et al. (2017) Flaherty, K. M., Hughes, A. M., Rose, S. C., et al. 2017, ApJ, 843, 150, doi: 10.3847/1538-4357/aa79f9
- Furuya & Aikawa (2014) Furuya, K., & Aikawa, Y. 2014, ApJ, 790, 97, doi: 10.1088/0004-637X/790/2/97
- Furuya et al. (2013) Furuya, K., Aikawa, Y., Nomura, H., Hersant, F., & Wakelam, V. 2013, ApJ, 779, 11, doi: 10.1088/0004-637X/779/1/11
- Furuya et al. (2017) Furuya, K., Drozdovskaya, M. N., Visser, R., et al. 2017, A&A, 599, A40, doi: 10.1051/0004-6361/201629269
- Galametz et al. (2019) Galametz, M., Maury, A. J., Valdivia, V., et al. 2019, A&A, 632, A5, doi: 10.1051/0004-6361/201936342
- Gavino et al. (2021) Gavino, S., Dutrey, A., Wakelam, V., et al. 2021, A&A, 654, A65, doi: 10.1051/0004-6361/202038788
- Geers et al. (2006) Geers, V. C., Augereau, J.-C., Pontoppidan, K. M., et al. 2006, A&A, 459, 545, doi: 10.1051/0004-6361:20064830
- Guzmán et al. (2021) Guzmán, V. V., Bergner, J. B., Law, C. J., et al. 2021, ApJS, 257, 6, doi: 10.3847/1538-4365/ac1440
- Harsono et al. (2018) Harsono, D., Bjerkeli, P., van der Wiel, M. H. D., et al. 2018, Nature Astronomy, 2, 646, doi: 10.1038/s41550-018-0497-x
- Harsono et al. (2020) Harsono, D., Persson, M. V., Ramos, A., et al. 2020, A&A, 636, A26, doi: 10.1051/0004-6361/201935994
- Heays et al. (2017) Heays, A. N., Bosman, A. D., & van Dishoeck, E. F. 2017, A&A, 602, A105, doi: 10.1051/0004-6361/201628742
- Hunter (2007) Hunter, J. D. 2007, Computing in Science & Engineering, 9, 90, doi: 10.1109/MCSE.2007.55
- Igea & Glassgold (1999) Igea, J., & Glassgold, A. E. 1999, ApJ, 518, 848, doi: 10.1086/307302
- Ioppolo et al. (2009) Ioppolo, S., Palumbo, M. E., Baratta, G. A., & Mennella, V. 2009, A&A, 493, 1017, doi: 10.1051/0004-6361:200809769
- Jensen et al. (2019) Jensen, S. S., Jørgensen, J. K., Kristensen, L. E., et al. 2019, A&A, 631, A25, doi: 10.1051/0004-6361/201936012
- Kama et al. (2016) Kama, M., Bruderer, S., van Dishoeck, E. F., et al. 2016, A&A, 592, A83, doi: 10.1051/0004-6361/201526991
- Kataoka et al. (2017) Kataoka, A., Tsukagoshi, T., Pohl, A., et al. 2017, ApJ, 844, L5, doi: 10.3847/2041-8213/aa7e33
- Kataoka et al. (2016) Kataoka, A., Tsukagoshi, T., Momose, M., et al. 2016, ApJ, 831, L12, doi: 10.3847/2041-8205/831/2/L12
- Krijt et al. (2020) Krijt, S., Bosman, A. D., Zhang, K., et al. 2020, ApJ, 899, 134, doi: 10.3847/1538-4357/aba75d
- Krijt et al. (2018) Krijt, S., Schwarz, K. R., Bergin, E. A., & Ciesla, F. J. 2018, ApJ, 864, 78, doi: 10.3847/1538-4357/aad69b
- Lee et al. (2021) Lee, S., Nomura, H., Furuya, K., & Lee, J.-E. 2021, ApJ, 908, 82, doi: 10.3847/1538-4357/abd633
- Li et al. (2013) Li, X., Heays, A. N., Visser, R., et al. 2013, A&A, 555, A14, doi: 10.1051/0004-6361/201220625
- Long et al. (2017) Long, F., Herczeg, G. J., Pascucci, I., et al. 2017, ApJ, 844, 99, doi: 10.3847/1538-4357/aa78fc
- Mawet et al. (2012) Mawet, D., Absil, O., Montagnier, G., et al. 2012, A&A, 544, A131, doi: 10.1051/0004-6361/201219662
- McClure et al. (2016) McClure, M. K., Bergin, E. A., Cleeves, L. I., et al. 2016, ApJ, 831, 167, doi: 10.3847/0004-637X/831/2/167
- Meijerink et al. (2009) Meijerink, R., Pontoppidan, K. M., Blake, G. A., Poelman, D. R., & Dullemond, C. P. 2009, ApJ, 704, 1471, doi: 10.1088/0004-637X/704/2/1471
- Miotello et al. (2014) Miotello, A., Testi, L., Lodato, G., et al. 2014, A&A, 567, A32, doi: 10.1051/0004-6361/201322945
- Miotello et al. (2017) Miotello, A., van Dishoeck, E. F., Williams, J. P., et al. 2017, A&A, 599, A113, doi: 10.1051/0004-6361/201629556
- Miotello et al. (2019) Miotello, A., Facchini, S., van Dishoeck, E. F., et al. 2019, A&A, 631, A69, doi: 10.1051/0004-6361/201935441
- Musiolik et al. (2016a) Musiolik, G., Teiser, J., Jankowski, T., & Wurm, G. 2016a, ApJ, 818, 16, doi: 10.3847/0004-637X/818/1/16
- Musiolik et al. (2016b) —. 2016b, ApJ, 827, 63, doi: 10.3847/0004-637X/827/1/63
- Nakagawa et al. (1981) Nakagawa, Y., Nakazawa, K., & Hayashi, C. 1981, Icarus, 45, 517, doi: 10.1016/0019-1035(81)90018-X
- Nakatani et al. (2020) Nakatani, R., Liu, H. B., Ohashi, S., et al. 2020, ApJ, 895, L2, doi: 10.3847/2041-8213/ab8eaa
- Noble et al. (2011) Noble, J. A., Dulieu, F., Congiu, E., & Fraser, H. J. 2011, ApJ, 735, 121, doi: 10.1088/0004-637X/735/2/121
- Oba et al. (2010) Oba, Y., Watanabe, N., Kouchi, A., Hama, T., & Pirronello, V. 2010, ApJ, 712, L174, doi: 10.1088/2041-8205/712/2/L174
- Öberg & Bergin (2021) Öberg, K. I., & Bergin, E. A. 2021, Phys. Rep., 893, 1, doi: 10.1016/j.physrep.2020.09.004
- Ohashi et al. (2021) Ohashi, S., Kobayashi, H., Nakatani, R., et al. 2021, ApJ, 907, 80, doi: 10.3847/1538-4357/abd0fa
- Persson et al. (2012) Persson, M. V., Jørgensen, J. K., & van Dishoeck, E. F. 2012, A&A, 541, A39, doi: 10.1051/0004-6361/201117917
- Ruaud & Gorti (2019) Ruaud, M., & Gorti, U. 2019, ApJ, 885, 146, doi: 10.3847/1538-4357/ab4996
- Ruaud et al. (2022) Ruaud, M., Gorti, U., & Hollenbach, D. J. 2022, ApJ, 925, 49, doi: 10.3847/1538-4357/ac3826
- Sano et al. (2000) Sano, T., Miyama, S. M., Umebayashi, T., & Nakano, T. 2000, ApJ, 543, 486, doi: 10.1086/317075
- Seifert et al. (2021) Seifert, R. A., Cleeves, L. I., Adams, F. C., & Li, Z.-Y. 2021, ApJ, 912, 136, doi: 10.3847/1538-4357/abf09a
- Semenov & Wiebe (2011) Semenov, D., & Wiebe, D. 2011, ApJS, 196, 25, doi: 10.1088/0067-0049/196/2/25
- Shakura & Sunyaev (1973) Shakura, N. I., & Sunyaev, R. A. 1973, A&A, 500, 33
- Sheehan & Eisner (2018) Sheehan, P. D., & Eisner, J. A. 2018, ApJ, 857, 18, doi: 10.3847/1538-4357/aaae65
- Stevenson & Lunine (1988) Stevenson, D. J., & Lunine, J. I. 1988, Icarus, 75, 146, doi: https://doi.org/10.1016/0019-1035(88)90133-9
- Takeuchi & Lin (2002) Takeuchi, T., & Lin, D. N. C. 2002, ApJ, 581, 1344, doi: 10.1086/344437
- Teague et al. (2016) Teague, R., Guilloteau, S., Semenov, D., et al. 2016, A&A, 592, A49, doi: 10.1051/0004-6361/201628550
- Trapman et al. (2022) Trapman, L., Zhang, K., van ’t Hoff, M. R. L., Hogerheijde, M. R., & Bergin, E. A. 2022, arXiv e-prints, arXiv:2201.09900. https://arxiv.org/abs/2201.09900
- Umebayashi & Nakano (1981) Umebayashi, T., & Nakano, T. 1981, PASJ, 33, 617
- Van Clepper et al. (2022) Van Clepper, E., Bergner, J. B., Bosman, A. D., Bergin, E., & Ciesla, F. J. 2022, ApJ, 927, 206, doi: 10.3847/1538-4357/ac511b
- van ’t Hoff et al. (2020) van ’t Hoff, M. L. R., van Dishoeck, E. F., Jørgensen, J. K., & Calcutt, H. 2020, A&A, 633, A7, doi: 10.1051/0004-6361/201936839
- Vasyunin et al. (2011) Vasyunin, A. I., Wiebe, D. S., Birnstiel, T., et al. 2011, ApJ, 727, 76, doi: 10.1088/0004-637X/727/2/76
- Visser et al. (2009) Visser, R., van Dishoeck, E. F., & Black, J. H. 2009, A&A, 503, 323, doi: 10.1051/0004-6361/200912129
- Watanabe & Kouchi (2002) Watanabe, N., & Kouchi, A. 2002, ApJ, 567, 651, doi: 10.1086/338491
- Weingartner & Draine (2001) Weingartner, J. C., & Draine, B. T. 2001, ApJ, 548, 296, doi: 10.1086/318651
- Willacy (2007) Willacy, K. 2007, ApJ, 660, 441, doi: 10.1086/512796
- Wolf (2003) Wolf, S. 2003, ApJ, 582, 859, doi: 10.1086/344710
- Xu et al. (2017) Xu, R., Bai, X.-N., & Öberg, K. 2017, ApJ, 835, 162, doi: 10.3847/1538-4357/835/2/162
- Youdin & Lithwick (2007) Youdin, A. N., & Lithwick, Y. 2007, Icarus, 192, 588, doi: 10.1016/j.icarus.2007.07.012
- Zhang et al. (2019) Zhang, K., Bergin, E. A., Schwarz, K., Krijt, S., & Ciesla, F. 2019, ApJ, 883, 98, doi: 10.3847/1538-4357/ab38b9
- Zhang et al. (2021) Zhang, K., Booth, A. S., Law, C. J., et al. 2021, ApJS, 257, 5, doi: 10.3847/1538-4365/ac1580
- Zhang et al. (2020) Zhang, K., Schwarz, K. R., & Bergin, E. A. 2020, ApJ, 891, L17, doi: 10.3847/2041-8213/ab7823