Blue monsters. Why are JWST super-early, massive galaxies so blue?
Abstract
The recent JWST tentative discovery of a population of super-early (redshift ), relatively massive (stellar mass ) and evolved (metallicity ) galaxies, which nevertheless show blue () spectra, and very small dust attenuation (), challenges our interpretation of these systems. To solve the puzzle we propose two solutions in which dust is either (a) ejected by radiation pressure, or (b) segregated with respect to UV-emitting regions. We clarify the conditions for which the two scenarios apply, and show that they can be discriminated by ALMA observations, such as the recent non-detection of the 88m dust continuum in GHZ2 () favouring dust ejection.
1 Introduction
The James Webb Space Telescope (JWST) has already unveiled tens of bright (), massive and blue galaxy candidates at unprecedentedly high redshift (, see Santini et al., 2022; Adams et al., 2022; Donnan et al., 2022; Naidu et al., 2022a; Finkelstein et al., 2022; Castellano et al., 2022; Atek et al., 2022; Whitler et al., 2022; Harikane et al., 2022; Furtak et al., 2022). Even more strikingly, Windhorst et al. (2022); Yan et al. (2022) reported the detection of sources potentially located at , some of which show extremely bright . The first spectroscopically confirmed galaxies (4) around have been reported by Robertson et al. (2022). For these sources, the photometric and spectroscopic redshifts only differ by , which is very promising for the numerous other JWST-detected candidates with photometric . The unexpected abundance of such super-early “blue monsters” is challenging the predicting power of standard theoretical models (Dayal et al., 2014, 2022; Behroozi et al., 2020; Mason et al., 2022; Boylan-Kolchin, 2022; Lovell et al., 2022).
Thanks to JWST new data, it has become possible to extend UV Luminosity Function (LF) studies up to . Naidu et al. (2022a); Donnan et al. (2022) find a minimal evolution of the bright-end of the UV LF between and . These results are in contrast with the extrapolation of LFs (Bouwens et al., 2016), which would predict a sharp drop in the number density of sources at .
Such discrepancy can be reconciled in at least two alternative ways. The first solution invokes a much higher star formation efficiency (, Mason et al. 2022; Inayoshi et al. 2022) with respect to lower- systems. This would imply that JWST is probing relatively small, and thus abundant, halos (), featuring surprisingly large stellar masses.
A possibly simpler hypothesis is that galaxies at are essentially unattenuated by dust (Ferrara et al., 2022a). Indeed, a drastic drop in the dust optical depth results in much brighter galaxies, virtually compensating for the lower abundance of their host halos.
As already hinted, most of the observed sources at (Adams et al., 2022; Atek et al., 2022; Castellano et al., 2022; Finkelstein et al., 2022; Naidu et al., 2022a) are characterised by blue UV slopes, in the range . At face value, this evidence supports the hypothesis that early galaxies suffer very little obscuration. Indeed, from the SED-fitting analysis of 15 gravitationally lensed galaxies behind the galaxy cluster SMACS J0723.3-7327, Furtak et al. (2022) found an upper limit to dust attenuation of .
On the other hand, most JWST-detected galaxies appear to be relatively massive (), and metal-enriched as indicated by their (a) blue (), but not ultra blue111A moderately red slope can be produced by either dust attenuation or nebular emission even starting from a metal-free (Pop III), very blue stellar population, see Bouwens et al. (2010). () UV spectral slopes (Topping et al., 2022b; Cullen et al., 2022; Furtak et al., 2022; Naidu et al., 2022a; Finkelstein et al., 2022); (b) low, but not primordial metallicities, (Furtak et al., 2022).
These two sets of evidences seem to point in opposite directions. While from the high stellar mass/moderate metallicity one would expect a consistently high dust content, the extremely low dust optical depth (e.g. ) implies either very low dust content or attenuation.
Here we propose two alternative solutions to reconcile the above tension: (a) dust ejection by radiation pressure, or (b) dust spatial segregation with respect to the UV emitting regions. These two scenarios carry very different implications for the FIR continuum emission that can be tested with ALMA observations.
2 Preliminary considerations
The JWST discovery of a large number of super-early, massive galaxies at represents a theoretical challenge for most structure formation models. A possible solution (Ferrara et al., 2022a) involves an extremely low attenuation of UV light by dust in these systems, that almost exactly compensates for the increasing shortage of their host halos, and keeps their observed abundance constant with redshift.
Importantly, this hypothesis is supported by the surprisingly little attenuation, and frequent blue colors of these objects (Furtak et al., 2022). For example, Maisie’s galaxy at (Finkelstein et al., 2022) has ; SMACS-z12a () has extremely steep UV spectral slope, (Atek et al., 2022). GHZ2 () shows a very blue slope (Castellano et al., 2022; Santini et al., 2022) based on the updated photometry based on the latest NIRCam calibration files; this value is in contrast with the one initially inferred by Bakx et al. (2022) for the same source (there referred to as GL-z13 as in Naidu et al. 2022a) . In the rest of the work we show the predictions obtained for both values of inferred for this source. Even more surprisingly, the galaxy 10234 at (Adams et al., 2022) is the bluest with a that is even reminiscent of peculiar stellar populations222We warn that at least some of these extremely blue values might be spuriously produced by an observational bias, pushing measurements towards artificially blue values for faint sources near the detection threshold (Cullen et al., 2022)..
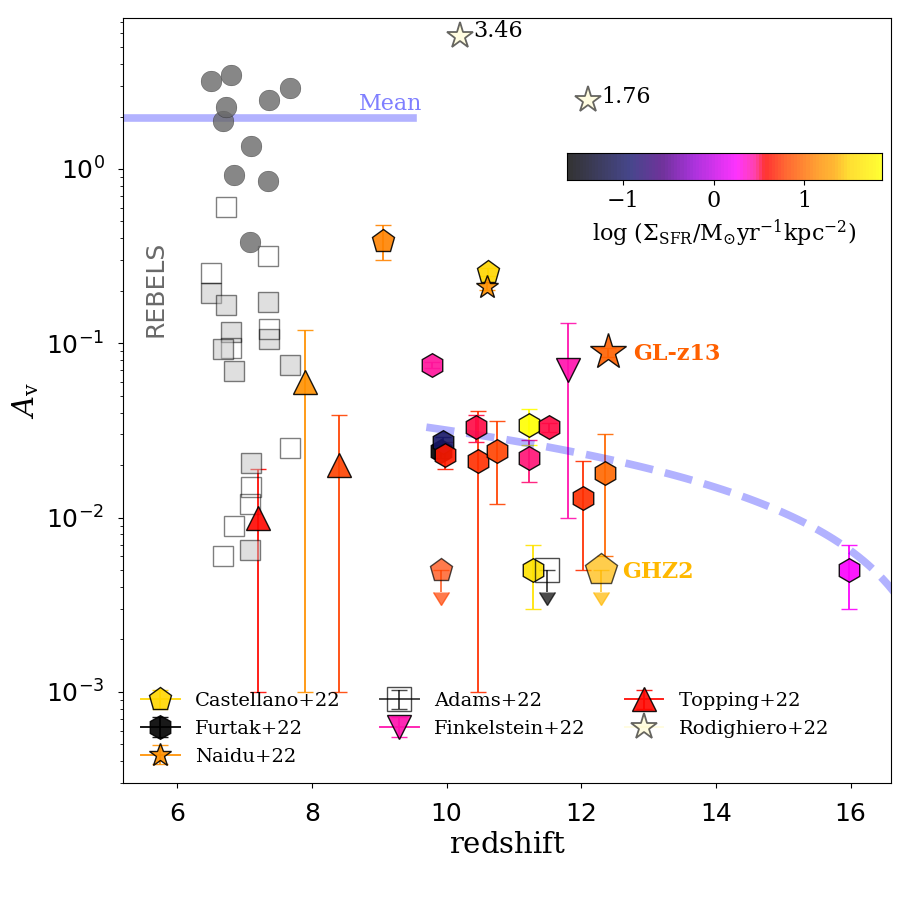
Such decreasing trend of with redshift is clearly seen in Fig. 1, where we have also collected, for comparison, data at from the ALMA Large Program REBELS (Bouwens et al., 2022). Where available, we show obtained from SED fitting (Furtak et al., 2022; Topping et al., 2022a; Finkelstein et al., 2022). For the other sources, we derive the dust attenuation from the observed UV slope using the standard relation (assuming MW dust, Ferrara et al., 2022b), where in the optically-thin limit. We assume an intrinsic UV slope (Reddy et al., 2018); in the few cases where we assign an upper limit for (which corresponds to the lowest value measured in JWST-detected galaxies, see Furtak et al. 2022).
Although a decreasing dust content could be expected at early epochs as a result of the lower cosmic stellar mass333Stars, and in particular SNe (Todini & Ferrara, 2001) are the main dust factories for cosmic ages Gyr. density, (Song et al., 2016), the result remains puzzling.
A simple calculation serves to illustrate the problem. To fix ideas, consider the galaxies GHZ2/GLz13 and GLz11 (Naidu et al., 2022a; Castellano et al., 2022), whose mean stellar mass is . If supernovae (SNe) are produced per stellar mass formed, assuming a Salpeter initial mass function, and each of them yields of dust (Ferrara et al., 2022b), then we would expect a dust mass to be present in the system444Note that this argument neglects dust growth in the interstellar medium. Although likely negligible (Ferrara et al., 2016), the above value then represents a strong lower limit on .. This corresponds to a dust-to-stellar mass ratio of , about a factor larger than in the Milky Way (MW).
By further assuming that % of the baryonic fraction, , of their halos (, Ferrara et al. 2022a) cools in the disk, we find a gas-to-stellar ratio of . This corresponds to a gas fraction , and a dust-to-gas ratio , i.e. 6 times lower than in the MW. As Rémy-Ruyer et al. (2014) have shown that in the range expected for JWST galaxy candidates (Tacchella et al., 2022; Curti et al., 2023), is a reasonable choice. Although uncertain, in the following we will use these values for and as an educated guess for the super-early galaxy population.
Assuming a spherical system with an effective radius , the dust optical depth at 1500Å is
| (1) |
where is the dust extinction cross section, is the proton mass, and is the MW dust-to-gas ratio. Eq. 1 numerically yields
| (2) |
As at these high redshifts kpc for a galaxy with stellar mass (Pallottini et al., 2022; Adams et al., 2022), the above calculations show that we should expect these massive galaxies to be heavily obscured, i.e. . How do we overcome this apparently conflicting result? There are two possibilities that we will explore in sequence in the next two Sections.
The first solution is that the dust produced by the SNe on very short time scales (typically, Myr after the onset of the star formation activity) is ejected into the intergalactic medium at a rate exceeding its production rate. Evacuation can take place, for example, via the strong radiation pressure exerted by the observed UV-emitting stars. Of course, it is necessary to clarify if and under what conditions such process can effectively work.
An alternative explanation involves spatial segregation between the UV-emitting regions and the dust. This UV-dust continuum displacement is relatively common in lower redshift () galaxies, as shown by a number of observations and models (Carniani et al., 2018; Bowler et al., 2018; Cochrane et al., 2019; Zanella et al., 2021; Inami et al., 2022). In this case the freshly produced dust remains in the system, but it only marginally attenuates the UV light emitted by stars.
Remarkably, these two scenarios make distinct predictions concerning the dust continuum luminosity of the JWST-detected galaxies typically measured at 158 m restframe wavelength. While ejection entails a very low flux, due to the lack of significant amounts of dust in the galaxy, the spatial segregation scenario predicts that these systems might be noticeable FIR emitters. In the following we quantify these statements and provide further arguments.
3 Dust ejection scenario
We explore the possibility that dust is ejected via a galactic outflow driven by UV radiation pressure on grains555We assume perfect dynamical coupling between dust and gas., assuming a disk galaxy. The radiation pressure is given by
| (3) |
where is the speed of light. Following Ferrara et al. (2019), we write the bolometric flux666This expression is valid for a stellar population with a Salpeter IMF, at age of 10 Myr. (erg cm-2 s-1) as 777This relation implies a number of ionizing photons per unit SFR, , obtained from the population synthesis code STARBURST99 by assuming an average age of , and a standard Salpeter IMF. In the metallicity range discussed in Sec. 2, can vary within a factor ., where is the disk star formation rate (SFR) per unit area. The gravitational pressure of the gas at the disk mid-plane is instead
| (4) |
where is the gravitational constant, and is the gas surface density.
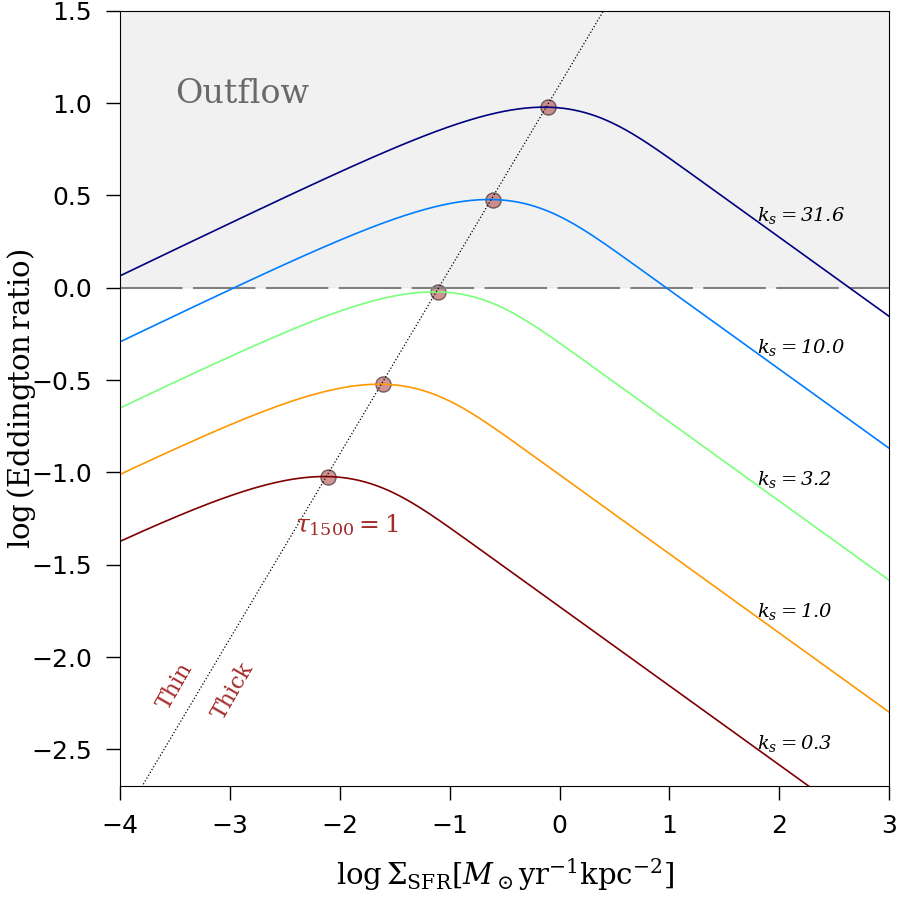
To drive an outflow, the radiation pressure must overcome the gravity pressure. By imposing that the Eddington ratio, , we then derive the necessary condition for an outflow to develop as a function of , and burstiness parameter, , implicitly defined (Ferrara et al., 2019) by the following expression:
| (5) |
Physically, quantifies deviations from the local (Heiderman et al., 2010) Kennicutt-Schmidt relation.
The behavior of with for various values is shown in Fig. 2. The grey area identifies the region of the parameter space in which an outflow is expected (). Independently of , there is a limiting value, , below which outflows cannot be launched. This is obtained by imposing , and solving for and . A solution always exists for ; below that threshold, no solution can be found.
The trend of the Eddington ratio can be understood as follows. In the optically thin regime, ; hence , having used the KS relation (eq. 5). In the optically thick regime (), it is instead . Thus, has a maximum located at , depicted by the red dots in Fig. 2.
The condition is not sufficient to guarantee that dust is fully evacuated. To complete the dust clearing process, the dust ejection rate must exceed the dust production rate . In the super-Eddington regime (), the radiation pressure accelerates the gas to a velocity (perpendicular to the disk) given by momentum conservation:
| (7) |
The gas velocity at the disk scale height is then
| (8) |
with a gas outflow rate, , given by
| (9) |
while the gas scale height can be expressed as
| (10) |
where is the turbulent r.m.s. velocity dispersion, which is related to the SFR by , with , representing the rotational frequency of a galaxy hosted by a dark matter halo of mass (Ferrara, in prep.).
Finally, is the total (gas+stars) mass surface density. By combining the last two expressions we obtain the dust ejection rate888As , the normalization of the curves in Fig. 3 may vary by a factor due to uncertainties in metallicity measurements.
| (11) |
The dust production rate can be derived from the SFR surface density as:
| (12) |
In principle, two mechanisms can destroy dust. These are: (a) destruction by the reverse shock processing the SN ejecta; (b) destruction of pre-existing ISM dust by the SN shock. We implicitly account for (a) by adopting a dust net yield/SN of , corresponding to the destruction of % of the dust freshly produced by the SN (Matsuura et al., 2019; Leśniewska & Michałowski, 2019; Slavin et al., 2020). For simplicity, however, we do not include the effects of (b). Neglecting this effect is a conservative assumption, as adding ISM dust destruction would result in a lower threshold for the dust clearing regime. Also, dust destruction due to thermal sputtering is inefficient at K. As it is likely that only a small fraction of the galaxy volume is filled with hotter gas, this effect is expected to be small, as indeed recently found by Nath et al. (2022).
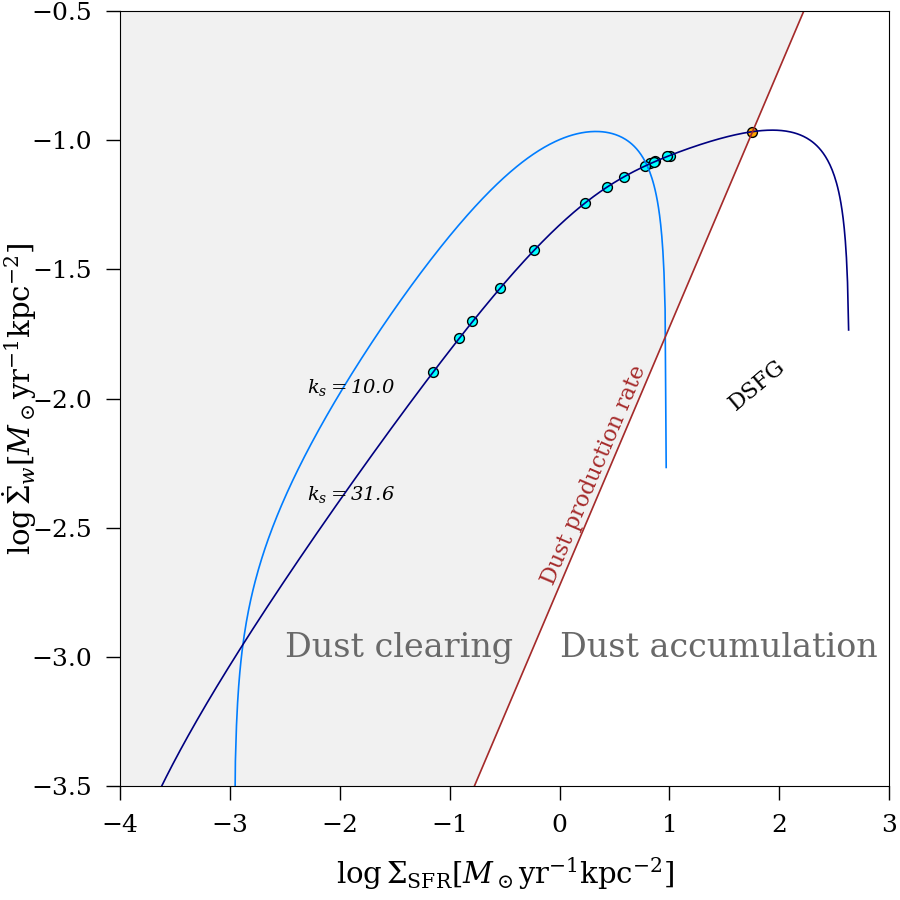
Fig. 3 shows the outflow rate as a function of . The blue (purple) curve represents the case (). The dust production rate (red curve) separates the two regimes of dust clearing and dust accumulation. In the clearing region (grey shaded area) the dust ejection rate overcomes its production rate, and dust is efficiently evacuated into the circumgalactic medium. Outside that region, dust ejection becomes inefficient, and dust accumulates in the galaxy.
The majority () of JWST super-early sources show a very blue () UV slope, which might result from dust ejection. As we have seen, ejection requires specific conditions highlighted in Fig. 2 which might not be met by all high- galaxies. Rodighiero et al. (2022) studied a sample of very red galaxies () which are detected in the F444 band, but missed in F200. Remarkably, they find two strongly dust-attenuated galaxies at , thus confirming that dust accumulation is active also at these very early epochs. We warn that the identification of the observed break as a standard Lyman-break can be misintepreted as dusty star-forming lower redshift () interlopers999Naidu et al. (2022b) and Zavala et al. (2022) presented similar cases in which an extremely high redshift () candidate has a second interpretation with a lower redshift () solution..
4 Dust spatial segregation scenario
We now discuss an alternative scenario to explain the low observed in galaxies, which involves the “spatial segregation” of stellar (optical-to-UV) and dust continuum (infrared, IR) emitting regions (Behrens et al., 2018; Sommovigo et al., 2020, 2022; Ferrara et al., 2022b; Pallottini et al., 2022; Dayal et al., 2022). In this scenario, the UV radiation mostly comes from the transparent diffuse interstellar medium (ISM), hosting either little or cold dust. The dust-obscured SFR is instead located in giant molecular clouds (GMCs), strongly emitting at IR wavelengths.
Ferrara et al. (2022b) introduced a quantitative measure of the ISM morphology of the ISM, the molecular index . This is defined as:
| (13) |
where () is the monochromatic flux at rest-frame (). For a single zone, optically-thin ISM, Ferrara et al. (2022b) obtains an analytical expression for which shows a maximum101010The presence of a maximum value for in an optically-thin medium has a straightforward physical explanation. , and thus , can be increased by raising either the dust temperature, , or mass, . However, increasing requires a larger , which is excluded in an optically-thin medium. Raising while keeping low is possible, but it implies pushing progressively closer to the CMB temperature. This prevents , and thus , to increase indefinitely. Hence, values can only be attained in a multi-phase ISM, where UV and IR emission are essentially decoupled. This is the case of spatially-segregated sources. at .
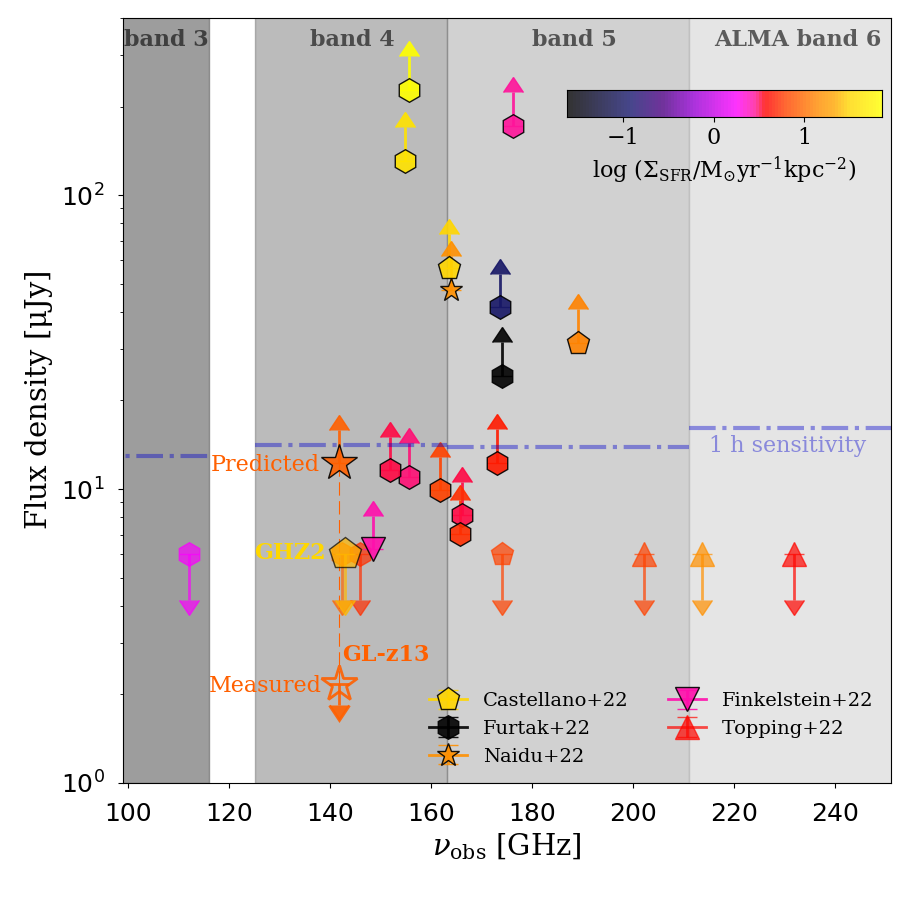
Under the assumption that the nearly dust-unattenuated super-early galaxies observed with JWST are spatially segregated systems (), we can make a testable prediction on their . Inverting eq. 13, from the observed we infer a lower limit to their . This is shown in Fig. 4. Thanks to the very high- of the considered sources, their rest-frame continuum emission is redshifted at wavelengths, traced by the sensitive ( in 1 hr of observation) ALMA bands 3, 4, 5 and 6. We predict for all of the considered sources with ; thus, few hours of observations with ALMA would suffice to test the validity of the spatially segregated scenario. This is a noticeable example of the leap forward in terms of high- galaxies characterisation that will soon be possible thanks to ALMA and JWST synergy. For the sources where the inferred UV slope is bluer than the assumed intrinsic one, the previously described method to predict cannot be applied. In these cases, however, we do expect an extremely low dust content, and thus negligible FIR emission, consistent with the dust ejection scenario.
Bakx et al. (2022) and Popping (2022) performed deep spectroscopic and continuum ALMA observation of the galaxy GHZ2/GL-z13 (Castellano et al., 2022; Naidu et al., 2022a), searching for [O ] line emission at rest-frame (see also Fujimoto et al. 2022; Kaasinen et al. 2022; Yoon et al. 2022). They fail to detect the dust continuum emission from this source, obtaining a upper limit of .
Assuming a dust temperature of , we can rescale this value to obtain an upper limit on the continuum flux at , (open orange star in Fig. 4). Such value is smaller than the lower limit (, orange star in Fig. 4) we predict for this source when considering (Bakx et al., 2022). We note that if we consider the most extreme inferred by Castellano et al. (2022); Santini et al. (2022) for this same source, we can only provide a qualitative upper limit on , which is consistent with the ALMA non-detection. We interpret this result as an indication that this galaxy is dust-cleared by an outflow.
As a final remark, the spatially segregated, multi-phase ISM scenario is also disfavoured by the very compact size of GHZ2/GL-z13 (, Bakx et al. 2022). Further ALMA observations of the other super-early galaxies will make our prediction more robust.
5 Summary and discussion
To explain the puzzling evidence reported by JWST Early Release Science surveys for “blue monsters”, i.e. super-early (), massive galaxies showing very blue spectra () and dust attenuation (), we have proposed two distinct scenarios.
Dust ejection. In the first scenario, is small as a major fraction of the dust content is ejected from the galaxy by UV radiation pressure produced by newly born, massive stars. This process requires that the galaxy is in a starburst phase (), and that the dust ejection rate exceeds its production one by SN. Such condition is shown in Fig. 3. Galaxies with very large SFR surface density can instead accumulate dust and become significantly obscured, perhaps explaining the recent detection of galaxies in the same JWST data (Rodighiero et al., 2022).
Dust spatial segregation. The alternative scenario involves a spatial segregation of dust (mostly located in opaque GMCs) with respect to transparent UV-emitting regions. This scenario can explain the blue spectra colors, and at the same time it makes it possible to predict the FIR continuum emission from these sources using eq. 13, once the slope is known.
Although both scenarios provide a physical explanation for the blue colors of the observed galaxies, they make distinct prediction concerning the FIR dust continuum flux observed by e.g. ALMA. If most of the dust is ejected in the circumgalactic medium, both its density and temperature drop dramatically, making its detection virtually impossible. On the other hand, the segregation scenario should result in (rest-frame) 158 m fluxes Jy for most sources, which are detectable by ALMA in bands 3, 4, 5, and 6 in a few hours.
Recently, Bakx et al. (2022); Popping (2022) reported results from continuum ALMA observations towards GHZ2, one of the brightest and most robust candidates at , identified in the GLASS-JWST Early Release Science Program (Treu et al., 2022). They obtained an upper limit for the flux at (restframe) 88 m flux of Jy. This non-detection favours the ejection scenario, and it implies a stringent upper limit on the dust mass , assuming a dust temperature of 50 K.
If the dust is indeed efficiently ejected during the starburst phase of (some of) the super-early galaxies, such outflow might also carry a significant fraction of the gas to which grains are likely to be tightly dynamically coupled. These galaxies might then also retain a very limited amount of gas. This fact has two important consequences: (a) the escape fraction of ionizing photons could be very high; (b) the production of nebular lines can be highly suppressed. It is then tantalising to interpret the non-detection of [OIII] 88 line in GHZ2/GL-z13 Bakx et al. (2022) in this physical framework (see Kohandel et al. 2022 for a detailed discussion). Noticeably, Kaasinen et al. 2022; Yoon et al. 2022 also attempted at observing the [OIII] 88 line for two JWST galaxy candidates (HD1, GHZ1) without any success.
Data Availability
Data available on request.
References
- Adams et al. (2022) Adams, N. J., Conselice, C. J., Ferreira, L., et al. 2022, arXiv e-prints, arXiv:2207.11217. https://arxiv.org/abs/2207.11217
- Atek et al. (2022) Atek, H., Shuntov, M., Furtak, L. J., et al. 2022, Revealing Galaxy Candidates out to with JWST Observations of the Lensing Cluster SMACS0723, arXiv, doi: 10.48550/ARXIV.2207.12338
- Bakx et al. (2022) Bakx, T. J. L. C., Zavala, J. A., Mitsuhashi, I., et al. 2022, arXiv e-prints, arXiv:2208.13642. https://arxiv.org/abs/2208.13642
- Behrens et al. (2018) Behrens, C., Pallottini, A., Ferrara, A., Gallerani, S., & Vallini, L. 2018, MNRAS, 477, 552, doi: 10.1093/mnras/sty552
- Behroozi et al. (2020) Behroozi, P., Conroy, C., Wechsler, R. H., et al. 2020, MNRAS, 499, 5702, doi: 10.1093/mnras/staa3164
- Bouwens et al. (2010) Bouwens, R. J., Illingworth, G. D., Oesch, P. A., et al. 2010, ApJ, 708, L69, doi: 10.1088/2041-8205/708/2/L69
- Bouwens et al. (2016) Bouwens, R. J., Oesch, P. A., Labbé, I., et al. 2016, ApJ, 830, 67, doi: 10.3847/0004-637X/830/2/67
- Bouwens et al. (2022) Bouwens, R. J., Smit, R., Schouws, S., et al. 2022, ApJ, 931, 160, doi: 10.3847/1538-4357/ac5a4a
- Bowler et al. (2018) Bowler, R. A. A., Bourne, N., Dunlop, J. S., McLure, R. J., & McLeod, D. J. 2018, MNRAS, 481, 1631, doi: 10.1093/mnras/sty2368
- Boylan-Kolchin (2022) Boylan-Kolchin, M. 2022, arXiv e-prints, arXiv:2208.01611. https://arxiv.org/abs/2208.01611
- Carniani et al. (2018) Carniani, S., Maiolino, R., Amorin, R., et al. 2018, MNRAS, 478, 1170, doi: 10.1093/mnras/sty1088
- Castellano et al. (2022) Castellano, M., Fontana, A., Treu, T., et al. 2022, arXiv e-prints, arXiv:2207.09436. https://arxiv.org/abs/2207.09436
- Cochrane et al. (2019) Cochrane, R. K., Hayward, C. C., Anglés-Alcázar, D., et al. 2019, MNRAS, 488, 1779, doi: 10.1093/mnras/stz1736
- Cullen et al. (2022) Cullen, F., McLure, R. J., McLeod, D. J., et al. 2022, arXiv e-prints, arXiv:2208.04914. https://arxiv.org/abs/2208.04914
- Curti et al. (2023) Curti, M., D’Eugenio, F., Carniani, S., et al. 2023, MNRAS, 518, 425, doi: 10.1093/mnras/stac2737
- Dayal et al. (2014) Dayal, P., Ferrara, A., Dunlop, J. S., & Pacucci, F. 2014, MNRAS, 445, 2545, doi: 10.1093/mnras/stu1848
- Dayal et al. (2022) Dayal, P., Ferrara, A., Sommovigo, L., et al. 2022, MNRAS, 512, 989, doi: 10.1093/mnras/stac537
- Donnan et al. (2022) Donnan, C. T., McLeod, D. J., Dunlop, J. S., et al. 2022, The evolution of the galaxy UV luminosity function at redshifts z 8-15 from deep JWST and ground-based near-infrared imaging, arXiv, doi: 10.48550/ARXIV.2207.12356
- Ferrara et al. (2022a) Ferrara, A., Pallottini, A., & Dayal, P. 2022a, On the stunning abundance of super-early, massive galaxies revealed by JWST, arXiv, doi: 10.48550/ARXIV.2208.00720
- Ferrara et al. (2019) Ferrara, A., Vallini, L., Pallottini, A., et al. 2019, MNRAS, 489, 1, doi: 10.1093/mnras/stz2031
- Ferrara et al. (2016) Ferrara, A., Viti, S., & Ceccarelli, C. 2016, MNRAS, 463, L112, doi: 10.1093/mnrasl/slw165
- Ferrara et al. (2022b) Ferrara, A., Sommovigo, L., Dayal, P., et al. 2022b, MNRAS, 512, 58, doi: 10.1093/mnras/stac460
- Finkelstein et al. (2022) Finkelstein, S. L., Bagley, M. B., Arrabal Haro, P., et al. 2022, arXiv e-prints, arXiv:2207.12474. https://arxiv.org/abs/2207.12474
- Fujimoto et al. (2022) Fujimoto, S., Finkelstein, S. L., Burgarella, D., et al. 2022, ALMA FIR View of Ultra High-redshift Galaxy Candidates at 11-17: Blue Monsters or Low- Red Interlopers?, arXiv, doi: 10.48550/ARXIV.2211.03896
- Furtak et al. (2022) Furtak, L. J., Shuntov, M., Atek, H., et al. 2022, arXiv e-prints, arXiv:2208.05473. https://arxiv.org/abs/2208.05473
- Harikane et al. (2022) Harikane, Y., Ouchi, M., Oguri, M., et al. 2022, arXiv e-prints, arXiv:2208.01612. https://arxiv.org/abs/2208.01612
- Heiderman et al. (2010) Heiderman, A., Evans, II, N. J., Allen, L. E., Huard, T., & Heyer, M. 2010, ApJ, 723, 1019, doi: 10.1088/0004-637X/723/2/1019
- Hunter (2007) Hunter, J. D. 2007, Computing in Science and Engineering, 9, 90, doi: 10.1109/MCSE.2007.55
- Inami et al. (2022) Inami, H., Algera, H., Schouws, S., et al. 2022, MNRAS, doi: 10.1093/mnras/stac1779
- Inayoshi et al. (2022) Inayoshi, K., Harikane, Y., Inoue, A. K., Li, W., & Ho, L. C. 2022, A Lower Bound of Star Formation Activity in Ultra-high Redshift Galaxies Detected with JWST: Implications for Stellar Populations and Radiation Sources, arXiv, doi: 10.48550/ARXIV.2208.06872
- Kaasinen et al. (2022) Kaasinen, M., van Marrewijk, J., Popping, G., et al. 2022, To See or Not to See a Galaxy? That is the Question, arXiv, doi: 10.48550/ARXIV.2210.03754
- Kohandel et al. (2022) Kohandel, M., Ferrara, A., Pallottini, A., et al. 2022, arXiv e-prints, arXiv:2212.02519. https://arxiv.org/abs/2212.02519
- Leśniewska & Michałowski (2019) Leśniewska, A., & Michałowski, M. J. 2019, A&A, 624, L13, doi: 10.1051/0004-6361/201935149
- Lovell et al. (2022) Lovell, C. C., Harrison, I., Harikane, Y., Tacchella, S., & Wilkins, S. M. 2022, arXiv e-prints, arXiv:2208.10479. https://arxiv.org/abs/2208.10479
- Mason et al. (2022) Mason, C. A., Trenti, M., & Treu, T. 2022, arXiv e-prints, arXiv:2207.14808. https://arxiv.org/abs/2207.14808
- Matsuura et al. (2019) Matsuura, M., Inserra, C., Meixner, M., et al. 2019, Astro2020: Decadal Survey on Astronomy and Astrophysics, 2020, 573
- Naidu et al. (2022a) Naidu, R. P., Oesch, P. A., van Dokkum, P., et al. 2022a, Two Remarkably Luminous Galaxy Candidates at Revealed by JWST, arXiv, doi: 10.48550/ARXIV.2207.09434
- Naidu et al. (2022b) Naidu, R. P., Oesch, P. A., Setton, D. J., et al. 2022b, arXiv e-prints, arXiv:2208.02794. https://arxiv.org/abs/2208.02794
- Nath et al. (2022) Nath, B. B., Vasiliev, E. O., Drozdov, S. A., & Shchekinov, Y. A. 2022, arXiv e-prints, arXiv:2211.12378. https://arxiv.org/abs/2211.12378
- Pallottini et al. (2022) Pallottini, A., Ferrara, A., Gallerani, S., et al. 2022, MNRAS, 513, 5621, doi: 10.1093/mnras/stac1281
- Popping (2022) Popping, G. 2022, arXiv e-prints, arXiv:2208.13072. https://arxiv.org/abs/2208.13072
- Reddy et al. (2018) Reddy, N. A., Oesch, P. A., Bouwens, R. J., et al. 2018, ApJ, 853, 56, doi: 10.3847/1538-4357/aaa3e7
- Rémy-Ruyer et al. (2014) Rémy-Ruyer, A., Madden, S. C., Galliano, F., et al. 2014, A&A, 563, A31, doi: 10.1051/0004-6361/201322803
- Robertson et al. (2022) Robertson, B. E., Tacchella, S., Johnson, B. D., et al. 2022, Discovery and properties of the earliest galaxies with confirmed distances, arXiv, doi: 10.48550/ARXIV.2212.04480
- Rodighiero et al. (2022) Rodighiero, G., Bisigello, L., Iani, E., et al. 2022, arXiv e-prints, arXiv:2208.02825. https://arxiv.org/abs/2208.02825
- Santini et al. (2022) Santini, P., Fontana, A., Castellano, M., et al. 2022, arXiv e-prints, arXiv:2207.11379. https://arxiv.org/abs/2207.11379
- Slavin et al. (2020) Slavin, J. D., Dwek, E., Mac Low, M.-M., & Hill, A. S. 2020, ApJ, 902, 135, doi: 10.3847/1538-4357/abb5a4
- Sommovigo et al. (2020) Sommovigo, L., Ferrara, A., Pallottini, A., et al. 2020, MNRAS, 497, 956, doi: 10.1093/mnras/staa1959
- Sommovigo et al. (2022) Sommovigo, L., Ferrara, A., Carniani, S., et al. 2022, 0, 0
- Song et al. (2016) Song, M., Finkelstein, S. L., Ashby, M. L. N., et al. 2016, ApJ, 825, 5, doi: 10.3847/0004-637X/825/1/5
- Tacchella et al. (2022) Tacchella, S., Johnson, B. D., Robertson, B. E., et al. 2022, arXiv e-prints, arXiv:2208.03281. https://arxiv.org/abs/2208.03281
- Todini & Ferrara (2001) Todini, P., & Ferrara, A. 2001, MNRAS, 325, 726, doi: 10.1046/j.1365-8711.2001.04486.x
- Topping et al. (2022a) Topping, M. W., Stark, D. P., Endsley, R., et al. 2022a, arXiv e-prints, arXiv:2208.01610. https://arxiv.org/abs/2208.01610
- Topping et al. (2022b) —. 2022b, arXiv e-prints, arXiv:2203.07392. https://arxiv.org/abs/2203.07392
- Treu et al. (2022) Treu, T., Roberts-Borsani, G., Bradac, M., et al. 2022, ApJ, 935, 110, doi: 10.3847/1538-4357/ac8158
- Whitler et al. (2022) Whitler, L., Endsley, R., Stark, D. P., et al. 2022, arXiv e-prints, arXiv:2208.01599. https://arxiv.org/abs/2208.01599
- Windhorst et al. (2022) Windhorst, R. A., Cohen, S. H., Jansen, R. A., et al. 2022, arXiv e-prints, arXiv:2209.04119. https://arxiv.org/abs/2209.04119
- Yan et al. (2022) Yan, H., Cohen, S. H., Windhorst, R. A., et al. 2022, arXiv e-prints, arXiv:2209.04092. https://arxiv.org/abs/2209.04092
- Yoon et al. (2022) Yoon, I., Carilli, C. L., Fujimoto, S., et al. 2022, ALMA Observation of a Galaxy Candidate Discovered with JWST, arXiv, doi: 10.48550/ARXIV.2210.08413
- Zanella et al. (2021) Zanella, A., Pallottini, A., Ferrara, A., et al. 2021, MNRAS, 500, 118, doi: 10.1093/mnras/staa2776
- Zavala et al. (2022) Zavala, J. A., Buat, V., Casey, C. M., et al. 2022, arXiv e-prints, arXiv:2208.01816. https://arxiv.org/abs/2208.01816