How to Find Strong Summary Coherence Measures? A Toolbox and a Comparative Study for Summary Coherence Measure Evaluation
Abstract
Automatically evaluating the coherence of summaries is of great significance both to enable cost-efficient summarizer evaluation and as a tool for improving coherence by selecting high-scoring candidate summaries. While many different approaches have been suggested to model summary coherence, they are often evaluated using disparate datasets and metrics. This makes it difficult to understand their relative performance and identify ways forward towards better summary coherence modelling. In this work, we conduct a large-scale investigation of various methods for summary coherence modelling on an even playing field. Additionally, we introduce two novel analysis measures, intra-system correlation and bias matrices, that help identify biases in coherence measures and provide robustness against system-level confounders. While none of the currently available automatic coherence measures are able to assign reliable coherence scores to system summaries across all evaluation metrics, large-scale language models fine-tuned on self-supervised tasks show promising results, as long as fine-tuning takes into account that they need to generalize across different summary lengths.
1 Introduction
Automatically generated summaries should not only be informative, but also well-written and coherent. While informativeness is routinely evaluated automatically with ROUGE Lin (2004), there is no agreement on how to evaluate summary coherence. However, automatic evaluation is highly desirable to reduce evaluation costs and as a tool for improving summarizer output, e.g. as reranker.
Many coherence measures (CMs) have been suggested for automatically assigning a coherence score to a summary, including learning from human judgements (Barzilay and Lapata, 2008; Tien Nguyen and Joty, 2017; Xenouleas et al., 2019; Mesgar et al., 2021), learning from the shuffle task (Mohiuddin et al., 2021; Jwalapuram et al., 2022), where models are trained to discriminate original documents from documents with randomized sentence order (Barzilay and Lapata, 2008), using next sentence prediction as a proxy task (Koto et al., 2022), and finally unsupervised measures that exploit heuristics (Pitler et al., 2010; Zhu and Bhat, 2020) or large-scale LMs (Yuan et al., 2021). CM performance is then evaluated by comparing the automatic scores to human coherence scores on a set of system summaries.
However, this evaluation is often conducted on disparate datasets. It also often uses system outputs from DUC conferences (Barzilay and Lapata, 2008; Tien Nguyen and Joty, 2017; Xenouleas et al., 2019; Mesgar et al., 2021), which do not necessarily represent recent advances in text summarizers. In addition, there is no agreement on how the CM scores should be compared to human scores. System-level correlation (Xenouleas et al., 2019; Fabbri et al., 2021), pairwise ranking accuracy (Barzilay and Lapata, 2008; Tien Nguyen and Joty, 2017; Mesgar et al., 2021) and summary-level correlation (Yuan et al., 2021) have all been suggested as evaluation metrics (EMs).
This makes it hard to ascertain the state of summary coherence modelling and to identify promising directions for future research. We attack this problem by making the following contributions:
-
•
We show that current EMs provide an incomplete picture of CM performance as they focus on comparing summaries generated by different summarizers, which includes many easy decisions due to the large performance gaps between them. Additionally, they are vulnerable to CMs exploiting confounding system properties to correctly rank systems without modelling coherence.
-
•
We introduce a new EM, intra-system correlation, that measures performance within the summaries generated by a single summarizer and is both more challenging and more resilient against system-level confounders.
-
•
We introduce bias matrices as a novel analysis tool that allow to easily detect when CMs are biased towards specific summarizers.
Using these insights, we conduct a large-scale comparison of CMs on the recent SummEval dataset (Fabbri et al., 2021). We find that:
-
•
All investigated CMs exhibit significant weaknesses under evaluation regimes other than system-level correlation.
-
•
Even relatively strong CMs are biased towards outputs of certain summarizers, which raises concern about their generalizability.
- •
-
•
While most of the shuffle-based models transfer poorly to summaries, which is in line with prior results by Mohiuddin et al. (2021), the most promising performance is achieved by fine-tuning a masked language model (MLM) on the shuffle task as a classifier. We present evidence that this allows the model to adapt more easily to comparing documents of different content and lengths, highlighting a possible avenue for future work.
Code and data for our experiments are available at https://github.com/julmaxi/summary_coherence_evaluation.
2 Related Work
2.1 Coherence Measures for Summarization
Automatic coherence assessment for summarization has been studied in a variety of settings. Barzilay and Lapata (2008) establish summary coherence as an evaluation task to assess CMs similarly to other downstream tasks such as essay scoring (Jeon and Strube, 2020, among others) and readability assessment (Mesgar and Strube, 2015, among others). Specifically, Barzilay and Lapata acquire coherence labels for human and system summaries from DUC 2003111https://duc.nist.gov. The same dataset has been used for evaluating subsequent CMs (Tien Nguyen and Joty, 2017; Mesgar et al., 2021).
As a part of automatic linguistic quality estimation, summary coherence is modelled alongside other aspects of text quality such as grammaticality, with the direct goal of aiding automatic summary evaluation. Approaches include regression models learned from human annotations Xenouleas et al. (2019) as well as unsupervised approaches (Pitler et al., 2010; Zhu and Bhat, 2020; Yuan et al., 2021). Datasets used for evaluation include the recent SummEval dataset (Fabbri et al., 2021), assessor judgements from DUC05-07, and the small-scale manually annotated summaries of newsroom (Grusky et al., 2018). In parallel work, Koto et al. (2022) introduce a coherence measure based on a next sentence prediction task as part of a wider set of measures for summary evaluation that also include focus, coverage and faithfulness. For evaluation, they introduce a novel small-scale dataset based on outputs from BART (Lewis et al., 2020) and the pointer generator model (See et al., 2017). CMs have also been applied in a related setting to improve summarizer quality by explicitly modelling coherence during the summary optimization process (Parveen et al., 2017; Sharma et al., 2019).
Finally, summary coherence is also sometimes modelled using measures that make use of human-written reference summaries (Fabbri et al., 2021; Zhao et al., 2022). We do not focus on these CMs in our evaluation since they are fundamentally less flexible than reference-free CMs, especially when used in non-evaluation contexts such as reranking.
We provide a detailed description of the CMs used in our study in Section 5.
2.2 Meta-Evaluation
In terms of evaluation studies, Mohiuddin et al. (2021) conduct a comparative study of five CMs. Their evaluation is conducted on 10 summaries each from 4 recent summarizers as well as the DUC03 data. Unlike our study, their investigation only encompasses CMs trained via the shuffle task and includes only a small number of summaries.
In concurrent work on assessing system-level correlation, Deutsch et al. (2022) propose to modify correlation computation by focusing on difficult system comparisons only and computing measure scores on a larger set of summaries. Their approaches are complimentary to our analysis in that they look at informativeness instead of coherence and do not address the shortcomings of system-level correlation in the presence of system level confounders. Also concurrently, Durmus et al. (2022) identify spurious correlates in faithfulness datasets, which suggests that our methods might be useful beyond coherence evaluation.
3 Dataset
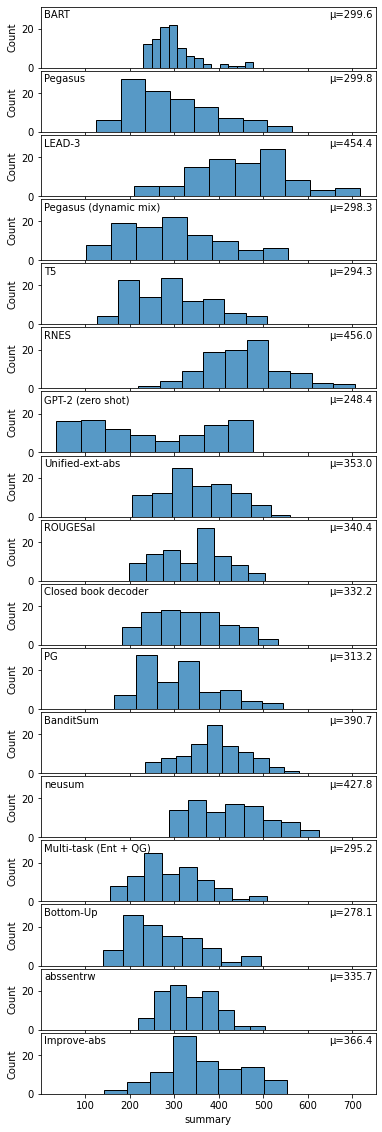
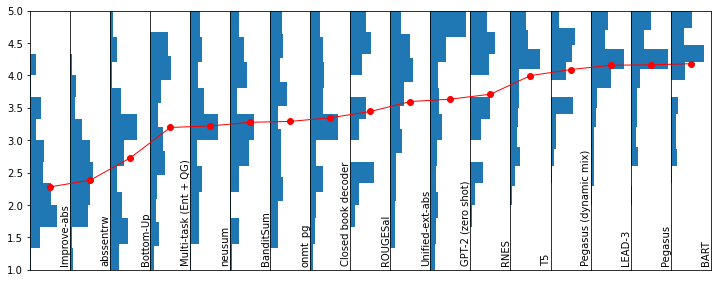
We evaluate CMs on the expert annotations in the SummEval dataset222 https://github.com/Yale-LILY/SummEval Fabbri et al. (2021) which is, to the best of our knowledge, the largest dataset that includes such coherence annotations for a variety of state-of-the-art summarizers. It contains annotations on a 1-5 scale for outputs of 17 systems for 100 documents from the CNN/DM dataset Hermann et al. (2015) by three annotators each. Figure 1 highlights two important properties. Firstly, there is a large gap in average performance between different summarizers, and secondly, most summarizers exhibit considerable variance in scores.
4 Evaluating CMs
CM performance is typically assessed on a set of summaries generated on document set by a set of summarizers using the agreement of predicted scores with human judgements . However, this agreement can be computed in different ways. We identify the following common EMs:
System-level Correlation assesses CM performance by correlating the mean human and mean CM scores of the individual summarizers.
Pairwise Accuracy assesses CM performance by comparing scores on outputs of two different systems on the same document.
Summary-level Correlation compares scores on all generated summaries.
The correlation function used is usually333While Spearmans is also sometimes used (Yuan et al., 2021), the variant we use, -b, is more robust to ties, which are common on the five-point rating scale in SummEval. Kendall’s , while the pairwise metric is usually reported as accuracy. However, we can also define the latter in terms of average over all documents. This is equivalent to accuracy when there are no tied scores, with the only difference being the range shift from to . As both and accuracy are based on pairwise rankings, we can specify all three EMs in terms of the set of pairwise comparisons they consider, where considers comparisons between averaged system scores and consider comparisons between individual summary scores.
The EMs pose different demands to CMs: system-level correlation requires a correct ranking of systems according to their average score. Pairwise accuracy requires correct ranking of summaries from different systems but only between summaries produced on the same document. Finally, summary-level correlation requires the correct ranking of any pair of summaries.
4.1 A new EM: Intra-System Correlation
All three EMs focus on comparisons between summaries generated by different summarizers. For system-level and pairwise evaluation this arises by construction, whereas for summary-level correlation it is contingent on the dataset structure: On SummEval, less than of comparisons for are between summaries of the same summarizer. We argue that this gives an incomplete view of CM performance for the following reasons:
-
1.
SummEval covers summarizers with widely different performance levels (see Figure 1), leading current EMs to include many easy decisions. This is unlikely to reflect real-world evaluation of competitive summarizers.
-
2.
While system-level evaluation is often the primary use case, CMs can also be used in a reranking or ensembling context to select the most coherent summary from a set of candidates. In these situations, summaries are likely to be generated either by a the same summarizer or a set of similarly (high) performing summarization systems. In these cases, system-level EMs offer only limited insight into likely CM performance, since they primarily measure the ability to discriminate between different systems with potentially large performance gaps.
-
3.
EMs might not correlate with coherence per-se but instead with features that happen to identify good summarizers on a particular dataset. Such system-level confounders are unlikely to generalize to new systems and settings. We elaborate on this in Section 4.2.
We thus suggest adding a new EM Intra-system Correlation , which we define on comparisons between summaries generated by the same system. This corresponds to considering the following pairs :
It neatly complements pairwise accuracy, as it is essentially the same computation but keeping the summarizer constant instead of the document. Intuitively, this measure both contains far fewer ”easy” decisions and is much more resilient to any system-level confounders in the data. We use the average of the intra-system correlation of all systems as the correlation measure.
4.2 System-level Confounders
To assess how EMs behave in the presence of system-level confounders, we investigate two summary features that are unlikely to be generalizable CMs but lead to surprisingly strong correlations: Capitalization and summarizer architecture.
For capitalization, we count the number of uppercase letters in each summary. This is a purely system-level heuristics, since only three of the 17 summarizers in SummEval produce capital letters444BART, GPT-2 (zero shot) and Pegasus (dynamic mix). For architecture, we assign a score of 1 to each summary from one of the five summarizers that are derived from pretrained transformers in some fashion555BART, Pegasus, Pegasus dynamic Mix, T5 and GPT-2 and 0 to all others. Neither of the two confounders can, by construction, be a reasonable and generalizable CM. Additionally, we compute an ”upper-bound” (UB) that assigns to each summary the mean human score of the system that produced the summary. It simulates perfect system ranking, but no ability to correctly rank summaries within each system. Since these procedures result in many ties, we also compute a second variant of each confounder where we add small noise to each score. This prevents -b from profiting from these ties, while preventing accuracy from unfairly suffering.
| Cap. | Cap. (r) | Arch. | Arch. (r) | UB | UB (r) | |
|---|---|---|---|---|---|---|
| 0.42 | 0.23 | 0.58 | 0.37 | 1.00 | 1.00 | |
| 0.19 | 0.11 | 0.31 | 0.20 | 0.39 | 0.39 | |
| 0.21 | 0.14 | 0.33 | 0.22 | 0.44 | 0.44 | |
| 0.23 | 0.57 | 0.34 | 0.62 | 0.73 | 0.73 | |
| - | -0.03 | - | 0.01 | - | 0.00 |
Table 1 shows the resulting correlations. Confounders achieve noticeable correlation with human scores. In particular, system-level correlation comes close to or exceeds the best CM reported originally for SummEval (CHRF (Popović, 2017), 0.40). In contrast, using intra-system correlation, the problems of these pseudo-measures become easily apparent. In practical scenarios, system-level correlation might be a mix of modelling coherence and reliance on confounders. Intra-system evaluation is an important tool in this context as it is robust to system-level confounders.
5 Coherence Measures
| EEG | EGR | NEG | UNF | GRA | CCL | SQE | GRU | BAS | |
|---|---|---|---|---|---|---|---|---|---|
| Unsupervised | (a) | ||||||||
| Shuffle | (b) | ||||||||
| Supervised (DUC03) | |||||||||
| Supervised (DUC05-07) |
We identify the following families of reference-free CMs for summarization and include representatives of each in our study: supervised CMs trained on human coherence ratings of summaries, self-supervised CMs trained on the shuffle task and unsupervised CMs. For the supervised setting, we investigate measures trained on data from DUC03 Barzilay and Lapata (2008) as well as the DUC05-07 dataset used by Xenouleas et al. (2019). While the DUC03 dataset is set up as a pairwise ranking dataset, the DUC05-07 dataset is used in a regression setting. Table 2 indicates the configurations available for the different CMs.
The Extended Entity Grid (EEG) Elsner and Charniak (2011) is an extension of the Entity Grid of Barzilay and Lapata (2008). It represents texts using occurrence patterns of the mentioned entities across sentences. The model uses a generative approach that models the probability of an entity appearing in a specific role in a sentence, given its role in the two preceding sentences.
The Entity Graph (EGR) Guinaudeau and Strube (2013) constructs a sentence graph of a document by identifying entity overlap between sentences. Two sentences are connected if they share at least one entity, with edge weights decreasing when they are further apart. The score of a document is the average outdegree of sentences, with higher outdegree indicating better coherence.
The Neural Entity Grid (NEG) Tien Nguyen and Joty (2017) applies a convolutional network to the entity grid. The model is trained on a pairwise ranking loss.
The Unified Model (UNF) Moon et al. (2019) is a lexical CM that uses a convolutional network to build sentence representations from raw text. The model uses an adapted version of the ranking loss for the shuffle task that is computed only for three sentence windows in which shuffled and original documents differ. We use the model based on ELMo Peters et al. (2018), as it performs best in the original paper.
The Graph-based Neural Coherence Model (GRA) Mesgar et al. (2021) is a recent CM that combines entity-based representation with lexical information in a graph NN. Like the previous two models, it employs a pairwise ranking loss.
Recently, Laban et al. (2021) have shown that a RoBERTa-based Liu et al. (2019) classifier can easily achieve near-perfect results on the shuffling task on WSJ. However, they did not test whether this model can predict coherence on non-artificial tasks. We thus include a simple RoBERTa model that is trained to classify shuffled vs. unshuffled summaries, naming it Coherence Classifier (CCL).666We found that the original WSJ-model does not perform well on SummEval. Thus, we retrained our own model, using the same RoBERTA checkpoint as a basis.
SumQE (SQE) Xenouleas et al. (2019) predicts five linguistic quality scores via multi-head regression on human scores. We use the coherence head of the model trained on all three DUC datasets.777https://archive.org/download/sum-qe/BERT_DUC_all_Q5_Multi%20Task-5.h5
GRUEN (GRN) Zhu and Bhat (2020) is a collection of unsupervised measures for linguistic quality that combines multiple unsupervised heuristics.
BARTScore (BAS) Yuan et al. (2021) uses the probability of a summary under a pre-trained BART model as a score. We use the variant fine-tuned on CNN/DM summaries in the source-to-summary configuration, as suggested by the authors.
Finally, we include an upper and lower bound: RND assigns each summary a uniformly chosen score between 0 and 1. For HUM, we use the SummEval human annotations and select the annotator with the worst overall correlation to the remaining annotators and use their scores as predictions.888We note that unlike automatic measures, humans may only differentiate among five classes. We might thus underestimate actual human performance.
We train all shuffling models on the WSJ corpus of newswire articles, which is frequently used in coherence modelling Elsner and Charniak (2011); Guinaudeau and Strube (2013); Moon et al. (2019); Mohiuddin et al. (2021). We also train models using the same technique on reference summaries from the train portion of CNN/DM. For EEG we also estimate model parameters on both datasets. For WSJ, we follow the original implementations regarding the number of shuffled samples. For CNN/DM, we only use a single shuffled instance per summary, as it is larger by two orders of magnitude (WSJ: 1,400; CNN/DM: 287,113 documents before shuffling). Detailed accounts of our experiments with each CM are found in Appendix A.
6 Results
| Metric | Acc.pair | ||||
|---|---|---|---|---|---|
| HUM | +0.75 (+0.70 +0.79) | +0.81 (0.76, 0.85) | +0.81 (+0.77 +0.84) | +0.91 (+0.71 +1.00) | +0.77 (+0.71 +0.81) |
| RND | -0.00 (-0.06 +0.05) | -0.00 (-0.07 +0.06) | +0.00 (-0.05 +0.05) | +0.09 (-0.41 +0.53) | +0.50 (+0.46 +0.54) |
| EGR | -0.04 (-0.12 +0.04) | -0.11 (-0.19, -0.02) | -0.09 (-0.16 -0.01) | -0.25 (-0.59 +0.10) | +0.40 (+0.36 +0.44) |
| EEG C/D | +0.02 (-0.07 +0.10) | +0.04 (-0.10 +0.18) | +0.06 (-0.06 +0.17) | -0.19 (-0.68 +0.26) | +0.52 (+0.45 +0.59) |
| EEG WSJ | +0.02 (-0.06 +0.10) | +0.00 (-0.09 +0.11) | +0.03 (-0.06 +0.11) | -0.19 (-0.60 +0.26) | +0.50 (+0.44 +0.55) |
| NEG C/D | -0.07 (-0.14 -0.00) | -0.05 (-0.14 +0.07) | -0.06 (-0.15 +0.03) | -0.15 (-0.61 +0.32) | +0.47 (+0.42 +0.53) |
| NEG DUC | -0.08 (-0.16 +0.01) | -0.06 (-0.18 +0.06) | -0.07 (-0.17 +0.04) | -0.06 (-0.49 +0.31) | +0.47 (+0.40 +0.53) |
| NEG WSJ | -0.02 (-0.08 +0.05) | -0.08 (-0.17 +0.00) | -0.07 (-0.15 +0.02) | -0.43 (-0.69 -0.05) | +0.45 (+0.41 +0.50) |
| UNF C/D | +0.04 (-0.03 +0.11) | +0.05 (-0.05 +0.14) | +0.06 (-0.01 +0.13) | +0.13 (-0.33 +0.59) | +0.53 (+0.48 +0.57) |
| UNF WSJ | +0.02 (-0.05 +0.09) | -0.11 (-0.26 +0.03) | -0.04 (-0.15 +0.05) | -0.09 (-0.51 +0.39) | +0.44 (+0.36 +0.52) |
| GRA DUC | -0.04 (-0.12 +0.03) | -0.05 (-0.16 +0.03) | -0.06 (-0.13 +0.01) | -0.19 (-0.65 +0.25) | +0.47 (+0.43 +0.52) |
| GRA C/D | +0.08 (+0.02 +0.15) | +0.09 (-0.02 +0.19) | +0.11 (+0.01 +0.18) | +0.37 (-0.07 +0.69) | +0.55 (+0.49 +0.60) |
| GRA WSJ | +0.08 (+0.01 +0.15) | -0.01 (-0.11 +0.10) | +0.02 (-0.06 +0.12) | -0.09 (-0.47 +0.37) | +0.49 (+0.44 +0.55) |
| CCL C/D | +0.26 (+0.19 +0.33) | +0.40 (+0.31 +0.49) | +0.39 (+0.31 +0.44) | +0.62 (+0.30 +0.86) | +0.71 (+0.66 +0.76) |
| CCL WSJ | +0.20 (+0.12 +0.26) | +0.35 (+0.25 +0.46) | +0.33 (+0.24 +0.41) | +0.74 (+0.40 +0.92) | +0.69 (+0.63 +0.74) |
| BAS | +0.17 (+0.08 +0.26) | +0.37 (+0.23 +0.51) | +0.32 (+0.20 +0.42) | +0.72 (+0.42 +0.89) | +0.69 (+0.62 +0.77) |
| GRN | +0.18 (+0.12 +0.25) | +0.26 (+0.17 +0.35) | +0.27 (+0.19 +0.34) | +0.72 (+0.38 +0.89) | +0.63 (+0.58 +0.69) |
| SQE | +0.19 (+0.13 +0.26) | +0.26 (+0.15 +0.36) | +0.24 (+0.15 +0.32) | +0.51 (+0.05 +0.80) | +0.64 (+0.58 +0.69) |
We present the correlation of all CMs with human coherence ratings in Table 3. We report (average) Kendalls for all EMs introduced in Section 4. For we additionally report accuracy. Per-system scores for intra-system correlation can be found in Appendix B.
Focusing on first, we find that CCL, BAS, GRN and to a lesser extent SQE achieve relatively high scores while the remaining CMs fail to outperform even the random baseline. However, inspection of , / and reveals that even these apparently strong CMs struggle to reliably assess coherence of individual summaries, with being the most challenging regime. Comparing CMs, CCL C/D is most promising across all EMs except , where scores are near indistinguishable due to high uncertainty. Interestingly, we find that its advantage is greatest on , where its competitors exhibit particular weakness compared to other EMs. These sharp score drops might suggest other EMs reflect some system-level confounders. In combination with the observation that confounder scores as reported in Table 1 fall within the CI of most CMs on all EMs except this prompts us to investigate CMs for potential biases in the following section.
6.1 Detecting Biases of CMs
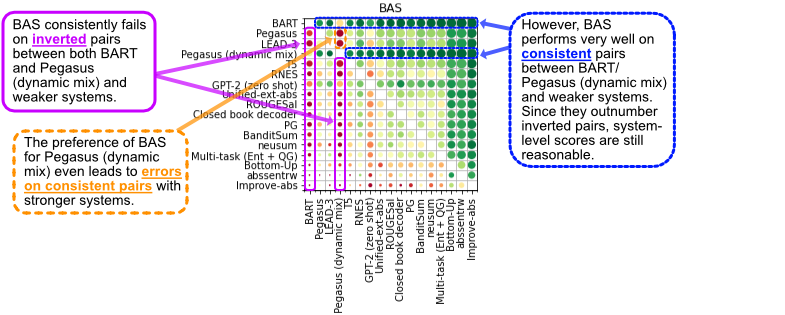
We have shown in Section 4.2 that CMs can appear to correlate with human coherence judgements by exploiting system-level confounders. However, it is unclear to which extent this just holds for our artificial confounders or is also an issue in realistic CM evaluation. We therefore introduce bias matrices, a tool that allows us to easily inspect the decisions made by a CM by separately analyzing consistent and inverted pairs of summaries from different summarizers. Based on human scores, we call a summary pair consistent if the higher-scoring summary is produced by the summarizer with the higher average score, whereas we call a pair inverted if the overall worse summarizer produces a stronger summary. We are specifically interested in finding instances where a CM ranks consistent pairs for a strong summarizer correctly, but fails to correctly rank its inverted pairs. This is indicative of a CM having a bias towards outputs of this particular summarizer, instead of measuring coherence. Since for strong systems, most pairs are consistent, this can still result in many correct comparisons.
Given predicted and human scores as in Section 4 and systems with having a higher average human score than , we define two new metrics. indicates the ability of a CM to rank consistent pairs, whereas indicates the same for inconsistent pairs. For we define:
For we invert the comparisons.999If is better than on every document, is undefined. In this case, biased and unbiased CMs are indistinguishable. Both and are bounded between -1 and 1. If the ranking is -1, this indicates the ranking is always incorrect, 1 always correct. To derive the bias matrix , we order systems in descending order of their average human score. We then have:
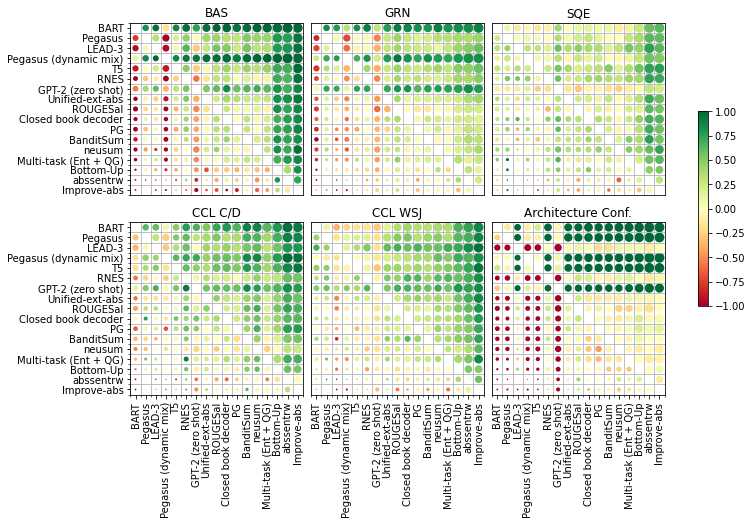
We visualize for the most promising CMs in Figure 2. To aid interpretation, we provide an annotated version for scores generated by BAS in Figure 3. We find that GRN and BAS show a very strong preference for summaries generated by BART, ranking them almost universally higher even when this disagrees with human judgements. In case of BAS this is unsurprising, since BART and BAS use the same underlying model. For GRN the reason is less clear, though analysis in Section 7.2 suggests that it might rely on the higher grammaticality of BART output. For the other CMs, biases are less evident, though CCL C/D shows a slight preference for BART and Pegasus and CCL WSJ has a slight bias towards LEAD and GPT-2.
7 CM Analysis
7.1 Correlation with Shuffle-Performance
Mohiuddin et al. (2021) have shown that the performance of CMs on the shuffle task is not predictive for performance on summary coherence evaluation. However, at the same time, the shuffling-based CCL shows comparatively strong performance in our experiments. To better understand the relation between shuffling and summary coherence, we test the ability of all CMs to discriminate shuffled and non-shuffled reference summaries from the test split of CNN/DM. Results are in Table 4.
Of the CMs that perform best on coherence evaluation (see Table 3), most also perform well on the shuffling task (CCL, BAS, SQE). Only GRN fails on this task. This is troubling as we would expect any CM that is able to identify coherent summaries on SummEval to be able to identify at least some shuffled reference summaries. This suggests that GRN models coherence only indirectly via proxy variables, which we elaborate on in Section 7.2.
For the entity-based measures EGR, EEG and NEG, their difficulties on the SummEval dataset are also reflected in the shuffle task. This suggests that these CMs struggle generally on CNN/DM-style summaries. In Section 7.3 we demonstrate that this is due to the overall lack of entity overlap in this dataset. Finally, UNF C/D and GRA are outliers in that they show shuffle performance on CNN/DM that is similar or better than SQE but still perform near random on SummEval coherence modelling. We investigate this in Section 7.4.
| Corpus | EGR | EEG | NEG | GRA | UNF | CCL | BAS | GRN | SQE | ||||||||||||
|---|---|---|---|---|---|---|---|---|---|---|---|---|---|---|---|---|---|---|---|---|---|
| C/D | 0.426 |
|
|
|
|
|
0.896 | 0.504 | 0.707 | ||||||||||||
| WSJ (orig.) | 0.889 | 0.840 | 0.855 | 0.924 | 0.93 | 0.97 | - | - | - |
7.2 GRUEN
| Cola | Redun. | LM | Focus | |
|---|---|---|---|---|
| Cola | 0.57 | 0.71 | 0.59 | 0.63 |
| Redun. | 0.51 | 0.57 | 0.51 | |
| LM | 0.15 | 0.35 | ||
| Focus | 0.49 |
GRN works well for system-level correlation yet is incapable of solving the shuffle task. This prompts us to investigate its individual components. In the reference implementation, GRN computes the sum of three scores to determine the overall score.101010The coherence score reported in the paper is not part of the reference implementation. We have confirmed that this is intentional in personal communication with the authors. Grammaticality is assessed per sentence by a classifier trained on the CoLA corpus Warstadt et al. (2019) and the average log probability under a BERT model. Redundancy is estimated by a fixed penalty whenever any sentence pair has token overlap above a predetermined threshold. Focus is scored by word-mover-similarity Kusner et al. (2015) of neighbouring sentences.
Table 5 shows the system-level correlation of the individual scores and all pairwise combinations. CoLA plus redundancy alone account for almost the full system-level correlation of . Since neither score is dependent on sentence order, they can by design not fully account for summary coherence, raising considerable doubt about the generalizability of GRNs performance on this task.
7.3 Entity Driven Measures
To explain why EEG, EGR and NEG perform poorly even on the shuffle task, we investigate the role of entity (re-)occurrences in CNN/DM summaries. Table 6 shows that both reference summaries and SummEval data have very little lexical entity overlap in between sentences.111111 As determined by the Brown Coherence Toolkit. See Appendix A. A considerable number of summaries in both SummEval and CNN/DM show no entity overlap between any of their sentences. Therefore entity-based models are inherently limited, at least when using lexical overlap to determine entity re-occurrence. We leave a thorough investigation of solutions like better coreference resolution or using embedding based methods as in Mesgar and Strube (2016) to future work.
| Corpus | Docs | Sents |
|---|---|---|
| CNN/DM Ref. | 0.287 | 0.458 |
| SummEval | 0.178 | 0.301 |
| DUC03 | 0.014 | 0.121 |
7.4 Global Training vs. Pairwise Ranking
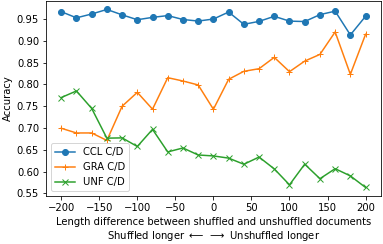
While CMs that fail the in-domain shuffling task are likely to be unsuitable for CNN/DM summaries, it is less clear why CMs with reasonable shuffle performance fail on SummEval like UNF C/D and GRA C/D. We theorize that one reason is that both UNF and GRA are trained on a margin-based ranking loss between shuffled and non-shuffled variants of the same document, which implies that both have the same tokens and number of sentences. The training loss thus does not impose constraints on the behaviour of the function between inputs of different lengths and tokens. Since SummEval, unlike e.g. DUC, has no agreed upon length constraint, this is problematic.121212Summarizer length statistics are in Appendix C. In contrast, the classification objective of CCL enforces a globally correct ranking of shuffled vs. unshuffled documents.
Verifying this hypothesis on SummEval directly is difficult, since summary length is deeply confounded with the generating summarizer. However, we can investigate the ability of CMs to correctly rank documents of different lengths and content by modifying the shuffle test to compare reference summaries to shuffled variants of different reference summaries. Figure 4 shows the relation between the difference in length between the shuffled and unshuffled summaries and the ranking accuracy of the CMs. UNF performs very poorly on the task, especially if the original summary is long. GRA, on the other hand, prefers longer documents, even if they are shuffled. In contrast, CCL is consistently able to correctly rank summaries regardless of length difference. Thus, for both UNF and GRA comparing documents of different lengths and content is a major obstacle. The stability of CCL suggests that replacing pairwise ranking with a classification objective is a direct fix to this issue. These results are also consistent with parallel work by Jwalapuram et al. (2022) who extend the pairwise shuffle-task to consider multiple negative examples. They find that including negative samples from different documents in the negative set during training improves model performance on downstream tasks.
8 Conclusion
We have investigated the performance of a wide array of CMs for summary evaluation that have not been previously systematically compared. Our investigations show that CMs must be carefully evaluated in order to avoid rewarding the modelling of shallow, system-level confounders, that are unlikely to generalize. We thus recommend researchers report our newly suggested intra-system correlation alongside other EMs and use bias matrices to understand unexpected drops when going from system-level to intra-system correlation.
There is considerable need to improve CMs before they become practical for summary coherence modelling. Our results point towards the following lessons for future work. Firstly, CNN/DM summaries are not amenable to entity-based analysis without considerable additional work to improve entity detection. Secondly, self-supervised training via the shuffle task shows the greatest promise for future improvements. However, we show that good shuffle performance does not naturally transfer to coherence evaluation for settings with documents of different lengths and contents. Training in a classification setup instead of the more common pairwise setup provides an effective fix for this.
References
- Barzilay and Lapata (2008) Regina Barzilay and Mirella Lapata. 2008. Modeling Local Coherence: An Entity-Based Approach. Computational Linguistics, 34(1):1–34.
- Deutsch et al. (2021) Daniel Deutsch, Rotem Dror, and Dan Roth. 2021. A Statistical Analysis of Summarization Evaluation Metrics using Resampling Methods. Transactions of the Association for Computational Linguistics, 9:1132–1146. Place: Cambridge, MA Publisher: MIT Press.
- Deutsch et al. (2022) Daniel Deutsch, Rotem Dror, and Dan Roth. 2022. Re-examining system-level correlations of automatic summarization evaluation metrics. In Proceedings of the 2022 Conference of the North American Chapter of the Association for Computational Linguistics: Human Language Technologies, pages 6038–6052, Seattle, United States. Association for Computational Linguistics.
- Durmus et al. (2022) Esin Durmus, Faisal Ladhak, and Tatsunori Hashimoto. 2022. Spurious Correlations in Reference-Free Evaluation of Text Generation. In Proceedings of the 60th Annual Meeting of the Association for Computational Linguistics (Volume 1: Long Papers), pages 1443–1454, Dublin, Ireland. Association for Computational Linguistics.
- Elsner and Charniak (2011) Micha Elsner and Eugene Charniak. 2011. Extending the Entity Grid with Entity-Specific Features. In Proceedings of the 49th Annual Meeting of the Association for Computational Linguistics: Human Language Technologies, pages 125–129, Portland, Oregon, USA. Association for Computational Linguistics.
- Fabbri et al. (2021) Alexander R Fabbri, Wojciech Kryściński, Bryan McCann, Caiming Xiong, Richard Socher, and Dragomir Radev. 2021. Summeval: Re-evaluating summarization evaluation. Transactions of the Association for Computational Linguistics, 9:391–409. Publisher: MIT Press.
- Grusky et al. (2018) Max Grusky, Mor Naaman, and Yoav Artzi. 2018. Newsroom: A Dataset of 1.3 Million Summaries with Diverse Extractive Strategies. In Proceedings of the 2018 Conference of the North American Chapter of the Association for Computational Linguistics: Human Language Technologies, Volume 1 (Long Papers), pages 708–719, New Orleans, Louisiana. Association for Computational Linguistics.
- Guinaudeau and Strube (2013) Camille Guinaudeau and Michael Strube. 2013. Graph-Based Local Coherence Modeling. In Proceedings of the 51st Annual Meeting of the Association for Computational Linguistics (volume 1: Long Papers), pages 93–103, Sofia, Bulgaria. Association for Computational Linguistics.
- Hermann et al. (2015) Karl Moritz Hermann, Tomáš Kočiský, Edward Grefenstette, Lasse Espeholt, Will Kay, Mustafa Suleyman, and Phil Blunsom. 2015. Teaching Machines to Read and Comprehend. In Proceedings of the 28th International Conference on Neural Information Processing Systems - Volume 1, NIPS’15, pages 1693–1701, Cambridge, MA, USA. MIT Press. Number of pages: 9 Place: Montreal, Canada.
- Jeon and Strube (2020) Sungho Jeon and Michael Strube. 2020. Incremental Neural Lexical Coherence Modeling. In Proceedings of the 28th International Conference on Computational Linguistics, pages 6752–6758, Barcelona, Spain (Online). International Committee on Computational Linguistics.
- Jwalapuram et al. (2022) Prathyusha Jwalapuram, Shafiq Joty, and Xiang Lin. 2022. Rethinking Self-Supervision Objectives for Generalizable Coherence Modeling. In Proceedings of the 60th Annual Meeting of the Association for Computational Linguistics (Volume 1: Long Papers), pages 6044–6059, Dublin, Ireland. Association for Computational Linguistics.
- Koto et al. (2022) Fajri Koto, Timothy Baldwin, and Jey Han Lau. 2022. FFCI: A Framework for Interpretable Automatic Evaluation of Summarization. Journal of Artificial Intelligence Research, 73:1553–1607.
- Kusner et al. (2015) Matt J. Kusner, Yu Sun, Nicholas I. Kolkin, and Kilian Q. Weinberger. 2015. From Word Embeddings to Document Distances. In Proceedings of the 32Nd International Conference on International Conference on Machine Learning - Volume 37, ICML’15, pages 957–966. JMLR.org. Event-place: Lille, France.
- Laban et al. (2021) Philippe Laban, Luke Dai, Lucas Bandarkar, and Marti A. Hearst. 2021. Can Transformer Models Measure Coherence in Text: Re-Thinking the Shuffle Test. In Proceedings of the 59th Annual Meeting of the Association for Computational Linguistics and the 11th International Joint Conference on Natural Language Processing (Volume 2: Short Papers), pages 1058–1064, Online. Association for Computational Linguistics.
- Lewis et al. (2020) Mike Lewis, Yinhan Liu, Naman Goyal, Marjan Ghazvininejad, Abdelrahman Mohamed, Omer Levy, Veselin Stoyanov, and Luke Zettlemoyer. 2020. BART: Denoising Sequence-to-Sequence Pre-training for Natural Language Generation, Translation, and Comprehension. In Proceedings of the 58th Annual Meeting of the Association for Computational Linguistics, pages 7871–7880, Online. Association for Computational Linguistics.
- Lin (2004) Chin-Yew Lin. 2004. ROUGE: A Package for Automatic Evaluation of Summaries. In Text Summarization Branches Out, pages 74–81, Barcelona, Spain.
- Liu et al. (2019) Yinhan Liu, Myle Ott, Naman Goyal, Jingfei Du, Mandar Joshi, Danqi Chen, Omer Levy, Mike Lewis, Luke Zettlemoyer, and Veselin Stoyanov. 2019. RoBERTa: A Robustly Optimized BERT Pretraining Approach. arXiv:1907.11692 [cs]. ArXiv: 1907.11692.
- Mesgar et al. (2021) Mohsen Mesgar, Leonardo F. R. Ribeiro, and Iryna Gurevych. 2021. A Neural Graph-Based Local Coherence Model. In Findings of the Association for Computational Linguistics: EMNLP 2021, pages 2316–2321, Punta Cana, Dominican Republic. Association for Computational Linguistics.
- Mesgar and Strube (2015) Mohsen Mesgar and Michael Strube. 2015. Graph-based Coherence Modeling For Assessing Readability. In Proceedings of the Fourth Joint Conference on Lexical and Computational Semantics, pages 309–318. Association for Computational Linguistics. Event-place: Denver, Colorado.
- Mesgar and Strube (2016) Mohsen Mesgar and Michael Strube. 2016. Lexical Coherence Graph Modeling Using Word Embeddings. In Proceedings of the 2016 Conference of the North American Chapter of the Association for Computational Linguistics: Human Language Technologies, pages 1414–1423, San Diego, California. Association for Computational Linguistics.
- Mohiuddin et al. (2021) Tasnim Mohiuddin, Prathyusha Jwalapuram, Xiang Lin, and Shafiq Joty. 2021. Rethinking Coherence Modeling: Synthetic vs. Downstream Tasks. In Proceedings of the 16th Conference of the European Chapter of the Association for Computational Linguistics: Main Volume, pages 3528–3539, Online. Association for Computational Linguistics.
- Moon et al. (2019) Han Cheol Moon, Tasnim Mohiuddin, Shafiq Joty, and Chi Xu. 2019. A Unified Neural Coherence Model. In Proceedings of the 2019 Conference on Empirical Methods in Natural Language Processing and the 9th International Joint Conference on Natural Language Processing (EMNLP-IJCNLP), pages 2262–2272, Hong Kong, China. Association for Computational Linguistics.
- Parveen et al. (2017) Daraksha Parveen, Mohsen Mesgar, and Michael Strube. 2017. Generating Coherent Summaries of Scientific Articles Using Coherence Patterns. In Proceedings of the 2016 Conference on Empirical Methods in Natural Language Processing. Number: TUD-CS-2017-0301.
- Peters et al. (2018) Matthew E. Peters, Mark Neumann, Mohit Iyyer, Matt Gardner, Christopher Clark, Kenton Lee, and Luke Zettlemoyer. 2018. Deep Contextualized Word Representations. In Proceedings of the 2018 Conference of the North American Chapter of the Association for Computational Linguistics: Human Language Technologies, Volume 1 (Long Papers), pages 2227–2237, New Orleans, Louisiana. Association for Computational Linguistics.
- Pitler et al. (2010) Emily Pitler, Annie Louis, and Ani Nenkova. 2010. Automatic Evaluation of Linguistic Quality in Multi-Document Summarization. In Proceedings of the 48th Annual Meeting of the Association for Computational Linguistics, pages 544–554, Uppsala, Sweden. Association for Computational Linguistics.
- Popović (2017) Maja Popović. 2017. chrF++: Words Helping Character N-Grams. In Proceedings of the Second Conference on Machine Translation, pages 612–618, Copenhagen, Denmark. Association for Computational Linguistics.
- See et al. (2017) Abigail See, Peter J. Liu, and Christopher D. Manning. 2017. Get To The Point: Summarization with Pointer-Generator Networks. In Proceedings of the 55th Annual Meeting of the Association for Computational Linguistics (Volume 1: Long Papers), pages 1073–1083. Association for Computational Linguistics. Event-place: Vancouver, Canada.
- Sharma et al. (2019) Eva Sharma, Luyang Huang, Zhe Hu, and Lu Wang. 2019. An Entity-Driven Framework for Abstractive Summarization. In Proceedings of the 2019 Conference on Empirical Methods in Natural Language Processing and the 9th International Joint Conference on Natural Language Processing (EMNLP-IJCNLP), pages 3271–3282.
- Tien Nguyen and Joty (2017) Dat Tien Nguyen and Shafiq Joty. 2017. A Neural Local Coherence Model. In Proceedings of the 55th Annual Meeting of the Association for Computational Linguistics (Volume 1: Long Papers), pages 1320–1330, Vancouver, Canada. Association for Computational Linguistics.
- Warstadt et al. (2019) Alex Warstadt, Amanpreet Singh, and Samuel R. Bowman. 2019. Neural network acceptability judgments. Transactions of the Association for Computational Linguistics, 7:625–641. Place: Cambridge, MA Publisher: MIT Press.
- Wolf et al. (2020) Thomas Wolf, Lysandre Debut, Victor Sanh, Julien Chaumond, Clement Delangue, Anthony Moi, Pierric Cistac, Tim Rault, Remi Louf, Morgan Funtowicz, Joe Davison, Sam Shleifer, Patrick von Platen, Clara Ma, Yacine Jernite, Julien Plu, Canwen Xu, Teven Le Scao, Sylvain Gugger, Mariama Drame, Quentin Lhoest, and Alexander Rush. 2020. Transformers: State-of-the-Art Natural Languag Processing. In Proceedings of the 2020 Conference on Empirical Methods in Natural Language Processing: System Demonstrations, pages 38–45, Online. Association for Computational Linguistics.
- Xenouleas et al. (2019) Stratos Xenouleas, Prodromos Malakasiotis, Marianna Apidianaki, and Ion Androutsopoulos. 2019. SUM-QE: A BERT-based Summary Quality Estimation Model. In Proceedings of the 2019 Conference on Empirical Methods in Natural Language Processing and the 9th International Joint Conference on Natural Language Processing (EMNLP-IJCNLP), pages 6005–6011, Hong Kong, China. Association for Computational Linguistics.
- Yuan et al. (2021) Weizhe Yuan, Graham Neubig, and Pengfei Liu. 2021. BARTScore: Evaluating generated text as text generation. In Advances in Neural Information Processing Systems, volume 34, pages 27263–27277. Curran Associates, Inc.
- Zhao et al. (2022) Wei Zhao, Michael Strube, and Steffen Eger. 2022. DiscoScore: Evaluating Text Generation with BERT and Discourse Coherence. arXiv:2201.11176 [cs]. ArXiv: 2201.11176.
- Zhu and Bhat (2020) Wanzheng Zhu and Suma Bhat. 2020. GRUEN for Evaluating Linguistic Quality of Generated Text. In Findings of the Association for Computational Linguistics: EMNLP 2020, pages 94–108, Online. Association for Computational Linguistics.
Appendix A Implementation Details
A.1 Extended Entity Grid (EEG)
We use the original implementation that is part of the Brown Coherence Toolkit131313https://web.archive.org/web/20200505174052/https://bitbucket.org/melsner/browncoherence. For preprocessing, we use the Stanford parser141414https://nlp.stanford.edu/software/lex-parser.shtml. We identify entities using OpenNLP as suggested in the README.
For WSJ we used the pretrained f-wsj model provided in the toolkit. For CNN/DM we trained our own model. We found that the implementation ran out of memory on the 287,011 instances in CNN/DM on our machine with 32GB of RAM. We thus limited the instances considered for CNN/DM to 10% of the original dataset (28,701).
A.2 Entity Graph (EGR)
Since there is no reference implementation of the Entity Graph, we implement our own version based on the grid created by the Brown Coherence Toolkit. We use the measure with distance penalty which performed best in the original paper.
A.3 Neural Entity Grid (NEG)
Since no models are publicly available, we train new models for all settings using the reference implementation151515https://github.com/datienguyen/cnn_coherence.
For DUC03 and WSJ we use the entity grids and training pairs provided by the authors in the repository. These were also created using the Brown Coherence Toolkit. For CNN/DM we create our own examples, following the original settings. We found that the original implementation of the shuffling procedure leaves artifacts in the data since the row order is unchanged between shuffled and unshuffled documents. However, for unshuffled documents the order of rows in the entity grid roughly corresponds to the order of entities in the sentences, whereas for shuffled documents this is not the case. Since this can be picked up by the convolutional network for short documents, we modify the input data to randomly shuffle row order for each instance.
For the shuffling tasks on WSJ we use the reported hyperparameters, which we also use for CNN/DM. For DUC, no hyperparameters were reported, so we use the built-in hyperparameter search. We achieve the best results using the parameters reported in Table 7.
| Embedding Size | 100 |
| Batch Size | 64 |
| Pool Length | 6 |
| Window Size | 6 |
| Number of Filters | 150 |
| Hidden Size | 250 |
A.4 Graph-based Model (GRA)
We use the original implementation.161616https://github.com/UKPLab/emnlp2021-neural-graph-based-coherence-model For WSJ, we use the provided pretrained model. For DUC and CNN/DM we train the model using default settings, which includes an ELMo embedding layer. The graph-representation is created from an entity grid representation as provided by the Brown Coherence Toolkit.
A.5 Unified Coherence Model (UNF)
We use the original implementation.171717https://github.com/taasnim/unified-coherence-model We train new models for CNN/DM and WSJ using default settings. In the original implementation, scores are computed using a sum over coherence scores for windows of three sentences each, since in their pairwise evaluation, samples always have the same length. In our experiments, we use the mean over the windows instead to normalize for length. For completeness, we also conducted experiments using the original setting, which did not lead to any improvement.
A.6 Coherence Classifier (CCL)
We originally experimented with the pretrained WSJ model provided by the authors of (Laban et al., 2021).181818https://github.com/tingofurro/shuffle_test However, we found that the model achieved near-random scores when evaluated on SummEval for reasons that are difficult to ascertain as the original training code is unavailable. We thus train our own coherence classifier models for both CNN/DM and WSJ. We use the roberta-large model as implemented in the huggingface library (Wolf et al., 2020) in a sequence classification setup. We use a learning rate of and train for a maximum of six epochs. We select the best model using f1-score on the validation set.
A.7 BARTScore (BAS)
We reimplement the finetuned BARTScore variant using the bart-large-cnn checkpoint from the huggingface library. Since the original model is evaluated using Spearman’s , we separately verified that it exactly reproduces the reported results.
A.8 GRUEN (GRN)
We use the scores provided by the official reference implementation.191919https://github.com/WanzhengZhu/GRUEN
A.9 SumQE (SQE)
We use the scores provided by the official reference implementation.202020https://github.com/nlpaueb/SumQE We use the Q5 head of the model jointly trained on all three DUC datasets.212121https://archive.org/download/sum-qe/BERT_DUC_all_Q5_Multi%20Task-5.h5
A.10 Hardware
All experiments that include neural network training (i.e. NEG, GRA, UNF, CCL) were run on a single node with four Quadro RTX 6000 GPUs.
Appendix B Detailed Intra-System Correlation Results
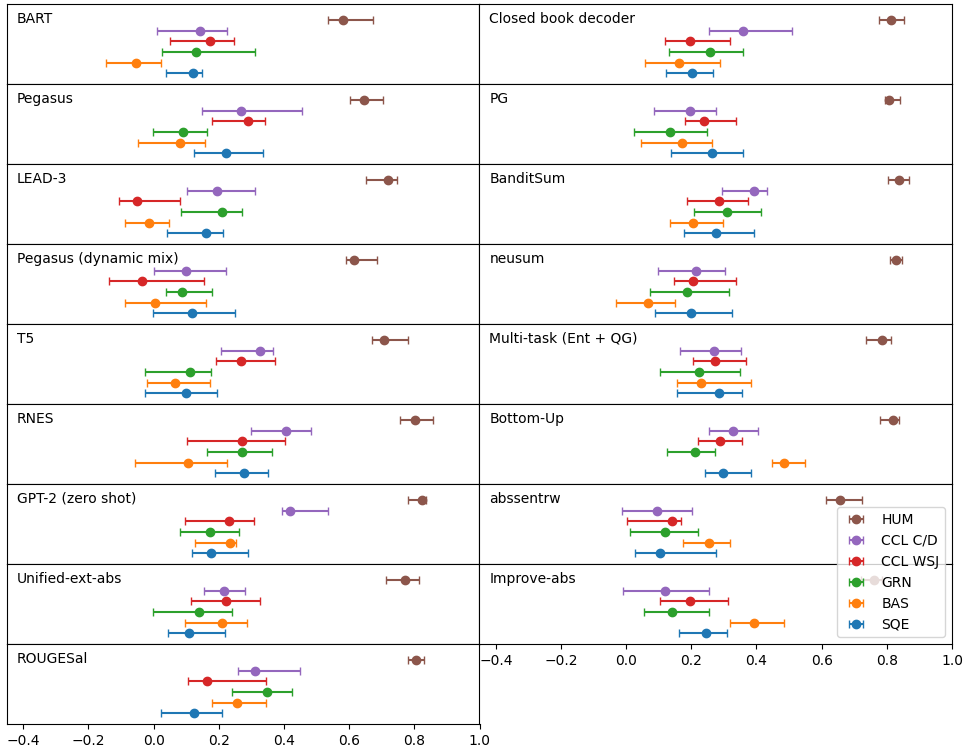
Figure 5 shows the individual intra-system correlations for all summarizers in SummEval for the best CMs and the human upper bound. We find that CMs struggle across the whole range of summarizers, including summarizers with high variance in coherence scores, where we would expect the task to be easier. Furthermore, we find none of the available CMs can consistently outperform all others. For example, BAS outperforms other CMs on Bottom-Up and Improve-Abs, but performs significantly worse on the top systems, including BART itself.
Appendix C Length Statistics
We present the length distribution of summarizer outputs on SummEval in Figure 6.