Fast time optical variability in Be/X-ray binaries.
Pulsation and rotation
Abstract
Context. Classical Be stars, regardless of spectral subtype, display multiperiodic light modulations in the frequency range 0.1-12 , when observed with high-cadence and long duration. This behaviour is attributed to non-radial pulsations and/or rotation of the Be star. A similar study for the optical counterparts to Be/X-ray binaries is yet to be carried out.
Aims. The main goal of this work is to investigate the fast photometric variability of the optical counterparts to Be/X-ray binaries and compare the general patterns of such variability with the Galactic population of classical Be stars.
Methods. The main core of our analysis is based on space-based observations performed by TESS. We analyzed 21 sources with TESS. High-cadence photometry with two ground-based telescopes was also performed for 15 sources. The TESS light curves were created from the full-frame images using the Lightkurve package. The ground-based light curves were obtained through differential photometry between the target and a number of non-variable stars in the same field of view. Standard Fourier analysis and least-squares fitting methods were employed in the frequency analysis.
Results. All sources exhibit intra-night light variations with intensity variations of 0.01-0.06 mag in the ground-based observations and up to 5% in flux in TESS observations. This variability manifests itself as multi-periodic signals in the frequency range 0.2–12 . We find that the patterns of variability of the Be stars in Be/X-ray binaries agree with that of classical early-type Be stars in terms of the general shape of the periodograms. Based on the general shape and number of peaks in the periodograms, Be/X-ray binaries can be classified into different types. The most common case is the presence of groups of closely-spaced frequencies (67)%, followed by sources that exhibit isolated signals (18%). The remaining type of sources displays frequency spectra characterized by a mixed pattern of stochastic variability and high-frequency peaks.
Conclusions. This study reveals that short-term optical photometric variability is a very common, if not ubiquitous, feature intrinsic to the Be optical companions in Be/X-ray binaries. This variability is mainly attributed to pulsations that originate in the stellar interior.
Key Words.:
Stars: emission-line, Be – Stars: oscillations – X-rays: binaries – stars: neutron1 Introduction
High-mass X-ray binaries (HMXB) divide into supergiant X-ray binaries (SGXB) and Be/X-ray binaries (BeXBs) according to the luminosity of the optical counterpart. In a SGXB a neutron star orbits around an evolved (luminosity class I or II) star while in BeXBs the optical companion is a giant or main-sequence (luminosity class III–V) star. In Be stars, episodic ejection of mass from their atmospheres results in the formation of a flattened disk around their equator (Porter & Rivinius 2003; Rivinius et al. 2013). The evidence for the existence of such disks stems from the presence of emission lines, infrared excess, and intrinsic polarization. The ultimate mechanism that injects material at the Keplerian orbital speed into the base of the disk is still unknown. Centrifugal acceleration is a promising mass loss mechanism because Be stars rotate, on average, at larger speeds than normal B stars. Although there is now general consensus that Be stars are rapidly-rotating stars, there is no agreement on how close to critical velocity they rotate. Rotation rates (rotation velocity normalized by the star’s critical rotation speed) lie in the range 70-80% (Porter & Rivinius 2003; Rivinius et al. 2013), 90% (Frémat et al. 2005) or even higher (Townsend et al. 2004). The rotation rate is a key ingredient in the understanding of the formation of the equatorial disk. The higher the rotation rate the easier to lift up gas and launch material into a ballistic orbit. But if Be stars rotate below critical velocity, then the launching mechanism still has to be identified. Non-radial pulsations (NRP), probably in combination with small-scale magnetic fields have been suggested as a possible mechanism to explain mass-loss and disk-formation in hot stars (Baade 1992; Cranmer 2009; Rivinius et al. 2013; Baade et al. 2018b). An alternative mechanism that may eject material from the photosphere to form the disk would be magnetic reconnection associated with localized magnetic fields generated by convection (Balona 2003; Balona & Ozuyar 2020, 2021).
Rotation and pulsations manifest as multi-frequency photometric variability, that is, as brightness variations (Baade et al. 2016; Rivinius et al. 2016; Semaan et al. 2018; Balona & Ozuyar 2020, 2021) and as spectroscopic variability, e.g. as line profile variations (Baade 1984; Rivinius et al. 1998, 2003; Balona 2003; Zima 2006) with typical periods in the range 0.1 to 2 days. Therefore, the study of the short-term variability in Be stars may provide the key to distinguish between competitive models.
The optical emission in a BeXB comes from the circumstellar disk and from the early-type star. A third source of optical emission would be an accretion disk around the neutron star. However, the optical flux from the accretion disk is several orders of magnitude lower than the optical emission from the Be star. While there are many studies on the evolution of the decretion disk, little has been done to understand the physical properties of the underlying Be star other than the determination of the spectral type. It is generally assumed that the Be star in BeXBs has the same properties as a classical Be star. In other words, for the same spectral type, the luminosity, mass, and radius are similar. The traditional view has been that due to the large mass ratio and wide orbital separation between the Be star and the neutron star, the neutron star is not expected to exert a significant effect on processes related to the surface of the optical companion. Therefore, the same phenomenology in the short-term variability is expected between classical Be stars and BeXBs. We know now that this is not true for the long-term variability that it is associated with the disk. Disks in BeXBs are denser and smaller than in classical Be stars (Reig et al. 1997a; Zamanov et al. 2001; Reig 2011; Zamanov et al. 2013; Reig et al. 2016). The reason is that disks in BeXBs are truncated by the tidal torque exerted by the neutron star. The distance at which the circumstellar disk is truncated depends mainly on the orbital parameters and the viscosity (Okazaki & Negueruela 2001; Okazaki et al. 2002). In addition, in a truncated disk, the large amount of material that has to be accreted to produce the giant X-ray outbursts can only be achieved if the disk is misaligned and warped (Martin et al. 2011; Okazaki et al. 2013; Martin et al. 2014). Since truncation results in the limitation of the size of the equatorial disk of the Be star in a BeXB, one may wonder whether the optical companions in BeXBs may also show different phenomenology with regard to processes associated with the star itself. Although there is growing evidence that classical Be stars harbor low-mass companions (Gies 2000; Klement et al. 2022) that can also lead to the truncation of the disk (Panoglou et al. 2016; Cyr et al. 2017; Klement et al. 2017, 2019), the tidal interaction is expected to be less significant and accretion is not expected to be relevant as in BeXBs. The viscous decretion disk model explains quite satisfactorily most of the Be star’s phenomenology (Haubois et al. 2012, 2014; Draper et al. 2014).
Short-term photometric periodic variability is commonly observed in classical Be stars (Labadie-Bartz et al. 2017; Bernhard et al. 2018, and references therein). Be stars that have been observed with high-cadence and long-duration, especially from space-based observatories, have shown multi-periodic variability that in most cases have been attributed to NRP (Gutiérrez-Soto et al. 2007a; Huat et al. 2009; Neiner et al. 2009; Emilio et al. 2010; Kurtz et al. 2015; Rivinius et al. 2016; Baade et al. 2016; Semaan et al. 2018; Baade et al. 2018b; Balona & Ozuyar 2020; Labadie-Bartz et al. 2022). In contrast, only two Galactic BeXBs have been reported to display periodicities of the order of a few hours in their photometric light curves: GRO J2058+42 (Kızıloǧlu et al. 2007), and LS I +61 235 (Sarty et al. 2009). A tentative detection of a 2.6 periodicity has also been reported in 4U 2206+54 (Bugno et al. 2009). This scarcity of results is not due to the lack of detections but to the scarcity of observations. To be able to perform meaningful comparative studies between the rotational and pulsational properties of Be stars in different types of systems and environments, the sample of Milky Way Be stars in X-ray binaries must be increased. To remedy this, we set up a new project to investigate the fast time variability of BeXBs visible from the Northern hemisphere from ground-based telescopes. The launch of the Transiting Exoplanet Survey Satellite (TESS) added a new dimension to the project and gave us the opportunity, not only to expand our target list to systems visible from the Southern hemisphere but also to expand the frequency space. Thus, our analysis is mainly based on the TESS light curves. We used our ground-based photometry to complement the space data, especially for the fainter sources not observed by TESS. TESS observations of classical Be stars have been presented in Labadie-Bartz et al. (2021, 2022) and Balona & Ozuyar (2020, 2021).
| Source | Spectral | -band | Type | Pspin | Porb | Distance (kpc) | References | ||
| name | type | (mag) | var. | (s) | (days) | Gaia EDR3‡ | (km s-1) | ||
| IGR J00370+6122 | BN0.7Ib | 9.6 | s | 346 | 15.66 | 0.5 | [1a], [1b] | ||
| 2S 0114+65 | B1Ia | 11.0 | s | 9720 | 11.6 | 0.18 | [2a], [2b] | ||
| 4U 0115+63 | B0.2Ve | 15.4 | g | 3.6 | 24.3 | 0.34 | [3a], [3b] | ||
| IGR J01363+6610 | B1IV-Ve | 13.3 | g | – | – | – | [4a], [4b], [4c] | ||
| RX J0146.9+6121† | B1Ve | 11.3 | – | 1400 | 303? | – | [5a], [5b] | ||
| RX J0240.4+6112 | B0Ve | 10.8 | g | – | 26.5 | 0.54 | [6a], [6b] | ||
| SWIFT J0243.6+6124 | O9.5Ve | 12.8 | g | 9.9 | 27.6 | 0.10 | [7a], [7b] | ||
| V 0332+53 | O8–9Ve | 15.4 | g,h | 4.4 | 33.8 | 0.37 | [8a], [8b] | ||
| X Per | B0Ve | 6.1 | g,h | 838 | 250 | 0.11 | [9a], [9b] | ||
| RX J0440.9+4431 | B0.2Ve | 10.7 | g,h | 202.5 | 150 | – | [10a], [10b] | ||
| 1A 0535+262 | O9.7IIIe | 9.2 | g,h | 105 | 111 | 0.47 | [11a], [11b] | ||
| IGR J06074+2205 | B0.5Ve | 12.2 | i,h | 373.2 | – | – | [12] | ||
| MXB 0656–072 | O9.5Ve | 12.3 | i | 160.4 | 5101.2 | 0.4? | – | [13a], [13b] | |
| RX J0812.4–3114 | B0.2IVe | 12.7 | g,h | 31.9 | 80 | – | [14a], [14b] | ||
| Vela X–1 | B0.5Ib | 6.9 | s | 283 | 8.96 | 0.09 | [15] | ||
| GRO J1008-57 | B1Ve | 15.3 | g,h | 93.5 | 249.5 | 0.68 | – | [16a], [16b] | |
| RX J1037.5–5647 | B0III-Ve | 11.5 | s | 860 | – | – | – | [17a], [17b] | |
| 1A 1118–616 | O9.5IV-Ve | 12.1 | g,h | 406.5 | 24 | [18a], [18b] | |||
| 4U 1145–61 | B0.2IIIe | 9.0 | g,h | 292 | 186.5 | [19a], [19b] | |||
| GX 304–1 | B0.7Ve | 14.4 | i,h | 272 | 132.5 | 0.46 | [20a], [20b] | ||
| KS 1947+300 | B0Ve | 14.5 | s | 18.7 | 40.4 | 0.03 | [21a], [21b] | ||
| Swift J2000.6+3210† | B0-2Ve | 16.2 | – | 890 | – | – | – | [22] | |
| GRO J2058+42 | O9.5-B0IV-Ve | 14.9 | i,h | 192 | 110 | – | [23a], [23b] | ||
| SAX J2103.5+4545† | B0Ve | 13.9 | – | 358 | 12.7 | 0.40 | [24a], [24b] | ||
| IGR J21343+4738† | B1IVe | 14.1 | – | 320 | – | – | [25] | ||
| Cep X–4† | B1-2Ve | 14.3 | – | 66.3 | 24.8? | – | [26] | ||
| 4U 2206+54 | O9.5Ve | 9.8 | s,h | 5550 | 19.2 | 0.15 | [27] | ||
| SAX J2239.3+6116 | B0Ve | 14.4 | g,h | 1247 | 263 | – | [28] | ||
| MWC 656 | B1.5IIIe | 8.7 | g | – | 60.4 | 0.10 | [29] |
2 Observations
We extracted light curves for all the BeXBs observed by TESS. These are 25 sources, which represent about 80% of the confirmed (i.e. with well constrained optical counterparts) Galactic BeXBs (Raguzova & Popov 2005)222We used the extended and updated version of this catalog available on-line: http://xray.sai.msu.ru/ raguzova/BeXcat. However, owing to the large pixel size of the TESS cameras (21 arcsec), 4 out of 25 sources were affected by nearby bright objects that prevented us from obtaining a clean light curve. These are: RX J0146.9+6121, SAX J2103.5+4545, IGR J21343+4738, and Cep X–4. High-cadence photometry with two ground-based telescopes was also performed for 15 sources, including the four sources without clean TESS light curves. In order to compare the pulsational properties of BeXBs and SGXBs we also analyzed two prototypical examples of SGXBs, namely, Vela X–1 and 2S 0114+65, and the less luminous SGXB IGR J00370+6122. Table 1 gives the list of sources analyzed in this work together with some astrophysical information.
2.1 Transiting Exoplanet Survey Satellite (TESS)
TESS is optimized for the detection of exoplanets (super Earths) around nearby, bright stars (Ricker et al. 2015). Owing to its observational strategy it covers the entire sky in periods of two years. TESS observes the sky in sectors of . Each sector is observed for two orbits of the satellite around the Earth, or about 27 days on average. TESS has four identical cameras equipped with custom f/1.4 lenses, providing each camera with a field of view. The cameras have an effective aperture size of 10 cm in diameter. TESS uses a red-optical band-pass covering the wavelength range from about 600 to 1000 nm, with maximum throughput between 700 and 900 nm.
2.2 Skinakas observatory
The Skinakas observatory333https://skinakas.physics.uoc.gr/en/ (SKO) is located on the Ida mountain in central Crete (Greece) at an altitude of 1750 m. The observations reported in this work were made with the 1.3m modified Ritchey-Chrétien telescope. Two ANDOR CCD back illuminated cameras were employed. Before 2018, we used a DZ436. From 2018, an IKON-L 926. Both have an array of 2048 2048 13.5 m pixel size (corresponding to 0.28 arcsec on sky), hence providing a field of view of 9.5 square arcmin. Appendix D gives the log of the observations from the Skinakas observatory.
2.3 Aras de los Olmos observatory
The Aras de los Olmos observatory444https://www.arasdelosolmos.es/observatorios/ (OAO) is located in la Muela de Santa Catalina, near the Aras de los Olmos town (Valencia, Spain), at an altitude of 1280 m. Observations were performed with the 0.5-m telescope equipped with a Finger Lakes Instruments ProLine PL16801 thermoelectrically cooled CCD camera. The 4096 4096 array with a 2 2 binnig gives a plate scale of 1.08/pixel and a field of view of square arcmin. Appendix D gives the log of the observations from the Aras de los Olmos observatory.
3 Data analysis
3.1 TESS light curves
The Full Frame Images (FFIs) are the basic data product of the TESS mission. A single FFI is the full set of all science and collateral pixels across all CCDs of a given camera. FFIs were taken every 30 minutes during science operations in the primary mission (July 2018-July 2020) and with a cadence of 10 minutes during the first extension of the mission555TESS data products, https://heasarc.gsfc.nasa.gov/docs/tess/data-products.html (scheduled to end in September 2022). We created our own light curves from the FFIs by using the Lightkurve (Lightkurve Collaboration et al. 2018) and TESScut (Brasseur et al. 2019) packages to download a Target Pixel File (TPF) with a 25 25 pixel image (8.75 8.75 arcmin, being 21 arcsec the projected pixel size), centered on the target for every available TESS sector. These images were carefully inspected and different aperture masks were chosen for the different targets as a function of their brightness and the presence of nearby brighter stars. We removed unwanted events by filtering out observations with a QUALITY flag different from zero. In practice, these events were mainly outliers.
 |
 |
3.2 Ground-based light curves
Reduction of the ground-based telescope data were carried out in the standard way using the IRAF tools for aperture photometry 666A User’s Guide to CCD Reductions with IRAF, Philip Massey, February 1997. https://iraf.net/irafdocs (Tody 1986). First, all CCD images were bias-frame subtracted and flat-fielded corrected using twilight sky flats to correct for pixel-to-pixel variations on the chip. No standard stars were observed. Instead, we used secondary standards (comparison stars) in the field near the target. The secondary standard stars were taken from Reig & Fabregat (2015). Initially, we extracted the instrumental magnitudes of all the field stars marked as standard stars in Reig & Fabregat (2015). However we checked for their stability and intra-night small amplitude variations. From the entire list, we chose the most stable ones.
The selection of the secondary standard stars was made as follows: for each night and each star, we obtained the light curve, i.e. time versus instrumental magnitude. Then we subtracted the average instrumental magnitudes from each measurement. Thus we created an average-subtracted light curve that fluctuates around zero. Then we computed the standard deviation of the residuals that resulted from subtracting one comparison star from the average of the remaining comparison stars. We eliminated the stars with the larger value of the standard deviation. We repeated the procedure until we were left with three or four comparison stars. The overall standard deviation computed using the light curves of all of the final comparison stars was in the range 2–7 millimagnitudes and was adopted as the accuracy of our photometry for the corresponding observing run. The final light curves that were used for the timing analysis were obtained by subtracting the mean of the average-subtracted light curves of the selected comparison stars and the average-subtracted light curve of the target.
3.3 Frequency analysis
The frequency analysis has been performed with the rectified light curves. In the case of TESS photometry, most of the light curves present slow trends due to instrumental drifts, long term aperiodic or quasi-periodic variability of circumstellar origin and sudden brightenings and fadings induced by outbursts. All these signals convey a large number of frequencies that pollute the low frequency spectrum. To remove these variations we have rectified the light curves with fitting splines, by means of the Savitzky-Golay filter implemented in the Lightkurve package.
However, we have carefully inspected the original, non-rectified light curves in order to detect the occurrence of mid to long term quasi-periodic variability and light outbursts, and the relationship between these events and amplitude variations of the short-term variability, which could be related to mass-loss episodes. The results of this analysis are presented in Sects. 4.3 and 4.4.
We applied standard Fourier analysis and least squares methods to search for periodicities in the light curves. In particular, we used the Period04 program (Lenz & Breger 2005) and PASPER (Diago et al. 2008) as the basic analysis tools. These programs search for frequencies by means of standard Fourier analysis. Once a frequency is detected, the program adjusts the parameters of a sinusoidal function using a least-squares fitting and prewhitens the signal from this frequency i.e. subtracts a synthetic sinusoidal light curve from the data in the time domain. Then, a new frequency is found in a new step and the subsequent least-squares fitting is performed, allowing the two frequencies to move in order to get the minimum variance. The method is iterative and stops when the removal of a new frequency is not statistically significant. We consider that a frequency is statistically significant when the signal-to-noise (S/N) ratio is above 4 (see Breger et al. 1993, for details). The signal is the amplitude of the peak at the given frequency and the noise is taken as the average amplitude in the residual periodogram after the prewhitening of all the frequencies detected in a certain range around the peak frequency. We calculated the frequency resolution following the Rayleigh criterion, i.e., , where is the time duration of the light curve.
The choice of the range of frequencies around the peak frequency to compute the noise affects the significance of the detection. Unfortunately, there is not a unique good value as it should match the frequency range covered by the periodogram but also because of the different types of frequency spectra. In the presence of red noise (typically below 2 ), a wide interval may include low amplitude noise above the region where the red noise dominates increasing artificially the significance of the detection. A wide interval normally excludes the low-amplitude high-frequencies peaks. On the other hand, a too narrow range decreases the significance of the central frequency when it appears in a group. Different authors have computed the average noise over different size windows centered on the relevant frequency: 5 , (Gutiérrez-Soto et al. 2007b; Semaan et al. 2018), 3 (Pápics et al. 2011), 2 (Labadie-Bartz et al. 2020), or even as low as 1 (Pápics et al. 2017; Burssens et al. 2019; Szewczuk et al. 2021). For other ways of computing the significance of a peak in a periodogram see Reegen (2007).
For the TESS light curves, we run our analysis twice, one over the 0–20 interval using an interval of 5 around the peak frequency to derive the noise and another one over 3–20 with a 1 noise interval width. The TESS light curves used in the analysis were created by sector. When the source was observed during more than one sector, we also analyzed the combined light curve of all contiguous sectors.
In the case of ground-based photometry, we analyzed the light curves created per observing period, which typically covers a few days (see Tables 9–11). In addition to using the light curves made of the difference between the source and the average of the comparison stars, we also performed a frequency analysis on the light curves made from a combination of comparison stars, without the source. This way we can ensure the reality of the periodicity found. Only if the periodicity detected on the source disappeared in the light curves of the comparison stars, the periodicity was considered to be a firm detection. The interval of frequencies to derive the average noise was taken to be 5 .
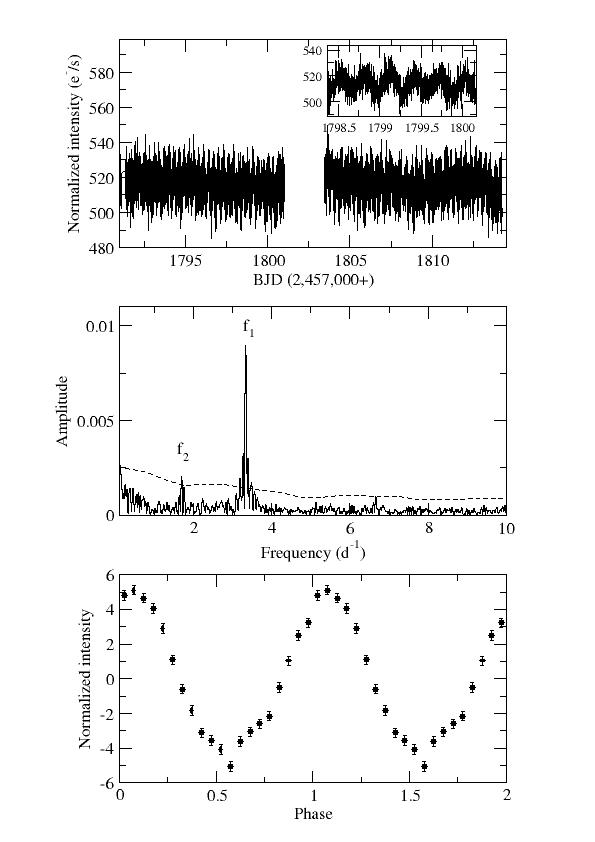
As an example of the frequency analysis, we show the results for 4U 0115+63 in Fig 1. We show the light curves, periodograms and phase diagrams for the TESS and Skinakas observations. The most prominent feature of the periodograms is a peak at frequency 3.3 , that it is detected in both data sets. The results of the TESS and ground-based data analysis of the individual sources are reported and discussed in Appendix A.
3.3.1 Independent frequencies
In densely frequency spectra, certain frequencies may result from the linear combination of some basic frequencies (see e.g. Kurtz et al. 2015). In this work, we shall refer to these basic frequencies as independent or parent frequencies. In order to identify the independent frequencies we applied the following procedure (Pápics 2012; Pápics et al. 2017; Szewczuk et al. 2021): First we check if two closely spaced frequencies are separated by less than , where is the total duration of the light curve. This is known as the Loumos & Deeming (1978) criterion, which states that the minimum separation between two frequencies so that the wings of one frequency do not affect significantly the other should be at least 2.5 the Rayleigh resolution (). If that is the case, then we keep the peak with the larger amplitude and discard the other peak. Second, we searched for linear combination of the type
| (1) |
with integers , from to 3. If the combination on the right-hand side of eq. (1) is less than , then is considered to be a linear combination of and . Some linear combination may occur by chance. In order to asses whether a combination is real or not, we computed two parameters. The first one is taken from Szewczuk et al. (2021)
| (2) |
where and are the amplitude of the parent frequencies and is the highest amplitude of the spectrum. The smaller is, the higher the probability that the resulting combination occurs by chance (hence the modulation is real). The second parameter is taken from Pápics (2012)
| (3) |
where . If then the corresponding peaks are likely to come from a combination.
According to these two parameters, we shall consider as independent frequencies those that do not satisfy eq (1) as well as those that satisfy that equation but have and . By imposing these two conditions, we minimize the risk of discarding frequencies whose linear combination occurs by chance. To estimate the uncertainties in the frequency, we opted for the more conservative approach of using (Kallinger et al. 2008).
4 Results
We have found that all BeXBs analyzed in this work show fast light intensity variability. The amplitude of this variability from maximum to minimum within one night measured from the normalized light curves ranges from 0.02-0.06 mag in the ground-based photometry and from 0.1% to 5% in flux in the TESS band-pass. In addition, all systems display multi-periodic variability, although the amplitude of the modulations and number of frequencies in the periodograms vary significantly for different sources. The highest number of frequencies with was found for the SGXB Vela X–1 with 79 detected. Among BeXB, IGR J01363+6610 was the source with the largest number of peaks with 62. However, as explained above, many peaks appear as linear combinations of a small number of parent frequencies. A detailed analysis per source is given in Appendix A. Appendix C (Tables 3 to 8) gives the lists of independent frequencies after the selection made according to Sect. 3.3.1. while Appendix E gives the significant frequencies detected in the data obtained from the ground-based observatories.
4.1 Periodograms
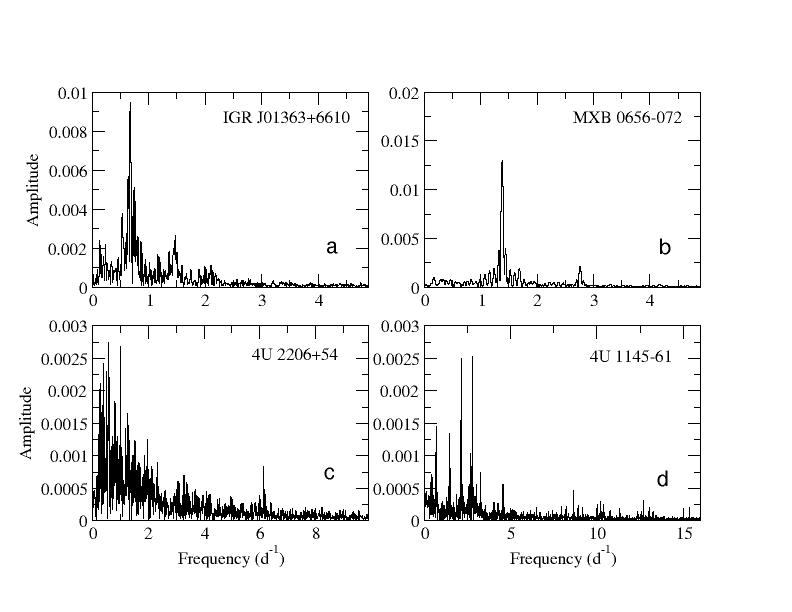
From a purely phenomenological point of view, the fast-time variability of BeXBs can be classified into different categories depending on the characteristic features of their periodograms (see e.g. Labadie-Bartz et al. 2022). We can identify four different types (Fig. 2):
-
•
Groups of frequencies (Fig. 2). The most common pattern of variability in the periodograms of classical Be stars is the existence of frequency groups (Walker et al. 2005; Kurtz et al. 2015; Semaan et al. 2018; Baade et al. 2018a; Labadie-Bartz et al. 2021; Balona & Ozuyar 2021). The most common configuration includes three groups at frequencies , 0.5–3 , and 1–6 . Sometimes the first group is absent. Regardless of whether two or three groups show up in the periodogram, the central frequency of the highest-frequency group is almost always about twice that of the second group. As in classical Be stars, frequency groups are also present among BeXBs and represent the most common configuration with 14 sources (67%) of our sample of 21 BeXBs with TESS data. The frequency spectra in this category show different degrees of complexity, but in general about 70% of them display an approximate harmonic relationship between the second and third group.
Typically, one of the two higher-frequency groups contains a dominant sharp peak that stands above the broader and lower-amplitude peaks that conforms the group. The sharp peak may appear in the second group, as in 1A 1118–616 (Fig. 13), in the third group, as in 1A 0535+262 (Fig. 12) and RX J0812.4–311 (Fig. 13), or in both as in 4U 1145–61 (Fig. 13) and RX J0440.9+4431 (Fig. 12).
-
•
Isolated signals (Fig. 2). In about 18% (4 sources) of the BeXBS with TESS data that we analyzed, the frequency spectrum shows one or more isolated peaks. These sources are IGR J06074+2205 (Fig. 13), MXB 0656–072 (Fig. 13), GX 304–1 (Fig. 13), and GRO J2058+40 (Fig. 14), In all cases, the most significant peak is below 2.5 .
-
•
Stochastic variability (Fig. 2). Red noise is stochastic variability whose amplitude decreases rapidly with increasing frequency. It may be formed by pure noise, without any clear peak or by a forest of signals. Stochastic variability in early-type stars can be produced by inhomogeneities in the stellar surface or wind in combination with rotation (Aerts et al. 2018; Simón-Díaz et al. 2018) or by interval gravity waves generated at the interface of the convective core and radiative envelope (Bowman et al. 2019a, 2020). This pattern is characteristic of supergiant stars (Bowman et al. 2019b) and can be clearly identified in the SGXBs 2S 0114+65 (Fig. 14), Vela X–1 (Fig. 14), and IGR J00370+6122 (Fig. 14). Stochastic variability is sometimes a prominent feature in the periodograms of Be stars, where inhomogeneities in the inner disk may also contribute to the red noise. We have detected this kind of variability in 5 of the BeXBs with TESS data. One interesting difference between the frequency spectra of SGXBs and the BeXBs in this group is that the BeXBS also show isolated peaks at higher frequencies. This is notoriously evident in 4U 2206+54 (Fig. 14), RX J1037.5–5647 (Fig. 13) and KS 1947+300 (Fig. 14).
-
•
High-frequency signals (Fig. 2). About half of the BeXBS in our TESS sample display narrow peaks at frequencies above 6 . Typically, these peaks have lower amplitudes than those detected at lower frequencies but they are significant above the local noise level (i.e, S/N above 4).
Figures 12 to 14 show the TESS light curves and frequency spectra of the sources analyzed in this work.
4.2 Distribution of frequencies
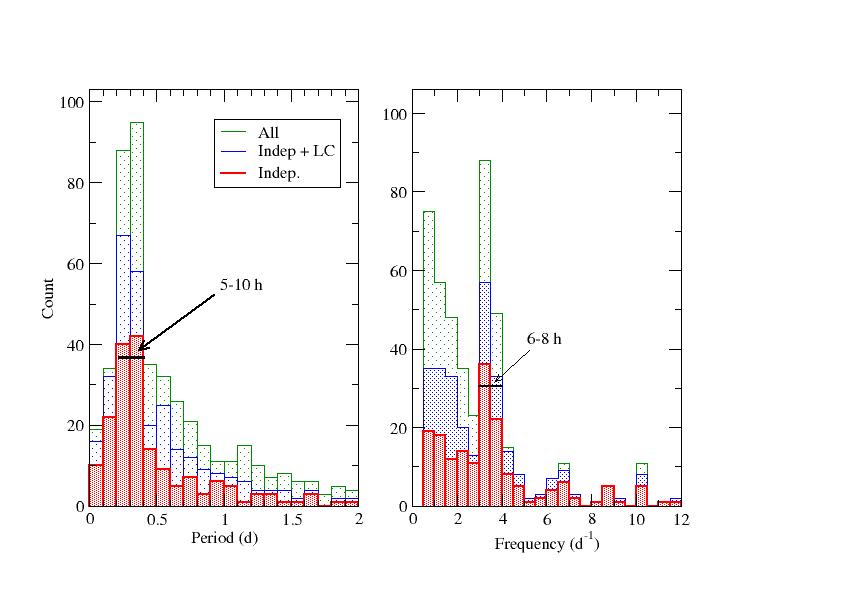
Figure 3 shows the distribution of the periods (left) and frequencies (right) of the signals detected in our sample of BeXBs. We use the word period in the general sense as the inverse of the frequency but it should be noted that it does not necessarily mean a stable signal with persistent variability. The green area corresponds to all detected modulations, the blue histograms represent the signals after the removal of closely spaced peaks, while the red lines represent the parent (i.e. independent) frequencies. Because we are interested in the variability from the Be star itself, we do not include periods longer than 2 days (or frequencies below 0.5 ), which most likely correspond to difference of higher frequencies (Baade et al. 2018a) or may be associated with stochastic variability or inhomogeneities in the disk. The distribution of periods is clearly dominated by fast time variability. This type of variability in BeXBs occur mainly on time scales faster than hr. The peaks of the distributions correspond to modulation of 5–10 hours. However, there is a significant number of periods shorter than hr ( ). The frequency histogram shows a secondary maximum at lower frequencies, suggesting that variability on time scales day is also important in BeXBs.
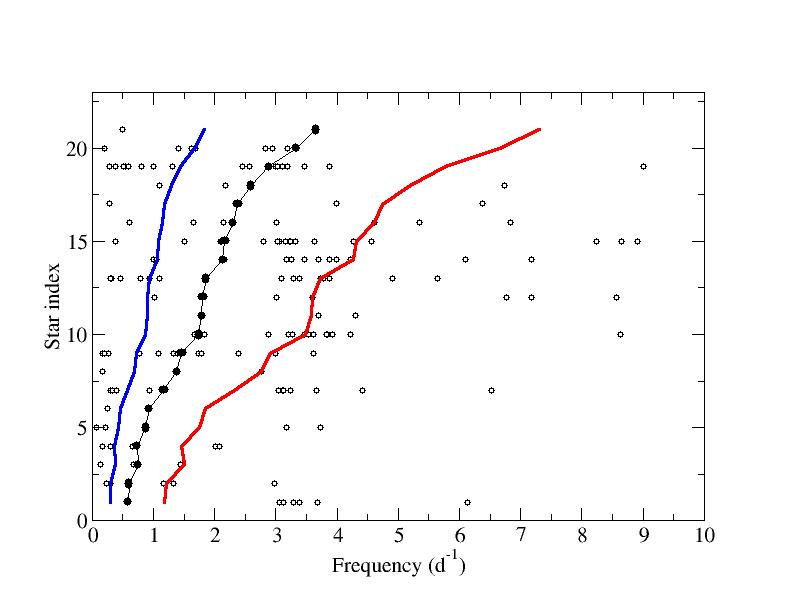
The dominant frequencies of each star in the sample are shown in Fig. 4. In this figure, we ordered the systems taking into account the strongest frequency. We assigned a number sequentially from the lowest to the highest amplitude ( axis). The filled black circles represent the strongest frequency, while the lines correspond to 0.5 and 2 times that frequency. We note that about half of the BeXBs display an approximately 2:1 harmonic relation with respect to the dominant frequency (see circles over the red line in Fig. 4).
4.3 Stars showing light outbursts
Although there is general agreement that the disk is fed from material from the photosphere of the Be star and not from an external source (as it would be in the case of an accretion disk), the details of how matter overcomes the gravitational potential of the massive star are not clear. Outbursts in Be stars are sudden increases or decreases of the light brightness by a few percent over a few days, followed by a return to the baseline brightness previous to the outburst. They are interpreted as episodes of mass transfer from the star to the disk, and are recorded as light as well as line emission variation (Rivinius et al. 1998; Huat et al. 2009; Rivinius et al. 2016; Semaan et al. 2018; Labadie-Bartz et al. 2022). For a detailed study of the effects of time variable mass loss rates on the structure of the disk and its observational consequences, the reader is referred to Haubois et al. (2012).
Frequency analysis of Be stars have demonstrated that the variability observed at various phases of an outburst translates into different pulsational behavior. One of the observational consequences of these outbursts is the appearance and disappearance of certain frequencies at different stages of the outbursts and the transfer of amplitude between frequencies in the periodogram (Huat et al. 2009). Another strong observational difference is the larger oscillation amplitude during the rise and peak of the outburst compared to its decay (Semaan et al. 2018). Finally, the emergence of a group of frequencies during the brightening phase has been also attributed to outbursts (Huat et al. 2009; Labadie-Bartz et al. 2022).
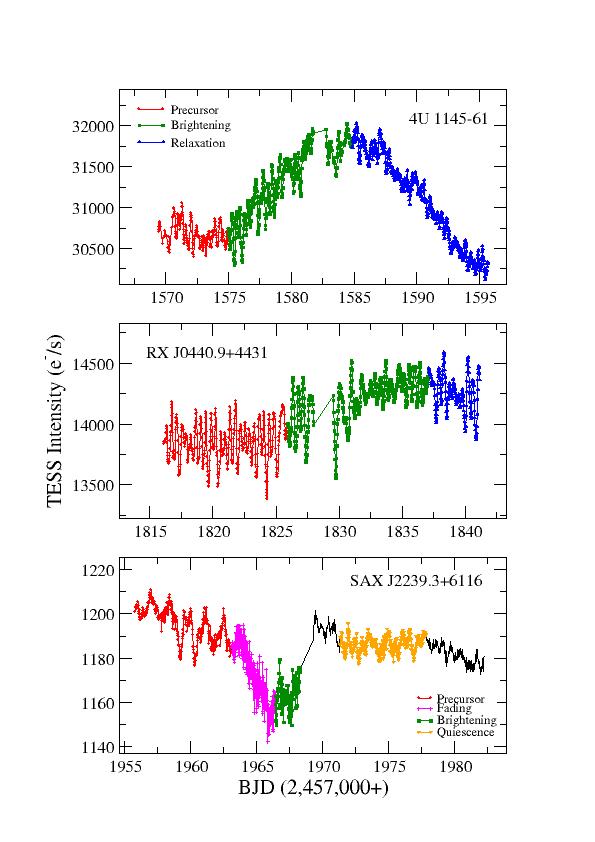
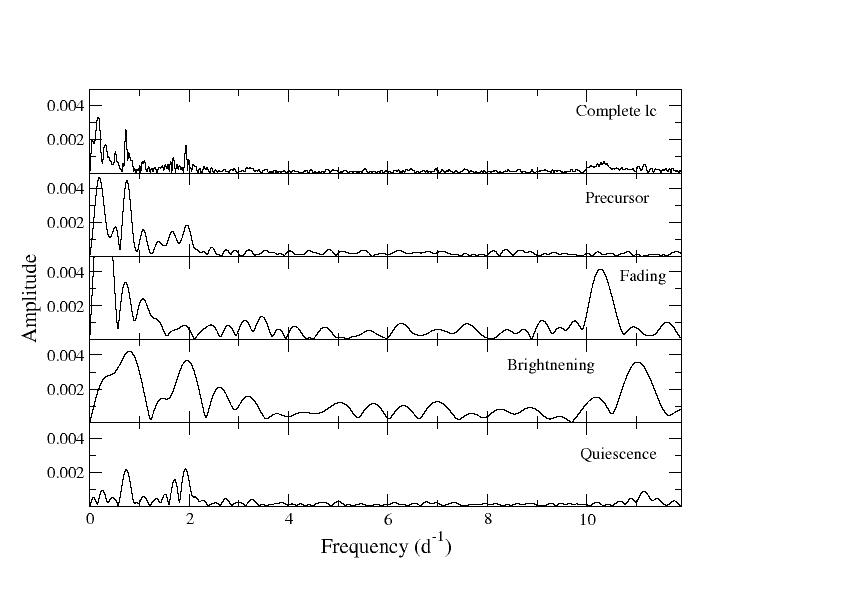
From the inspection of the no-rectified TESS light curves, outbursts as light brightening were detected in 4U 0115+63, 1A 1118–616, 4U 1145–61 and RX J0440.9+4431. An outburst as a light fading was found in SAX J2239.3+6116. To study the temporal variations in the frequency spectrum we divided the light curves containing outbursts in four separated phases, as in Huat et al. (2009) and Semaan et al. (2018), following the schematic picture proposed by Rivinius et al. (1998), based on spectra. These phases are quiescence, precursor, brightening or fading, and relaxation. During the quiescent phase, the mean flux is stable and variability is dominated by oscillations. The precursor phase corresponds to a slight decrease in flux prior to the rise or fade. The brightening or fading phase is when the flux gradually increases or decreases. During the relaxation phase, the star slowly recovers the phase of quiescence.
We have performed a frequency analysis for each phase of the outbursts separately, to study the possible variations of the pulsational behavior related to the outburst. However, the detailed analysis of the changes expected was hampered for the short time interval covered by TESS sectors, which translates into a low frequency resolution in the periodograms.
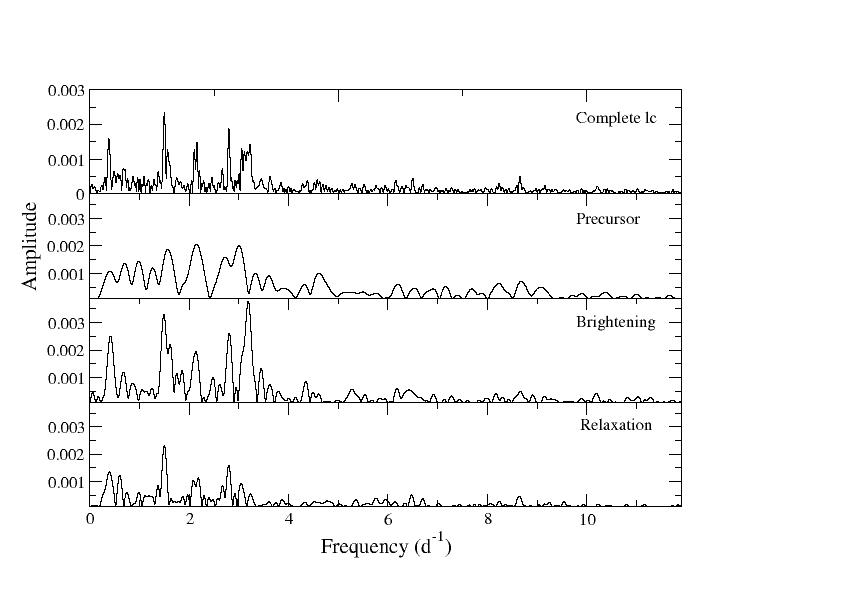
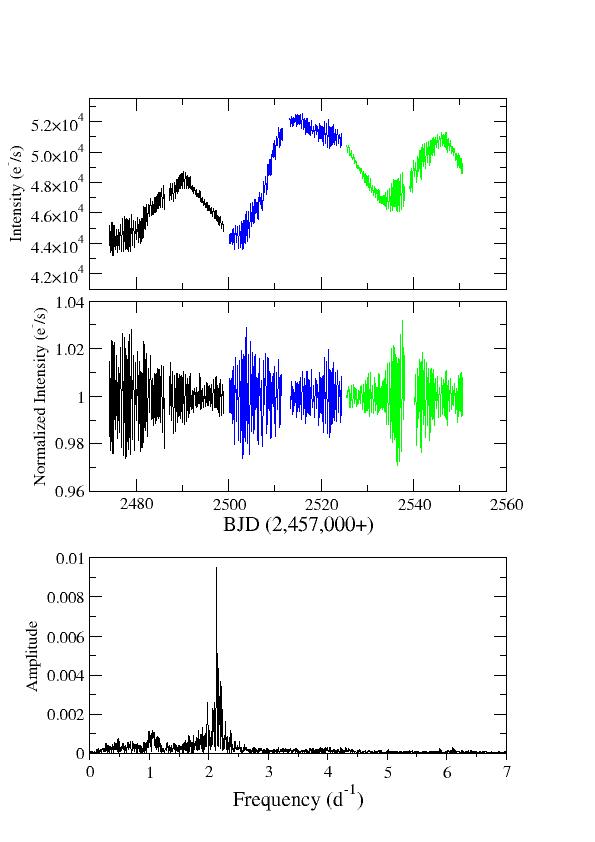
In Fig. 5 (top panel) we present the TESS light curve during sector 10 in 4U 1145–61, which can be separated into three phases (precursor, brightening, and relaxation) that would correspond to a light outburst. The low frequency resolution of the precursor spectrum does not allow a meaningful comparison with the other two phases. However, the frequency spectra during the brightening and relaxation phases were markedly different (Fig. 6). Not only the amplitude of the dominant frequencies at 0.4, 1.5, and 2.8 exhibited larger amplitude during the brightening phase, but also a new frequency emerged at 3.2 , which could be associated with the 2.8 or be the harmonic of the 1.5 oscillation.
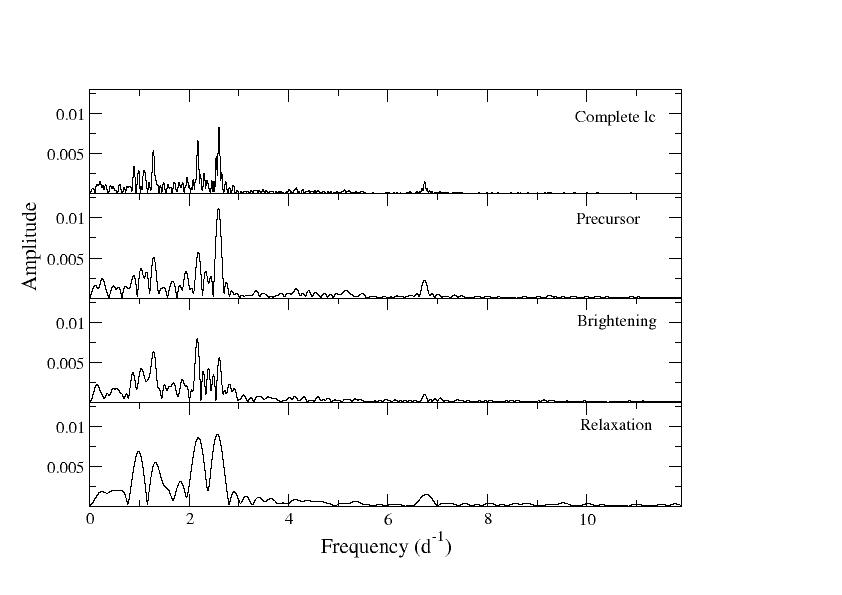
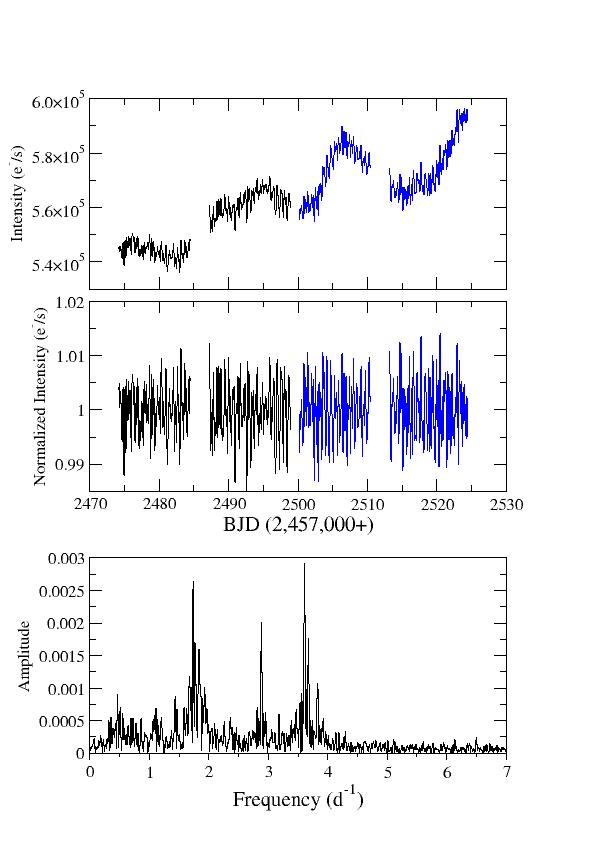
The TESS light curve of RX J0440.9+4431 (sector 19) shows evidence for an outburst, where a precursor phase, a brightening or outburst phase, and a relaxation phase can be distinguished (middle panel in Fig. 5). However, the short duration of the relaxation phase leads to a low-resolution frequency spectrum, which makes the comparison with other phases difficult (Fig 7). We observed the appearance of a frequency at 1.9 in the precursor phase that was not seen in the brightening or relaxation phases. The amplitude of the dominant peak in the complete light curve at 2.6 decreased significantly during the brightening phase. It seems that part of the amplitude to that peak shifted to the second (in significance) peak, namely that at 2.2 . During the precursor phase the ratio of the amplitudes was . It reversed during the brightening phase, while it was 1 during the relaxation phase.
In the light curve (sector 24) of SAX J2239.3+6116, the outburst appears as a light fading with a subsequent recovery of the mean brightness (bottom panel in Fig. 5). The low resolution of the periodograms prevented a detailed analysis of the variations in the frequency spectra. However, a remarkable feature is the appearance of a strong high frequency signal at 10.5 in the fading phase, which is completely absent in the precursor phase. In the relaxation phase this signal was still present with about half of the amplitude, but a new, strong signal appeared at 12 (Fig 8). Both high frequency peaks almost disappeared in the subsequent phase of quiescence.
For the remaining stars, the low resolution of the periodograms also prevented a detailed analysis. In 1A 1118–616 the TESS light curve of sector 10 shows two short episodes of brightening and relaxation and a subsequent phase of quiescence. During the second brightening phase an oscillation at 2.1 emerged, which was not present in the relaxation or quiescence phases. In 4U 0115+63 even the presence of an outburst is uncertain, as it is very short and with a low amplitude, although a few low amplitude peaks are apparent in the brightening phase, at frequencies between 5 and 6 , which were no longer present in the relaxation and quiescent phases.
A common feature observed from space photometry is the appearance of frequencies about 10-20% lower than a nearby strong stellar frequency during the episodes of mass ejection. They are interpreted as arising in the circumstellar environment due to an inhomogeneous distribution of the recently ejected material orbiting the star (Štefl frequencies, stefl98; Baade et al. (2016)). We have not detected this kind of frequencies in any of the BeXBs light curves presenting outbursts, although most probably the low resolution of our periodograms would have prevented their detection if they were present.
On the other hand, Labadie-Bartz et al. (2022) have found that all Be stars exhibiting outbursts also display one or more frequency groups, suggesting a strong link between these features. This is also the case with the five BeXB stars discussed in this section.
In summary, the fact that we observe similar features in the light curves of BeXBs and classical Be stars strengthens the view that they share the same mass-loss mechanism that lifts matter into an orbit where viscosity takes over to form a Keplerian disk. These common features are: the appearance and disappearance of frequencies, the shift in the amplitude between certain frequencies, the larger oscillation amplitude during the rise of the outburst and the emergence of groups of frequencies during the brightening phase.
4.4 Stars showing slow variability
A common variability pattern of classical Be stars is the presence of mid to long term quasi-periodic variability, with time scales from a few days to months or even years. A relationship between the variations of the mean magnitude and the amplitude of the fast variability due to non radial pulsations has be seen in many Be stars: when the amplitude of the fast variability increases, the mean brightness of the star increases as well. Since the mean brightness is sensitive to the amount of matter in the inner disk, such correlations probably show that the in-phase superposition of NRP modes can provide a mechanism to lift matter into the circumstellar disk (baade17; Baade et al. 2018a; Labadie-Bartz et al. 2021).
We have inspected all the original, non-rectified TESS light curves of our sources, in order to detect long-term variability and to study whether the relationship between slow and fast variability described in the previous paragraph holds for the donor stars in BeXB systems. Note that this kind of variability is different from the outbursting behaviour analysed in the previous subsection: we refer as long-term variability the smooth oscillations around the mean brightness, while outbursts are sudden increases or decreases of brightness followed by a return to the baseline flux.
Almost all stars in our sample present some kind of long-term variability. However, as the timescales of this variability are in general much larger than the time span of the TESS sectors (27 days), in most cases we only observe a monotonous brightening or fading behaviour, which prevent us to compare different phases of the long-term variability with changes in the amplitude of the short-term variability. Only two stars present quasi-periodic variability with a timescale short enough to include several maxima and minima within a few consecutive TESS sectors. They are 1A 0535+26 and X Per. In 4U 1145–61 the shape of the light curve could be interpreted both as a long-term variability or as an outburst (see Fig. 5). We have finally considered it as an outburst due to the marked differences between the frequency spectra at the different light curve phases, including the emergence of a new frequency, as described in the previous subsection. This behaviour is more characteristic of the outbursts than of the smooth long term variability.
1A 0535+26 was observed by TESS in sectors 43 to 45. The light curve displays a quasi-sinusoidal long term variability, with and amplitude of about 15% in flux (Fig. 9, top panel). The light curve also presents short term variability. The frequency analysis reveals the characteristic pattern of two frequency groups, centered around 1 and 2 . The most significant frequency, at 2.13 and with amplitude of about 1%, belongs to the second group.
There is a clear correlation between the short and long term variability. The complete light curve includes three local maxima. It can be seen than the amplitude of the short term oscillations varies along all the light curve, with a fixed pattern with respect to the long term variability: the amplitudes of the former are higher after each local minima, and gradually diminish along the ascending branches up to the maxima. After each maxima the amplitude reach the lowest values.
Before the first maximum, the high amplitude of the oscillations corresponds to the in-phase superposition of frequencies in the first and, mainly, in the second group. Before the other two maxima the behaviour is slightly different. The highest amplitude oscillations at the beginning of the brightening phase correspond to in-phase superposition of frequencies of the second group. Later on, the amplitude of these frequencies decline, while frequencies of the first group present in-phase superposition.
This behaviour is consistent with the general trend observed in classical Be stars where, as stated above, the mean brightness of the star starts to increase when the amplitude of the fast variability reaches its maximum value.
X Persei was observed by TESS in sectors 18, 43 and 44. In all of them it presents long term variability. In Fig. 10, top panel, we display the light curve of sectors 43 and 44, which includes three local maxima and the rise to a fourth one. The frequency spectrum also presents the two frequency groups pattern, with groups at 1.8 and 3.6 . In addition, there is a significant high frequency at 2.8 , isolated from any group, which appears in sectors 43 and 44 but is not present in sector 18. However, unlike 1A 0535+26, the frequency spectrum of X Persei does not present any significant variation along the different phases of the long-term light curve.
5 Discussion
We have performed the first systematic analysis of the short-term variability of Be stars in BeXBs. The main goal of this project was to search for periodicities in the range of a few hours to days in the optical counterparts to BeXBs and see whether the patterns of variability agree with the expected behavior of classical Be stars. This is the third paper of a series to study the global optical variability of BeXBs. The first paper of the series investigated the properties of their long-term photometric variability (Reig & Fabregat 2015) and the second paper of their spectral variability (Reig et al. 2016). An important addition of this work with respect to the previous ones is the fact that the use of space-based observations allowed us to expand our sample of sources to the Southern hemisphere.
5.1 Comparison with B and classical Be stars
There are two main types of pulsating early-type stars: the slowly pulsating B stars (SPB) and the Cephei variables. Cephei variables are a group of early B multi-periodic pulsators which exhibits short-term variations of brightness, radial velocity and line profiles (Sterken & Jerzykiewicz 1993; Aerts & De Cat 2003; Stankov & Handler 2005). They are characterized by temperatures in the range (spectral types B0–B2.5), luminosities , and masses (Burssens et al. 2019). Pulsation periods range from 0.067 to 0.35 days (3–15 ) and are associated with low-order -modes and/or -modes. SPB stars (Waelkens 1991; De Cat & Aerts 2002) differ from the Cephei in terms of temperature and mass, as they extend to the bottom of the B-type main sequence (B9, ). Recent models indicate that their instability domain extends up to the upper main sequence, and hence there is a large overlap with the Cephei instability domain (Miglio et al. 2007). The pulsation periods are typically 0.5–3 days (0.3–2 ) in SPB stars. These periods are interpreted as NRPs of high-order -modes (De Cat & Aerts 2002). Most Cephei and SPB stars are multi-periodic, which causes beating phenomenon with periods of weeks to months in Cephei and months to years in SPBs. The identification of NRPs with the optical variability of SPB and Cephei stars has long been recognized (Osaki 1974; Telting et al. 1997; Schrijvers & Telting 2002; Berdyugina et al. 2003; Telting et al. 2006; Pigulski & Pojmański 2008; Degroote et al. 2009; Labadie-Bartz et al. 2020). Due to the overlaping instability domains, several pulsating B-type stars have been identified to show both low-frequency and high-frequency pulsations. They are called SPB/ Cep hybrid pulsators (Chapellier et al. 2006; De Cat et al. 2007; Handler et al. 2009; Balona et al. 2011, 2015).
Classical Be stars are expected to pulsate as they are placed in the HR diagram in the instability domains of the Cep and SPB variables. Indeed, Be stars have been found to show a higher level of pulsational variability than non emission-line stars of the same spectral types (Diago et al. 2008), and, more recently, the analysis of high precision photometric time series from space observatories have revealed that non-radial pulsations are ubiquitous among them (Baade & Rivinius 2020).
The most common feature of the frequency spectra of Be stars is the presence of frequency groups, as described in the previous section. Another common feature is the long-term quasi-periodic or irregular variability, which appears as low-frequency or stochastic signals in the frequency spectrum. Both these patterns are not present in the frequency spectra of the slowly rotating Cep and SPB stars.
Isolated signals, both at low (lower than 3 ) and high (higher than 6 ) frequencies are also found in the periodogram of Be stars. The low frequency signals could be interpreted as high-order g-modes characteristic of SPB stars, while the high-frequency ones could be associated with Cep p-modes. However, the ascription of a particular signal to a g- or p-mode type pulsations based only in its frequency is very uncertain because the observed frequency can differ significantly from the actual frequency in the co-rotating frame of the star when the rapid rotation of Be stars is taken into account (cox84).
Stochastic variability is also present in the frequency spectra, as has been pointed out for some Be stars observed from space (Baade et al. 2016). Stochastic signals of astrophysical origin are induced in the frequency spectrum by non periodic variability, and it is strongest at the lower frequencies.
Another common feature of the Be stars’ variability are the outbursts, sudden increases or decreases of brightness which are interpreted as associated with episodes of mass transfer from the star to the circumstellar disk.
The present work reveals that BeXBs also display all this kind of variability. To compare the nature of the BeXBs variability with that of classical Be stars we will confront our results of the previous sections with those obtained by Labadie-Bartz et al. (2022) for a larger sample of Be stars observed by TESS during the first year of the mission. In this comparison, we take into account that the spectral type distribution in BeXB lies in the narrow range O9-B2, with a peak around B0 (Negueruela 1998; Reig et al. 2017), and hence we compare our results with those of the early group (B3 and earlier) defined by Labadie-Bartz et al. (2022).
As stated above, one of the main characteristics of the Be stars’ variability is the presence of frequency groups. Although several interpretations have been put forward to explain the existence of these groups, the favoured explanation is that the second group is normally associated with NRP, while the first and third groups are built from differences and sums and/or harmonics (Baade et al. 2018b). Alternatively, the groups might result from non-coherent variations associated with photospheric inhomogeneities or gas clouds. In this case, the mean frequency of the intermediate group would correspond to the rotation frequency, and the third group to its first harmonic (Balona & Ozuyar 2020, 2021). In our sample of BeXBs we found this pattern to be present in 14 out of 21 sources studied, which means 67% of the sample. In the sample studied by Labadie-Bartz et al. (2022), about 91% (199 of 218) of the early-type stars (earlier than B3) displayed two or three frequency groups. Among the systems with frequency groups, we found that about 70% of those BeXBs showed the typical configuration of two or three groups with the third group approximately located at twice the frequency of the second group. This compares to 85% in Labadie-Bartz et al. (2022).
Four stars in our sample (18%) contain isolated signals which do not belong to frequency groups. In five stars (24%) we found stochastic variability. These figures compare with the 22% and 33% respectively found by Labadie-Bartz et al. (2022) in their early group for the same kind of variability.
About half of the BeXBS in our sample display significant, isolated peaks at frequencies above 6 . In this case our results differ from those of Labadie-Bartz et al. (2022), who only found this pattern present in the 18% of their early type sample. This is the only feature in which our sample differs from the main values for classical Be stars as obtained by these authors.
We detect light outbursts in five stars in our sample (24%), to be compared with the 30% found by Labadie-Bartz et al. (2022). These authors also found that all system exhibiting outbursts (called flickers) present frequency groups, suggesting a strong link between these features. In our case, all five stars displaying light outbursts also present the frequency groups pattern.
Almost all BeXB stars in our sample display long-term variability. In two of them, 1A 0535+26 and X Per, several maxima and minima are included in a few consecutive TESS sectors, which allowed us to compare the phases of the slow variability wit the amplitudes of the fast oscillations. In 1A 0535+26 there is a clear correlation between the short and long term variability: the amplitude of the fast oscillations reach their maximum value immediately after each local minima, when the mean magnitude starts to increase, and diminish up to their minimum value after the maxima, when the star brightness fades. This behaviour has been observed in several classical Be stars (see, for instance, Appendix B in Labadie-Bartz et al. (2021)), and can be interpreted in terms of that non radial pulsations at its maximum amplitude somehow lifts matter into the disk, increasing the mean brightness of the star. For X Per, however, there is not any detectable variation of the fast oscillations amplitude along the different phases of the long-term variability.
Hence we can conclude that the variability patterns of the BeXBs are the same that those of classical Be stars, and both populations are indistinguishable in terms of pulsational characteristics. As the Be stars in BeXBs systems are the product of mass transfer in a close binary, our results would indicate that the structure of a post-mass transfer star is similar to that of an isolated star of similar mass. Or, alternatively, that most -or all- classical Be stars underwent mass transfer episodes in their past.
5.2 BeXBs and SGXBs
| System | Frequency | Period | Epochs |
|---|---|---|---|
| () | (hour) | ||
| 4U 0115+63 | 3.33 | 7.2 | 2008,2009,2018,2020 |
| 4U 0115+63 | 1.7 | 14.1 | 2009,2018 |
| RX J0146.9+6121 | 2.9, 9.7 | 8.3, 2.5 | 2005-07,2018 |
| X Per | 3.61, 3.83 | 6.6, 6.3 | 2019,2021 |
| RX J0812.4–3114 | 2.88 | 8.3 | 2019,2021 |
| GRO 1008–57 | 2.98, 10.19 | 8.05, 2.35 | 2019,2021 |
| RX J1037.5–5647 | 0.31, 4.91, 5.64 | 77.4, 4.89, 4.26 | 2019,2021 |
| 1A 1118–616 | 0.93, 3.24, 4.42, 6.53 | 25.8, 7.4, 5.4, 3.7 | 2019,2021 |
| 4U 1145–61 | 2.16, 4.57, 8.65 | 11.1, 5.25, 2.77 | 2019,2021 |
| GRO J2058+42 | 2.37 | 10.13 | 2005,2019 |
| SAX J2239.3+6116 | 0.73 | 32.9 | 2019,2020 |
| SAX J2239.3+6116 | 1.93 | 12.4 | 2011,2020 |
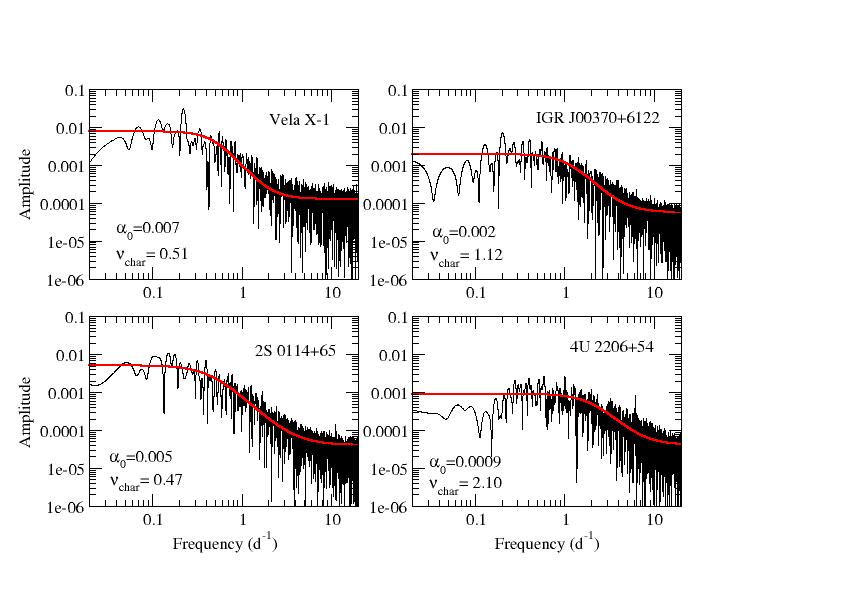
The main physical difference between SGXBs and BeXBs is the way in which mass is transferred between the optical donor and the neutron star. Supergiants have strong stellar winds, while in BeXBs the main source of matter available for accretion is the circumstellar disk. A visual inspection of the frequency spectra of BeXB and SGXB (see Fig. 11) reveals that the different luminosity class of the mass donor star leads to a different characteristic pattern of the frequency spectra between BeXBs and SGXBs. The periodograms of the three SGXBs analyzed in this work are characterized by stochastic low-frequency variability and the lack of significant oscillations above . The stochastic low-frequency variability shows up as red noise, that is, as noise whose amplitude decreases towards higher frequencies. On top of the red noise component, coherent oscillations may also be present in the lower luminosity supergiant stars (Bowman et al. 2019b). The stochastic low-frequency variability in supergiant stars has been explained as the interaction between internal gravity waves triggered by core and/or envelope convection and the stellar wind (Aerts et al. 2017; Bowman et al. 2019b).
The peculiar system 4U 2206+54 represents an interesting case for the comparison of the pulsational properties between BeXBs and SGXRs. 4U 2206+54 is the only (together with LS 5039, for which there are no TESS data available) permanent wind-fed HMXB with a main-sequence donor (Ribó et al. 2006). The frequency spectrum of 4U 2206+54 also shows a red noise pattern. There are however two interesting differences between wind-fed BeXBs and the most luminous supergiants 2S 0114+64 and Vela X–1. The first difference is the fact that the frequency spectrum of the supergiant systems, including the less luminous system IGR J00370+6122 is completely featureless above 2 , whereas 4U 2206+54 shows a significant isolated peak at 6.14 , which is reminiscent of a -mode NRP. This difference is best illustrated in Fig. 14. The lack of isolated high-frequency peaks in OB-type supergiant systems is expected, as the instability domains in the HR diagram for p- and g-mode NRP are restricted to the main sequence (Miglio et al. 2007).
Another example is RX J1037.5–5647. This BeXB has never shown a large X-ray outburst. It has been observed at different X-ray luminosity levels ranging between and erg s-1 (Reig & Roche 1999a; Cusumano et al. 2013), which is typical of wind-fed accretors. The spectral type of the primary is B0 III-V (Motch et al. 1997). Indeed, this source shows a mixed pattern in its periodogram with red noise and isolated high-frequency peaks.
The lack of isolated high-frequency peaks in supergiant systems is statistically a sound result. Bowman et al. (2019b) assembled a sample of 167 hot massive stars (91 supergiants and 76 stars with luminosity class III-V or unknown luminosity) with the purpose of investigating the incidence of coherent modes and stochastic variability. Only two supergiant systems showed Cephei like pulsations, while all (except one) type Ia supergiants (29 systems) exhibited a frequency spectrum consistent with internal gravity waves (i.e. red noise) without any other kind of modulation. Only one system presented a modulation that could be attributed to rotation by a clumpy aspherical wind.
The second difference between BeXBs and SGXBs is illustrated in Fig. 11. This figure shows the frequency spectra of the three SGXB and 4U 2206+54 in log-log scale. We note that the red noise extends to higher frequencies in the wind-fed BeXB 4U 2206+54. To assess this effect we fitted the spectrum with the function (see Bowman et al. 2019b)
| (4) |
where is the amplitude at zero frequency, is the logarithmic amplitude gradient, represents the characteristic frequency, which is the inverse of the characteristic timescale, , of the stochastic variability, and is a white noise term. The solid red line in Fig. 11 represents the best fit. The characteristic frequency is given in the bottom left corner of each plot. The luminous supergiant systems Vela X–1 and 2S 0114+65 show larger amplitude at low frequency (higher parameter ) but this amplitude falls down faster (lower parameter ) than in the wind-fed main-sequence system 4U 2206+54. The less luminous SGXB IGR J00370+6122 adopts intermediate values. The amplitude at zero frequency and characteristic frequency for RX J1037.5–5647 are and , in good agreement with 4U 2206+54. This result agrees with the findings of Bowman et al. (2019b), who found a correlation between the luminosity of the star and the characteristic frequency of their amplitude spectra: the more luminous the source, the lower the characteristic frequency.
We note that the usage of equation (4) assumes that there is no low-frequency contribution from the disk. However, in Be stars, the inner disk often makes a contribution to the red noise. The fact that even with this contribution the amplitude of the low-frequency noise is higher in supergiant systems strengthens the differences between BeXBs and SGXBs.
5.3 Comparison with previous results and stability of the pulsations
In this section we compare our results from the ground-based photometry with those of the TESS analysis and also with previous work. Also, because some sources were observed by TESS at two different epochs, we can assess the stability of the detected modulations over some period of time. TESS observed the southern ecliptic hemisphere during Year 1 (July 2018–July 2019) and during Year 3 (July 2020-July 2021) of the mission and the northern hemisphere during Year 2 (July 2019-July 2020) and partly during Year 4 (July 2021-September 2022) of the mission. Table 2 gives the frequencies and periods of signals that are detected at two or more different epochs separated in time by at least two years. All systems observed in more than one epoch show at least one stable signal.
We found only three reports on short-term photometric periodicities of BeXB in the bibliography, corresponding to LS I +61235/RX J0146.9+6121 (Sarty et al. 2009), GRO J2058+42 (Kızıloǧlu et al. 2007), and 4U 2206+54 (Bugno et al. 2009, see also Hintz et al. 2009) based on ground-based observations.
Observations performed during 2005 to 2007 revealed three frequencies at 2.914, 1.523 and 9.679 in the band light curve of LS I +61235/RX J0146.9+6121 with an estimated uncertainty of (Sarty et al. 2009). The 2.91 and 9.67 modulations were interpreted as NRPs, while the 1.52 (0.67 d) period as the rotation of the Be star. We detect the same two frequencies attributed to NRPs in our observations obtained 11 years later (2018). Because the time span of our ground-based observations was relatively short (4 days), we could not firmly detect the 1,5 frequency. Nevertheless, we detect a modulation at 1.4 , which might be identified with the 1.5 peak.
Kızıloǧlu et al. (2007) performed a time series analysis of the light curve of GRO J2058+42 obtained from the ROTSEIIId robotic reflecting ground-based telescopes in 2005 and 2006 over 476 days. The light curve contained a total of about 1440 data points. They found two closely spaced significant frequencies at 2.371 and 2.404 , with an estimated error of . These modulations were attributed to NRPs. Our ground-based observations, which were taken in July 2020, also revealed a modulation at . Interestingly, a frequency was also detected by TESS in August 2019, although we point out that the data would not permit us to resolve the 2.371 and 2.404 c/d as separate frequencies.
We note that the circumstellar disk in both RX J0146.9+6121 and GRO J2058+42 during the older observations were smaller than during our observations, as indicated by the strength of the H line: Å and Å for RX J0146.9+6121 and GRO J2058+42 during the 2005-2207 and 2010 observations, respectively. These values compare to Å and Å during our observations (P. Reig, unpublished). In fact, the 2005 observations of GRO J2058+42 coincided with almost the complete dissipation of the disk. Therefore, we conclude that the oscillations studied here are not related to the disk and favour a photospheric origin.
4U 2206+54 was observed for 22 nights during the Summer 2008 (HJD 2454631–2454680) by Bugno et al. (2009) and detected a modulation at . We confirm the presence of this periodicity in our ground-based observations in 2008. In this case, our observations are contemporaneous to those reported by these authors. Thus we cannot assess the stability of the pulsation over a long period of time. However, the fact that two different data sets obtained from different sites and instrumentation find the same frequency adds significance to the detection.
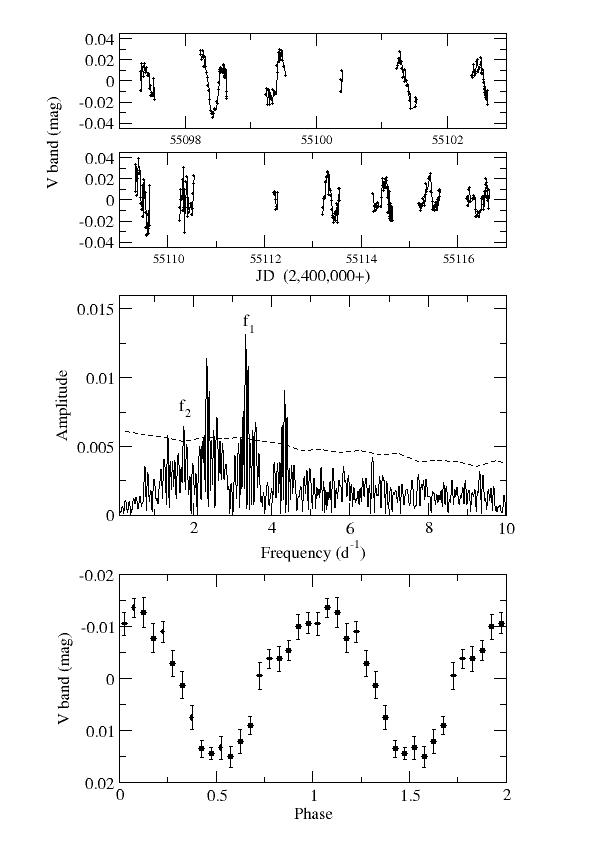
4U 0115+63 shows a very strong modulation at 3.33 that it is detected in data spanning more than 12 years. This frequency is detected not only during the two TESS epochs, but also during the ground-based observations taken in 2009 (see Fig. 1).
6 Summary and conclusions
This study has revealed that short-term variability is a very common if not ubiquitous feature intrinsic to BeXBs. Although the detection of modulated signals of the order of hours in early-type stars is not a rare phenomenon, this is the first time that a systematic study of the optical companions in BeXBs is performed. Our findings can be summarized as follow:
-
•
We have detected short-term variability of the order of minutes to hours in the light curves of the optical counterparts to all the high-mass X-ray binaries that we have analyzed.
-
•
The fact that all sources display multi-frequency oscillations and that some of the detected frequencies of the modulations are higher than the maximum allowed for rotation favors the interpretation that non-radial pulsations is the main driver of the fast time optical variability in BeXBs.
-
•
The distribution of frequencies in BeXBs shows a peak at around 3–4 (Fig. 3), but there is also a significant contribution at lower frequencies.
-
•
We have found that BeXBs and classical Be stars are indistinguishable in terms of pulsational characteristics. As in classical Be stars, BeXBs display frequency groups, long-term irregular variability, isolates signals, and light outbursts.
-
•
The light intensity variability of the Be star in BeXBs is also similar to that of classical Be stars. We have found both light outbursts and slow light variations (weeks to months). Light outbursts are characterized by sudden increases or decreases of the light brightness by a few percent over a few days, followed by a return to the baseline brightness previous to the outburst. These changes involve the transfer of power between certain frequencies as well as the appearance and/or disappearance of frequencies. Slow variability consists of smooth oscillations around the mean brightness.
-
•
In contrast, SGXBs and BeXBs can be distinguished by the shape of their frequency spectra. The periodograms of SGXBs are characterized by significant red noise and the lack of pulsations at high frequencies.
-
•
When data from different epochs are available, some modulations show stability on time scales of years. These stable signals cover a wide range in frequency. While a few could be consistent with the rotation of the Be star, the majority are too low or too high to have a rotational origin and demonstrate that pulsations can also be long lived.
Acknowledgements.
We are grateful to the referee Dr. D. Baade for his useful comments and suggestions which improved the original version of this work. This research has made use of the SIMBAD database, operated at CDS, Strasbourg, France and of NASA’s Astrophysics Data System operated by the Smithsonian Astrophysical Observatory. This research made use of Lightkurve, a Python package for Kepler and TESS data analysis (Lightkurve Collaboration, 2018). Funding for the TESS mission is provided by NASA’s Science Mission directorate. IRAF is distributed by the National Optical Astronomy Observatories, which is operated by the Association of Universities for Research in Astronomy, Inc. (AURA) under cooperative agreement with the National Science Foundation. We thank observers K. Triantafyllaki, H. Psarakis, G. Savathrakis and A. Tzoubanou and technical staff A. Kogentakis and V. Pantoulas for helping with the Skinakas observations. Skinakas Observatory is a collaborative project of the University of Crete and the Foundation for Research and Technology-Hellas. The Aras de los Olmos Observatory (OAO) is a facility of the Astronomical Observatory of the Valencia University (Spain). We thank O. Breviá and V. Peris for their support to the OAO observations. The work of J.F. has been funded by the project PID2019-109592GB-100/AEI/10.13039/501100011033 from the Spanish Ministerio de Ciencia e Innovación - Agencia Estatal de Investigación, and by the Generalitat Valenciana project of excellence Prometeo/2020/085.References
- Aerts et al. (2018) Aerts, C., Bowman, D. M., Símon-Díaz, S., et al. 2018, MNRAS, 476, 1234
- Aerts & De Cat (2003) Aerts, C. & De Cat, P. 2003, Space Sci. Rev., 105, 453
- Aerts et al. (2017) Aerts, C., Símon-Díaz, S., Bloemen, S., et al. 2017, A&A, 602, A32
- Albert et al. (2006) Albert, J., Aliu, E., Anderhub, H., et al. 2006, Science, 312, 1771
- Alfonso-Garzón et al. (2017) Alfonso-Garzón, J., Fabregat, J., Reig, P., et al. 2017, A&A, 607, A52
- Aragona et al. (2009) Aragona, C., McSwain, M. V., Grundstrom, E. D., et al. 2009, ApJ, 698, 514
- Arnason et al. (2021) Arnason, R. M., Papei, H., Barmby, P., Bahramian, A., & Gorski, M. D. 2021, MNRAS, 502, 5455
- Baade (1984) Baade, D. 1984, A&A, 134, 105
- Baade (1992) Baade, D. 1992, Nonradial pulsations of O- and B-stars, ed. U. Heber & C. S. Jeffery, Vol. 401, 143
- Baade et al. (2018a) Baade, D., Pigulski, A., Rivinius, T., et al. 2018a, A&A, 620, A145
- Baade & Rivinius (2020) Baade, D. & Rivinius, T. 2020, in Stars and their Variability Observed from Space, ed. C. Neiner, W. W. Weiss, D. Baade, R. E. Griffin, C. C. Lovekin, & A. F. J. Moffat, 35–38
- Baade et al. (2016) Baade, D., Rivinius, T., Pigulski, A., et al. 2016, A&A, 588, A56
- Baade et al. (2018b) Baade, D., Rivinius, T., Pigulski, A., et al. 2018b, in 3rd BRITE Science Conference, ed. G. A. Wade, D. Baade, J. A. Guzik, & R. Smolec, Vol. 8, 69–76
- Bailer-Jones et al. (2021) Bailer-Jones, C. A. L., Rybizki, J., Fouesneau, M., Demleitner, M., & Andrae, R. 2021, AJ, 161, 147
- Balona (2003) Balona, L. A. 2003, Ap&SS, 284, 121
- Balona (2017) Balona, L. A. 2017, MNRAS, 467, 1830
- Balona et al. (2015) Balona, L. A., Baran, A. S., Daszyńska-Daszkiewicz, J., & De Cat, P. 2015, MNRAS, 451, 1445
- Balona & Ozuyar (2020) Balona, L. A. & Ozuyar, D. 2020, MNRAS, 493, 2528
- Balona & Ozuyar (2021) Balona, L. A. & Ozuyar, D. 2021, ApJ, 921, 5
- Balona et al. (2011) Balona, L. A., Pigulski, A., Cat, P. D., et al. 2011, MNRAS, 413, 2403
- Baykal et al. (2000) Baykal, A., Stark, M. J., & Swank, J. 2000, ApJ, 544, L129
- Bellm et al. (2014) Bellm, E. C., Fürst, F., Pottschmidt, K., et al. 2014, ApJ, 792, 108
- Berdyugina et al. (2003) Berdyugina, S. V., Telting, J. H., Korhonen, H., & Schrijvers, C. 2003, A&A, 406, 281
- Bernhard et al. (2018) Bernhard, K., Otero, S., Hümmerich, S., et al. 2018, MNRAS, 479, 2909
- Bikmaev et al. (2008) Bikmaev, I. F., Burenin, R. A., Revnivtsev, M. G., et al. 2008, Astronomy Letters, 34, 653
- Bird et al. (2007) Bird, A. J., Malizia, A., Bazzano, A., et al. 2007, ApJS, 170, 175
- Blay et al. (2006) Blay, P., Negueruela, I., Reig, P., et al. 2006, A&A, 446, 1095
- Bonnet-Bidaud & Mouchet (1998) Bonnet-Bidaud, J. M. & Mouchet, M. 1998, A&A, 332, L9
- Bowman et al. (2019a) Bowman, D. M., Aerts, C., Johnston, C., et al. 2019a, A&A, 621, A135
- Bowman et al. (2019b) Bowman, D. M., Burssens, S., Pedersen, M. G., et al. 2019b, Nature Astronomy, 3, 760
- Bowman et al. (2020) Bowman, D. M., Burssens, S., Simón-Díaz, S., et al. 2020, A&A, 640, A36
- Braes & Miley (1972) Braes, L. L. E. & Miley, G. K. 1972, Nature, 235, 273
- Brasseur et al. (2019) Brasseur, C. E., Phillip, C., Hargis, J., et al. 2019, in Astronomical Society of the Pacific Conference Series, Vol. 523, Astronomical Data Analysis Software and Systems XXVII, ed. P. J. Teuben, M. W. Pound, B. A. Thomas, & E. M. Warner, 397
- Breger et al. (1993) Breger, M., Stich, J., Garrido, R., et al. 1993, A&A, 271, 482
- Bugno et al. (2009) Bugno, J. L., Hintz, E. G., & Joner, M. D. 2009, Information Bulletin on Variable Stars, 5911, 1
- Burenin et al. (2006) Burenin, R., Mescheryakov, A., Revnivtsev, M., Bikmaev, I., & Sunyaev, R. 2006, The Astronomer’s Telegram, 880, 1
- Burssens et al. (2019) Burssens, S., Bowman, D. M., Aerts, C., et al. 2019, MNRAS, 489, 1304
- Caballero-García et al. (2016) Caballero-García, M. D., Camero-Arranz, A., Özbey Arabacı, M., et al. 2016, A&A, 589, A9
- Camero et al. (2014) Camero, A., Zurita, C., Gutiérrez-Soto, J., et al. 2014, A&A, 568, A115
- Camero Arranz et al. (2007) Camero Arranz, A., Wilson, C. A., Finger, M. H., & Reglero, V. 2007, A&A, 473, 551
- Casares et al. (2014) Casares, J., Negueruela, I., Ribó, M., et al. 2014, Nature, 505, 378
- Casares et al. (2012) Casares, J., Ribó, M., Ribas, I., et al. 2012, MNRAS, 421, 1103
- Chapellier et al. (2006) Chapellier, E., Le Contel, D., Le Contel, J. M., Mathias, P., & Valtier, J. C. 2006, A&A, 448, 697
- Chenevez et al. (2004) Chenevez, J., Budtz-Jorgensen, C., Lund, N., et al. 2004, The Astronomer’s Telegram, 223
- Clark et al. (1975) Clark, G. W., Schmidt, G. D., & Angel, J. R. P. 1975, IAU Circ., 2843, 1
- Coe et al. (2007) Coe, M. J., Bird, A. J., Hill, A. B., et al. 2007, MNRAS, 378, 1427
- Coe et al. (1994) Coe, M. J., Roche, P., Everall, C., et al. 1994, A&A, 289, 784
- Corbet (1986) Corbet, R. H. D. 1986, MNRAS, 220, 1047
- Corbet et al. (2007) Corbet, R. H. D., Markwardt, C. B., & Tueller, J. 2007, ApJ, 655, 458
- Corbet & Peele (2000) Corbet, R. H. D. & Peele, A. G. 2000, ApJ, 530, L33
- Crampton et al. (1985) Crampton, D., Hutchings, J. B., & Cowley, A. P. 1985, ApJ, 299, 839
- Cranmer (2009) Cranmer, S. R. 2009, ApJ, 701, 396
- Cusumano et al. (2013) Cusumano, G., Segreto, A., La Parola, V., et al. 2013, MNRAS, 436, L74
- Cyr et al. (2017) Cyr, I. H., Jones, C. E., Panoglou, D., Carciofi, A. C., & Okazaki, A. T. 2017, MNRAS, 471, 596
- De Cat & Aerts (2002) De Cat, P. & Aerts, C. 2002, A&A, 393, 965
- De Cat et al. (2007) De Cat, P., Briquet, M., Aerts, C., et al. 2007, A&A, 463, 243
- Degroote et al. (2009) Degroote, P., Aerts, C., Ollivier, M., et al. 2009, A&A, 506, 471
- Delgado-Martí et al. (2001) Delgado-Martí, H., Levine, A. M., Pfahl, E., & Rappaport, S. A. 2001, ApJ, 546, 455
- den Hartog et al. (2006) den Hartog, P. R., Hermsen, W., Kuiper, L., et al. 2006, A&A, 451, 587
- Diago et al. (2008) Diago, P. D., Gutiérrez-Soto, J., Fabregat, J., & Martayan, C. 2008, A&A, 480, 179
- Doroshenko et al. (2016) Doroshenko, V., Tsygankov, S., & Santangelo, A. 2016, A&A, 589, A72
- Dower et al. (1977) Dower, R., Kelley, R., Margon, B., & Bradt, H. 1977, IAU Circ., 3144, 2
- Draper et al. (2014) Draper, Z. H., Wisniewski, J. P., Bjorkman, K. S., et al. 2014, ApJ, 786, 120
- Emilio et al. (2010) Emilio, M., Andrade, L., Janot-Pacheco, E., et al. 2010, A&A, 522, A43
- Eyles et al. (1975) Eyles, C. J., Skinner, G. K., Willmore, A. P., & Rosenberg, F. D. 1975, Nature, 254, 577
- Fabregat et al. (1992) Fabregat, J., Reglero, V., Coe, M. J., et al. 1992, A&A, 259, 522
- Ferrigno et al. (2013) Ferrigno, C., Farinelli, R., Bozzo, E., et al. 2013, A&A, 553, A103
- Finger et al. (2010) Finger, M. H., Ikhsanov, N. R., Wilson-Hodge, C. A., & Patel, S. K. 2010, ApJ, 709, 1249
- Finger et al. (1996) Finger, M. H., Wilson, R. B., & Chakrabarty, D. 1996, A&AS, 120, 209
- Forman et al. (1978) Forman, W., Jones, C., Cominsky, L., et al. 1978, ApJS, 38, 357
- Frémat et al. (2005) Frémat, Y., Zorec, J., Hubert, A.-M., & Floquet, M. 2005, A&A, 440, 305
- Galloway et al. (2004) Galloway, D. K., Morgan, E. H., & Levine, A. M. 2004, ApJ, 613, 1164
- Giacconi et al. (1972) Giacconi, R., Murray, S., Gursky, H., et al. 1972, ApJ, 178, 281
- Gies (2000) Gies, D. R. 2000, in Astronomical Society of the Pacific Conference Series, Vol. 214, IAU Colloq. 175: The Be Phenomenon in Early-Type Stars, ed. M. A. Smith, H. F. Henrichs, & J. Fabregat, 668
- González-Galán et al. (2014) González-Galán, A., Negueruela, I., Castro, N., et al. 2014, A&A, 566, A131
- Grebenev et al. (2004) Grebenev, S. A., Ubertini, P., Chenevez, J., Orr, A., & Sunyaev, R. A. 2004, The Astronomer’s Telegram, 275, 1
- Grundstrom et al. (2007a) Grundstrom, E. D., Boyajian, T. S., Finch, C., et al. 2007a, ApJ, 660, 1398
- Grundstrom et al. (2007b) Grundstrom, E. D., Caballero-Nieves, S. M., Gies, D. R., et al. 2007b, ApJ, 656, 437
- Grunhut et al. (2014) Grunhut, J. H., Bolton, C. T., & McSwain, M. V. 2014, A&A, 563, A1
- Gutiérrez-Soto et al. (2007a) Gutiérrez-Soto, J., Fabregat, J., Suso, J., et al. 2007a, A&A, 476, 927
- Gutiérrez-Soto et al. (2007b) Gutiérrez-Soto, J., Fabregat, J., Suso, J., et al. 2007b, A&A, 472, 565
- Haigh et al. (2004) Haigh, N. J., Coe, M. J., & Fabregat, J. 2004, MNRAS, 350, 1457
- Halpern (2006) Halpern, J. P. 2006, The Astronomer’s Telegram, 847, 1
- Halpern & Tyagi (2005) Halpern, J. P. & Tyagi, S. 2005, The Astronomer’s Telegram, 682
- Handler et al. (2009) Handler, G., Matthews, J. M., Eaton, J. A., et al. 2009, ApJ, 698, L56
- Haubois et al. (2012) Haubois, X., Carciofi, A. C., Rivinius, T., Okazaki, A. T., & Bjorkman, J. E. 2012, ApJ, 756, 156
- Haubois et al. (2014) Haubois, X., Mota, B. C., Carciofi, A. C., et al. 2014, ApJ, 785, 12
- Hintz et al. (2009) Hintz, E. G., Bugno, J. L., & Joner, M. D. 2009, Information Bulletin on Variable Stars, 5891, 1
- Huat et al. (2009) Huat, A.-L., Hubert, A.-M., Baudin, F., et al. 2009, A&A, 506, 95
- in’t Zand et al. (2000) in’t Zand, J. J. M., Halpern, J., Eracleous, M., et al. 2000, A&A, 361, 85
- in’t Zand et al. (2007) in’t Zand, J. J. M., Kuiper, L., den Hartog, P. R., Hermsen, W., & Corbet, R. H. D. 2007, A&A, 469, 1063
- in’t Zand et al. (2001) in’t Zand, J. J. M., Swank, J., Corbet, R. H. D., & Markwardt, C. B. 2001, A&A, 380, L26
- Ives et al. (1975) Ives, J. C., Sanford, P. W., & Bell Burnell, S. J. 1975, Nature, 254, 578
- Janot Pacheco et al. (1982) Janot Pacheco, E., Chevalier, C., & Ilovaisky, S. A. 1982, in IAU Symposium, Vol. 98, Be Stars, ed. M. Jaschek & H.-G. Groth, 151–154
- Janot-Pacheco et al. (1981) Janot-Pacheco, E., Ilovaisky, S. A., & Chevalier, C. 1981, A&A, 99, 274
- Janot-Pacheco et al. (1987) Janot-Pacheco, E., Motch, C., & Mouchet, M. 1987, A&A, 177, 91
- Kallinger et al. (2008) Kallinger, T., Reegen, P., & Weiss, W. W. 2008, A&A, 481, 571
- Kennea et al. (2017) Kennea, J. A., Lien, A. Y., Krimm, H. A., Cenko, S. B., & Siegel, M. H. 2017, The Astronomer’s Telegram, 10809, 1
- Kızıloğlu et al. (2007) Kızıloğlu, Ü., Baykal, A., & Kızıloğlu, N. 2007, Astronomische Nachrichten, 328, 142
- Kızıloǧlu et al. (2007) Kızıloǧlu, U., Kızıloǧlu, N., Baykal, A., Yerli, S. K., & Özbey, M. 2007, A&A, 470, 1023
- Kızıloǧlu et al. (2009) Kızıloǧlu, Ü., Özbilgen, S., Kızıloǧlu, N., & Baykal, A. 2009, A&A, 508, 895
- Klement et al. (2019) Klement, R., Carciofi, A. C., Rivinius, T., et al. 2019, ApJ, 885, 147
- Klement et al. (2017) Klement, R., Carciofi, A. C., Rivinius, T., et al. 2017, A&A, 601, A74
- Klement et al. (2022) Klement, R., Schaefer, G. H., Gies, D. R., et al. 2022, ApJ, 926, 213
- Koenigsberger et al. (2006) Koenigsberger, G., Georgiev, L., Moreno, E., et al. 2006, A&A, 458, 513
- Kouroubatzakis et al. (2017) Kouroubatzakis, K., Reig, P., Andrews, J., & Zezas, A. 2017, The Astronomer’s Telegram, 10822, 1
- Koyama et al. (1991) Koyama, K., Kawada, M., Tawara, Y., et al. 1991, ApJ, 366, L19
- Kretschmar et al. (2021) Kretschmar, P., El Mellah, I., Martínez-Núñez, S., et al. 2021, A&A, 652, A95
- Krivonos et al. (2007) Krivonos, R., Revnivtsev, M., Lutovinov, A., et al. 2007, A&A, 475, 775
- Kühnel et al. (2017) Kühnel, M., Fürst, F., Pottschmidt, K., et al. 2017, A&A, 607, A88
- Kühnel et al. (2013) Kühnel, M., Müller, S., Kreykenbohm, I., et al. 2013, A&A, 555, A95
- Kurtz et al. (2015) Kurtz, D. W., Shibahashi, H., Murphy, S. J., Bedding, T. R., & Bowman, D. M. 2015, MNRAS, 450, 3015
- Labadie-Bartz et al. (2021) Labadie-Bartz, J., Baade, D., Carciofi, A. C., et al. 2021, MNRAS, 502, 242
- Labadie-Bartz et al. (2022) Labadie-Bartz, J., Carciofi, A. C., Henrique de Amorim, T., et al. 2022, AJ, 163, 226
- Labadie-Bartz et al. (2020) Labadie-Bartz, J., Handler, G., Pepper, J., et al. 2020, AJ, 160, 32
- Labadie-Bartz et al. (2017) Labadie-Bartz, J., Pepper, J., McSwain, M. V., et al. 2017, AJ, 153, 252
- Lenz & Breger (2005) Lenz, P. & Breger, M. 2005, Communications in Asteroseismology, 146, 53
- Lewin et al. (1968) Lewin, W. H. G., Clark, G. W., & Smith, W. B. 1968, ApJ, 152, L49
- Lightkurve Collaboration et al. (2018) Lightkurve Collaboration, Cardoso, J. V. d. M., Hedges, C., et al. 2018, Lightkurve: Kepler and TESS time series analysis in Python, Astrophysics Source Code Library
- Loumos & Deeming (1978) Loumos, G. L. & Deeming, T. J. 1978, Ap&SS, 56, 285
- Lyubimkov et al. (1997) Lyubimkov, L. S., Rostopchin, S. I., Roche, P., & Tarasov, A. E. 1997, MNRAS, 286, 549
- Malacaria et al. (2017) Malacaria, C., Kollatschny, W., Whelan, E., et al. 2017, A&A, 603, A24
- Martin et al. (2014) Martin, R. G., Nixon, C., Armitage, P. J., Lubow, S. H., & Price, D. J. 2014, ApJ, 790, L34
- Martin et al. (2011) Martin, R. G., Pringle, J. E., Tout, C. A., & Lubow, S. H. 2011, MNRAS, 416, 2827
- Masetti et al. (2008) Masetti, N., Mason, E., Morelli, L., et al. 2008, A&A, 482, 113
- McBride et al. (2007) McBride, V. A., Wilms, J., Kreykenbohm, I., et al. 2007, A&A, 470, 1065
- McClintock et al. (1977) McClintock, J. E., Nugent, J. J., Li, F. K., & Rappaport, S. A. 1977, ApJ, 216, L15
- McClintock et al. (1976) McClintock, J. E., Rappaport, S., Joss, P. C., et al. 1976, ApJ, 206, L99
- Miglio et al. (2007) Miglio, A., Montalbán, J., & Dupret, M.-A. 2007, MNRAS, 375, L21
- Mihara et al. (1991) Mihara, T., Makishima, K., Kamijo, S., et al. 1991, ApJ, 379, L61
- Motch et al. (1997) Motch, C., Haberl, F., Dennerl, K., Pakull, M., & Janot-Pacheco, E. 1997, A&A, 323, 853
- Motch et al. (1988) Motch, C., Janot-Pacheco, E., Pakull, M. W., & Mouchet, M. 1988, A&A, 201, 63
- Munar-Adrover et al. (2016) Munar-Adrover, P., Sabatini, S., Piano, G., et al. 2016, ApJ, 829, 101
- Nakajima et al. (2015) Nakajima, M., Mihara, T., Ueno, S., et al. 2015, The Astronomer’s Telegram, 8007, 1
- Negueruela (1998) Negueruela, I. 1998, A&A, 338, 505
- Negueruela et al. (2003) Negueruela, I., Israel, G. L., Marco, A., Norton, A. J., & Speziali, R. 2003, A&A, 397, 739
- Negueruela & Okazaki (2001) Negueruela, I. & Okazaki, A. T. 2001, A&A, 369, 108
- Negueruela et al. (1999) Negueruela, I., Roche, P., Fabregat, J., & Coe, M. J. 1999, MNRAS, 307, 695
- Neiner et al. (2009) Neiner, C., Gutiérrez-Soto, J., Baudin, F., et al. 2009, A&A, 506, 143
- Nespoli & Reig (2011) Nespoli, E. & Reig, P. 2011, A&A, 526, A7
- Nespoli et al. (2012) Nespoli, E., Reig, P., & Zezas, A. 2012, A&A, 547, A103
- Okazaki et al. (2002) Okazaki, A. T., Bate, M. R., Ogilvie, G. I., & Pringle, J. E. 2002, MNRAS, 337, 967
- Okazaki et al. (2013) Okazaki, A. T., Hayasaki, K., & Moritani, Y. 2013, PASJ, 65, 41
- Okazaki & Negueruela (2001) Okazaki, A. T. & Negueruela, I. 2001, A&A, 377, 161
- Osaki (1974) Osaki, Y. 1974, ApJ, 189, 469
- Pakull et al. (2003) Pakull, M. W., Motch, C., & Negueruela, I. 2003, The Astronomer’s Telegram, 202, 1
- Panoglou et al. (2016) Panoglou, D., Carciofi, A. C., Vieira, R. G., et al. 2016, MNRAS, 461, 2616
- Pápics (2012) Pápics, P. I. 2012, Astronomische Nachrichten, 333, 1053
- Pápics et al. (2011) Pápics, P. I., Briquet, M., Auvergne, M., et al. 2011, A&A, 528, A123
- Pápics et al. (2017) Pápics, P. I., Tkachenko, A., Van Reeth, T., et al. 2017, A&A, 598, A74
- Paredes et al. (1997) Paredes, J. M., Marti, J., Peracaula, M., & Ribo, M. 1997, A&A, 320, L25
- Parkes et al. (1980) Parkes, G. E., Murdin, P. G., & Mason, K. O. 1980, MNRAS, 190, 537
- Pigulski & Pojmański (2008) Pigulski, A. & Pojmański, G. 2008, A&A, 477, 917
- Porter & Rivinius (2003) Porter, J. M. & Rivinius, T. 2003, PASP, 115, 1153
- Pradhan et al. (2013) Pradhan, P., Maitra, C., Paul, B., & Paul, B. C. 2013, MNRAS, 436, 945
- Priedhorsky & Terrell (1983) Priedhorsky, W. C. & Terrell, J. 1983, ApJ, 273, 709
- Raguzova & Popov (2005) Raguzova, N. V. & Popov, S. B. 2005, Astronomical and Astrophysical Transactions, 24, 151
- Raichur & Paul (2010) Raichur, H. & Paul, B. 2010, MNRAS, 406, 2663
- Rappaport et al. (1976) Rappaport, S., Joss, P. C., Bradt, H., Clark, G. W., & Jernigan, J. G. 1976, ApJ, 208, L119
- Reegen (2007) Reegen, P. 2007, A&A, 467, 1353
- Reig (2011) Reig, P. 2011, Ap&SS, 332, 1
- Reig et al. (2017) Reig, P., Blay, P., & Blinov, D. 2017, A&A, 598, A16
- Reig et al. (1996) Reig, P., Chakrabarty, D., Coe, M. J., et al. 1996, A&A, 311, 879
- Reig & Fabregat (2015) Reig, P. & Fabregat, J. 2015, A&A, 574, A33
- Reig et al. (2020) Reig, P., Fabregat, J., & Alfonso-Garzón, J. 2020, A&A, 640, A35
- Reig et al. (1997a) Reig, P., Fabregat, J., & Coe, M. J. 1997a, A&A, 322, 193
- Reig et al. (1997b) Reig, P., Fabregat, J., Coe, M. J., et al. 1997b, A&A, 322, 183
- Reig et al. (2007) Reig, P., Larionov, V., Negueruela, I., Arkharov, A. A., & Kudryavtseva, N. A. 2007, A&A, 462, 1081
- Reig et al. (2001) Reig, P., Negueruela, I., Buckley, D. A. H., et al. 2001, A&A, 367, 266
- Reig et al. (2004) Reig, P., Negueruela, I., Fabregat, J., et al. 2004, A&A, 421, 673
- Reig et al. (2005a) Reig, P., Negueruela, I., Fabregat, J., Chato, R., & Coe, M. J. 2005a, A&A, 440, 1079
- Reig et al. (2005b) Reig, P., Negueruela, I., Papamastorakis, G., Manousakis, A., & Kougentakis, T. 2005b, A&A, 440, 637
- Reig et al. (2016) Reig, P., Nersesian, A., Zezas, A., Gkouvelis, L., & Coe, M. J. 2016, A&A, 590, A122
- Reig & Roche (1999a) Reig, P. & Roche, P. 1999a, MNRAS, 306, 100
- Reig & Roche (1999b) Reig, P. & Roche, P. 1999b, MNRAS, 306, 95
- Reig et al. (2010a) Reig, P., Słowikowska, A., Zezas, A., & Blay, P. 2010a, MNRAS, 401, 55
- Reig et al. (2009) Reig, P., Torrejón, J. M., Negueruela, I., et al. 2009, A&A, 494, 1073
- Reig & Zezas (2014a) Reig, P. & Zezas, A. 2014a, A&A, 561, A137
- Reig & Zezas (2014b) Reig, P. & Zezas, A. 2014b, MNRAS, 442, 472
- Reig & Zezas (2018) Reig, P. & Zezas, A. 2018, A&A, 613, A52
- Reig et al. (2010b) Reig, P., Zezas, A., & Gkouvelis, L. 2010b, A&A, 522, A107
- Remillard & Marshall (2003) Remillard, R. & Marshall, F. 2003, The Astronomer’s Telegram, 197, 1
- Ribó et al. (2006) Ribó, M., Negueruela, I., Blay, P., Torrejón, J. M., & Reig, P. 2006, A&A, 449, 687
- Ricker et al. (2015) Ricker, G. R., Winn, J. N., Vanderspek, R., et al. 2015, Journal of Astronomical Telescopes, Instruments, and Systems, 1, 014003
- Rivinius et al. (2016) Rivinius, T., Baade, D., & Carciofi, A. C. 2016, A&A, 593, A106
- Rivinius et al. (1998) Rivinius, T., Baade, D., Stefl, S., et al. 1998, A&A, 336, 177
- Rivinius et al. (2003) Rivinius, T., Baade, D., & Štefl, S. 2003, A&A, 411, 229
- Rivinius et al. (2013) Rivinius, T., Carciofi, A. C., & Martayan, C. 2013, A&A Rev., 21, 69
- Rivinius et al. (2022) Rivinius, T., Klement, R., Chojnowski, S. D., et al. 2022, arXiv e-prints, arXiv:2208.12315
- Rosenberg et al. (1975) Rosenberg, F. D., Eyles, C. J., Skinner, G. K., & Willmore, A. P. 1975, Nature, 256, 628
- Saio et al. (2018) Saio, H., Kurtz, D. W., Murphy, S. J., Antoci, V. L., & Lee, U. 2018, MNRAS, 474, 2774
- Sarty et al. (2009) Sarty, G. E., Kiss, L. L., Huziak, R., et al. 2009, MNRAS, 392, 1242
- Schrijvers & Telting (2002) Schrijvers, C. & Telting, J. H. 2002, A&A, 394, 603
- Semaan et al. (2018) Semaan, T., Hubert, A. M., Zorec, J., et al. 2018, A&A, 613, A70
- Shrader et al. (1999) Shrader, C. R., Sutaria, F. K., Singh, K. P., & Macomb, D. J. 1999, ApJ, 512, 920
- Simón-Díaz et al. (2018) Simón-Díaz, S., Aerts, C., Urbaneja, M. A., et al. 2018, A&A, 612, A40
- Stankov & Handler (2005) Stankov, A. & Handler, G. 2005, ApJS, 158, 193
- Staubert et al. (2011) Staubert, R., Pottschmidt, K., Doroshenko, V., et al. 2011, A&A, 527, A7
- Stella et al. (1985) Stella, L., White, N. E., Davelaar, J., et al. 1985, ApJ, 288, L45
- Sterken & Jerzykiewicz (1993) Sterken, C. & Jerzykiewicz, M. 1993, Space Sci. Rev., 62, 95
- Stevens et al. (1997) Stevens, J. B., Reig, P., Coe, M. J., et al. 1997, MNRAS, 288, 988
- Stollberg et al. (1993) Stollberg, M. T., Finger, M. H., Wilson, R. B., et al. 1993, IAU Circ., 5836, 1
- Sugizaki et al. (2015) Sugizaki, M., Yamamoto, T., Mihara, T., Nakajima, M., & Makishima, K. 2015, PASJ, 67, 73
- Szewczuk et al. (2021) Szewczuk, W., Walczak, P., & Daszyńska-Daszkiewicz, J. 2021, MNRAS, 503, 5894
- Taylor et al. (1992) Taylor, A. R., Kenny, H. T., Spencer, R. E., & Tzioumis, A. 1992, ApJ, 395, 268
- Telting et al. (1997) Telting, J. H., Aerts, C., & Mathias, P. 1997, A&A, 322, 493
- Telting et al. (2006) Telting, J. H., Schrijvers, C., Ilyin, I. V., et al. 2006, A&A, 452, 945
- Terrell & Priedhorsky (1984) Terrell, J. & Priedhorsky, W. C. 1984, ApJ, 285, L15
- Tody (1986) Tody, D. 1986, in Society of Photo-Optical Instrumentation Engineers (SPIE) Conference Series, Vol. 627, Instrumentation in astronomy VI, ed. D. L. Crawford, 733
- Tomsick et al. (2011) Tomsick, J. A., Heinke, C., Halpern, J., et al. 2011, ApJ, 728, 86
- Torrejón et al. (2018) Torrejón, J. M., Reig, P., Fürst, F., et al. 2018, MNRAS, 479, 3366
- Townsend (2005) Townsend, R. H. D. 2005, MNRAS, 360, 465
- Townsend et al. (2004) Townsend, R. H. D., Owocki, S. P., & Howarth, I. D. 2004, MNRAS, 350, 189
- Tueller et al. (2005) Tueller, J., Barthelmy, S., Burrows, D., et al. 2005, The Astronomer’s Telegram, 669, 1
- Ulmer et al. (1973) Ulmer, M. P., Baity, W. A., Wheaton, W. A., & Peterson, L. E. 1973, ApJ, 184, L117
- van den Eijnden et al. (2018) van den Eijnden, J., Degenaar, N., Russell, T. D., et al. 2018, Nature, 562, 233
- van Kerkwijk et al. (1995) van Kerkwijk, M. H., van Paradijs, J., Zuiderwijk, E. J., et al. 1995, A&A, 303, 483
- Waelkens (1991) Waelkens, C. 1991, A&A, 246, 453
- Walker et al. (2005) Walker, G. A. H., Kuschnig, R., Matthews, J. M., et al. 2005, ApJ, 635, L77
- Wang et al. (2021) Wang, L., Gies, D. R., Peters, G. J., et al. 2021, AJ, 161, 248
- Warwick et al. (1981) Warwick, R. S., Marshall, N., Fraser, G. W., et al. 1981, MNRAS, 197, 865
- Warwick et al. (1985) Warwick, R. S., Watson, M. G., & Willingale, R. 1985, Space Sci. Rev., 40, 429
- Watson et al. (1981) Watson, M. G., Warwick, R. S., & Ricketts, M. J. 1981, MNRAS, 195, 197
- White et al. (1978) White, N. E., Parkes, G. E., Sanford, P. W., Mason, K. O., & Murdin, P. G. 1978, Nature, 274, 664
- Williams et al. (2010) Williams, S. J., Gies, D. R., Matson, R. A., et al. 2010, ApJ, 723, L93
- Wilson et al. (1998) Wilson, C. A., Finger, M. H., Harmon, B. A., Chakrabarty, D., & Strohmayer, T. 1998, ApJ, 499, 820
- Wilson et al. (2005) Wilson, C. A., Weisskopf, M. C., Finger, M. H., et al. 2005, ApJ, 622, 1024
- Wilson-Hodge et al. (2018) Wilson-Hodge, C. A., Malacaria, C., Jenke, P. A., et al. 2018, ApJ, 863, 9
- Yan et al. (2016) Yan, J., Zhang, P., Liu, W., & Liu, Q. 2016, AJ, 151, 104
- Yan et al. (2012) Yan, J., Zurita Heras, J. A., Chaty, S., Li, H., & Liu, Q. 2012, ApJ, 753, 73
- Zamanov et al. (2013) Zamanov, R., Stoyanov, K., Martí, J., et al. 2013, A&A, 559, A87
- Zamanov et al. (2001) Zamanov, R. K., Reig, P., Martí, J., et al. 2001, A&A, 367, 884
- Zamanov et al. (2021) Zamanov, R. K., Stoyanov, K. A., Mart, J., Marchev, V. D., & Nikolov, Y. M. 2021, Astronomische Nachrichten, 342, 531
- Zhang et al. (2005) Zhang, S., Qu, J.-L., Song, L.-M., & Torres, D. F. 2005, ApJ, 630, L65
- Zima (2006) Zima, W. 2006, A&A, 455, 227
Appendix A Results of the frequency analysis on individual sources
In this section we present the results of our frequency analysis performed on each individual system. The sources are listed and ordered by right ascension.
IGR J00370+6122 (Fig. 14)
IGR J00370+6122 is a SGXB that was discovered in December 2003 during a 1.2 Ms INTEGRAL observation (den Hartog et al. 2006). Based on high-resolution spectra taken at different epochs, González-Galán et al. (2014) classified the optical counterpart BD +60∘ 73 as a BN0.7 Ib low-luminosity supergiant located at a distance kpc, in the Cas OB4 association. den Hartog et al. (2006) and in’t Zand et al. (2007) reported periodically variable orbitally modulated hard X-ray emission that occurred with a period of 15.66 d and identified a possible 346 s period with the spin of a pulsar companion. Orbital solutions are given by González-Galán et al. (2014) and Grunhut et al. (2014) who performed radial velocity measurements of a large number of optical spectra.
IGR J00370+6122 was observed by TESS during sectors 17 (October 2019), 18
(November 2019), and 24 (April 2020). The periodogram is featureless above 2
. Below this frequency, the frequency spectrum is characterized by a forest of
peaks (up to 38 frequencies above are detected in sectors 17 and 18) and
strong red-noise. In sector 24, an isolated low-amplitude (0.07% in flux) peak
at 3.1 is also detected. The stochastic nature of the variability where
multiple signals exist in the vicinity of each other is typical of supergiant
X-ray binaries.
2S 0114+65 (Fig. 14)
This is one of the three supergiant X-ray binaries (SGXB) that we included in our target list in order to compare the pattern of variability of BeXBs and SGXBs (the other two being IGR J00370+6122 and Vela X–1). 2S 0114+650 was discovered in 1977 by the SAS-3 Galactic survey (Dower et al. 1977). The compact object is one of the slowest rotating pulsars with a spin period of 2.7 hours. The donor star is LS I+65∘010, a luminous B1 Ia supergiant (Reig et al. 1996). The orbital period determined from radial velocity measurements is 11.6 days with an orbital eccentricity (Crampton et al. 1985; Koenigsberger et al. 2006).
2S 0114+65 was observed by TESS in sector 18 (November 2019), 24 (April
2020), and 25 (May 2020). The periodogram displays strong red noise at low
frequencies. Below 2 , there is a forest of signals, while above that
frequency no peaks are detected. This type of stochastic variations is a defining
characteristic of supergiant stars (Bowman et al. 2019b).
4U 0115+63 (Fig. 12)
4U 0115+63 is one of the best studied BeXB, with X-ray outbursts and disk formation and dissipation phases every 3–5 years (Reig et al. 2007). It harbors a fast spinning neutron star, s, in a relatively narrow orbit, days (Raichur & Paul 2010).
4U 0115+63 was observed from the Skinakas observatory in four different epochs: two in 2008 and two in 2009. Large amplitude variations ( mag) were observed in virtually all the individual light curves obtained in a single night (Fig. 1). Although the nights of 15-16 September 2008 were not photometric, a modulation of frequency 3.50 c d-1 with an amplitude of 15 mmag was tentatively detected. The star was observed again on 15 and 16 October 2008, and a frequency at 3.39 was detected in the periodogram with an amplitude of 18 mmag.
In 2009, 4U 0115+63 was observed from Skinakas on 22-27 September and 4-11 October. A periodogram obtained with these light curves clearly shows a dominant peak at frequency 3.34 with an amplitude of 17 mmag in September and 3.35 with an amplitude of 12 mmag in October. The analysis of all the 2009 data together (the most complete set of observations) confirms the periodicity at 3.33 . After prewhitening with this frequency, a peak at 1.73 remains in the periodogram with a slightly above the threshold of 4.
The 3.3 modulation is clearly detected by TESS in observations made
during sectors 18 (November 2018), 24 (April 2020), and 25 (May 2020). The
amplitude of this peak (% in flux) is one of the largest detected among all the BeXBs
analyzed in this work. An harmonic of this frequency at 6.60 and a
subharmonic at 1.63 are also detected in all three sectors. The structure
around the main peak at 3.30 is similar to the window function, and hence
there is no evidence of frequency groups, at least in sectors 18 and 24.
In contrast, in sector 25 two groups of frequencies emerged, centred around 1.5 and
3.0 , in addition to the 3.30 peak and its harmonics.
During sector 18, a peak at 1.7 remains after filtering out for linear combination of frequencies. This modulation agrees with the one detected in the 2009 ground-based observations.
IGR J01363+6610 (Fig. 12)
IGR J01363+6610 was discovered by the INTEGRAL imager IBIS/ISGRI on April 19, 2004 during observations dedicated to the Galactic Plane Scan (Grebenev et al. 2004). Optical observations by Reig et al. (2005b) found an H emission star located within the INTEGRAL uncertainty circle and determined the spectral type to be B1IV-Ve. Although the nature of the compact object has not been resolved, the X-ray analysis performed by Tomsick et al. (2011) confirmed that the system is a BeXB.
Observed by TESS in sectors 18 (November 2019), 24 (April 2020), and 25
(May 2020), the light curves display a modulation whose amplitude varies in
time. The periodogram shows three groups of frequencies at 0.13, 0.67, and 1.4
. The third group is located at approximately twice the frequency of the
second group and displays smaller amplitudes. The frequency of the most significant
peak of the second group is 0.67 with an amplitude of 0.9% in flux (or 9 ppt).
The frequency analysis detects up to 62 peaks with
. However, after removing all possible combinations of frequencies and
harmonics as described in Sect. 3.3.1, only four frequencies remained as
independent. These are the three frequencies mentioned above plus another one at
0.75 .
RX J0146.9+6121/LS I +61 235
LS I+61 235 (V 831 Cas) is the optical counterpart of the BeXB RX J0146.9+6121 (Reig et al. 1997b). It is a B1Ve star located in the open cluster NGC 663. The binary contains a slowly rotating ( s) neutron star on a wide but unknown orbit (Motch et al. 1997). Sarty et al. (2009) detected three distinct periodicities that were interpreted as pulsation in the radial fundamental mode (2.9 ), the spin of the Be star (1.5 ), and a higher order -mode pulsation (9.7 ).
We observed LS I+61 235
extensively for four consecutive nights from Skinakas in September 2018 with about 600
measurements per night in the and bands (Table 9). We also analyzed two older runs
performed ten years earlier. In our analysis of the
2018 data, we detect three significant frequencies, two of which coincide with
those reported by Sarty et al. (2009), namely, 2.9 and 9.70 , and the
third one, at 1.36 , only differs slightly. However, whereas the
higher-frequency modulations can be considered as firm detection, the 1.36 frequency has low significance with . The two significant frequencies
at 9.7 and 2.9 correspond to periods of 2.5 hr and 8.3 hr, which are too short to be associated with the rotational period of the star.
There are no TESS observations for this source.
RX J0240.4+6112/LS I +61 303 (Fig. 12)
RX J0240.4+6112 is an intriguing BeXB that has been detected over all the electromagnetic spectrum, from radio to -rays (Taylor et al. 1992; Paredes et al. 1997; Albert et al. 2006; Grundstrom et al. 2007b; Zamanov et al. 2013). The emission is modulated with a period of 26.5 days, which is interpreted as the orbital period (Aragona et al. 2009). The nature of the compact companion is not known, although the lack of pulsation may indicate the presence of a black hole. The optical counterpart is the B0Ve star LS I +61 303.
LS I +61 303 was observed by TESS in sector 18 (November 2019). In addition to the short-term variability (hours to days), the light
curve shows significant intensity changes on timescales of weeks. The periodogram is dominated
by red-noise below 2 . The frequency analysis displays the two frequency
groups pattern, with groups centered around 0.9 and 1.8 , together with
several other significant peaks at lower frequencies between 0.15 and 0.55 .
No significant peaks at frequencies higher than 3 were detected.
Swift J0243.6+6124 (Fig. 12)
Swift J0243.6+6124 is a unique system. It is the first and only ultra-luminous X-ray source in our Galaxy (Wilson-Hodge et al. 2018). It is the first and only high-mass X-ray pulsar showing a radio jet (van den Eijnden et al. 2018). It was first detected by Swift/BAT on 3rd October 2017 (Kennea et al. 2017) and confirmed as a BeXBs two days later (Kouroubatzakis et al. 2017). The binary harbors a pulsar with a spin period of 9.9 s (Wilson-Hodge et al. 2018) and a , O9.5Ve star, located at a distance of 5 kpc (Reig et al. 2020).
Our ground-based observations from October 2019 did not reveal any significant frequency in the interval 0 to 20 cd-1. The accuracy of the differential photometry is estimated to be 7 mmag, in both the and bands.
Swift J0243.6+6124 was observed by TESS during sector 18 (November 2019)
only. Non-periodic variability seems to be the most characteristic feature of
the periodogram. The low-frequency part of the periodogram is populated by
numerous low-amplitude, low significance peaks. At first glance, there
seems to be two groups of frequencies, not harmonically related at around 0.2
and 1.1 . The most significant peak of the first group appears at 0.22 (4.8 days) and manifests as an irregular sinusoidal modulation over the entire
duration of the observations with an amplitude of 0.14% in flux. Less
significant is the peak at 0.87 of the second group with less than 0.1%
amplitude. Above 3 , the frequency spectrum is consistent with stochastic
noise, with the exception of two barely significant frequencies at 3.2 and 3.7
.
V 0332+53 (Fig. 12)
The bright X-ray transient source V 0332+53 was discovered by the Vela 5B satellite during an outburst in 1973 (Terrell & Priedhorsky 1984). The binary consists of a neutron star with a spin period of 4.4 s (Stella et al. 1985) and a V=15.3, O8–9 Ve star (Negueruela et al. 1999). The orbital period is 33.8 days (Doroshenko et al. 2016).
V 0332+53 was observed by TESS in sectors 18 and 19 (November 2019). The periodogram is dominated by two independent frequencies at 1.46 , and 2.38 and two closely spaced frequencies at 0.27 and 0.31 . Another peak at 3 , most likely the harmonic of the 1.5 peak, stands above the local noise level only when we restrict the noise calculation to the close vicinity of the peak. These peaks lie on top of three groups of frequencies, although they are not harmonically related. TESS data does not detect any modulation above the noise level at high frequencies. The red noise below 3 could be attributed to inhomogeneities in the disk.
An alternative explanation for the 1.45 is that it might be related to
rotation if the massive companion is rotating close to the break-up velocity,
which for a late O-type star () would be km s-1. The 1.4 frequency would roughly correspond to a rotational velocity of that magnitude if
. The low inclination angle of this system
(10∘–20∘) and a projected rotational velocity of km s-1 are not at odds with such possibility
(Negueruela et al. 1999; Zhang et al. 2005; Caballero-García et al. 2016).
X Per (Fig. 12)
X Persei (HD 24534) was detected in X-rays with the Uhuru satellite and identified as the optical counterpart of the X-ray source 2U 0352+30 (Braes & Miley 1972). The main component of X Per is a hot massive rapidly rotating B0Ve star (Fabregat et al. 1992; Lyubimkov et al. 1997). The secondary is a slowly spinning neutron star ( s). Delgado-Martí et al. (2001) determined an orbital period of 250 days and orbital eccentricity of .
X Persei was observed by TESS in sectors 18 (November 2019), 43 (September
2021) and 44 (October 2021). The periodograms show the characteristic two
frequency groups pattern, with groups at 1.8 and 3.6 . There is a significant
frequency at 2.89 , isolated from any group, which appears in sectors 43 and
44, but is not present in sector 18. There are also significant high frequency peaks with very small amplitude which show up in one of the
sectors, but not in the others (8.62 , 0.04% amplitude, sector 18; 4.29
, 0.04%, sector 44). The light curve presents long term quasi-periodic variability, although, unlike 1A 0535+26, there are no significant variations in the amplitude of the short term oscillations.
RX J0440.9+4431/LS V +4417 (Fig. 12)
LS V +4417 is a bright V = 10.8, B0.2Ve star that is associated with the X-ray source RX J0440.9+4431 (Reig & Roche 1999a). LS V +4417 exhibits long-term optical photometric and spectroscopic variability linked to the evolution of the circumstellar disk around the Be star (Reig et al. 2005a; Yan et al. 2016). Since 1995, the source has gone through two low-optical states and two high-optical states. The low-optical states correspond to the (almost) disappearance of the disk. In the X-rays, it showed one major outburst in 2010 followed by two less intense flares, which allowed the determination of the orbital period in 150 days (Ferrigno et al. 2013).
We observed LS V +4417 in January 2019. The observations took place from the Aras de Los Olmos observatory. The light curve consistently showed a periodicity at 3.20 , regardless of the comparison stars used. However, in all cases the signal-to-noise was too low (). In favor of the reality of the modulation is the fact that the analysis of different combination of comparison stars without including the object did not yield this frequency. Therefore, we conclude that it is very likely associated with the BeXB.
TESS observed LS V +4417 during sector 19 (December 2019). The
periodogram below 3 is populated by several narrow peaks on top of frequency
groups. The most significant signals are at 2.60 , 2.17 , and
1.10 with amplitudes of 0.8%, 0.6%, and 0.3%, respectively. A strong isolated peak at 6.74 dominates
the periodogram above 3 .
1A 0535+262 (Fig. 12)
1A 0535+262 is one of the first BeXBs to be discovered (Rosenberg et al. 1975). Its optical companion is the V=9 mag, B0IIIe star V725 Tau (Rappaport et al. 1976; Janot-Pacheco et al. 1987). The system contains an X-ray pulsar with a pulse period of 103 s, which orbits the Be star in a moderately eccentric () orbit with an orbital period d (Finger et al. 1996).
1A 0535+262 was observed from the Skinakas Observatory for six days in October
2009. No significant frequency was detected in the periodogram.
The star was observed in sectors 43 to 45 by TESS (September-November 2021). The light curve shows
long term quasi-periodic variability and also short-term variability. In the
normalized light curve, the short period variability is apparent, with variable
amplitude most likely produced by the beating of several modes of closely spaced
frequencies.
The long term and short period variability are correlated, in the sense that the maximum amplitude of the short term oscillations coincides with the brightening of the star immediately after each minima, while the minimum amplitude takes place at the fading after each maxima (see Sect. 4.4). The frequency analysis performed on the TESS light curve
revealed the characteristic pattern of two frequency groups, centred around 1
and 2 . Amplitudes in the latter are much larger than in the former. The most
significant frequency is at 2.13 , with an amplitude of about 1% in flux.
There are also two other groups of significant frequencies around 3 and 4 with much smaller amplitudes. In addition, there are isolated significant
frequencies detected at 6.10 and 7.18 , with amplitudes of 0.03%.
IGR J06074+2205 (Fig. 13)
IGR J06074+2205 was discovered by INTEGRAL/JEM-X in February 2003 (Chenevez et al. 2004). Halpern & Tyagi (2005) suggested that a Be star located within 1′ of the INTEGRAL position was the optical counterpart. Reig et al. (2010b) confirmed the identification and performed a detail study of the optical emission from IGR J06074+2205. The primary companion of the binary is a , B0.5Ve star located at a distance of 4.5 kpc, showing spectral variability both in the strength and shape of the H line. IGR J06074+2205 is an X-ray pulsar with a spin period of 373.2 s (Reig & Zezas 2018).
and -band photometric observations were carried out in February 2019 from the Aras de los Olmos observatory. We did not detect any significant modulation.
Observed in sectors 43 and 44, the TESS periodogram is characterized by the absence of frequency groups and a highly significant peak dominating the 0–20 spectrum. The main feature is located at 2.30 , with an amplitude around 0.5% in flux and . Its first harmonic at 4.60 is also apparent. A second frequency at 2.15 is also significant, albeit with a much smaller amplitude. Another significant frequency is found at 6.83 .
We note that the photometric aperture includes
light from the nearby source Gaia DR3 3423526544838561792, located 26.2 away. This contaminating star has a Gaia magnitude G=12.80, to be compared with G=12.17 for IGR J06074+2205. Their astrophysical parameters given by Gaia DR3, K, , correspond to a F6III spectral type (gray05).
MXB 0656–072 (Fig. 13)
The transient X-ray source MXB 0656–072 was discovered on 1975 September 20 with SAS-3 (Clark et al. 1975), and identified with a 160-s X-ray pulsar by Remillard & Marshall (2003). Based on the periodic variation of the X-ray intensity during the active phases, an orbital period of 101.2 days was proposed by Yan et al. (2012). However, an orbital solution of the system remains undetermined. Pakull et al. (2003, see also ) identified the optical counterpart with an O9.7 Ve star, hence MXB 0656–072 was classified as a BeXB.
TESS observed the source in sector 7 (January 2019). At first glance, the frequency spectrum seems to exhibit three frequency groups at around 0.2, 1.4 and 2.8 . However, the grouping of frequencies resembles that of the window function rather than the characteristic structure seen in other BeXBs. Indeed, the third group (the harmonic of the 1.38 peak) is formed by the central frequency and two side lobes. The main frequency at 1.38 () has an amplitude of 1.3% in flux, the largest of all the BeXBs. The 1.38 modulation corresponds to a period of 0.71 days. If interpreted as the rotation of the Be star, then the star must be rotating very close to the critical velocity, which for an O9.7V star would be km s-1 (Townsend 2005). A frequency of 1.4 implies a rotational velocity of km s-1 assuming a radius of .
RX J0812.4–3114/LS 992 (Fig. 13)
RX J0812.4–3114 was first identified by the ROSAT Galactic Plane Survey as an X-ray source that positionally coincides with the B0.2IVe star LS 992 (Motch et al. 1997; Reig et al. 2001). It harbors an X-ray pulsar with spin period of 31.9 seconds (Reig & Roche 1999b). This source spends most of its life in a very low X-ray state. Occasionally it enters an active period where a series of weak X-ray outbursts are detected. Based on the regularity of these outbursts, Corbet & Peele (2000) estimated the orbital period to be 80 days.
RX J0812.4–3114 was observed in sectors 8 and 9 (February-March 2019) and 34 and 35
(January-February 2021). In sectors 8 and 9 a three frequency groups pattern is
apparent, with groups centered at 0.3, 1.3 and 2.6 . The two main peaks of the harmonically
related (higher frequency) groups have amplitudes of 0.3% and 0.5% respectively.
In addition, there is another significant frequency well detached from the
second group at 2.89 , with amplitude of 0.5%. In sectors 34 and 35 the frequency spectrum changed
significantly. The frequency groups pattern vanished, while the isolated
frequency at 2.89 is still present, with an slightly smaller
amplitude. Moreover, in these two last sectors, two high frequencies at 9.00
and 11.89 emerged, which are not present in sectors 8 and 9.
Vela X–1 (Fig. 14)
Vela X–1 is the archetype of a classical supergiant X-ray binary where a 283-s pulsating neutron star is on an approximate nine-day eclipsing orbit around HD 77581, a B0.5 Ib star (McClintock et al. 1976). The hot primary loses mass at a rate of (Kretschmar et al. 2021) through a powerful stellar wind, which is accreted onto the neutron star and powers the X-ray pulsar. The neutron star is eclipsed by the primary during every orbital cycle. The mass and radius of the primary are estimated to be and , respectively (van Kerkwijk et al. 1995; Kretschmar et al. 2021).
Vela X–1 was observed by TESS in sectors 8 and 9 (February-March 2019). The
periodogram is very similar to that of 2S 0114+65. It is completely featureless
above 2 , while at lower frequencies there are a myriad of peaks, whose
amplitudes decrease with frequency (i.e. red noise). A strong peak at 0.22 dominates the low-frequency part. The amplitude of this peak is 3% in flux,
which is the highest amplitude measured in all our sample of sources.
GRO 1008–57 (Fig. 13)
This BeXB was discovered by the Burst and Transient Source Experiment (BATSE) on board the Compton Gamma-Ray Observatory (CGRO) during a 1.4 Crab giant outburst in 1993 (Stollberg et al. 1993). Optical follow up observations identified an early-type star with infrared excess and strong H emission as its Be-type companion and suggested a distance to the source of 5 kpc (Coe et al. 1994, 2007). The compact companion is a neutron star with a spin period of 93.5 s. The binary has an orbital period of 249.48 days and an eccentricity of 0.68 (Coe et al. 2007; Kühnel et al. 2013). The magnetic field of the pulsar is known to be the highest among BeXBs, likely as high as G, as measured from the suggested cyclotron line at 88 keV (Shrader et al. 1999; Bellm et al. 2014). GRO J1008–57 shows both giant irregular type II outbursts and regular type I outbursts (Kühnel et al. 2017).
TESS observed GRO 1008–57 in sectors 9 and 10 (March-April 2019) and 36
and 37 (March-April 2021) during the first and third year of the mission,
respectively. The frequency spectrum at high frequencies is similar in both
epochs and it is dominated by two isolated peaks at 2.98 and 10.2 . The periodogram
differs at low frequencies. During the first epoch, the power concentrates mainly
at , while during the 2021 observations the power is mainly shared in
the range . The overall shape of the periodogram is reminiscent of a
ROTD pattern (Balona 2017), consisting of a broad peak flanked by a
sharp peak at slightly higher frequency. The mechanism that produce such a
pattern is unknown, although Balona (2017) proposed that the broad peak could
be associated with starspots, while the sharp peak with an orbiting body. A more likely explanation is given by Saio et al. (2018), who identify the sharp peak with the rotation frequency and the broad hump as even r modes (Rossby waves).
RX J1037.5–5647/LS 1698 (Fig. 13)
This source was first detected by Uhuru (Forman et al. 1978), but it is also associated with the Ariel V source 3A 1036–56 (Warwick et al. 1981). The system was detected again during the ROSAT Galactic plane survey and named RX J1037.5–5647. RXTE data revealed pulsed emission with a period of s (Reig & Roche 1999a), while a tentative 61 day orbital period has been proposed from the analysis of Swift BAT and XRT data (Cusumano et al. 2013). Based on a pointed ROSAT Position Sensitive Proportional Counter (PSPC) observation, Motch et al. (1997) identified the optical counterpart to be the B0 III-Ve star LS 1698, at a distance of 5 kpc.
Observed in sectors 10 (April 2019), 36 (March 2021), and 37 (April 2021), the
star does not present the frequency groups pattern. Instead, the frequency spectrum is
dominated by low-frequency noise with a strong red-noise component. The most
significant frequencies are at 0.31 and 1.86 . The frequency at 3.72 seems to be the first harmonic of the
1.86 frequency. There are two stable high frequencies at 4.91 and 5.64 . Several short-lived significant frequencies are also apparent between 0.2 and 1.2 and between 3 and 4 , but most of them appear either in one observing period or in the other, but not in both.
1A 1118–616 (Fig. 13)
The X-ray transient 1A 1118–616 was discovered during an outburst in 1974 by the Ariel-5 satellite (Eyles et al. 1975). The optical counterpart was identified as the Be star He 3-640/Wray 793, with an O9.5IV-Ve spectral type. (Janot-Pacheco et al. 1981). The system contains a slowly rotating neutron star with a spin period of 406.5 s (Ives et al. 1975). Since its discovery, 1A 1118–616 has displayed three giant X-ray outbursts, in 1974, 1992, and 2004 (Nespoli & Reig 2011). The Be star in this system displays the strongest H line in emission among BeXBs, with an equivalent width of Å (Coe et al. 1994). One peculiarity of this BeXB is its unusual short orbital period. According to the correlation that holds for BeXBs (Corbet 1986), the orbital period should be longer than days. However, Staubert et al. (2011) reported an orbital period of only 24 days.
1A 1118–616 was observed by TESS in sectors 10 and 11 (March-May 2019) and
37 and 38 (April-May 2021). The variability pattern between the
two TESS epochs changed significantly. The 2019 light curve is more erratic and displays low amplitude fast variability, whereas the 2021 light curve shows a distinct
sinusoidal variation with a period of 3 days. In sectors 37 and 38, a visual inspection of the frequency spectrum reveals a three frequency groups pattern, at frequencies of 0.3, 1.6, and 3.1 . In sectors 10 and 11, the two first groups have almost merged in a broad, single group.
The light curve in sectors 37 and 38
is dominated by a 0.33 frequency with an amplitude of 0.5% in flux. This frequency is also present in sectors
10 and 11, although with a much smaller amplitude, 0.15% in sector 10 and less
than 0.05% in sector 11. There is also a strong peak at 0.94 which appears
in all sectors with amplitudes between 0.1 and 0.2%, and a frequency of 1.16 with similar amplitudes present only in sectors 10 and 11.
4U 1145–61 (Fig. 13)
The X-ray pulsar 4U 1145-619 was discovered in 1972 by Uhuru (Giacconi et al. 1972). The optical counterpart of 4U 1145-61 is the V=9 mag, B1 Ve V801 Cen (Stevens et al. 1997; Alfonso-Garzón et al. 2017). X-ray pulsations with s were detected in 1977 with Ariel V (White et al. 1978). Analysis of the long-term X-ray behavior of 4U 1145–61 revealed recurrent outbursts with a period of 186.5 d. Outbursts are typically of 10-d duration, with flux levels increasing by a factor of (Watson et al. 1981; Priedhorsky & Terrell 1983; Warwick et al. 1985; Nakajima et al. 2015).
TESS observed 4U 1145–61 during the first year (sectors 10 and 11,
April-May 2019) and third year (sectors 37 and 38, two years later) of the
mission. This source shows a densely populated frequency spectrum above 3 ,
with at least three groups of frequencies at around 4.2 , 8.4 , and 12.8 and
some smaller amplitude modulations at 6.5 and 10.2 . These groups are
visible during the two epochs, but the 12.8 and 10.2 signals have in sectors 10 and 11. At the lower end of the periodogram, there are a
number of narrow peaks with an amplitude about 4 or 5 times larger than the
amplitude of the high-frequency groups and .
GX 304–1/4U 1258-61 (Fig. 13)
This BeXB was first detected in X-rays during balloon observations in October 1967 (Lewin et al. 1968) and recognized as an X-ray pulsar, with s, by McClintock et al. (1977). The X-ray long-term variability of GX 304–1 is characterized by periods of strong activity where type I outbursts recur periodically with a period of 132.2 days, which is considered to be the orbital period (Priedhorsky & Terrell 1983; Sugizaki et al. 2015), and periods of hardly any activity. The optical counterpart is a B2Vne star (Parkes et al. 1980).
Observed in sector 38 (April-May 2021) by TESS, the periodogram does not
show the frequency groups pattern. There are several significant, isolated
frequencies detected from 1.02 up to 15.33 . The larger amplitudes are found at 1.80 (0.6% in flux), 6.77 (0.3%), and 7.18 (0.3%). The 1.80 could also been
attributed to rotation if the star is rotating close to the critical velocity.
Assuming a radius of for a spectral type B2V, the 1.8 frequency would correspond to a rotational velocity of 450 km s-1, while
the critical velocity is estimated to be 475 km s-1 (Townsend et al. 2004). The
fast-rotating nature of this star was already noticed by Parkes et al. (1980), who
suggested that it is rotating at near break-up velocity.
KS 1947+300 (Fig. 14)
KS 1947+300 is associated with a moderately reddened, V = 14.2, B0Ve star, located at 10 kpc (Negueruela et al. 2003). Its optical and infrared emission is rather stable with minor optical outbursts of 0.1 mag and correlated X-ray activity (Kızıloğlu et al. 2007).
Ground-based observations of the optical counterpart to KS 1947+300 were performed from the Skinakas observatory during three consecutive nights on 28-30 July 2010 and on 4-6 August 2011 (Table 10). The analysis of the 2010 light curve does not yield any significant frequency. The highest peak is found at 5.41 with an amplitude of 2 mmag and very low signal-to-noise ratio . The 2011 light curve contains two low-amplitude but significant peaks at 2.31 and amplitude 3.9 mmag () and 2.73 with amplitude 2.2 mmag ().
The source was observed by TESS in sector 41 (July-August 2021). The
periodogram is dominated by noise, with only two significant peaks at 0.5 and 3.6
. Another peak at the expected frequency of the first harmonic of the 3.6
modulation stands above the local noise level, although it does not meet the
criterion.
Swift J2000.6+3210
Swift J2000.6+3210 is a scarcely observed BeXB discovered by the Swift/BAT instrument in 2005 (Tueller et al. 2005). Subsequent optical observations reported H emission with Å (Burenin et al. 2006; Halpern 2006; Masetti et al. 2008), placing the system as a strong BeXB candidate. The most complete X-ray analysis was performed by Pradhan et al. (2013), who detected pulsations with a period of 890 s.
We observed Swift J2000.6+3210 from Skinakas during 28-31 July 2021 and 19-22 August
2021 (Table 10). The timing analysis gave a significant () peak at 2.8 during the July run. The weather condition during the August observations were
not as good as in July, resulting in a noisier light curve. The frequency at 2.8
is detected with low significance (). No TESS light curve of this source has been analysed, because even the smallest one pixel photometric aperture is heavily contaminated from a nearby bright star.
GRO J2058+40 (Fig. 14)
GRO J2058+40 is a BeXB with an O9.5-B0 companion at about 9 kpc (Reig et al. 2005b; Wilson et al. 2005). It was discovered by BATSE on board the Compton Gamma-Ray Observatory (CGRO) during its giant outburst in 1995 September-October (Wilson et al. 1998). The compact companion is a 198-s pulsar in a 55 day orbit. In the optical band, GRO J2058+40 is a long-term variable system with photometric and spectroscopic changes on time scales of years. These changes are attributed to the growth and dissipation of a circumstellar disk (Reig & Fabregat 2015; Reig et al. 2016). In addition, two modulations at 2.37 and 2.40 were reported in the Robotic Optical Transient Experiment1 (ROTSEIIId) light curve and attributed to non radial pulsations (Kızıloǧlu et al. 2007).
We observed GRO J2058+40 for four consecutive nights in July 2020 from Skinakas and detected the 2.40 frequency again (Table 10). In addition, we detected two other frequencies at 2.64 and 4 .
TESS observed this source in sector 15 (August 2019). Two isolated peaks
are detected at 2.37 and 6.38 . The lower-frequency peak is the strongest
signal in the periodogram and coincides with the one detected in ground-based
observations.
There is some
evidence of frequency groups at 2.0 and 4.0 , although somewhat uncertain.
SAX J2103.5+4545
SAX J2103.5+4545 is the BeXB with the shortest known orbital period, d (Baykal et al. 2000; Camero Arranz et al. 2007). Due to the short orbital period and moderate eccentricity, the neutron star truncates the Be star’s disk at a small radius and prevents the development of an extended and steady disk. This translates into fast spectral changes and asymmetric H line profiles (Reig et al. 2010a; Kızıloǧlu et al. 2009; Camero et al. 2014; Reig et al. 2016). The primary is a moderately reddened () early B-type (B0Ve) star (Reig et al. 2004).
The system was observed from the Skinakas observatory in September and October 2009 and July 2020 (Table 10). The 2009 light curve contains 262 data points, distributed in 13 nights with an average of a point every 20 minutes. The reason for this sampling is that another source, 4U 0115+63, was observed on the same nights. The telescope pointed alternatively to these two systems. The 2020 observations had a high sampling rate with 300-400 points per night during four consecutive nights. The periodogram shows a low significant () peak at 3.2 with an amplitude of 3.8 mmag in 2009 and two significant low amplitude peaks at 2.7 and 2.4 in 2020. As with the other sources observed from ground-based telescopes, modulations with frequencies between 2–3 should be treated with caution as these periods are similar to the length of the observing nights.
Although the field around this source was observed by TESS, its light
curve is affected by the emission from two nearby stars of similar brightness.
The light curve is very complex and it is possible that one of the nearby stars
is an eclipsing system. It is not possible to distinguish the different origin
of the variability. Hence, we did not include the TESS analysis of SAX J2103.5+4545
in this work.
IGR J21343+4738
IGR J21343+4738 was discovered by the Imager on Board the INTEGRAL Satellite (IBIS) as a transient source that alternated period of X-ray activity with periods of quiescence (Bird et al. 2007; Krivonos et al. 2007; Bikmaev et al. 2008). Reig & Zezas (2014b) reported the discovery of X-ray pulsations during an XMM-Newton observation. They obtained a barycentric corrected pulse period of 320.35 s. The optical counterpart to IGR J21343+4738 is a B1IVe star that exhibits spectral and intensity variability on time scales of months (Reig & Zezas 2014a). The presence of shell absorption lines indicates that the line of sight to the star lies nearly perpendicular to its rotation axis (edge-on system).
We observed IGR J21343+4738 for three nights in July 2018 and another three
nights in July 2019 from the Skinakas observatory and on 9 separate runs in
July-September 2019 from the Aras de los Olmos observatory (Table 10). We detected two
frequencies with a ratio above 4 during the 2018 campaign, at 3.66 and
2.04 , and three during the 2019 campaign at 2.76 , 4.69 , and 2.08
. No TESS observations are reported for this source because the light
curve is affected by a nearby bright source.
Cep X–4
Cepheus X-4 was discovered in 1972 as a transient X-ray source by the OSO-7 satellite (Ulmer et al. 1973). Many of the studies of this source have been performed in the X-ray band owing to its frequent variability that consists of small X-ray outbursts every four or five years. During the 1988 outburst, X-ray pulsations at 66.3 s (Koyama et al. 1991) and a cyclotron line at 30 keV (Mihara et al. 1991) were detected. The first suggestion on the nature of the optical counterpart was made by Koyama et al. (1991), who argued that Cep X-4 is most likely a BeXB system with an orbital period longer than 23 days. The long-term RXTE/ASM X-ray light curve revealed a tentative periodicity at 20.85 d, which could be attributed to the orbital period (McBride et al. 2007). The first detailed optical spectroscopic study on this star was carried out by Bonnet-Bidaud & Mouchet (1998).
We observed Cep X–4 from the Skinakas observatory on three nights from 22–24
August 2020 (Table 11). Non-sinusoidal large amplitude variations are seen in the light
curve. The V-band light curve shows changes of up to 0.02 mag from maximum to
minimum. Two significant periodicities were found at 2.07 and 5.37 .
No TESS observations are reported for this source because the light
curve is affected by a nearby bright source.
4U 2206+54 (Fig. 14)
4U 2206+54 is known as an X-ray source since the early times of X-ray astronomy (Giacconi et al. 1972). 4U 2206+54 is a peculiar system. Despite the optical spectrum displays the H line in emission with a split profile, which is typical of Be stars, its X-ray emission does not show outbursts. The neutron star is fed by the stellar wind from the O9.5V star. 4U 2206+54 is the only (together with LS 5039) permanent wind-fed HMXB with a main-sequence donor (Ribó et al. 2006). The optical companion has a high abundance of He and a wind terminal velocity of km s-1, abnormally slow for its spectral type (Blay et al. 2006). 4U 2206+54 is also one of the slowest X-ray pulsars known to date with a spin period of 5560 s (Reig et al. 2009; Finger et al. 2010; Torrejón et al. 2018).
4U 2206+54 was observed from the Skinakas observatory for two nights in October 2008 with high-cadence and for 13 nights in September-October 2009 with lower cadence (Table 11). Intra-night variability at 0.01 mag is clearly detected. Bugno et al. (2009) reported a tentative modulation in the light curve of 4U 2206+54 with 2.6 and a of 5.5. We confirm the presence of this periodicity from our ground-based photometry. During the 2008 observations, we detected a peak at 2.63 with an amplitude of 5.3 mmag. After removing this frequency, another peak at 4.7 and amplitude 3.2 mmag dominated the frequency spectrum. During the 2009 observations, the 2.6 frequency was present but less significant () than a periodicity at 2.12 ().
4U 2206+54 was observed by TESS during sectors 16 and 17. The light curve
displays low amplitude erratic variability, more typical of wind-fed systems.
The TESS periodogram shows red noise and stochastic variability,
characterized by a large number of peaks in the frequency range 0.2–2 ,
without a clear dominant frequency. Only a peak at 1 appears in common in
both sectors. When the two light curves are combined another significant peak at
0.6 stands above the local noise level. We note, however, that if the noise
level is computed over a range of 1 (instead of 5 ), then no significant
peak is found. Above 3 , it shows a significant
isolated peak at 6.14 .
SAX J2239.3+6116
SAX J2239.3+6116 was discovered by the BeppoSAX wide-field camera as a transient X-ray source during observations of the supernova remnant Cas A (in’t Zand et al. 2000). Subsequent RXTE/PCA and BeppoSAX/MECS-LECS observations during a predicted outburst in July 2001 revealed X-ray pulsations with a pulse period of s (in’t Zand et al. 2001). The optical counterpart is a B0Ve star located at a distance of 4.9 kpc (in’t Zand et al. 2000). The long-term optical variability is characterized by the slow dissipation of the circumstellar disk around the Be star companion (Reig et al. 2017).
SAX J2239.3+6116 was observed during four contiguous nights from the Skinakas observatory on 22–25 August 2011 and 20-23 August 2019 (Table 11). It shows the most clear and distinct modulation of all the sources observed with ground-based telescopes in this work. A periodicity with frequency 1.97 and amplitude 13 mmag is clearly detected in the 2011 light curve. Surprisingly, we did not detect any modulation during the 2019 observations.
SAX J2239.3+6116 was observed in sectors 16 (September 2019), 17 (October
2019), and 24 (April 2020). The light curve is quite variable even within the
same sector. For this reason, we performed a frequency analysis in each orbit
separately as well as by sector. In sectors 16 and 17, the periodogram shows three frequency groups at 0.3,
0.8 and 1.7 . There are two other frequencies, with larger
amplitudes, at 0.73 and 1.93 , which are close to the groups
but not in the middle of them. The 0.73 appears in all
orbits as one of the most significant modulations,
while the 1.93 is significant only in the two orbits of sector 24.
The 1.93 frequency can be identified with the one detected from ground based
observations in Skinakas in 2011. As mentioned
above, Skinakas detected this modulation in 2011
but not in 2019. Likewise, TESS did not detect the 1.93 frequency
during the 2019 observations. The time elapsed between sectors 16-17 and sector
24 is about 6–7 months. A high frequency peak is detected at 11.2 , although the significance is low (Table 7).
MWC 656
MWC 656 is the only known BeXB which likely host a black hole companion. The binary nature of MWC 0656 was first suggested by a 60.37 d periodicity in the optical light curves (Williams et al. 2010), and later confirmed through radial velocity studies (Casares et al. 2012, 2014). It is probably associated with the -ray source AGL J2241+4454 (Munar-Adrover et al. 2016). However, Rivinius et al. (2022) revisited the optical spectral variability properties of this system and concluded that they match with a hot subdwarf companion. In this case MWC 656 would be a Be+sdOB binary system (Wang et al. 2021).
We observed MWC 656 in and bands from the Aras de los Olmos observatory for five nights in October 2019 (Table 11). More than 200 measurements were taken each night. Large amplitude variations are seen in the individual light curves with changes from minimum to maximum of 0.05 mag. Our frequency analysis resulted in the detection of two frequencies at 2.79 with an amplitude of 10.8 mmag and at 1.98 with an amplitude of 7.9 mmag.
Observed in sector 16 by TESS, the periodogram displays two groups of frequencies. However, the main frequencies of the two groups are not in a 2:1 relationship. The second group is clearly dominated by a peak at 1.8 , while the first group contains a strong peak at 0.8 . Moreover, the first group includes only three peaks and two the second group, instead of the bunch of closely spaced frequencies seen in many Be stars. If we restrict the analysis at frequencies above 3 , then we detect two other isolated significant frequencies at 3.69 and 4.30 . The former might, however, be the harmonic of the 1.8 . The 1.8 (0.56 days) has been associated with the rotation of the Be star (Zamanov et al. 2021).
Appendix B TESS light curves and periodograms
The following figures give the light curves (left panels) and frequency spectra (right panels) of every BeXB for which TESS data could be retrieved.
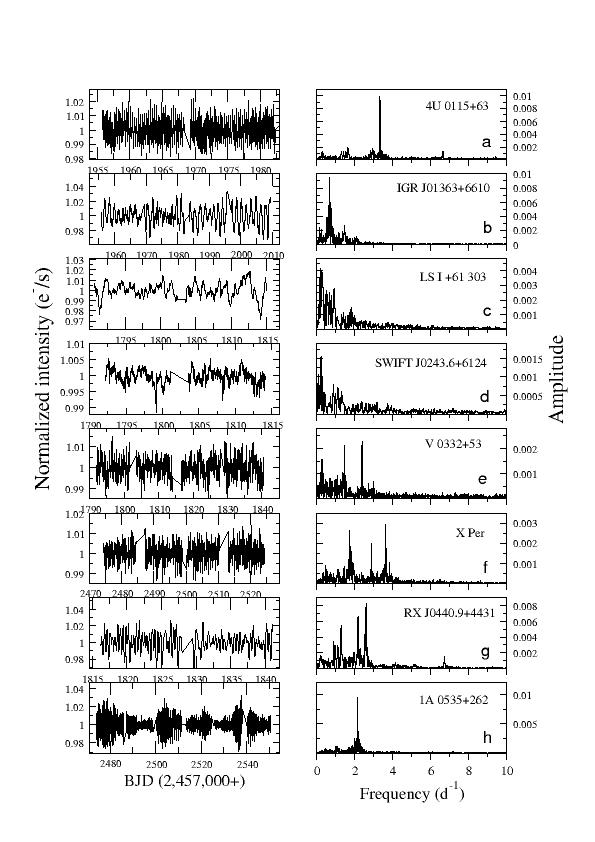
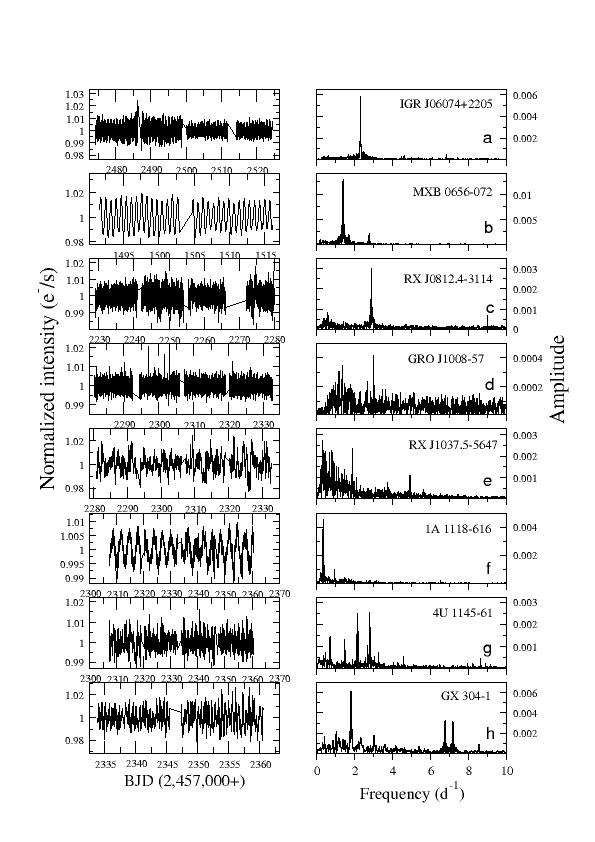
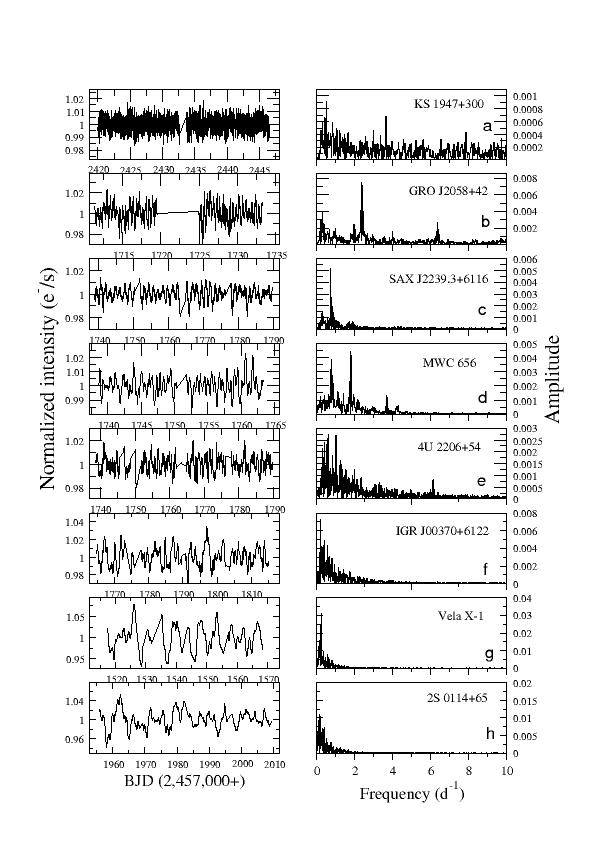
Appendix C Significant independent frequencies
The following tables give the independent frequencies of the BeXB for which TESS data could be retrieved. The frequency analysis was performed for the sectors indicated in parenthesis next to the name of the source.
| Frequency | Period | Amplitude | S/N | |||
| () | () | (days) | (days) | (ppt) | (ppt) | |
| 4U 0115+63 (18) | ||||||
| 3.331 | 0.011 | 0.300 | 0.003 | 7.29 | 0.16 | 28.0 |
| 0.207 | 0.011 | 4.841 | 0.054 | 2.18 | 0.16 | 8.4 |
| 1.691 | 0.011 | 0.591 | 0.007 | 1.56 | 0.16 | 6.0 |
| 4U 0115+63 (24,25) | ||||||
| 3.327 | 0.005 | 0.301 | 0.001 | 10.09 | 0.14 | 39.5 |
| 2.941 | 0.005 | 0.340 | 0.002 | 1.77 | 0.15 | 6.9 |
| 2.828 | 0.005 | 0.354 | 0.002 | 1.50 | 0.14 | 5.9 |
| 1.411 | 0.005 | 0.709 | 0.003 | 1.23 | 0.14 | 4.8 |
| 0.294 | 0.005 | 3.398 | 0.016 | 1.36 | 0.14 | 5.3 |
| 3.183 | 0.005 | 0.314 | 0.002 | 1.31 | 0.14 | 5.1 |
| IGR J01363+6610 (18) | ||||||
| 0.671 | 0.011 | 1.489 | 0.016 | 6.97 | 0.11 | 33.6 |
| 1.482 | 0.011 | 0.675 | 0.007 | 5.23 | 0.11 | 25.2 |
| IGR J01363+6610 (24,25) | ||||||
| 0.671 | 0.005 | 1.490 | 0.007 | 8.61 | 0.06 | 94.7 |
| 0.750 | 0.005 | 1.333 | 0.006 | 4.46 | 0.06 | 49.0 |
| 0.132 | 0.005 | 7.607 | 0.036 | 2.70 | 0.06 | 29.7 |
| 1.444 | 0.005 | 0.692 | 0.003 | 3.02 | 0.06 | 33.2 |
| RX J0240.4+6112 (18) | ||||||
| 0.253 | 0.010 | 3.955 | 0.041 | 4.28 | 0.12 | 14.5 |
| 0.928 | 0.010 | 1.077 | 0.011 | 2.86 | 0.12 | 9.7 |
| SWIFT J0243.6+6124 (18) | ||||||
| 0.218 | 0.011 | 4.582 | 0.052 | 1.39 | 0.07 | 10.1 |
| 0.872 | 0.011 | 1.147 | 0.013 | 0.83 | 0.07 | 6.0 |
| 0.075 | 0.011 | 13.321 | 0.151 | 0.74 | 0.08 | 5.3 |
| 1.122 | 0.011 | 0.892 | 0.010 | 0.68 | 0.07 | 4.9 |
| 3.172 | 0.011 | 0.315 | 0.004 | 0.31 | 0.10 | 5.2 |
| 3.731 | 0.011 | 0.268 | 0.003 | 0.31 | 0.10 | 5.2 |
| V 0332+53 (18,19) | ||||||
| 2.385 | 0.005 | 0.419 | 0.002 | 2.30 | 0.11 | 11.1 |
| 1.456 | 0.005 | 0.687 | 0.004 | 2.23 | 0.11 | 10.8 |
| 0.269 | 0.005 | 3.714 | 0.019 | 1.53 | 0.11 | 7.5 |
| 1.333 | 0.005 | 0.750 | 0.004 | 0.96 | 0.11 | 4.7 |
| 0.175 | 0.005 | 5.708 | 0.029 | 0.99 | 0.11 | 4.8 |
| 1.387 | 0.005 | 0.721 | 0.004 | 0.97 | 0.11 | 4.7 |
| 3.000 | 0.005 | 0.333 | 0.002 | 0.55 | 0.15 | 6.4 |
| X Per (18) | ||||||
| 1.742 | 0.010 | 0.574 | 0.006 | 2.82 | 0.11 | 10.6 |
| 3.608 | 0.010 | 0.277 | 0.003 | 1.75 | 0.11 | 6.6 |
| 0.200 | 0.010 | 4.999 | 0.051 | 1.39 | 0.12 | 5.2 |
| 3.842 | 0.010 | 0.260 | 0.003 | 0.98 | 0.15 | 12.1 |
| 3.211 | 0.010 | 0.311 | 0.003 | 0.70 | 0.15 | 8.7 |
| 8.625 | 0.010 | 0.116 | 0.001 | 0.35 | 0.15 | 9.1 |
| 4.213 | 0.010 | 0.237 | 0.002 | 0.33 | 0.15 | 4.5 |
| Frequency | Period | Amplitude | S/N | |||
| () | () | (days) | (days) | (ppt) | (ppt) | |
| X Per (43,44) | ||||||
| 3.610 | 0.005 | 0.277 | 0.001 | 2.80 | 0.05 | 14.5 |
| 1.738 | 0.005 | 0.575 | 0.003 | 2.87 | 0.05 | 14.8 |
| 2.885 | 0.005 | 0.347 | 0.002 | 1.96 | 0.05 | 10.1 |
| 1.838 | 0.005 | 0.544 | 0.003 | 1.86 | 0.05 | 9.6 |
| 1.675 | 0.005 | 0.597 | 0.003 | 1.24 | 0.05 | 6.4 |
| 3.830 | 0.005 | 0.261 | 0.001 | 1.08 | 0.07 | 18.0 |
| 3.470 | 0.005 | 0.288 | 0.001 | 0.79 | 0.07 | 13.1 |
| 3.535 | 0.005 | 0.283 | 0.001 | 0.67 | 0.07 | 11.2 |
| 3.925 | 0.005 | 0.255 | 0.001 | 0.44 | 0.07 | 7.3 |
| 3.268 | 0.005 | 0.306 | 0.002 | 0.43 | 0.07 | 7.2 |
| 4.296 | 0.005 | 0.233 | 0.001 | 0.37 | 0.07 | 6.8 |
| RX J0440.9+4431 (19) | ||||||
| 2.599 | 0.010 | 0.385 | 0.004 | 8.12 | 0.21 | 16.8 |
| 2.174 | 0.010 | 0.460 | 0.005 | 6.46 | 0.21 | 13.4 |
| 1.098 | 0.010 | 0.911 | 0.009 | 3.14 | 0.21 | 6.5 |
| 6.738 | 0.010 | 0.148 | 0.002 | 1.56 | 0.45 | 20.4 |
| 1A 0535+262 (43-45) | ||||||
| 2.132 | 0.003 | 0.469 | 0.002 | 9.24 | 0.04 | 55.6 |
| 2.166 | 0.003 | 0.462 | 0.002 | 3.66 | 0.04 | 22.0 |
| 0.996 | 0.003 | 1.005 | 0.003 | 1.19 | 0.04 | 7.2 |
| 1.052 | 0.003 | 0.951 | 0.003 | 1.36 | 0.04 | 8.2 |
| 1.898 | 0.003 | 0.527 | 0.002 | 1.59 | 0.04 | 9.6 |
| 7.183 | 0.003 | 0.139 | 0.001 | 0.33 | 0.13 | 9.8 |
| 3.170 | 0.003 | 0.315 | 0.001 | 0.32 | 0.13 | 5.5 |
| 3.249 | 0.003 | 0.308 | 0.001 | 0.29 | 0.13 | 4.9 |
| 4.220 | 0.003 | 0.237 | 0.001 | 0.29 | 0.13 | 7.2 |
| 3.873 | 0.003 | 0.258 | 0.001 | 0.28 | 0.13 | 4.7 |
| 3.994 | 0.003 | 0.250 | 0.001 | 0.30 | 0.13 | 5.1 |
| 6.101 | 0.003 | 0.164 | 0.001 | 0.28 | 0.13 | 8.0 |
| 3.464 | 0.003 | 0.289 | 0.001 | 0.29 | 0.13 | 4.9 |
| 3.701 | 0.003 | 0.270 | 0.001 | 0.26 | 0.13 | 4.4 |
| IGR J06074+2205 (43,44) | ||||||
| 2.302 | 0.005 | 0.434 | 0.002 | 5.90 | 0.04 | 72.5 |
| 6.831 | 0.005 | 0.146 | 0.001 | 0.45 | 0.04 | 9.4 |
| 2.151 | 0.005 | 0.465 | 0.002 | 0.37 | 0.04 | 4.6 |
| 0.602 | 0.005 | 1.661 | 0.008 | 0.36 | 0.04 | 4.4 |
| 1.652 | 0.005 | 0.605 | 0.003 | 0.35 | 0.04 | 4.3 |
| 5.347 | 0.005 | 0.187 | 0.001 | 0.21 | 0.08 | 4.2 |
| 3.012 | 0.005 | 0.332 | 0.002 | 0.23 | 0.09 | 5.5 |
| 6.088 | 0.005 | 0.164 | 0.001 | 0.22 | 0.08 | 5.3 |
| MXB 0656–072 (7) | ||||||
| 1.383 | 0.010 | 0.723 | 0.007 | 12.80 | 0.06 | 103.7 |
| 2.764 | 0.010 | 0.362 | 0.004 | 1.96 | 0.05 | 15.9 |
| 0.170 | 0.010 | 5.881 | 0.060 | 1.11 | 0.06 | 9.0 |
| RX J0812.4–3114 (7,8) | ||||||
| 2.886 | 0.005 | 0.346 | 0.002 | 4.68 | 0.11 | 20.6 |
| 2.563 | 0.005 | 0.390 | 0.002 | 4.26 | 0.11 | 18.7 |
| 1.306 | 0.005 | 0.766 | 0.004 | 3.08 | 0.11 | 13.6 |
| 2.462 | 0.005 | 0.406 | 0.002 | 1.36 | 0.11 | 6.0 |
| 3.000 | 0.005 | 0.333 | 0.002 | 1.68 | 0.28 | 17.2 |
| 3.871 | 0.005 | 0.258 | 0.001 | 0.78 | 0.24 | 8.0 |
| 3.109 | 0.005 | 0.322 | 0.002 | 2.00 | 0.30 | 20.4 |
| 3.183 | 0.005 | 0.314 | 0.002 | 2.18 | 0.27 | 22.3 |
| Frequency | Period | Amplitude | S/N | |||
| () | () | (days) | (days) | (ppt) | (ppt) | |
| RX J0812.4–3114 (34,35) | ||||||
| 2.883 | 0.005 | 0.347 | 0.002 | 3.09 | 0.06 | 24.3 |
| 0.539 | 0.005 | 1.854 | 0.009 | 0.76 | 0.06 | 6.0 |
| 9.005 | 0.005 | 0.111 | 0.001 | 0.67 | 0.06 | 8.9 |
| 0.378 | 0.005 | 2.647 | 0.013 | 0.60 | 0.06 | 4.7 |
| 11.890 | 0.005 | 0.084 | 0.000 | 0.62 | 0.08 | 8.8 |
| 3.030 | 0.005 | 0.330 | 0.002 | 0.51 | 0.08 | 7.2 |
| 3.475 | 0.005 | 0.288 | 0.001 | 0.30 | 0.08 | 4.3 |
| GRO J1008-57 (9,10) | ||||||
| 0.305 | 0.005 | 3.282 | 0.016 | 0.65 | 0.06 | 7.4 |
| 0.604 | 0.005 | 1.656 | 0.008 | 0.75 | 0.06 | 8.5 |
| 0.229 | 0.005 | 4.362 | 0.021 | 0.87 | 0.06 | 9.8 |
| 2.982 | 0.005 | 0.335 | 0.002 | 0.50 | 0.06 | 5.7 |
| 10.192 | 0.005 | 0.098 | 0.001 | 0.35 | 0.06 | 5.4 |
| GRO J1008-57 (36,37) | ||||||
| 2.983 | 0.005 | 0.335 | 0.002 | 0.42 | 0.05 | 5.7 |
| 1.334 | 0.005 | 0.750 | 0.004 | 0.34 | 0.05 | 4.7 |
| 10.195 | 0.005 | 0.098 | 0.001 | 0.31 | 0.05 | 5.5 |
| 1.166 | 0.005 | 0.858 | 0.004 | 0.30 | 0.05 | 4.1 |
| RX J1037.5–5647 (10) | ||||||
| 0.319 | 0.009 | 3.132 | 0.030 | 3.18 | 0.18 | 7.4 |
| 0.943 | 0.009 | 1.060 | 0.010 | 3.21 | 0.18 | 7.4 |
| 1.103 | 0.009 | 0.906 | 0.009 | 2.14 | 0.18 | 5.0 |
| 4.912 | 0.009 | 0.204 | 0.002 | 0.92 | 0.25 | 8.3 |
| 3.775 | 0.009 | 0.265 | 0.003 | 0.87 | 0.25 | 8.5 |
| 3.877 | 0.009 | 0.258 | 0.003 | 0.77 | 0.25 | 7.5 |
| 5.649 | 0.009 | 0.177 | 0.002 | 0.53 | 0.25 | 6.0 |
| RX J1037.5–5647 (36,37) | ||||||
| 0.305 | 0.005 | 3.282 | 0.016 | 2.36 | 0.09 | 6.7 |
| 1.863 | 0.005 | 0.537 | 0.003 | 2.38 | 0.09 | 6.8 |
| 0.454 | 0.005 | 2.204 | 0.011 | 2.15 | 0.09 | 6.1 |
| 0.793 | 0.005 | 1.261 | 0.006 | 2.05 | 0.09 | 5.9 |
| 4.914 | 0.005 | 0.203 | 0.001 | 1.10 | 0.12 | 13.5 |
| 3.095 | 0.005 | 0.323 | 0.002 | 0.54 | 0.12 | 5.4 |
| 3.281 | 0.005 | 0.305 | 0.002 | 0.51 | 0.12 | 5.2 |
| 3.380 | 0.005 | 0.296 | 0.001 | 0.44 | 0.12 | 4.5 |
| 5.638 | 0.005 | 0.177 | 0.001 | 0.41 | 0.12 | 6.8 |
| 3.200 | 0.005 | 0.312 | 0.002 | 0.50 | 0.12 | 5.0 |
| 1A 1118–616 (10,11) | ||||||
| 0.934 | 0.005 | 1.071 | 0.005 | 1.40 | 0.05 | 12.6 |
| 1.163 | 0.005 | 0.860 | 0.004 | 1.34 | 0.05 | 12.1 |
| 0.299 | 0.005 | 3.348 | 0.015 | 1.08 | 0.05 | 9.7 |
| 6.531 | 0.005 | 0.153 | 0.001 | 0.38 | 0.07 | 12.8 |
| 4.423 | 0.005 | 0.226 | 0.001 | 0.33 | 0.07 | 10.2 |
| 3.248 | 0.005 | 0.308 | 0.001 | 0.33 | 0.07 | 9.4 |
| 3.664 | 0.005 | 0.273 | 0.001 | 0.21 | 0.07 | 6.1 |
| 3.102 | 0.005 | 0.322 | 0.002 | 0.22 | 0.07 | 6.3 |
| 1A 1118–616 (37,38) | ||||||
| 0.326 | 0.005 | 3.068 | 0.014 | 4.35 | 0.03 | 48.3 |
| 0.934 | 0.005 | 1.071 | 0.005 | 0.93 | 0.03 | 10.3 |
| 0.398 | 0.005 | 2.512 | 0.012 | 0.59 | 0.03 | 6.6 |
| 14.015 | 0.005 | 0.071 | 0.000 | 0.22 | 0.06 | 8.9 |
| 3.128 | 0.005 | 0.320 | 0.002 | 0.19 | 0.07 | 6.2 |
| 6.530 | 0.005 | 0.153 | 0.001 | 0.19 | 0.06 | 8.0 |
| 4.422 | 0.005 | 0.226 | 0.001 | 0.17 | 0.06 | 6.9 |
| 3.244 | 0.005 | 0.308 | 0.001 | 0.13 | 0.06 | 4.2 |
| 3.050 | 0.005 | 0.328 | 0.002 | 0.15 | 0.06 | 5.1 |
| Frequency | Period | Amplitude | S/N | |||
| () | () | (days) | (days) | (ppt) | (ppt) | |
| 4U 1145–61 (10,11) | ||||||
| 2.155 | 0.005 | 0.464 | 0.002 | 1.48 | 0.08 | 8.7 |
| 1.502 | 0.005 | 0.666 | 0.003 | 1.28 | 0.08 | 7.5 |
| 2.103 | 0.005 | 0.475 | 0.002 | 1.02 | 0.08 | 6.0 |
| 0.383 | 0.005 | 2.610 | 0.012 | 0.98 | 0.08 | 5.8 |
| 3.217 | 0.005 | 0.311 | 0.001 | 0.84 | 0.10 | 11.6 |
| 3.063 | 0.005 | 0.327 | 0.002 | 0.71 | 0.10 | 9.9 |
| 3.158 | 0.005 | 0.317 | 0.002 | 0.68 | 0.10 | 9.4 |
| 4.566 | 0.005 | 0.219 | 0.001 | 0.42 | 0.09 | 7.9 |
| 8.652 | 0.005 | 0.116 | 0.001 | 0.42 | 0.09 | 9.9 |
| 3.625 | 0.005 | 0.276 | 0.001 | 0.37 | 0.09 | 5.1 |
| 8.238 | 0.005 | 0.121 | 0.001 | 0.30 | 0.09 | 7.0 |
| 4.379 | 0.005 | 0.228 | 0.001 | 0.26 | 0.09 | 4.9 |
| 4U 1145–61 (37,38) | ||||||
| 2.795 | 0.005 | 0.358 | 0.002 | 2.55 | 0.04 | 19.4 |
| 2.160 | 0.005 | 0.463 | 0.002 | 2.47 | 0.04 | 18.8 |
| 2.104 | 0.005 | 0.475 | 0.002 | 1.52 | 0.04 | 11.6 |
| 3.244 | 0.005 | 0.308 | 0.001 | 0.70 | 0.06 | 12.0 |
| 4.560 | 0.005 | 0.219 | 0.001 | 0.55 | 0.06 | 10.0 |
| 3.024 | 0.005 | 0.331 | 0.002 | 0.55 | 0.06 | 9.4 |
| 8.651 | 0.005 | 0.116 | 0.001 | 0.47 | 0.06 | 12.2 |
| 12.698 | 0.005 | 0.079 | 0.000 | 0.32 | 0.06 | 11.4 |
| 10.221 | 0.005 | 0.098 | 0.001 | 0.30 | 0.06 | 8.0 |
| 4.270 | 0.005 | 0.234 | 0.001 | 0.28 | 0.06 | 5.1 |
| 3.316 | 0.005 | 0.302 | 0.001 | 0.29 | 0.06 | 5.0 |
| 8.909 | 0.005 | 0.112 | 0.001 | 0.25 | 0.06 | 6.5 |
| 10.395 | 0.005 | 0.096 | 0.001 | 0.24 | 0.06 | 6.5 |
| GX 304–1 (38) | ||||||
| 1.802 | 0.009 | 0.555 | 0.005 | 6.17 | 0.12 | 12.9 |
| 6.768 | 0.009 | 0.148 | 0.001 | 3.24 | 0.12 | 21.4 |
| 7.185 | 0.009 | 0.139 | 0.001 | 3.13 | 0.12 | 20.7 |
| 1.018 | 0.009 | 0.983 | 0.009 | 2.14 | 0.12 | 4.5 |
| 3.018 | 0.009 | 0.331 | 0.003 | 1.79 | 0.16 | 14.1 |
| 3.601 | 0.009 | 0.278 | 0.003 | 0.96 | 0.16 | 7.6 |
| 8.559 | 0.009 | 0.117 | 0.001 | 0.88 | 0.16 | 9.3 |
| KS 1947+300 (41) | ||||||
| 0.498 | 0.009 | 2.006 | 0.019 | 0.92 | 0.12 | 5.0 |
| 3.652 | 0.009 | 0.274 | 0.003 | 0.68 | 0.12 | 6.2 |
| GRO J2058+42 (15) | ||||||
| 2.373 | 0.011 | 0.421 | 0.005 | 7.36 | 0.29 | 13.3 |
| 0.290 | 0.011 | 3.450 | 0.039 | 3.83 | 0.29 | 6.9 |
| 6.375 | 0.011 | 0.157 | 0.002 | 2.69 | 0.29 | 10.2 |
| 3.994 | 0.011 | 0.250 | 0.003 | 1.63 | 0.42 | 6.8 |
| 4U 2206+54 (16,17) | ||||||
| 0.590 | 0.005 | 1.696 | 0.008 | 3.35 | 0.13 | 11.2 |
| 1.008 | 0.005 | 0.992 | 0.005 | 2.49 | 0.13 | 8.3 |
| 0.279 | 0.005 | 3.585 | 0.018 | 2.16 | 0.13 | 7.2 |
| 0.511 | 0.005 | 1.956 | 0.010 | 1.84 | 0.13 | 6.1 |
| 0.810 | 0.005 | 1.234 | 0.006 | 2.23 | 0.13 | 7.4 |
| 1.264 | 0.005 | 0.791 | 0.004 | 1.76 | 0.13 | 5.8 |
| 6.136 | 0.005 | 0.163 | 0.001 | 0.85 | 0.20 | 14.2 |
| 3.284 | 0.005 | 0.304 | 0.002 | 0.75 | 0.20 | 7.9 |
| 3.067 | 0.005 | 0.326 | 0.002 | 0.66 | 0.20 | 7.0 |
| 3.388 | 0.005 | 0.295 | 0.001 | 0.60 | 0.20 | 6.4 |
| 3.121 | 0.005 | 0.320 | 0.002 | 0.51 | 0.20 | 5.4 |
| 3.682 | 0.005 | 0.272 | 0.001 | 0.49 | 0.20 | 5.1 |
| 3.963 | 0.005 | 0.252 | 0.001 | 0.44 | 0.20 | 4.7 |
| Frequency | Period | Amplitude | S/N | |||
| () | () | (days) | (days) | (ppt) | (ppt) | |
| SAX J2239.3+6116 (16,17) | ||||||
| 0.731 | 0.005 | 1.369 | 0.007 | 5.85 | 0.06 | 59.6 |
| 0.303 | 0.005 | 3.297 | 0.016 | 1.76 | 0.06 | 17.9 |
| 0.663 | 0.005 | 1.508 | 0.007 | 1.79 | 0.06 | 18.2 |
| 2.011 | 0.005 | 0.497 | 0.002 | 0.46 | 0.16 | 5.6 |
| 2.082 | 0.005 | 0.480 | 0.002 | 0.39 | 0.16 | 4.7 |
| SAX J2239.3+6116 (24) | ||||||
| 0.163 | 0.009 | 6.146 | 0.058 | 3.61 | 0.13 | 17.5 |
| 0.727 | 0.009 | 1.376 | 0.013 | 2.51 | 0.13 | 12.2 |
| 1.934 | 0.009 | 0.517 | 0.002 | 1.60 | 0.13 | 7.8 |
| 11.164 | 0.009 | 0.090 | 0.001 | 0.53 | 0.23 | 4.8 |
| MWC 656 (16) | ||||||
| 1.791 | 0.010 | 0.558 | 0.006 | 4.46 | 0.15 | 13.1 |
| 0.775 | 0.010 | 1.291 | 0.013 | 3.14 | 0.16 | 9.2 |
| 1.087 | 0.010 | 0.920 | 0.009 | 1.59 | 0.15 | 4.7 |
| 3.690 | 0.010 | 0.271 | 0.003 | 1.32 | 0.26 | 29.5 |
| 4.301 | 0.010 | 0.233 | 0.002 | 0.68 | 0.26 | 17.0 |
| Frequency | Period | Amplitude | S/N | |||
| () | () | (days) | (days) | (ppt) | (ppt) | |
| IGR J00370+6122 (17,18) | ||||||
| 0.203 | 0.005 | 4.919 | 0.024 | 6.49 | 0.10 | 31.8 |
| 0.407 | 0.005 | 2.458 | 0.012 | 4.20 | 0.09 | 20.6 |
| 0.556 | 0.005 | 1.799 | 0.009 | 3.99 | 0.09 | 19.6 |
| 0.126 | 0.005 | 7.951 | 0.040 | 3.00 | 0.09 | 14.7 |
| IGR J00370+6122 (24) | ||||||
| 0.363 | 0.009 | 2.751 | 0.026 | 4.84 | 0.15 | 14.3 |
| 0.713 | 0.009 | 1.403 | 0.013 | 3.56 | 0.15 | 10.5 |
| 0.158 | 0.009 | 6.344 | 0.060 | 4.31 | 0.16 | 12.7 |
| 3.064 | 0.009 | 0.326 | 0.003 | 0.69 | 0.36 | 8.7 |
| 2S 0114+65 (18) | ||||||
| 0.149 | 0.010 | 6.700 | 0.069 | 20.52 | 0.08 | 154.0 |
| 0.349 | 0.010 | 2.864 | 0.029 | 6.27 | 0.07 | 47.0 |
| 2S 0114+65 (24,25) | ||||||
| 0.151 | 0.005 | 6.622 | 0.031 | 10.96 | 0.05 | 117.5 |
| 0.398 | 0.005 | 2.510 | 0.012 | 5.35 | 0.05 | 57.4 |
| Vela X–1 (8,9) | ||||||
| 0.222 | 0.005 | 4.498 | 0.022 | 31.70 | 0.03 | 882.8 |
| 0.117 | 0.005 | 8.512 | 0.042 | 9.86 | 0.04 | 274.6 |
| 0.038 | 0.005 | 26.288 | 0.129 | 6.22 | 0.03 | 173.2 |
| 0.335 | 0.005 | 2.981 | 0.015 | 10.12 | 0.03 | 281.7 |
| 0.750 | 0.005 | 1.334 | 0.006 | 5.42 | 0.02 | 151.0 |
Appendix D Log of the ground-based observations
This appendix summarizes the ground-based observations. We give the date of the observations, as modified Julian date and civil date, the number of data points per night and the filter used.
| MJD | Date | Site | (filter) |
| 4U 0115+63 | |||
| 54725 | 15-09-2008 | SKO | 45 (V) |
| 54726 | 16-09-2008 | SKO | 49 (V) |
| 54755 | 15-10-2008 | SKO | 52 (V) |
| 54756 | 16-10-2008 | SKO | 84 (V) |
| 55097 | 22-09-2009 | SKO | 21 (V) |
| 55098 | 23-09-2009 | SKO | 49 (V) |
| 55099 | 24-09-2009 | SKO | 26 (V) |
| 55100 | 25-09-2009 | SKO | 3 (V) |
| 55101 | 26-09-2009 | SKO | 24 (V) |
| 55102 | 27-09-2009 | SKO | 33 (V) |
| 55109 | 04-10-2009 | SKO | 28 (V) |
| 55110 | 05-10-2009 | SKO | 26 (V) |
| 55112 | 07-10-2009 | SKO | 8 (V) |
| 55113 | 08-10-2009 | SKO | 35 (V) |
| 55114 | 09-10-2009 | SKO | 41 (V) |
| 55115 | 10-10-2009 | SKO | 44 (V) |
| 55116 | 11-10-2009 | SKO | 44 (V) |
| RX J0146.9+6121/LS I +61 235 | |||
| 54725 | 15-09-2008 | SKO | 78 (V) |
| 54726 | 16-09-2008 | SKO | 75 (V) |
| 58382 | 20-09-2018 | SKO | 545 (V), 546 (B) |
| 58383 | 21-09-2018 | SKO | 632 (V), 635 (B) |
| 58384 | 22-09-2018 | SKO | 631 (V), 493 (B) |
| 58385 | 23-09-2018 | SKO | 635 (V), 635 (B) |
| SWIFT J0243.6+6124 | |||
| 58760 | 03-10-2019 | AOO | 43 (V), 43 (B) |
| 58765 | 08-10-2019 | AOO | 29 (V), 29 (B) |
| 58781 | 24-10-2019 | AOO | 29 (V), 29 (B) |
| 58782 | 25-10-2019 | AOO | 45 (V), 46 (B) |
| 58783 | 26-10-2019 | AOO | 37 (V), 38 (B) |
| RX J0441.0+4431/LS V 4417 | |||
| 58494 | 10-01-2019 | AOO | 7 (V), 75 (R) |
| 58495 | 11-01-2019 | AOO | 316 (V), 316 (R) |
| 58496 | 12-01-2019 | AOO | 354 (V), 353 (R) |
| 58498 | 14-01-2019 | AOO | 453 V), 453 (R) |
| 1A 0535+262 | |||
| 55109 | 04-10-2009 | SKO | 116 (V) |
| 55110 | 05-10-2009 | SKO | 58 (V) |
| 55113 | 08-10-2009 | SKO | 69 (V) |
| 55114 | 09-10-2009 | SKO | 155 (V) |
| 55115 | 10-10-2009 | SKO | 161 (V) |
| 55116 | 11-10-2009 | SKO | 152 (V) |
| IGR J06074+2205 | |||
| 58520 | 05-02-2019 | AOO | 40 (V), 38 (R) |
| 58521 | 06-02-2019 | AOO | 37 (V), 35 (R) |
| 58523 | 08-02-2019 | AOO | 46 (V), 44 (R) |
| 58526 | 11-02-2019 | AOO | 99 (V), 97 (R) |
| 58527 | 12-02-2019 | AOO | 66 (V), 65 (R) |
| KS 1947+300 | |||
| 55406 | 28-07-2010 | SKO | 67 (V) |
| 55407 | 29-07-2010 | SKO | 74 (V) |
| 55408 | 30-07-2010 | SKO | 67 (V) |
| 55778 | 04-08-2011 | SKO | 90 (V) |
| 55779 | 05-08-2011 | SKO | 94 (V) |
| 55780 | 06-08-2011 | SKO | 45 (V) |
| MJD | Date | Site | (filter) |
| Swift J2000.6+3210 | |||
| 59424 | 28-07-2021 | SKO | 107 (V) |
| 59425 | 29-07-2021 | SKO | 78 (V) |
| 59426 | 30-07-2021 | SKO | 37 (V) |
| 59427 | 31-07-2021 | SKO | 72 (V) |
| 59446 | 19-08-2021 | SKO | 104 (V) |
| 59447 | 20-08-2021 | SKO | 112 (V) |
| 59448 | 21-08-2021 | SKO | 111 (V) |
| 59449 | 22-08-2021 | SKO | 48 (V) |
| GRO J2058+42 | |||
| 59046 | 15-07-2020 | SKO | 149 (V) |
| 59047 | 16-07-2020 | SKO | 150 (V) |
| 59048 | 17-07-2020 | SKO | 117 (V) |
| 59049 | 18-07-2020 | SKO | 145 (V) |
| SAX J2103.5+4545 | |||
| 55097 | 22-09-2009 | SKO | 18 (V) |
| 55098 | 23-09-2009 | SKO | 27 (V) |
| 55099 | 24-09-2009 | SKO | 31 (V) |
| 55100 | 25-09-2009 | SKO | 3 (V) |
| 55101 | 26-09-2009 | SKO | 25 (V) |
| 55102 | 27-09-2009 | SKO | 27 (V) |
| 55109 | 04-10-2009 | SKO | 13 (V) |
| 55110 | 05-10-2009 | SKO | 21 (V) |
| 55112 | 07-10-2009 | SKO | 6 (V) |
| 55113 | 08-10-2009 | SKO | 27 (V) |
| 55114 | 09-10-2009 | SKO | 21 (V) |
| 55115 | 10-10-2009 | SKO | 22 (V) |
| 55116 | 11-10-2009 | SKO | 21 (V) |
| 59058 | 27-07-2020 | SKO | 293 (V) |
| 59059 | 28-07-2020 | SKO | 320 (V) |
| 59060 | 29-07-2020 | SKO | 400 (V) |
| 59061 | 30-07-2020 | SKO | 400 (V) |
| IGR J21343+4738 | |||
| 58309 | 09-07-2018 | AOO | 26 (V), 25 (R) |
| 58310 | 10-07-2018 | AOO | 27 (V), 27 (R) |
| 58310 | 10-07-2018 | SKO | 25 (V), 25 (R) |
| 58311 | 11-07-2018 | SKO | 92 (V), 92 (R) |
| 58312 | 12-07-2018 | SKO | 67 (V), 67 (R) |
| 58313 | 13-07-2018 | AOO | 24 (V), 22 (R) |
| 58318 | 18-07-2018 | AOO | 35 (V), 33 (R) |
| 58696 | 31-07-2019 | SKO | 61 (V), 61 (B) |
| 58697 | 01-08-2019 | SKO | 48 (V), 48 (B) |
| 58698 | 02-08-2019 | SKO | 63 (V), 63 (B) |
| 58713 | 17-08-2019 | AOO | 36 (V), 37 (B) |
| 58717 | 21-08-2019 | AOO | 43 (V), 44 (B) |
| 58719 | 23-08-2019 | AOO | 44 (V), 43 (B) |
| 58721 | 25-08-2019 | AOO | 28 (V), 28 (B) |
| 58725 | 29-08-2019 | AOO | 32 (V), 32 (B) |
| 58727 | 31-08-2019 | AOO | 51 (V), 51 (B) |
| 58745 | 18-09-2019 | AOO | 25 (V), 26 (B) |
| 58749 | 22-09-2019 | AOO | 34 (V), 34 (B) |
| 58752 | 25-09-2019 | AOO | 33 (V), 33 (B) |
| MJD | Date | Site | (filter) |
| Cep X–4 | |||
| 59084 | 22-10-2020 | SKO | 240 (V) |
| 59085 | 23-10-2020 | SKO | 250 (V) |
| 59086 | 24-09-2020 | SKO | 237 (V) |
| 4U 2206+54 | |||
| 54755 | 15-10-2008 | SKO | 138 (V) |
| 54756 | 16-10-2008 | SKO | 177 (V) |
| 55097 | 22-09-2009 | SKO | 65 (V) |
| 55098 | 23-09-2009 | SKO | 106 (V) |
| 55099 | 24-09-2009 | SKO | 87 (V) |
| 55100 | 25-09-2009 | SKO | 9 (V) |
| 55101 | 26-09-2009 | SKO | 87 (V) |
| 55102 | 27-09-2009 | SKO | 104 (V) |
| 55109 | 04-10-2009 | SKO | 72 (V) |
| 55110 | 05-10-2009 | SKO | 100 (V) |
| 55112 | 07-10-2009 | SKO | 43 (V) |
| 55113 | 08-10-2009 | SKO | 103(V) |
| 55114 | 09-10-2009 | SKO | 79 (V) |
| 55115 | 10-10-2009 | SKO | 89 (V) |
| 55116 | 11-10-2009 | SKO | 84 (V) |
| SAX J2239.3+6116 | |||
| 55796 | 22-08-2011 | SKO | 100 (V) |
| 55797 | 23-08-2011 | SKO | 100 (V) |
| 55798 | 24-08-2011 | SKO | 100 (V) |
| 55799 | 25-08-2011 | SKO | 100 (V) |
| 58716 | 20-08-2019 | SKO | 40 (V), 40 (B) |
| 58717 | 21-08-2019 | SKO | 40 (V), 40 (B) |
| 58718 | 22-08-2019 | SKO | 41 (V), 41 (B) |
| 58719 | 23-08-2019 | SKO | 35 (V), 35 (B) |
| MWC 656 | |||
| 58758 | 01-10-2019 | AOO | 264 (V), 280 (B) |
| 58759 | 02-10-2019 | AOO | 228 (V), 244 (B) |
| 58761 | 04-10-2019 | AOO | 269 (V), 267 (B) |
| 58763 | 06-10-2019 | AOO | 190 (V), 192 (B) |
| 58764 | 07-10-2019 | AOO | 227 (V), 204 (B) |
Appendix E Detected frequencies from ground-based observations
Table 12 gives the significant frequencies detected in the data obtained from the Skinakas observatory.
| System | Frequency | Period | Amplitude | S/N |
|---|---|---|---|---|
| () | (hour) | (mmag) | ||
| 4U 0115+63 (2008) | 3.40 | 7.06 | 17.0 | 8.1 |
| 4U 0115+63 (2009) | 3.33 | 7.21 | 13.4 | 8.5 |
| RX J0146.9+6121 | 2.90 | 8.28 | 6.1 | 6.2 |
| 9.70 | 2.47 | 4.1 | 8.3 | |
| 1.36 | 17.6 | 3.7 | 3.7 | |
| Swift J0243.6+6124 | – | – | – | – |
| RX J0440.9+4431 | 3.20 | 7.50 | 10 | 3.5 |
| 1A 0535+262 | – | – | – | – |
| IGR J06074+2205 | – | – | – | – |
| KS 1947+300 (2011) | 2.31 | 10.4 | 3.9 | 12.5 |
| 2.73 | 8.79 | 2.2 | 6.5 | |
| Swift J2000.6+3210 | 2.79 | 8.60 | 6.6 | 10 |
| GRO J2058+42 (2020) | 2.40 | 10.0 | 5.3 | 13.0 |
| 2.64 | 9.09 | 5.0 | 12.0 | |
| 3.97 | 6.05 | 3.0 | 6.6 | |
| SAX J2103.5+4545 (2009) | 3.22 | 7.45 | 4.1 | 4.9 |
| SAX J2103.5+4545 (2020) | 2.70 | 8.89 | 2.3 | 8.3 |
| 2.40 | 10.0 | 1.4 | 5.6 | |
| IGR J21343+4738 (2018) | 3.66 | 6.56 | 5.0 | 4.0 |
| IGR J21343+4738 (2019) | 2.74 | 8.76 | 5.2 | 5.7 |
| 4.69 | 5.12 | 3.9 | 4.7 | |
| CEP X–4 | 2.07 | 11.6 | 3.6 | 8.0 |
| 5.37 | 4.47 | 2.4 | 5.1 | |
| 4U 2206+54 (2008) | 2.63 | 9.13 | 5.3 | 30.0 |
| 4.86 | 4.94 | 3.2 | 8.2 | |
| 4U 2206+54 (2009) | 2.12 | 11.3 | 3.6 | 5.8 |
| 2.60 | 9.23 | 5.3 | 3.9 | |
| SAX J2239.3+6116 (2011) | 1.98 | 12.1 | 9.6 | 17.4 |
| SAX J2239.3+6116 (2019) | – | – | – | – |
| MWC 656 | 2.78 | 8.63 | 9.3 | 7.5 |
| 1.97 | 12.2 | 7.9 | 7.5 |