Plasma free bubble cavitation in water by a 2.9 µm laser for bioprinting applications
Abstract
We investigate the dynamics of the cavitation bubble induced by 2.9 µm mid-IR laser pulses (10 ns, 10-50 µJ) resulting in a plasma-free direct fast heating of water due to a strong vibrational absorption. We establish a direct correlation between the laser fluence (up to ) and the maximum bubble radius (up to 200 µm). From experimental data, key parameters (threshold energy, internal pressure) can be retrieved by simulations including the water absorption saturation at 2.9 µm. At a fluence of , we obtain 13 % of the laser energy converted to a bubble energy and we can predict that operating at higher fluence will lead to a maximum of 20 % conversion efficiency. This results open the door to bioprinting applications using direct absorption of the laser radiation without any additional absorber.
The following article has been submitted to Applied Physics Letters.
After it is published, it will be found at https://aip.scitation.org/journal/apl
Bioprinting of living cells has become in the last decade a new key technology to create complex 3D structures of bio-compounds [1] applied to regenerative medecine of skin, bones [2], vascularized tissues [3] or possibly artificial organs for transplantation [4].
Laser Assisted Bioprinting (LAB) is a beautiful biophotonic application involving laser technology, light-matter interaction, fluid mechanics and biology [5]. LAB consists in transferring the laser energy to an aqueous thin-film containing living cells to be printed. The deposited energy triggers a cavitation bubble causing the fluid to form a jet at the free surface and carrying the cells. The jet evolution solely depends on fluid dynamics but it finds its origin in the laser induced cavitation bubble. Stable jets in homogeneous liquids are usually formed when the maximum cavitation bubble radius is close from the free surface [6].
A widespread method of energy transfer consists in using a substrate coated with a thin layer of absorbing material supporting a 100-200 µm thick film of bio-ink. Various materials have been used as a ”sacrificial” absorber such as metals, metal-oxides or polymers [5]. The electrons are highly excited by the laser absorption leading to a plasma generation. The energy transferred to the fluid thus forms a bubble initiating the jet. However, printed tissues require complex patterns drawn by a scanner. Both the refreshing of the ablated sacrificial layer and the replacement of the bio-ink after few tens of patterns are the current limitation of the standard LAB approaches.
To circumvent this limitation, the plasma can be created in the medium itself. When near IR 10 µJ femtosecond [7] and picosecond [8] pulses are focused underneath the liquid surface at an intensity of , multiphoton or tunnel ionisation creates free electrons. This results in an optical breakdown. Its dynamics has revealed that the bubble formation [9, 10] originates from the fast heating caused by the electron-ion recombination [11]. Yet, spatial heterogeneity of media such as bio-ink combined with the highly nonlinear nature of the process hampers the repeatability of energy deposition via plasma formation.
A direct method for heating of liquids is the ’one photon’ absorption by water in some spectral bands. Depending on the physical and chemical processes following absorption, the survival of living cell can be affected by critical parameters such as pressure, temperature, or chemical composition.
Although fast and highly localized, water photolysis and the risk of DNA-degradation limits in practice the use of UV-lasers [12]. In the visible and near IR, liquids with adjuvent as absorber support the generation of sub-mm diameter bubbles by thermocavitation [13, 14, 15]. Superheated water (typ. up to 200-300 °C) forms a metastable liquid evolving in its phase diagram following a spinodal curve up to the critical point. This leads to an explosive liquid evaporation [15, 16, 17] causing the bubble to appear.
Taking advantage of the strong absorption of water in the mid-IR range allows adjuvent- and plasma-free energy deposition. We thus investigate laser-induced bubbles in the 2.9 µm vibrational absorption band of water. IR generated bubbles have been firstly observed with a 1 J-50 ns-10.6 µm CO2 laser [18]. The 2.9 µm band has been exploited to strongly ablate liquid surface by 10 mJ-70 ns-2.97 µm Er:YAG with fluence up to a 5.6 for laser-biological tissue applications [19]. Due to the ultrafast thermalization of the O-H stretch [20], picosecond pulses lower the required fluence down to 0.75 with 1 mJ pulse energy [21].
More recently, 45 ns-2.85 µm millijoule-class laser have been used to study shock waves and bubble cavitation [22] for fluence ranging from 0.45 to 2 . In such conditions, bubbles with maximum radius from 0.4 to 1.2 mm have been reported but their large size is not compatible with bioprinting applications. However, huge progress in the mid-IR laser technology make nowadays available robust diode-pumped industrial lasers sources based on solid-state (Cr:ZnSe), parametric oscillators or mid-IR Er-doped fibers delivering 1 to 100 µJ energies. Although promising to produce small bubbles ( 200 µm radius) key for bioprinting applications, this range of low energy mid-IR pulses is – to the best of our knowledge – still largely unexplored and is the scope of the present letter.
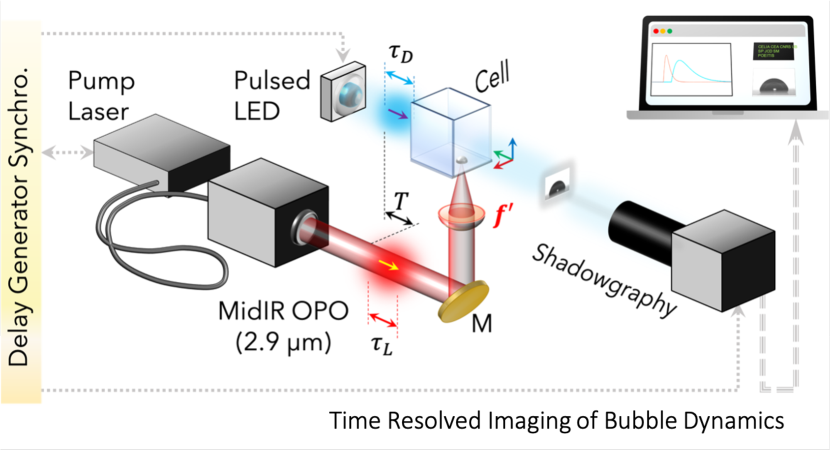
The experimental setup is depicted in Fig.1. The mid-IR source consists of an Optical Parametric Oscillator (OPO) (APE-GmbH) pumped by a 10 ns-1064 nm diode-pumped Nd:YAG Q-Switched laser (CANLAS Laser Processing GmbH). The laser operates from single-shot up to 1 kHz with a maximum pulse energy of 55 µJ at 2.9 µm. The experiments have been performed at few Hz to ensure that neither cumulative thermal effect nor residual acoustic wave from previous pulse disturb the liquid. The output energy is ajusted by a build-in variable attenuator down to 0.5 µJ with a shot-to-shot energy stability of 2.5 % rms. A five-wall polished spectroscopic quartz cell is filled with de-ionized water. The laser beam is focused upwards on the bottom of the cell using AR-coated CaF2 lenses (20, 40 or 50 mm focal length) or ZnSe microscope objective (12 mm focal length). From the output of the laser and the cell-water interface including the water-atmospheric absorption (), the overall transmission is 77 %.
A time resolved imaging is used to acquire sequences of images in a shadowgraphic configuration. It consists of a collimated-500 ns (FWHM)-pulsed blue LED propagating through the spectroscopic cell’s sidewalls and a triggered CMOS camera (UI-3260CP, IDS). A delay generator (SRS DG535) is used to externally trigger the laser and to synchronize the delays between the laser shot, the pulsed blue diode and the camera. A homemade program manages the delays, the camera and the recording of image sequences. The images are calibrated with a resolution test target (USAF) and a zoom lens assembly (OPTO) allowing a 3.7 maximum magnification resulting in a resolution of 3.57 µm/pixel.
For each laser energy, the bubble movie is reconstructed by recording 50 images at each delay after the laser pulse thus providing enough statistics for averaging shot-to-shot fluctuations. Each image was processed by Fuji [23] and the long and short axis radii (typ. 6 % r.m.s. accuracy) are extracted to track the bubble rim dynamics.
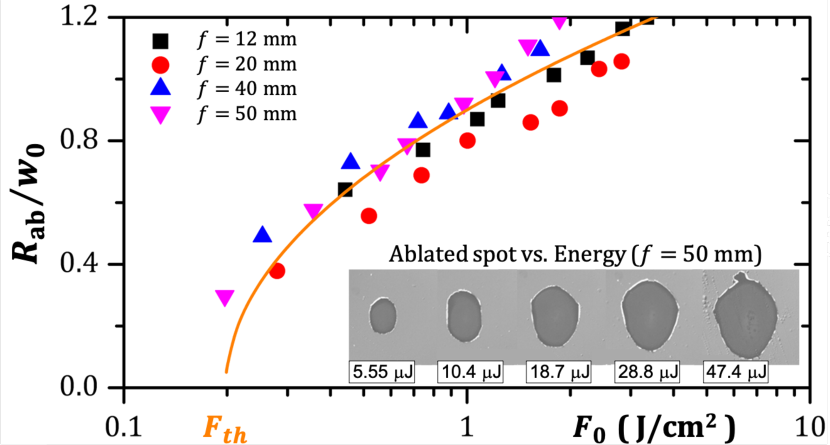
To estimate the fluence, we first determined the focal spot size. Since direct measurement of the focal spot is not feasible with standard large-pixel middle-infrared imaging sensors, we estimated the beam waist by using ablation spot size imaging. A 20 nm thick gold layer is ablated by a single shot of 2.9 µm laser pulse for different laser energies and different focal lengths. Then, the ablation spots are imaged using a microscope (NIKON) as shown in inset in Fig.2.
The measured ablation spot is plotted against laser energy (Fig.2). For a Gaussian beam in the vicinity of the confocal region, the fluence in polar coordinates reads where . The relationship between the mean diameter of the ablated area and fluence above gold ablation threshold is fitted by the equation [24], .
The extracted beam waist values respectively are 22.5, 25, 28, and 31.5 µm for lenses having focal length of 12, 20, 40, and 50 mm respectively, while the retrieved threshold is consistent with the value reported in the literature [25]. These measurements are more accurate than the estimate based on the values independently obtained (not shown) which underestimated the spot size. Fluence regimes ranging from 0.1 to 6 have then been investigated.
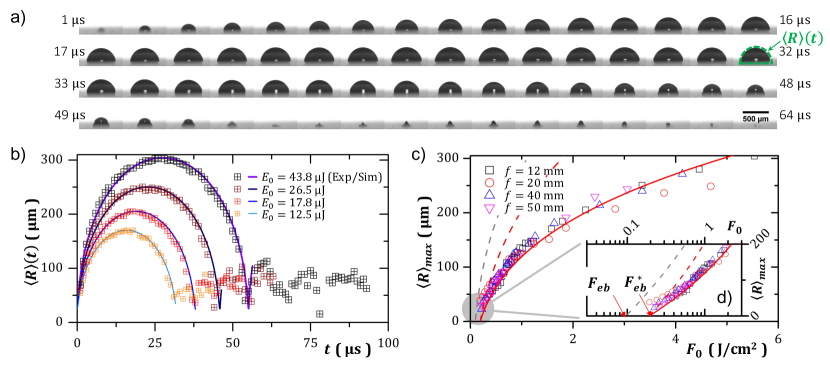
As already reported [18, 15, 22], a (quasi)hemispherical bubble of radius is created and further expands. In Fig.3(a), the bubble is sticked on the CaF2-water interface by the strong absorption of water at 3 µm ensuring a constant location of the bubble which is highly beneficial for the repeatability of the process. The bubble grows up to a maximum radius and starts collapsing beyond this maximum radius. In the vicinity of the first collapse event, Rayleigh-Taylor instability affecting the bubble shape is also observed, thus reducing the accuracy in bubble size extraction. After this first collapse, the subsequent bouncing dynamics is not influenced by the initial excitation anymore, and follows what has already been reported in the literature [26]. Up to three bounces were obtained for the highest energy available (43.8 µJ). We here focus our analysis on the first expansion-climax-collapse cycle as it is governed by the initial conditions resulting from the laser energy deposition investigated here.
In Fig.3(b) where the averaged bubble radius as a function of time is plotted, the dynamics follows the Rayleigh-Plesset equation:
| (1) |
where is the liquid phase (water) density, the surface tension, the dynamic viscosity, the pressure on the bubble surface, and the ambient atmospheric pressure [26].
The first bounce is well reproduced (solid lines in Fig.3(b)) by solving the Rayleigh-Plesset Eq. (1) using Euler’s method [27]. The experimentally observed first collapse time for 12.5 to 43.8 µJ energies is between 30 to 55 µs. This is in good agreement with both the numerical simulation and the Rayleigh-collapse time [28] where 2.33 kPa is the saturated vapour pressure.
To reveal the dependence of maximum bubble radius on laser fluence , several bubble dynamics were obtained using different laser energies and focusing conditions. Each focusing condition leads to a different vs. energy relationship. However, all curves merge together when the measured averaged bubble radii is plotted vs. the fluence (Fig.3(c)). This nonlinear relation between and fluence will be discussed later.
Contrasting with what can be observed with plasma-induced cavitation bubble in water, we didn’t observe any remaining bubbles in the cell even for the highest fluence investigated here. The absence of gas creation or accumulation between laser shots (repetition rate here typ. from 1 to 4 Hz) along with the absence of any recombination plasma light strongly indicates that the process is plasma-free. No residual gas products from water photolysis such as H2, O2, and O3 that might affect the living cells have been observed. This is consistent with the fact that the maximum density of energy deposited at , while the first and the second O-H bond dissociation energy density of the water molecule in liquid phase are 27.4 and 23.6 respectively. Hence, only the strong one-photon absorption at 3 µm in water is involved in the process of bubble generation.
Since the range of fluence () leading to the observation of cavitation bubble sizes ( 100 µm) is relatively high, we need to take into account the saturation [29, 30] of water absorption at 2.9 µm. From the saturated transmission measurements reported [30], we have fitted the Beer-Lambert’s law by the following ad hoc formula (see Supplementary material):
| (2) |
being the fluence dependent absorption coefficient (thereafter, the use of ∗ means that the saturation of absorption is taken into account) where is the unsaturated absorption coefficient, the asymptotic drop of absorption and with the saturation fluence. Although different from conventional saturated formulae, not only Eq.(2) better reproduces the reported results [30], but it also allows us to derive analytical expressions leading through thermodynamic considerations to the exact formulation of the excess energy initially available after explosive boiling for bubble expansion and then to the maximum bubble diameter that can be achieved.
The excited volume that contributes to bubble formation is defined as the volume for which the effective critical fluence has a deposited energy density that is exactly equal to the explosive boiling energy density () with no excess energy in both radial and longitudinal distributions. Including the saturation of absorption for a stigmatic Gaussian beam, we find which is about twice higher than the effective threshold in the absence of saturation ( ). Within a Gaussian beam cross-section, the maximum critical radius where explosive boiling may occur is then given by and corresponds to the off-axis distance where the fluence is sufficient to initiate a phase transition. The effective penetration depth inside the critical radius is deduced which leads after integration to the expression of the excited volume . Similarly, the excess energy available for bubble expansion is given by (see Supplementary material):
| (3) |
and the maximum bubble diameter is retrieved with the cavitation bubble energy expressed by Vogel et al. [9].
We applied this procedure only based on thermodynamics to estimate the maximum cavitation bubble diameter reachable at a given laser fluence deposited in water. The results are shown in Fig.3(c) and (d) with the dashed and plain lines corresponding to different conditions. As highlighted by a closer inspection near threshold (Fig.3(d)), the absence of saturation of the absorption leads both to a lower expected threshold of bubble appearance and a much higher increase of the bubble size as the fluence is growing (gray dashed line) than experimentally observed. The saturation of water absorption pushes the threshold exactly where it is experimentally observed but the maximum bubble size is still overestimated when 100 % of the excess explosive boiling energy is converted into bubble energy (red dashed line). If 20 % of the excess energy is converted in bubble energy, one can see that the estimated expected bubble diameters (red plain line) fit perfectly the experimental data over a full decade in fluence.
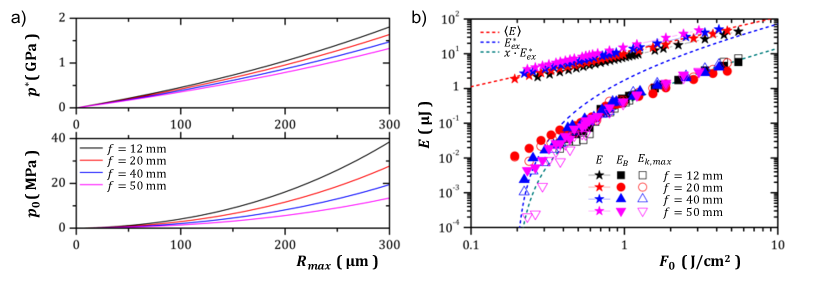
The energy and the volume allow us to estimate the initial pressure (see Supplementary material). In Fig.4(a), is in the range of several hundreds of MPa to few GPa when the maximum radius of the bubble grows up to 300 µm for the different focal lenses used in the experiment. is excessively high and it leads to an acoustic radiation [31] and a shock-wave [32, 33, 34] dissipating part of the deposited energy while surface tension and viscosity play a negligible role.
The relative amount of energy released in the shock-wave can be evaluated from the dimensionless parameter [35]
where is the pressure difference at and is the noncondensable gas pressure at , is the speed of sound in water, and according to the Keller-Miksis model [36]. For a polytropic index , even a high residual pressure already leads to 40 % of the total energy released in the shock. With a 6 ns-1064 nm laser focused in water at the same range of fluence, Vogel et al. [9] have reported a range between 35 % and 70 % of conversion to shock energy during the interaction. This implies that a substantial amount of the laser energy is carried by the generated shock wave during the interaction of the laser pulse with water regardless the wavelength of the laser and the process of the fast heating.
The rest of the energy is used to start the growth of the bubble with a lower initial pressure . In order to evaluate this pressure, we solved the Rayleigh-Plesset for all dynamics with a varying initial radius and a varying initial pressure with a numerical sensitivity of 1 %, being refined by least-square fitting the first cycle dynamics. In Fig.4(a), is in the range of few tens of MPa when a maximum bubble radius of 300 µm is reached for the different lenses. In the scope of bioprinting application, living cells present in the focal volume during the bubbling process will thus experience this quite high pressure could have an impact on their viability. However, we can produce equivalent bubble radius with a lower initial pressure by using a longer focal length but a larger energy. The initial pressure is almost four times lower when using a 50 mm focal length rather than a 12 mm focal length (Fig.4(a)). Therefore, long focusing lens are likely to be preferable for bioprinting applications as the living cell will be exposed to lower pressure.
An another important aspect is the efficiency of light-to-mechanical energy conversion process. The bubble initially grows with a constant velocity and the corresponding maximum kinetic energy is calculated by fitting the initial dynamics of the bubble for each conditions. As it can be seen in Fig.4(b), and are largely equal over a large range of fluence showing that most of the mechanical energy is converted in bubble energy with no losses due to friction, vorticity, nor bubble wall motion at the triple contact point between gas, liquid, and substrate.
Moreover, at low fluence, most of the laser energy is used to heat the liquid, only a small fraction is being converted into explosive boiling. At , we achieve with the 2.9 µm-10 ns laser 7 % efficiency of bubble generation analogous to what Pushkin et al. [22] have reported with a 5 % efficiency by using a 2.85 µm-45 ns laser at the same fluence. At , we achieve 13 % but at larger fluence close to , the excess energy converges to the laser energy and in such condition a maximum of 20 % efficiency can be expected. Operating at larger fluence than would increase the efficiency to the limit but with much bigger bubbles that will not be compatible with the bioprinting application.
In this letter, we have investigated the dynamics of cavitation bubble in water generated by microjoule nanosecond pulses emitted at 2.9 µm with different focusing and energy conditions. As far as bioprinting applications are concerned, few directions can be drawn from this work. It clearly shows that the cavitation bubble dynamics is only governed by the deposited laser fluence in the medium. At this wavelength, only the strong single photon absorption of water is involved through the explosive boiling in the bubble generation, while no evidence for any plasma creation has been observed. The constant location of the bubble without any added artificial absorber and other chemical compounds created during the interaction is a highly beneficial advantage compared to the other methods, insuring repeatability, stability and purity. In the regime of fluence , the saturation of the water absorption must be taken into account in order to estimate correctly the volume of interaction and the energy transferred from the laser to the bubble. In these conditions, we have shown that at high fluence () a maximum of 20 of the laser energy can be expected to be transferred into the bubble, the rest being converted in shock wave. For the targeted bioprinting application, longer focal length thus seem preferable in order to decrease the internal pressure in the bubble that might be experienced by the cells.
These experiments and analysis pave the way to complex structuring of living tissues by using mid-IR laser technology without any assistance of artificial absorber. It also opens the way towards a full automation of the bioprinting where the reproductibility and stability of the cell deposition in a shorter time ensure a reliable, cost-effective process compliant with the GMP grade requirements.
Supplementary Material
See supplementary material for the analytical calculations of the effective threshold for explosive boiling and the excited volume leading to the determination of the excess energy for explosive boiling and the initial pressure .
Acknowledgments
We wish to acknowledge Pierre Hericourt for the development under Python of an automatic data acquisition system managing thousands of frames, images and delays allowing fast high quality data collection and enabling reliable statistic operations. Technical support from Edlef Büttner (APE GmbH) for laser installation and troubleshooting solving has also been much appreciated. This work has been supported by Eureka - Eurostars MIR-LAB n° E111513
Data Availability Statement
The data that support the findings of this study are available from the corresponding author upon reasonable request.
References
- [1] F. Guillemot, A. Souquet, S. Catros, B. Guillotin, J. Lopez, M. Faucon, B. Pippenger, R. Bareille, M. Rémy, S. Bellance, P. Chabassier, J. C. Fricain, and J. Amédée. High-throughput laser printing of cells and biomaterials for tissue engineering. Acta Biomaterialia, 6:2494–2500, 2010.
- [2] V. Keriquel, H. Oliveira, M. Rémy, S. Ziane, S. Delmond, B. Rousseau, S. Rey, S. Catros, J. Amédée, F. Guillemot, and J.-C. Fricain. In situ printing of mesenchymal stromal cells, by laser-assisted bioprinting, for in vivo bone regeneration applications. Sci Rep, 7, May 2017.
- [3] Yi Zhang, Piyush Kumar, Songwei Lv, Di Xiong, Hongbin Zhao, Zhiqiang Cai, and Xiubo Zhao. Recent advances in 3d bioprinting of vascularized tissues. Materials & Design, 199:109398, 2021.
- [4] J. Li, M. Chen, and H. Zhou. Recent advances in bioprinting techniques: approaches, applications and future prospects. Journal of Translational Medicine, 14:271, 2016.
- [5] C. Dou, V. Perez, J. Qu, A. Tsin, B. Xu, and J. Li. A state-of-the-art review of laser-assisted bioprinting and its future research trends. ChemBioEng Reviews, 8:1–19, 2021.
- [6] A. Patrascioiu, J. M. Fernández-Pradas, A. Palla-Papavlu, J. L. Morenza, and P. Serra. Laser-generated liquid microjets: correlation between bubble dynamics and liquid ejection. Microfluid Nanofluid, 16(1):55–63, 2014.
- [7] M. Duocastella, A. Patrascioiu, J. M. Fernández-Pradas, J. L. Morenza, and P. Serra. Film-free laser forward printing of transparent and weakly absorbing liquids. Opt. Express, OE, 18(21):21815–21825, 2010.
- [8] S. Petit, O. Kérourédan, R. Devillard, and E. Cormier. Femtosecond versus picosecond laser pulses for film-free laser bioprinting. Appl. Opt., 56(31):8648–8655, 2017.
- [9] A. Vogel, J. Noack, K. Nahen, D. Theisen, S. Busch, U. Parlitz, D.X. Hammer, G.D. Noojin, B.A. Rockwell, and R. Birngruber. Energy balance of optical breakdown in water at nanosecond to femtosecond time scales. Appl Phys B, 68:271–280, 1999.
- [10] A. Vogel, J. Noack, G. Hüttman, and G. Paltauf. Mechanisms of femtosecond laser nanosurgery of cells and tissues. Appl. Phys. B, 81:1015–1047, 2005.
- [11] C. B. Schaffer, N. Nishimura, E. N. Glezer, A. M.-T. Kim, and E. Mazur. Dynamics of femtosecond laser-induced breakdown in water from femtoseconds to microseconds. Opt. Express, 10(3):196–203, 2002.
- [12] Z. Zhang, C. Xu, R. Xiong, D. B. Chrisey, and Y. Huang. Effects of living cells on the bioink printability during laser printing. Biomicrofluidics, 11(3):034120, 2017.
- [13] S. F. Rastopov and A. T. Sukhodol’sky. Cluster nucleation in the process of CW laser induced thermocavitation. Physics Letters A, 149(4):229–232, 1990.
- [14] J. C. Ramirez-San-Juan, E. Rodriguez-Aboytes, A. E. Martinez-Canton, O. Baldovino-Pantaleon, A. Robledo-Martinez, N. Korneev, and R. Ramos-Garcia. Time-resolved analysis of cavitation induced by CW lasers in absorbing liquids. Opt. Express, OE, 18(9):8735–8742, 2010.
- [15] J. P. Padilla-Martinez, C. Berrospe-Rodriguez, G. Aguilar, J. C. Ramirez-San-Juan, and R. Ramos-Garcia. Optic cavitation with cw lasers: A review. Physics of Fluids, 26:122007, 2014.
- [16] A. Vogel, N. Linz, S. Freidank, and G. Paltauf. Femtosecond-laser-induced nanocavitation in water: Implications for optical breakdown threshold and cell surgery. Phys. Rev. Lett., 100(3):038102, 2008.
- [17] R. Xiong, Z. Zhang, J. Shen, Y. Lin, Y. Huang, and D. B. Chrisey. Bubble formation modeling during laser direct writing of glycerol solutions. Journal of Micro and Nano-Manufacturing, 3(1), 2015.
- [18] D. C. Emmony, B. M. Geerken, and A. Straaijer. The interaction of 10.6 µm laser radiation with liquids. Infrared Physics, 16(1):87–92, 1976.
- [19] I. Apitz and A. Vogel. Material ejection in nanosecond er:YAG laser ablation of water, liver, and skin. Appl. Phys. A, 81(2):329–338, 2005.
- [20] K. Franjić and D. Miller. Vibrationally excited ultrafast thermodynamic phase transitions at the water/air interface. Phys. Chem. Chem. Phys., 12:5225, 2010.
- [21] K. Franjic, M. L. Cowan, D. Kraemer, and R. J. D. Miller. Laser selective cutting of biological tissues by impulsive heat deposition through ultrafast vibrational excitations. Opt. Express, OE, 17(25):22937–22959, 2009.
- [22] A. V. Pushkin, A. S. Bychkov, A. A. Karabutov, and F. V. Potemkin. Cavitation and shock waves emission on the rigid boundary of water under mid-IR nanosecond laser pulse excitation. Laser Phys. Lett., 15(6):065401, 2018.
- [23] Johannes Schindelin, Ignacio Arganda-Carreras, Erwin Frise, Verena Kaynig, Mark Longair, Tobias Pietzsch, Stephan Preibisch, Curtis Rueden, Stephan Saalfeld, Benjamin Schmid, Jean-Yves Tinevez, Daniel James White, Volker Hartenstein, Kevin Eliceiri, Pavel Tomancak, and Albert Cardona. Fiji: an open-source platform for biological-image analysis. Nat Methods, 9(7):676–682, 2012.
- [24] J. M. Liu. Simple technique for measurements of pulsed gaussian-beam spot sizes. Opt. Lett., 7:196–198, 1982.
- [25] C. Kern, M. Zürch, J. Petschulat, T. Pertsch, B. Kley, T. Käsebier, U. Hübner, and C. Spielmann. Comparison of femtosecond laser-induced damage on unstructured vs. nano-structured au-targets. Applied Physics A, 104(1):15, 2011.
- [26] X. Zhong, J. Eshraghi, P. Vlachos, S. Dabiri, and A.M. Ardekani. A model for a laser-induced cavitation bubble. International Journal of Multiphase Flow, 132:103433, 2020.
- [27] K. Yasui. Acoustic Cavitation and Bubble Dynamics. Ultrasound and Sonochemistry. Springer International Publishing, 2018.
- [28] Lord Rayleigh. VIII. On the pressure developed in a liquid during the collapse of a spherical cavity. Philosophical Magazine Series 6, 34:94–98, 1917.
- [29] K. Franjić. Studies of Laser Ablation of liquid water under conditions of impulsive heat deposition through vibrational excitations (IHDVE). Ph.D. thesis, University of Toronto, 2010.
- [30] R.K. Shori, A.A. Walston, O.M. Stafsudd, D. Fried, and J.T. Walsh. Quantification and modeling of the dynamic changes in the absorption coefficient of water at = 2.94 µm. IEEE Journal of Selected Topics in Quantum Electronics, 7(6):959–970, 2001.
- [31] Qianxi Wang. Local energy of a bubble system and its loss due to acoustic radiation. Journal of Fluid Mechanics, 797:201–230, 2016.
- [32] A. Vogel, S. Busch, and U. Parlitz. Shock wave emission and cavitation bubble generation by picosecond and nanosecond optical breakdown in water. The Journal of the Acoustical Society of America, 100(1):148–165, 1996.
- [33] Y. Tomita, M. Tsubota, and N. An-naka. Energy evaluation of cavitation bubble generation and shock wave emission by laser focusing in liquid nitrogen. Journal of Applied Physics, 93(5):3039–3048, 2003.
- [34] R. Petkovšek and P. Gregorčič. A laser probe measurement of cavitation bubble dynamics improved by shock wave detection and compared to shadow photography. Journal of Applied Physics, 102(4):044909, 2007.
- [35] M. Tinguely, D. Obreschkow, P. Kobel, N. Dorsaz, A. de Bosset, and M. Farhat. Energy partition at the collapse of spherical cavitation bubbles. Phys. Rev. E, 86:046315, Oct 2012.
- [36] J. B. Keller and M. Miksis. Bubble oscillations of large amplitude. The Journal of the Acoustical Society of America, 68(2):628–633, 1980.
Supplementary Material: Plasma free bubble cavitation in water by a 2.9 µm laser for bioprinting applications
Pulse propagation and ad hoc formula for saturated absorption
Due to the range of fluence used in laser induced cavitation, the energy deposition cannot be simply described by a linear Beer-Lambert’s absorption law. Instead, we must include saturation effects of the middle infrared (2.9 µm) absorption band by replacing the linear (unsaturated) absorption coefficient with a fluence dependent one . Here is the fluence of a laser beam with a time-dependent intensity propagating along and denotes the saturation. For simplicity we assume the beam is initially Gaussian in space and time such that:
| (4) |
where in the beam waist and is the duration. In cylindrical coordinates the fluence reads where the maximum fluence is .
Even in the presence of saturation, the strong absorption in the 3 µm range results in a very limited penetration depth typically on the order of few central wavelength. In this regime where diffraction phenomena can be neglected, the evolution of can be written as
| (5) |
As a consequence, Eq.(5) can be solved in the line-of-sight (LoS) approximation, meaning that the fluence profile at any can be obtained by integrating Eq.(5) as an ODE for a fixed set of (a given LoS) with the initial condition corresponding to the incident beam profile. For a Gaussian profile, the dependence can be omitted.
The modulus of the r.h.s in Eq.(5) represents the density of energy deposition (in Jm-3 or Jcm-3), i.e. the source term in the transient heat equation. As a consequence, the detailed evolution of as the beam penetrates into the liquid has a great influence on the (density) energy deposition that is more or less localized and which magnitude can be greatly affected by the form taken by .
The fluence dependent absorption coefficient can be written:
| (6) |
where is the unsaturated absorption coefficient (), the drop of absorption () and the saturation fluence. Eq.(6) differs from the conventional saturation formula .
The conventional saturation law often used in the literature is based on rate-equations involving few discrete levels and valid only for dilute concentration of absorbing molecules. The ad hoc formula (6) reproduces the simulated characteristic features (sharper transition, non-vanishing residual absorption) when collective effects arise from strong couplings due to high concentration.
The Eq.(5) can be integrated using Eq.(6) leading to:
| (7) |
where , and . Introducing the fluence at the output of the sample of thickness such that where is the incident fluence dependent transmission, one can write:
| (8) |
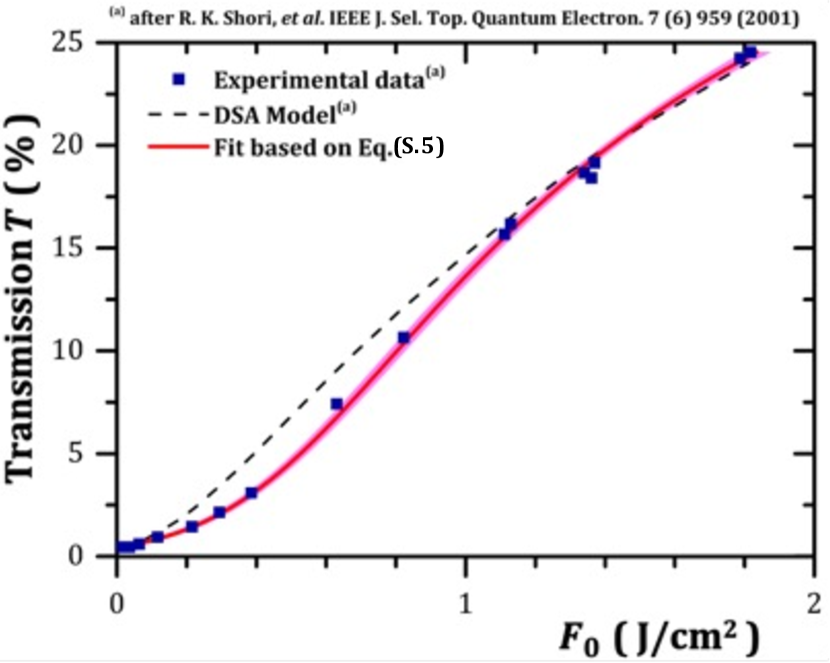
Using Eq.(8), it is thus possible to fit the experimental data (Fig.5) obtained by Shori, et al. [R. K. Shori, et al. ”Quantification and modeling of the dynamic changes in the absorption coefficient of water at = 2.94 µm,” IEEE J. Sel. Top. Quantum Electron. 7 (6) 959-970 (2001)]. The fit is performed for a fixed thickness 4.26 µm. The retrieved fitting parameters are , (and the derived parameters , and ), and .
Although based on the ad hoc relationship Eq.(6), fitting with Eq.(8) results in a much better qualitative and quantitative agreement (see Fig.5) with the experiment than the prediction derived from the Dynamical Saturated Absorber (DSA) model developed by Shori, et al. This is especially true in the 0-to-1 J/cm-2 range of fluence where explosive boiling occurs. Consequently Eq.(6) provides a much better description for the energy deposition which is key for the bubble formation. As we shall see below, not only Eq.(6) better reproduces the reported results, but it also allows us to derive analytical expressions leading by thermodynamic considerations to the exact formulation of the excess energy initially available after explosive boiling for bubble expansion and then to the maximum reachable bubble diameter.
Effective threshold fluence for explosive boiling
We first define as the effective critical fluence for which the density of deposited energy exactly corresponds to the explosive boiling energy density with no excess energy. Considering the expression Eq.(6) for , is given by:
| (9) |
where , and is the threshold in the absence of saturation effect (). After calculation, we find which is almost twice higher than the threshold in the absence of saturation .
As it propagates, when the local beam fluence , the density of deposited energy exceed the specific spinodal energy required to vaporize the water explosively, thus leading the vapour creation. If , then the pulse energy is still absorbed resulting in a temperature rise yet remaining below the vaporization limit.
Consequently, there is a region of space defining a volume satisfying where vapour will be created with some excess energy leading to the bubble expansion.
Critical radius , penetration depth and the corresponding volume for explosive boiling
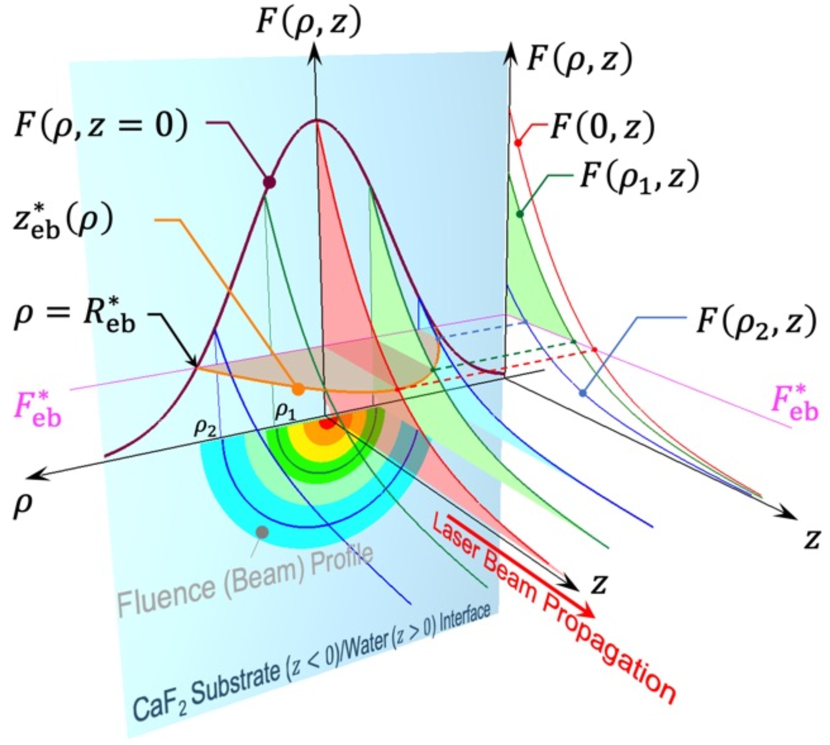
In order to evaluate for a Gaussian beam, we first note that at the input where the CaF2-water interface is located (see Fig.6), the requirement may be written:
Similar to the ablation spot-size formula, we can thus define a critical radius:
| (10) |
Within the beam profile, explosive boiling thus can only occur if .
Secondly, as the beam penetrates into the liquid, its fluence decreases with (see Fig.6). In the LoS approximation, for each () defining the LoS considered, the explosive boiling condition is fulfilled up to a certain critical penetration depth such that (see projections in Fig.6).
We can thus use Eq.(7) to evaluate for each LoS (each of constant fluence in the case of an axially symmetric beam) what is the maximum depth at which explosive boiling may occur. This penetration depth (inside the critical radius) for explosive boiling is given by:
| (11) |
where and .
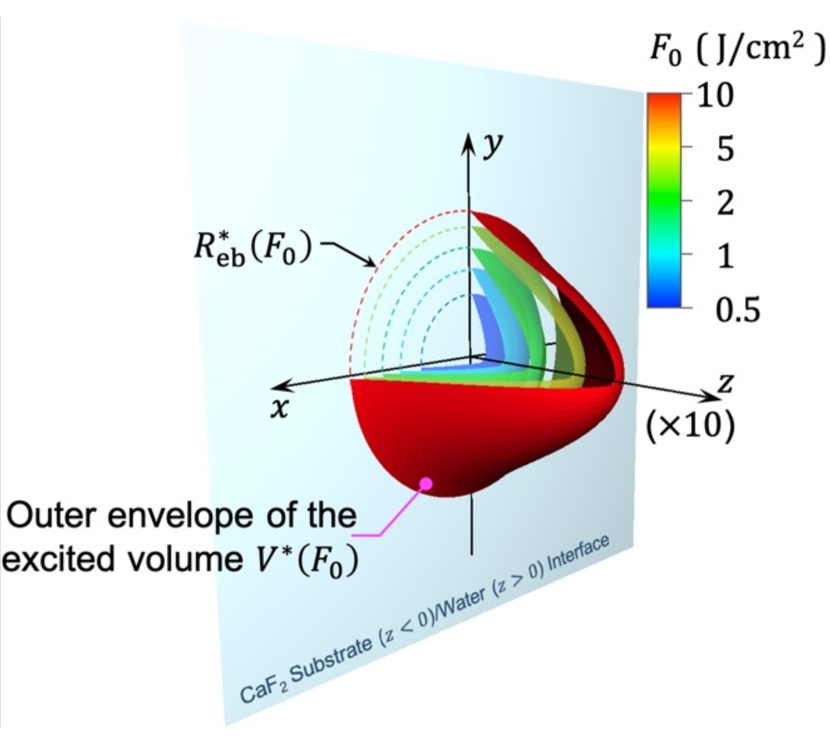
Eq.(11) defines a boundary for the excited volume (by a revolution around the axis of the critical curve represented in orange in Fig.6). The evolution of this volume envelope as a function of is depicted in Fig.7. From a direct integration:
we can thus derive the volume where explosive boiling occurs given by:
| (12) | ||||
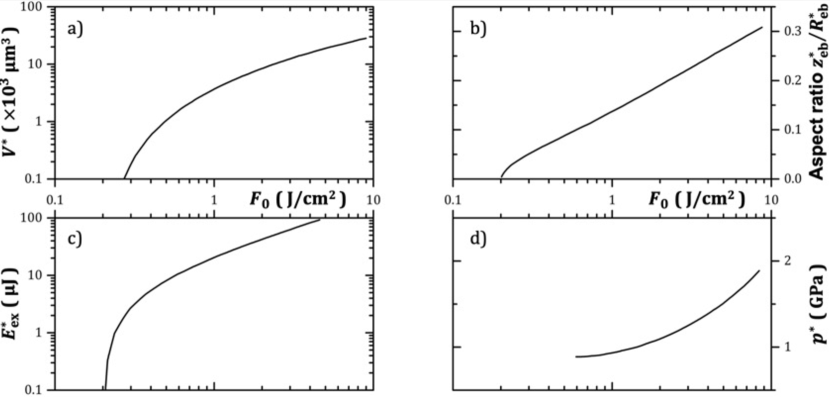
where , and is the dilogarithm function (). The variation of as a function of is represented in Fig.8.(a).
The shape of the volume (Fig.7) is oblate () as shown by the aspect ratio represented as function of in Fig.8.(b). From this initially flattened volume, vapour creation will lead to hemispherical bubbles seeds that further expand following the Rayleigh-Plesset equation.
Outside , i.e. beyond and outside , the remaining pulse energy is still fully deposited (no energy is transmitted for the thickness considered in our experiment) and the water heated up but below any phase change. A fraction of this rapidly diffusing hot outer shell (typically a several tens of micrometer shell thickness from 100 down to 50∘C) could in principle contribute to water vapour formation in the bubble as the low pressure trailing edge of the shock-wave passes through it. However the energy left in this outer shell represents a smaller and smaller fraction of the total energy deposited as the fluence increases. Consequently, we only expect some discrepancies close to the bubble formation threshold where the process is inherently very sensitive to any fluctuation.
Excess energy available for explosive boiling
The energy deposited within the volume where is the difference between the incident energy that may lead to explosive boiling:
| (13) |
and the remain output energy
| (14) |
that will further be absorbed but without leading to explosive boiling. Since by definition, one can simplify:
| (15) |
A fraction of the deposited energy corresponds to the specific spinodal energy required to vaporize the water explosively, integrated over the volume :
| (16) |
The vapour finally receives an energy excess (Fig.8.(c)) or in the form given in Eq.(3) of the main text:
| (17) |
The threshold for bubble formation is clearly visible on the excess energy as shown in Fig.8.(c).
As already mentioned, the energy initially available for bubble formation can be slightly higher than since outside exists a layer of heated water (not the point of liquid-vapour spinodal transition) that can boil once the shock wave leaving the excited area induces a low density trailing edge changes the local conditions. However since most of the pulse energy is converted into we can neglect this additional fraction.
Resulting initial pressure
The energy (Eq.17) and volume (Eq.12) allow us to estimate the initial pressure at the onset of bubble formation. However such a direct evaluation could be misleading (although correct for estimating an upper limit) since is initially a flat volume while hemispherical bubbles are experimentally observed. A more realistic evaluation of can thus be obtained by substituting by that accounts for the rapid energy redistribution associated with the doming from the flat excited volume to the hemispherical bubble seed. Typically here, is in the GPa range (Fig.8.(d)). This excessively high pressure leads to shock-wave formation thus dissipating some of the deposited energy.