Surface-Mediated Molecular Transport of a Lipophilic Fluorescent Probe in Polydisperse Oil-in-Water Emulsions
Abstract
Emulsions often act as carriers for water-insoluble solutes that are delivered to a specific target. The molecular transport of solutes in emulsions can be facilitated by surfactants and is often limited by diffusion through the continuous phase. We here investigate this transport on a molecular scale by using a lipophilic molecular rotor as a proxy for solutes. Using fluorescence lifetime microscopy we track the transport of these molecules from the continuous phase towards the dispersed phase in polydisperse oil-in-water emulsions. We show that this transport comprises two timescales, which vary significantly with droplet size and surfactant concentration, and, depending on the type of surfactant used, can be limited either by transport across the oil-water interface, or by diffusion through the continuous phase. By studying the time-resolved fluorescence of the fluorophore, accompanied by molecular dynamics simulations, we demonstrate how the rate of transport observed on a macroscopic scale can be explained in terms of the local environment that the probe molecules are exposed to.
I Introduction
In its simplest form, an emulsion is a surfactant-stabilized mixture of immiscible liquids, in which one phase is dispersed in the other [1]. One increasingly popular application of emulsions is as delivery systems for bioactive solutes, such as for drugs [2, 3, 4] or for functional food ingredients [5]. Considering drug delivery, one has to keep in mind that most newly discovered drugs are lipophilic, i.e. poorly soluble in water [6, 7, 8]. For such drugs, emulsions tend to be promising delivery agents, given that their oil phase solubilizes lipophilic drugs while they retain a high bioavailability [4].
As an example, in a recent study oil-in-water emulsions were shown to be promising delivering agents for the topical delivery of the lipophilic drug bifonazole [9].
From a thermodynamic viewpoint, emulsions are complex; they are in a metastable state stabilized by surfactants, molecules that adsorb to the interface between the oil and aqueous phases.
When ageing, emulsions tend to destabilize, which involves mechanisms such as flocculation, creaming or coalescence. Emulsion ageing is also accompanied by a material flow that can be composed of the dispersed phase itself, in a process referred to as Ostwald ripening, [10, 11] or of solutes being exchanged between the phases [12, 13, 14, 15, 16, 17]. For emulsions that act as delivery systems for solutes, a good understanding of the dynamics of such molecular transports is crucial, given that the solutes partition between the phases of the emulsions and eventually have to be delivered to a target.
Baret and coworkers have shown that for monodisperse water-in-oil emulsions, the exchange of solutes, poorly soluble in the continuous phase, is mediated by micelles and limited by diffusion through the continuous phase [16]. The diffusive process was demonstrated to be faster with increasing surfactant concentration but slower with increasing spacing between the droplets.
Here, we investigate the transport of a lipophilic molecule solubilized in micelles in the continuous phase to the interior of the droplets in a polydisperse oil-in-water emulsion. As a model system for lipophilic solutes, we use the dye molecule BODIPY-C12, a popular probe to study membranes on the nanoscale [18, 19, 20].
By tracking BODIPY-C12 in these emulsions we find that the molecular transport from the continuous phase into the oil droplets is a two-step process; the slow depletion of BODIPY-C12 from the continuous phase is followed by dye exchange between the oil droplets.
The rate of transport shows a dependence on surfactant concentration and droplet size, which we explain using simple models based on permeability theory and diffusion.
We find that for some surfactants the partitioning of the solute molecules at the surface of droplets can become the limiting step, where the solute exchange is slowed down to a timescale of days.
Surprisingly, in our system the dynamics of the transport can neither be explained by the surfactant polarity (i.e., the hydrophilic–lipophilic balance), nor electrostatic interactions.
Instead, analysis of the time-resolved fluorescence of the fluorophore suggests that the retention at the oil-water interface is due to interactions on a molecular level, in particular due to the mobility of BODIPY-C12 in its local environment and the size of the surfactant molecules.
To push further our understanding of the process, we perform coarse-grained molecular dynamics simulations that confirm the experimental observations. Additionally, simulation results suggest that parameters and interactions governing this surface-mediated molecular transport are the interactions between the head groups of the dye and surfactant molecules.
II Methods
II.1 Emulsion Preparation
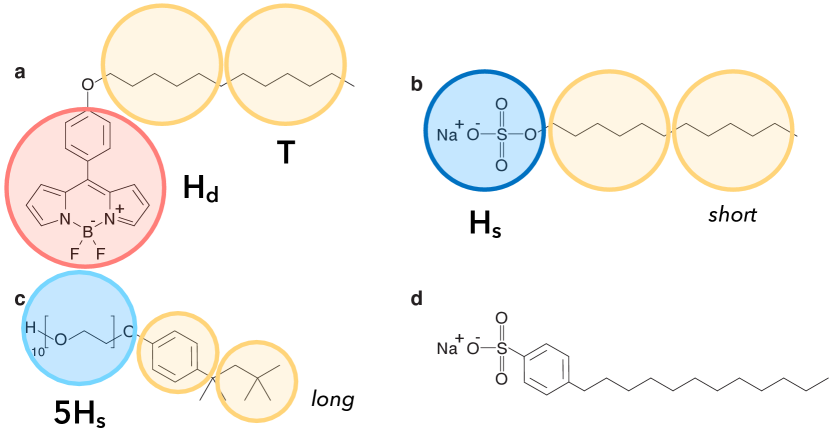
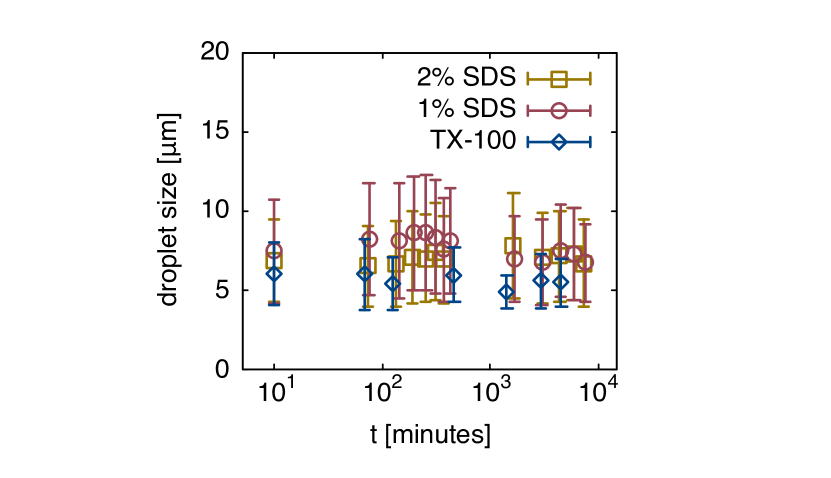
Emulsions were prepared by dispersing viscous polydimethylsiloxane silicone oil (500 cst, from Sigma-Aldrich) in aqueous sodium dodecyl sulfate (SDS, 99.0%, from Sigma), Sodium dodecylbenzenesulfonate (SDBS, technical grade, from Sigma-Aldrich), and t-octylphenoxypolyethoxyethanol (TX-100, laboratory grade, from Sigma-Aldrich) solutions. We chose an oil volume fraction of and surfactant concentrations of and , which are well above the critical micelle concentrations ( and cmc, respectively) [21]. Using a Silverson high-shear industrial mixer at 6000 rpm for we produced polydisperse oil-in-water emulsions, [22, 23] which remained stable for the duration of the experiments (Sup. Fig. 1) and beyond. The fluorophore BODIPY-C12 was synthesized using the method by Lindsey and Wagner [24]. Prior to the preparation of the emulsions, a stock solution of BODIPY-C12 in ethanol was diluted with the continuous phase () to obtain a dye concentration of . We anticipate the presence of ethanol not to impact the experiments considering its strong dilution. BODIPY-C12 dissolves in micellar solution, and in oil, but is poorly soluble in water (Sup. Fig. 2). The chemical structures of the dye molecule, and surfactants are drawn in Fig. 1.
II.2 Fluorescence Lifetime Imaging Microscopy
All fluorescence lifetime imaging microscopy (FLIM) measurements were carried out using a Leica TCS SP8 HyD confocal fluorescence lifetime microscope. As an excitation source we used a pulsed laser at and the emitted light was detected in the range of by a Hyd detector. For all experiments we used a 100x magnification in-oil objective with a numerical aperture of . Images were acquired at a scan speed of and accumulated times each, in the course of several hours after sample preparation, and for up to six consecutive days after. From these images we extracted both the fluorescence intensity, which is proportional to the concentration of the dye (Sup. Fig. 3), and the fluorescence lifetime, which provides information on the local environments the dye molecules are exposed to [18, 19, 25, 20, 26]. For the analysis of the fluorescence intensity of the microscopy images we used the image processing package Fiji [27] along with the collection of plugins MorpholibJ [28] and the ellipse splitting plugin [29]. We refer to the supplementary information for a more detailed description of the image analysis. The fluorescence lifetime was analysed using the Leica Application Suite X. For each analyzed phase we included at least photon counts. The time-resolved fluorescence was fitted using a model based on n-exponential reconvolution. For the fit of multi-exponential decays we used the amplitude-weighted average lifetime, . We considered fits acceptable for .
II.3 Simulation Model and Methods
To reach the length- and time scales associated with the diffusion of the dye molecules through the oil-water interface and capture experimental trends in a qualitative manner, we chose to model the systems using a coarse-grained (CG) description. These calculations using the atomistic resolution of the compounds would be computationally unfeasible. Additionally, to the best of our knowledge, there is no full-atomistic model for BODIPY-C12 and TX-100 molecules that are compatible with CG models of water, SDS, and silicone oil. Thus, we performed CG molecular dynamics simulations of systems containing a solution of surfactant and dye molecules in a mixture of water and oil.
As we aimed for a generic model, we deliberately did not take into consideration the shape anisotropy of the solvent particles and modeled them explicitly as spherical beads of unit diameter and unit mass . The interaction between solvent particles was modeled via the Lennard-Jones (LJ) potential
| (1) |
where is the distance between a pair of particles, and controls the interaction strength between particles of type and . For particle pairs of the same type, we used , where is the Boltzmann constant and is the absolute temperature. The cutoff radius of the LJ potential was set to = 3.0 . The interspecies interaction was modeled using the purely repulsive Weeks-Chandler-Andersen (WCA) potential, achieved by truncating at its minimum and shifting it by [30]. At the simulation conditions employed, the two fluids are immiscible which leads to the formation of a liquid-liquid interface [31]. This strategy was shown to be robust for modeling the immiscibility of two fluids [31, 32], including oil-water interfaces [33].
We approximated both dye and surfactant molecules as chains made up of several beads connected through springs, which were modeled via the finitely extensible nonlinear elastic (FENE) potential combined with the WCA potential. We used the standard Kremer-Grest parameters for the FENE potential to prevent unphysical bond crossing [34]. In a recent numerical study on the oil-water interfaces decorated by surfactant molecules, a CG mapping for water and SDS molecules was proposed [35]. In this representation, five water molecules were lumped together into one bead. Thus, the volume occupied by five water molecules at room temperature, , defines the volume of one bead in the simulations. The hydrophobic tail of SDS is equivalent to two water beads in size and is represented by two beads (bead type T). The headgroup (bead type ) was modeled by a single bead resulting in three beads per surfactant ( = 3). Since SDS and BODIPY-C12 molecules are quite similar with respect to their chemical structure (compare Fig. 1a and b), i.e. both molecules are composed of a hydrophobic tail containing twelve carbon atoms and a headgroup (bead type ), we used the same mapping for both BODIPY-C12 and SDS. To investigate how the length of the headgroup of a surfactant molecule influences the diffusion of dye molecules, we additionally introduced a surfactant type that is similar to TX-100 (Fig. 1c). The hydrophobic tail of TX-100 was also modeled by two -type beads, as its length is similar to the hydrophobic tails of SDS or BODIPY-C12 molecules. The head group of TX-100, however, is a polyethylene oxide (PEO) chain. For ten monomers, the Kuhn length for PEO is , which roughly equals the size of two monomers [36]. Since in our simulations the unit of length , we modeled the headgroup of TX-100 using five beads (). A schematic mapping and the detailed summary of bead types is provided in Fig. 1.
Nonboned interactions between all bead types were also modeled using the potential introduced above. As the parameter choice is crucial to adequately model the system, we chose the strength of the potential based on the available experimental information to capture the relative strength between the compounds. The resulting values are summarized in Table 1.
| W | O | T | |||
|---|---|---|---|---|---|
| W | 1.0 | WCA | 1.9/1.1 | 0.9 | 0.2 |
| O | 1.0 | 0.2 | 0.9 | 0.9 | |
| 1.0 | 3.6/0.225 | 0.2 | |||
| 1.0 | 0.9 | ||||
| T | 1.0 |
For the intraspecies interaction, we used . In our simplified modeling approach, we use a single interaction strength, , to capture the immiscibility between some species in the system: , , and . Since the headgroup of the dye molecule is miscible in both types of solvents, we set up the interactions between the headgroup and solvents as [37]. For the oil-soluble tail of both the dye and surfactant molecule we also chose to be equal to . Experimentally, the surfactant molecules are either found at the oil-water interface screening the interaction between the immiscible fluids or in aqueous solution. To achieve such a scenario in the simulations, we set the interaction strength between the water beads and the headgroup of the surfactants to and for the three- and seven-bead surfactant models, respectively. This choice of interaction parameters results in a similar interfacial coverage by the two surfactant types (Sup. Fig. 4).
To qualitatively capture the hydrophilic strength of the surfactant headgroups employed in the experiments, we make use of their HLB values [38]. As we represent the SDS headgroup by a single bead (short), while using five beads for the headgroup of TX-100 (long) (Fig. 1b and c), the ratio of the interaction strength is then estimated as . Thus, we choose to be equal to 3.6 and 0.225 for short and long surfactant chains, respectively.
To model the interface, we chose a simulation box elongated along the -direction. The box size was set to , and . Due to the periodic boundary conditions there are two interfaces within the simulation box. In our simulations we determined the position of the interface between the water and oil phases from the maximum of the surfactant concentration profile along the -axis [39]. The overall particle number density was set to [33]. We chose the composition of the solvent mixture as , leading to approximately particles for each type of liquid. As in the experiments, we assumed that the liquid-liquid interface is saturated with surfactant molecules. We estimate the number of surfactant required as , where is the experimentally determined surface area per SDS molecule adsorbed at the interface between silicone oil and water [40]. The resulting values for is surfactant molecules per simulation for the surfactant model based on three beads. This leads to the surfactant concentration , which is close to the experimental values. For the seven-bead surfactant model, we kept the same concentration resulting in chains per simulation. We then added dye molecules into the system to investigate their diffusive behavior. In total, the systems are composed of beads.
Starting configurations were generated by randomly placing all oil beads in one half of a simulation box, while placing the remaining beads in the second half. We followed a multi-step equilibration procedure. First, we ran a short simulation for time steps where only the position of the liquid beads was integrated to equilibrate the phase-separated fluids. Next, we achieved a homogeneous distribution of surfactant molecules in a box by simulating a system for time steps in which the interaction strength between the T, beads and liquids was set to . Afterwards, a simulation of time steps was conducted in which the surfactant and solvent beads interact with the parameters presented in Table 1. This simulation results in the formation of a liquid-liquid interface decorated by surfactants. To keep the dye molecules in the aqueous phase during the equilibration stage, we set a purely repulsive interaction (WCA) between the and beads and the oil phase. Finally, we set all interactions according to Table 1, and conducted a production run of time steps. Three independent runs were performed for each value of the interaction strength . Simulations were conducted in the ensemble at using a Nosé-Hoover thermostat. The equations of motion were integrated using the velocity Verlet algorithm with a time step of , where is the intrinsic MD unit of time. All simulations were performed using the HOOMD-blue simulation package (v.2.9.2) [41].
III Results and Discussion
III.1 Experimental Results
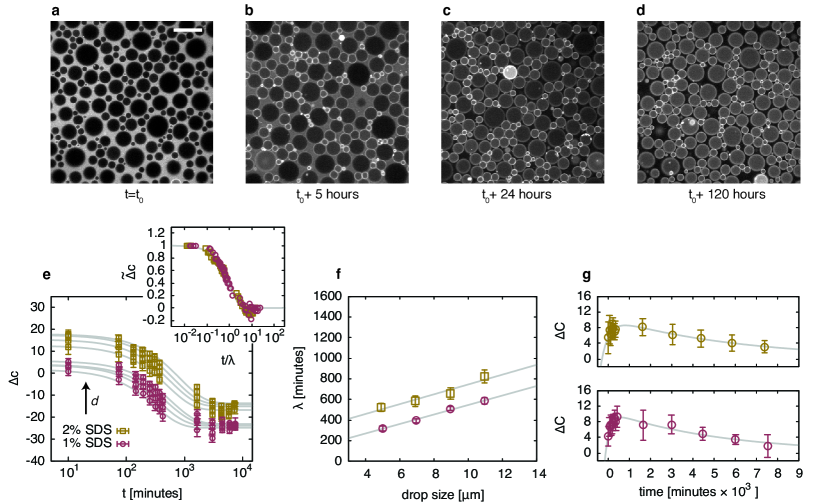
In the case of SDS stabilized emulsions, at , which for all samples is minutes after emulsion preparation, we detect the fluorophore in the continuous phase only (Fig. 2a), where it is loaded onto micelles (Sup. Fig. 2, 5). BODIPY-C12 then diffuses from the initially swollen micelles into the oil droplets, which happens gradually over the course of hours (Fig. 2b, c), with a rate that is dependent on the size of the oil droplets; the smaller droplets “fill up” faster. In addition, we observe highly fluorescent regions at the periphery of the droplets, which suggests aggregation of the dye molecules at the oil-water interface [42, 43, 44]. After the continuous phase is depleted of BODIPY-C12 (Sup. Fig. 6), we find the dye diffusing from the brighter small droplets towards the empty larger ones until the fluorescence intensity is uniform among the oil phase (Fig. 2d). This molecular transport is not limited to an emulsified system, and also occurs in bulk (Sup. Fig. 7).
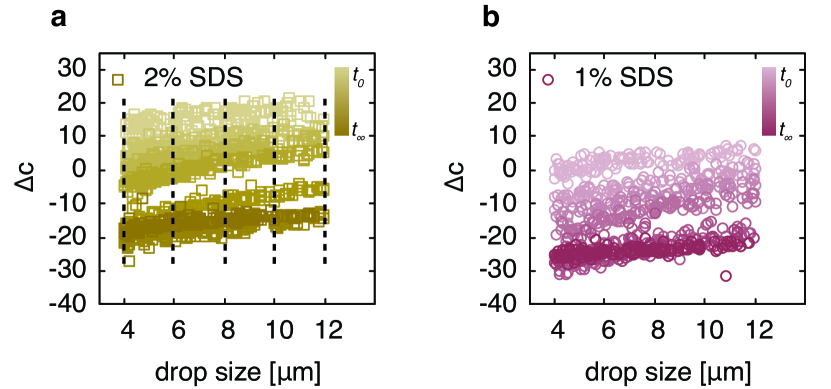
We characterize the exchange of dye by first analysing the temporal evolution of the concentration difference , which is defined as the difference between the concentration of dye molecules in the water phase, , and the concentration of dye molecules dissolved in the silicone oil droplets, . To obtain the concentration from the fluorescence intensity, we need to know the different extinction coefficients of BODIPY-C12 in micellar solution and in oil. We therefore first measure the fluorescence intensity of the dye in both neat phases separately and then correct the concentrations accordingly.
To analyse the dependence of the exchange on the oil droplet size, , we binned into four intervals (Sup. Fig. 8) to obtain for the average droplet sizes . A plot of versus time (Fig. 2e) reveals exponentials decays that we fit using
| (2) |
Rescaling the normalized data between and (measured at day 6) by the timescale produces a master curve (Fig. 2e, inset). This exponential relaxation is in agreement with theory based on diffusive transport facilitated by surfactants; the transport is governed by thermodynamics, and dictated by differences within the chemical potential of the solute over which the system equilibrates [15, 16]. The timescale of the transport was previously found to be determined by the permeability of the micellar phase, the droplet volume and surface area , and can be expressed as [15, 16]. This relation predicts the timescale to scale linearly with droplet size, which our data confirms (Fig. 2f), albeit with an offset that varies with the surfactant concentration. Using the slope of (fit in Fig. 2f) we derive a permeability , defined as the diffusion rate of the dye molecules through the micellar phase, which regardless of surfactant concentration, is on the order of .
We first investigate whether the transport is limited by diffusion of the dye through the continuous phase. In this case, the permeability can be expressed as [45], with the partition coefficient, the diffusion coefficient of the micelle-dye aggregates, and the thickness of the interface. From the fluorescence images at equilibrium we estimate and for the emulsions stabilized with 2 % SDS and 1 % SDS, respectively. In addition we find that the ratio in between 2% and 1% SDS is given by the ratio between surfactant concentration in the continuous phase, which has been found to scale linearly with the partition coefficient [16]. Micelles formed by SDS were shown to be in diameter [46], and are thus, according to the Stokes-Einstein equation, expected to diffuse at . Then, estimating the diffusing object to cross an interface of nanometric thickness , we predict permeabilities a factor of larger than what we experimentally observe.
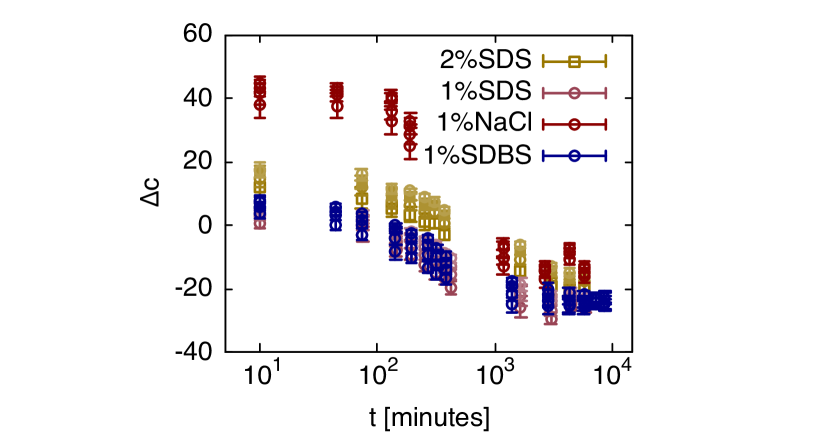
We thus conclude that for the molecular transport of BODIPY-C12 in our oil-in-water emulsions stabilized by SDS, crossing the oil-water interface is the rate limiting step, not micellar diffusion through the continuous phase. Once the continuous phase is depleted of fluorophore we observe exchange of the dye between the droplets (compare Fig. 2c and d) [15, 16]. To quantify this we define the concentration difference between the largest and smallest droplets within the samples, i.e. . Irrespective of surfactant concentration, first increases as a consequence of the depleting continuous phase (Fig. 2g), in agreement with the data shown in Fig 2e. Subsequently, goes through a maximum followed by relaxation to . Using the previous arguments based on diffusion we model this using
| (3) |
which combines the depletion of the continuous phase with the exchange of the dye molecules between the droplets. The initial uptake occurs on a timescale of and for the emulsions stabilized with and SDS, respectively. These values are, as expected, similar to the ones measured for the relaxation of between the continuous phase and the oil droplets (Fig. 2f), i.e. obtained from obtained from . The relaxation describing the exchange between droplets happens on much longer timescales of for SDS and 5400 for SDS. We note that the non-overlapping values for and the fact that at suggest that the smaller droplets still exhibit slightly higher concentrations in dye. This small, but noticeable effect might arise from either experimental errors, or the possibility that the system did not fully reach equilibrium at the last measuring point. Considering the structural similarities of BODIPY-C12 and SDS with respect to their nonpolar alkyl moieties (compare Fig. 1a and b), it is reasonable to assume that dye-surfactant interactions affect the transport rate.
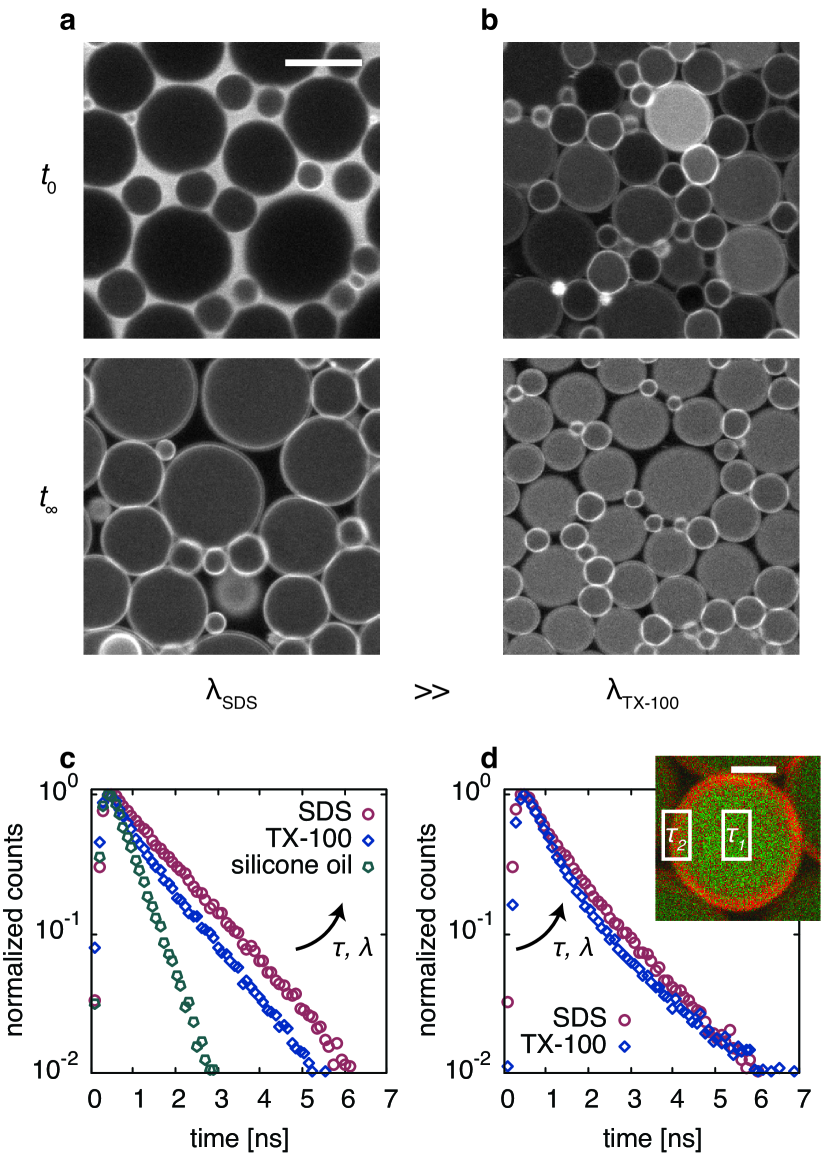
The degree to which surfactant molecules are hydrophilic or lipophilic can be estimated using their hydrophilic-lipophilic balance (HLB), which is based on the molecular structure of the emulsifier. Using the advanced technique proposed by Guo and coworkers [38] we calculate a HLB number of for SDS, reflecting its strong hydrophilicity. Substituting SDS by the more hydrophobic TX-100 (compare Fig. 1b and c), leads to an exchange at the time scale of the emulsion preparation itself, since at , the continuous phase is already depleted of BODIPY-C12 (compare Fig. 3a and b). The TX-100 emulsion was also prepared in clear excess of its critical micelle concentration (at , cmc) [47]. However, substitution of SDS with the structurally similar but more hydrophobic SDBS (compare Fig. 1b and d), results in hardly any increase in the transport rate (Sup. Fig. 9). This is surprising considering the comparable HLB values of SDBS and TX-100, which we calculate as and , respectively. To rule out any electrostatic effects slowing down the transport (both SDS and SDBS are anionic) we repeated the experiment with \ceNaCl added to the continuous phase. In this case the timescale of the molecular transport of BODIPY-C12 increases, which indicates a change in the partition coefficient (Sup. Fig. 9) [16]. From these additional experiments we can conclude that neither the HLB value nor electrostatic effects can explain the increased transport rate of the dye molecule in the case of emulsions stabilized with TX-100.
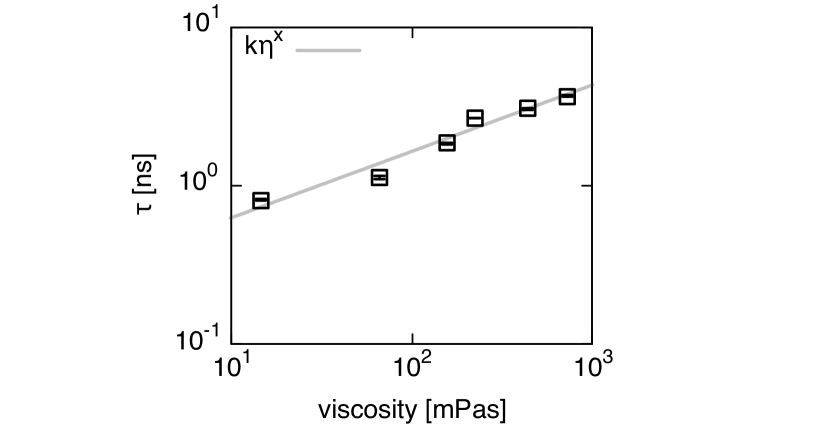
To get at the core of this, we resort to the analysis of the time-resolved fluorescence of BODIPY-C12 to study its local environments when exposed to both surfactants, in micellar solutions, and at the oil-water interface. The fluorescence decay of BODIPY-C12 was shown to be monoexponential with a lifetime sensitive to viscosity, but insensitive to polarity [48, 18, 19, 20]. The relationship between fluorescence lifetime and macroscopic solvent viscosity is given by Förster-Hoffmann’s equation , where and are empirical constants obtained from calibration with solvents of known viscosity (Sup. Fig. 10) [49]. We anticipate the local viscosity to vary with surfactant structure given the presence of large gradients in lateral pressure between the headgroups and tails [50]. The fluorescence decay curves of BODIPY-C12 in oil, micellar solutions and at the oil-water interface for both SDS and TX-100 are shown in Fig. 3c and d, respectively. The extracted (amplitude-weighted average) lifetimes and corresponding viscosities , which we determined using Förster-Hoffmann’s equation, are summarized in Table 2. The fluorescence of BODIPY-C12 in micellar solutions of SDS decays monoexponentially with a lifetime = 1.28 (Fig. 3c), indicating that the dye molecules are exposed to a single environment.
| [ns] | [ns] | [mPas] | ||||
|---|---|---|---|---|---|---|
| 1.28 | 1.28 | 1.154 | ||||
| 0.54 | 1.37 | 1.2 | 0.92 | 0.976 | ||
| 0.52 | 0.52 | 1.367 | ||||
| 0.66 | 1.56 | 2.1 | 0.96 | 1.044 | ||
| 0.55 | 1.95 | 6.1 | 0.75 | 1.029 |
In this environment, according to our calibration, BODIPY-C12 molecules experience a viscosity of , which implies a significantly lower mobility of the dye than the one measured in bulk solution at low viscosities (Sup. Fig. 10). The fluorescence decay of BODIPY-C12 in TX-100 micelles, however, is biexponential, which indicates that the dye molecules probe a second local environment. The amplitude-weighted average lifetime of BODIPY-C12 within TX-100 micelles relates to a lower viscosity of . Strikingly, the viscosity experienced by BODIPY-C12 in the oil phase appears to be decoupled from the macroscopic viscosity, i.e. the local viscosity is orders of magnitude lower than the one reported from conventional rheometry [51, 52, 53]. This might also explain the lower values for and at the interface, where the presence of oil inevitably affects the lifetime. Indeed, fitting both components to construct a FLIM image (Fig. 3d, inset) reveals that the fast component belongs to the oil phase. Regardless of whether BODIPY-C12 resides in the micellar phase or at the oil-water interface, samples prepared with TX-100 instead of SDS show a local viscosity a factor of lower.
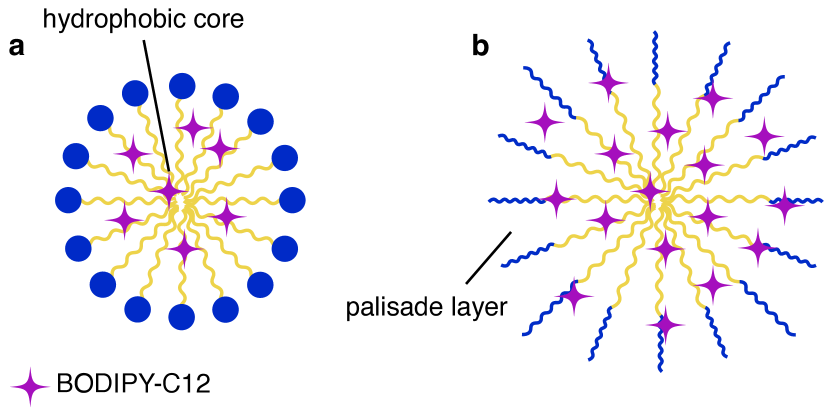
We tentatively interpret these results as follows; given the structural similarities between the surfactant molecules and BODIPY-C12 we hypothesize that the dye molecules intercalate into the micelles. In the case of SDS the dye molecules are subject to a higher degree of molecular crowding and are thus more stable within the macromolecular assembly. Within TX-100 micelles however, BODIPY-C12 molecules are less localized and more mobile, as suggested by the biexponential decay and significantly lower lifetime. One possible explanation would be that the dye molecules in the TX-100 case are populating both the hydrophobic core of the micelles and their outer palisade layer [54, 55], which is composed of a polyethylene oxide chain. Hence, for SDS, the exchange to neighboring micelles [56, 57] and oil droplets is more restricted, compared to the TX-100 case. These considerations are illustrated in Fig. 4. From a structural perspective, the differences in mobility could also be related to differences in the surface density between SDS and TX-100 micelles, where the much less dense surface of TX-100 micelles could facilitate the fast exchange. Additional structural information on the micelle-dye aggregates could for instance be inferred from X-ray studies. From our experiments we thus conclude that neither the HLB nor electrostatic effects determine the transport rate of the lipophilic dye within this emulsion, but rather the mobility of the dye molecules within the micelle-dye assemblies.
We further substantiate these claims by performing molecular dynamics simulations.
III.2 Simulation Results
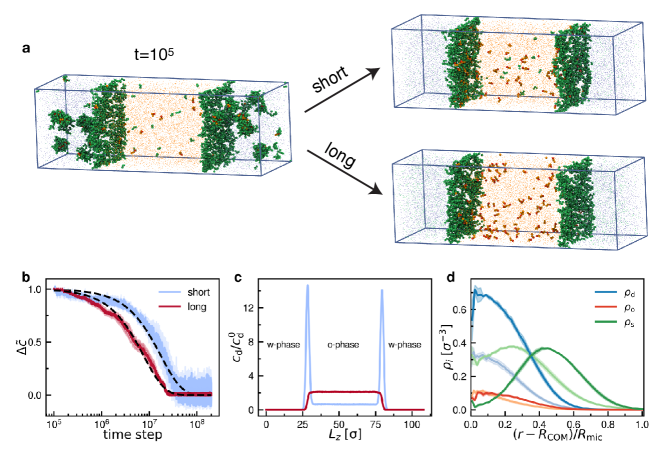
In our simulations, we observe the rapid formation of micellar aggregates (composed of dye, oil, and surfactant molecules) in the water phase during the initial time steps. We characterize the formation of these aggregates using the density-based clustering algorithm DBSCAN [59]. For this clustering we consider O (oil), T (hydrophobic tail), (hydrophilic headgroup of the surfactants) or (hydrophilic headgroup of the dye) beads (Fig. 1) located in the water phase, and whose -coordinates are at least away from the position of the interface. This ensures that the micelles do not interact with the interface when their composition is analyzed. Dye molecules, not participating in the formation of micelles, diffuse freely through the interface. In the experiments, at , the dye molecules are already partitioned into micelles in the aqueous phase. Hence, we excluded the first time steps from the analysis of the diffusion of the dye.
Fig. 5a shows representative snapshots of the systems investigated, at the time of the micelle formation and at the end of a simulation. Fig. 5b shows a plot of the temporal evolution of the normalized concentration difference of the dye molecules present in the water and oil phase using the same definition for as employed in the experiments.
The simulation runs between and and recovers the exponential decay [Eq. (2)] that we also observed in the experiments (Fig. 2d, e). The results suggest a slower exchange for the diffusion of solutes in systems where the interface is made up of short surfactant chains than in the ones with long surfactant chains. The characteristic time scale obtained from fitting reveals that for the short surfactant chains time steps is more than two times larger than the value for long surfactant chains time steps. These findings are in good qualitative agreement with the experimental results (Fig. 3a, b). Thus, our computational results suggest that the energetic penalty to cross the interface decorated by the long surfactant is lower than for the interface decorated by short surfactant as supported by the temporal evolution of the nonbonded potential energy in the system (Sup. Fig. 11). For a more quantitative description, calculations of the transfer free energy of a dye molecule from an aqueous to an oil phase through the interface decorated by two surfactant types could be performed.
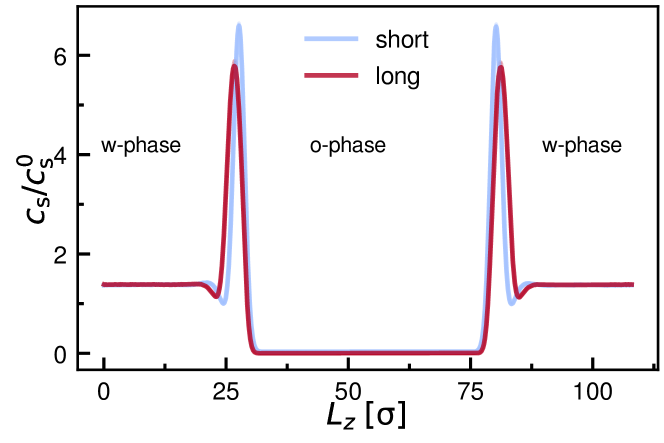
Next, we compute the concentration profile of beads belonging to dye molecules along the -axis (Fig. 5c). For systems composed of surfactants with long headgroups, dye molecules are homogeneously distributed inside the oil phase. In contrast, dye molecules are more prone to stick to the interface when the headgroup of the surfactant is small. We note that due to a rather small number () of dye molecules simulated and on the timescales accessible in the simulations, the difference in the concentration profiles between these systems is amplified. Qualitatively, it resembles the experiments at the early stage, where highly fluorescent regions at the periphery of the droplets were observed (Fig. 2b). Experimentally, such aggregation was shown to occur for a variety of molecules, independent of charge, and could be attributed to the presence of a gradient in the electric field at the oil-water interface [44]. For future studies, it could be interesting to elucidate the mechanism behind the aggregation in more detail, for instance by performing free energy calculations as described above or by performing neutron or X-ray scattering experiments.
Finally, we study the composition of the micelles by calculating the number density profiles of each component. For both simulated systems, the micelles are predominantly made up of dye and surfactant beads, with a small number of oil beads present at the core (Fig. 5d). We find a comparable amount of surfactant beads in both simulated systems, and that the density of dye beads is higher for systems containing weakly interacting headgroups. Consequently, clusters containing surfactant molecules with long headgroups are less stable against dissolution; this results in a faster diffusion of dye molecules into the oil phase, which is in line with our experimental results, showing a faster diffusion of the dye molecule for emulsions stabilized with TX-100 (long headgroups) than for the ones stabilized with SDS (short headgroups).
IV Conclusion
To conclude, we observe experimentally that the molecular transport of a lipophilic dye molecule in a model oil-in-water emulsion is a two-step process that depends on droplet size, surfactant concentration, and surfactant type, for which we suggest simple models. For some surfactants, this transport can be limited by diffusion through the interface, a phenomenon that we find to be independent of both the hydrophilic-lipophilic balance of the surfactant molecules and the presence of electrostatic effects. Instead, the analysis of the time-resolved fluorescence of the molecular rotor suggests that the mobility of the dye molecules within the micelles plays a role; micelle-dye assemblies consisting of surfactant molecules with smaller headgroups stabilize the dye molecules against dissolution into the oil phase. Our findings are supported by molecular dynamics simulations, which recover the behavior of dye depletion from the continuous phase. They show that there is indeed a strong dependence of this molecular transport on the molecular size of the surfactant molecules stabilizing the oil-water interface. We believe these results can be valuable for designing any application in which emulsions are being used as compartments, particularly for drug delivery [60].
Acknowledgements.
M. R. B. acknowledges Nico Schramma for fruitful discussions on image processing. We thank Hans Sanders for synthesizing the dye molecule. This work was performed using HPC resources (GPU-accelerated partitions of the Jean Zay supercomputer) from GENCI–IDRIS (Grant 2021 - A0100712464).Appendix: Supplementary Information
Emulsion Stability
The droplet sizes of the emulsions are shown in Sup. Fig. 1 and remained constant over time.
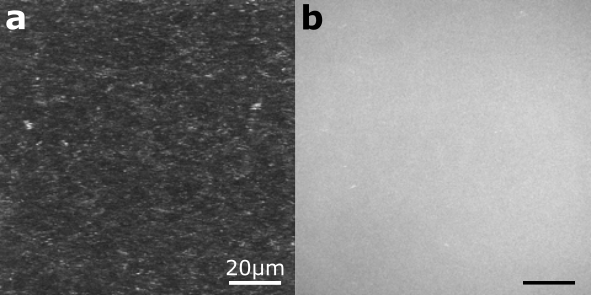
BODIPY-C12 Solubility
Fluorescence microscopy intensity images (Sup. Fig. 2) show that for micellar solutions below the cmc, BODIPY-C12 forms aggregates and is poorly soluble. Above the cmc, however, the intensity is homogeneous. This suggests that BODIPY-C12 is solubilized by micelles.
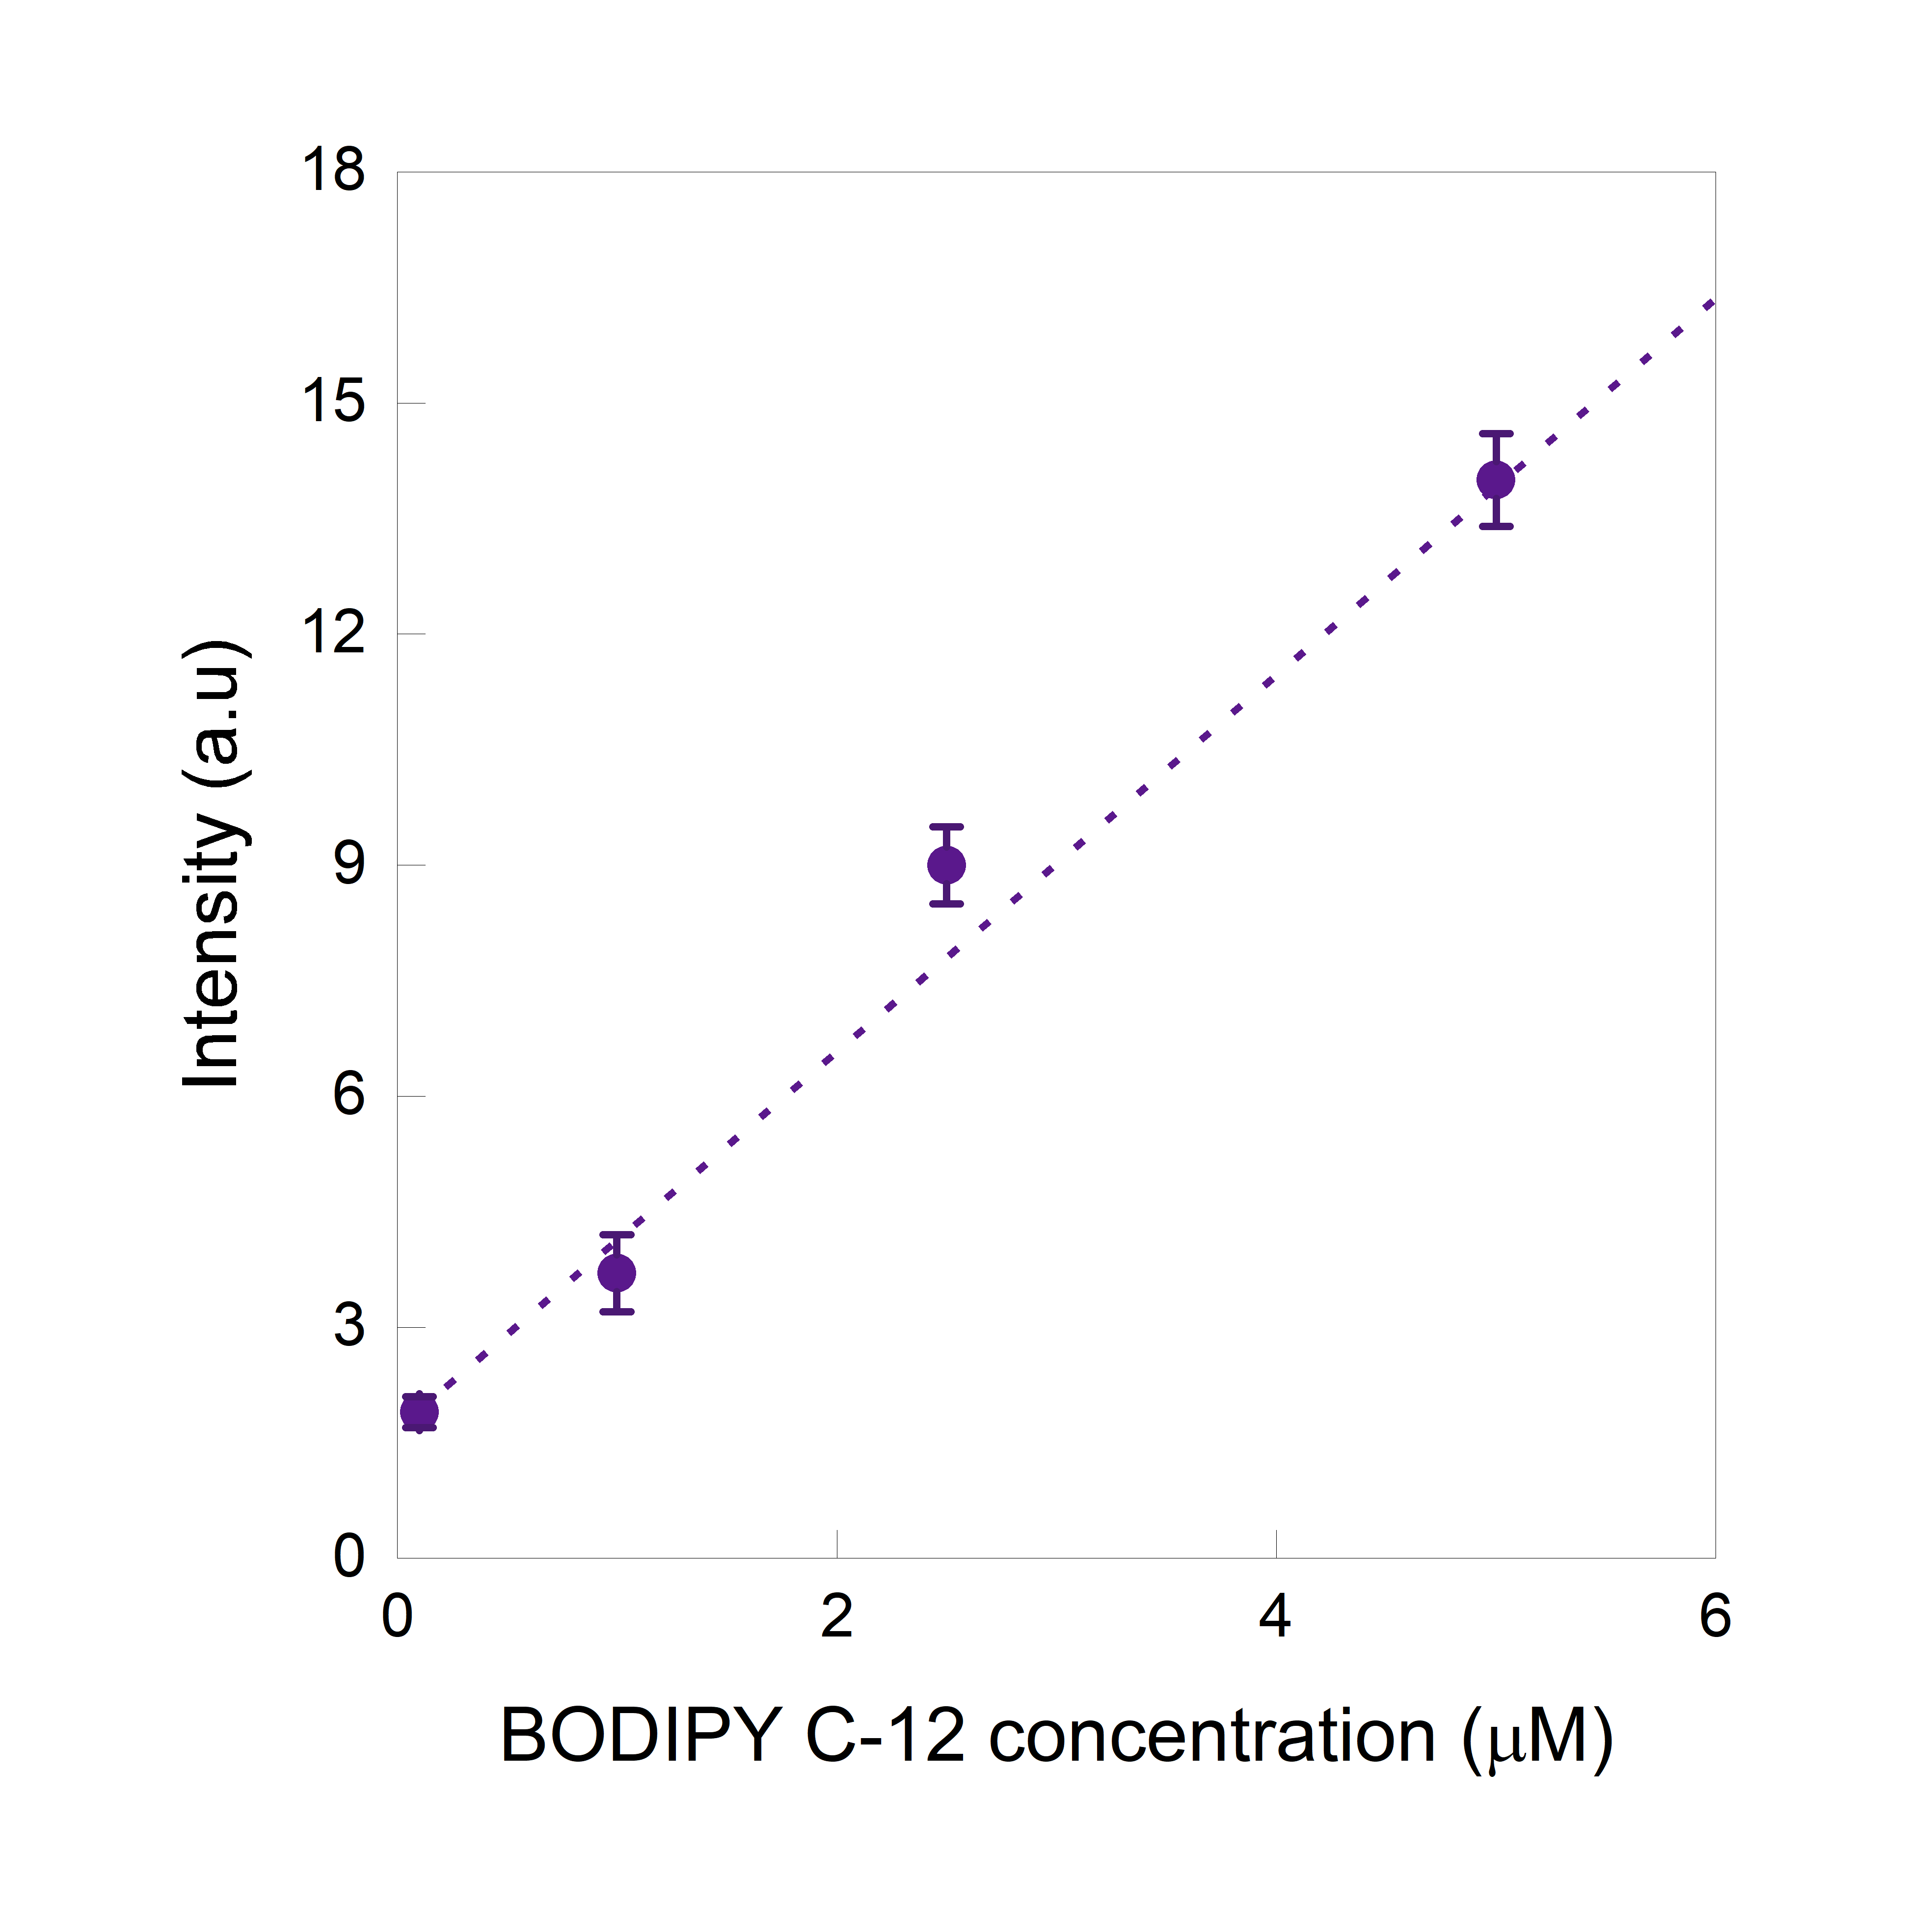
BODIPY-C12 Intensity-Concentration Dependence
To verify the dependency of the intensity of BODIPY-C12 on its concentration we carried out a reference measurement in SDS solution, in which we varied the concentration of the fluorophore. Sup. Fig. 3 shows an approximately linear relationship.
Concentration Profile of Surfactant Beads Along the -Axis
In Sup. Fig. 4 we plot the concentration profile of surfactant beads along the -axis for two surfactant architectures, i.e. chains composed of three beads (short) and seven (long) beads.
DLS Measurements of Micelles with/and without the Addition of BODIPY-C12
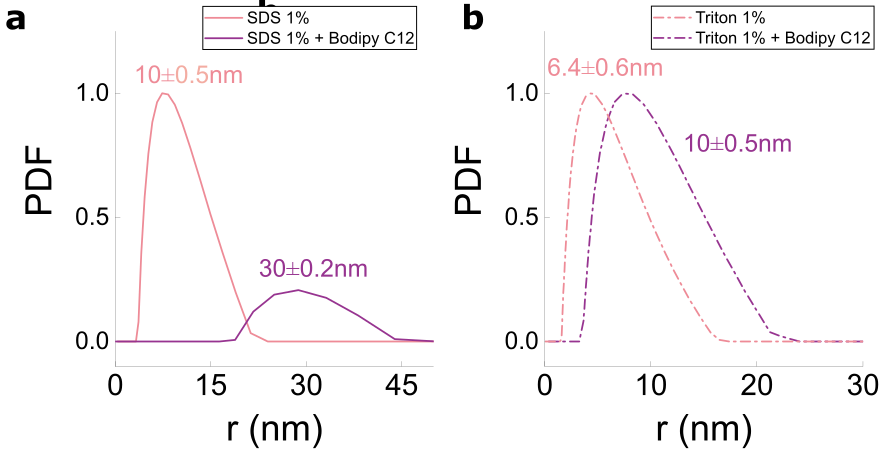
The effect of the addition of BODIPY-C12 to the micellar size of SDS and TX-100 is demonstrated by DLS measurements (Sup. Fig. 5). In both cases, the fluorophore causes the micelles to become bigger, which indicates that the micelles are swollen with BODIPY-C12.
Depletion of the Continuous Phase
Sup. Fig. 6 shows the decrease of fluorescence intensity of BODIPY-C12 in the continuous phase of SDS stabilized emulsions. Given that SDS micelles are insoluble in oil, we surmise the decrease in intensity to originate from a decrease in dye concentration. From day 2 onwards, the fluorophore concentration in the micellar phase remains constant.
Molecular Transport in a Non-emulsified System
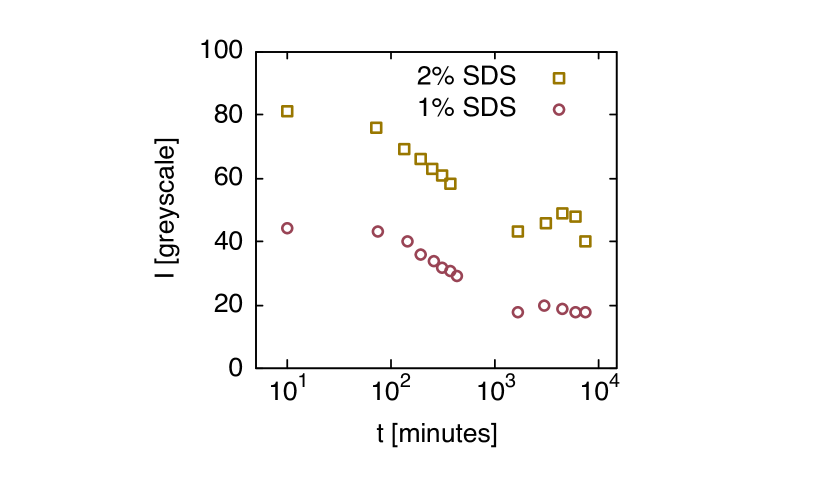
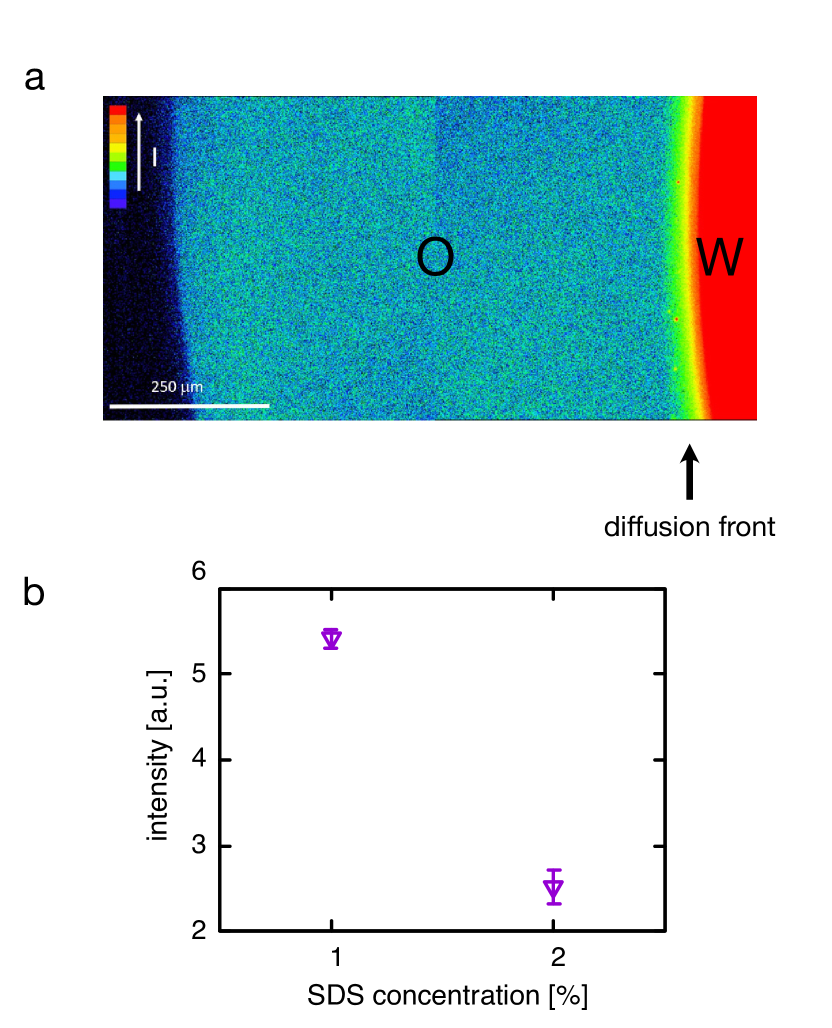
To investigate whether the molecular transport of BODIPY-C12 is limited to emulsified systems, we carried out additional experiments, in which we measured the transport in non-emulsified systems. For this we squeezed 0.2 mL of micellar phase (containing 1% and 2% SDS, and BODIPY-C12) surrounded by 0.8 mL of oil between two glass slides separated by (using spacers) and measured the fluorescence intensity and lifetime analogously to the emulsified system (Sup. Fig. 7, shown here for 1% SDS). We find that, after one week ( of the emulsified system) the concentration of dye in the system containing 1% SDS (Intensity, ) exceeds the concentration of dye in the system containing 2% SDS () by a factor , similar to the ratio of the partition coefficients inferred from the emulsified systems. The measured lifetimes in the oil phase were = and = for the samples prepared with 1% SDS and 2% SDS, respectively. These values are expected and in line with the lifetimes measured in the oil droplets. However, this bulk system is not at equilibrium yet, indicated by (i) the presence of a diffusion front propagating from the water phase, and (ii) the water phase being brighter than the oil phase. We thus surmise that the transport can also be observed in bulk, albeit on a much slower rate.
Oil Droplet Size Dependence of the Molecular Transport
A plot of versus droplet size for different time steps and concentrations of SDS (Sup. Fig. 8a, b) reveals that increases with droplet size, , but decreases in time. Interestingly, also increases with surfactant concentration. For further data analysis we binned the data into four intervals to fix the droplet size. To mitigate the potential effect of oil droplet size on the intensity signal, as caused by the non-transparency of the emulsions, we kept the range of investigated droplet sizes small, from .
Influence of HLB and Salt
To study the influence of a lower hydrophilic-lipophilic balance (HLB) and salt on the dynamics of the transport process we repeated the experiments with SDBS ( cmc) [61], and SDS + \ceNaCl, respectively. Both cases do not significantly speed up the molecular transport, as shown in Sup. Fig. 9.
Calibration of BODIPY-C12
According to Förster-Hoffmann’s equation the fluorescence lifetime of a molecular rotor scales with solvent viscosity as . To calibrate the molecular rotor we prepared ethanol-glycerol solutions with BODIPY-C12 at and measured the fluorescence lifetime of the solutions. The solvent viscosities were measured using an Anton Paar MCR 302 rheometer with a cone-plate of diameter at an angle of . From the calibration curve (Sup. Fig. 10) we obtained and .
Nonbonded Potential Energy
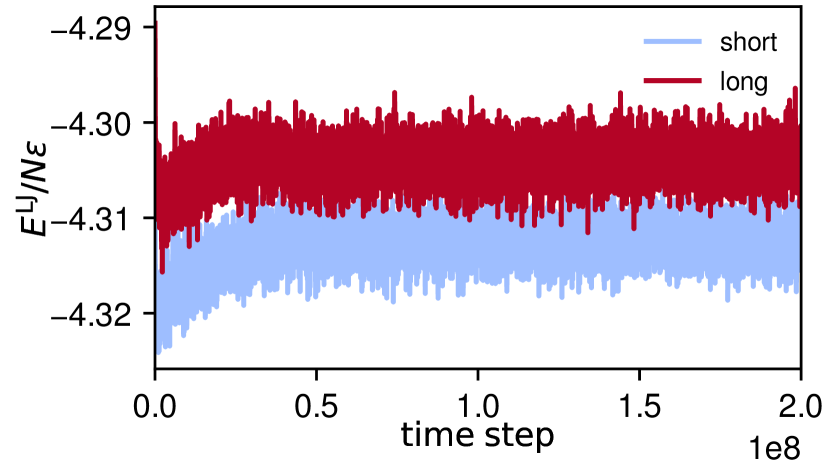
Image Analysis
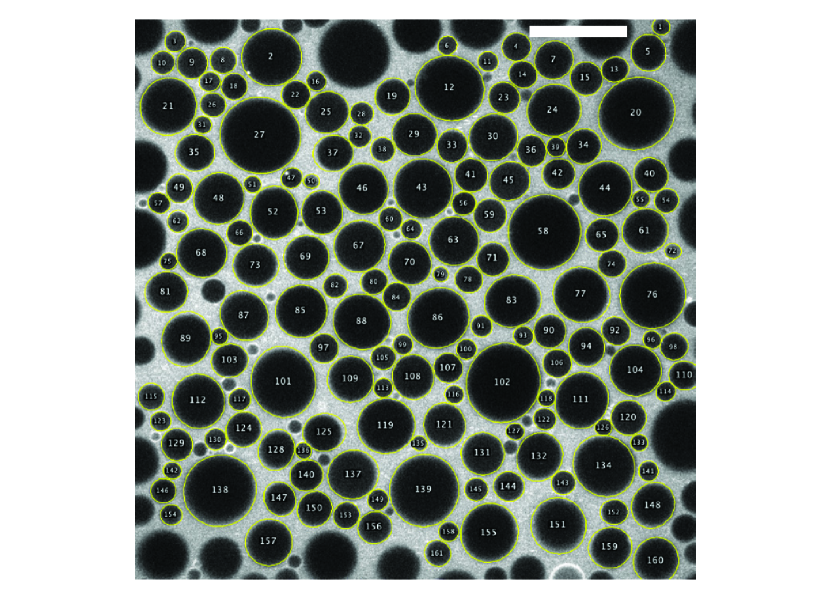
Image analysis was carried out using Fiji [27] together with MorpholibJ [28] and the ellipse splitting plugin [29]. Within Fiji we wrote a macro based on the following processes; first the background was subtracted followed by the application of a Gaussian Blur filter. Before binarizing the image by applying a (auto-)threshold we enhanced the local contrast using CLAHE. Then we applied dilation as a morphological filter. Eventually, we used the ellipse splitting plugin to detect the droplets (excluding the ones on the side), from which we extracted the Feret’s Diameter and the mean intensity. Intensities were measured from the unprocessed images. This workflow worked well for our system, as shown in Sup. Fig. 12.
References
- Leal-Calderon et al. [2007] F. Leal-Calderon, V. Schmitt, and J. Bibette, Emulsion science: basic principles (Springer Science & Business Media, 2007).
- Buyukozturk et al. [2010] F. Buyukozturk, J. C. Benneyan, and R. L. Carrier, Impact of emulsion-based drug delivery systems on intestinal permeability and drug release kinetics, Journal of controlled release 142, 22 (2010).
- McClements [2012] D. J. McClements, Nanoemulsions versus microemulsions: terminology, differences, and similarities, Soft matter 8, 1719 (2012).
- Wadhwa et al. [2012] J. Wadhwa, A. Nair, and R. Kumria, Emulsion forming drug delivery system for lipophilic drugs, Acta Pol Pharm 69, 179 (2012).
- McClements et al. [2007] D. J. McClements, E. A. Decker, and J. Weiss, Emulsion-based delivery systems for lipophilic bioactive components, Journal of food science 72, R109 (2007).
- Porter et al. [2007] C. J. Porter, N. L. Trevaskis, and W. N. Charman, Lipids and lipid-based formulations: optimizing the oral delivery of lipophilic drugs, Nature reviews Drug discovery 6, 231 (2007).
- Waring [2010] M. J. Waring, Lipophilicity in drug discovery, Expert Opinion on Drug Discovery 5, 235 (2010).
- Arnott and Planey [2012] J. A. Arnott and S. L. Planey, The influence of lipophilicity in drug discovery and design, Expert opinion on drug discovery 7, 863 (2012).
- Hiranphinyophat et al. [2021] S. Hiranphinyophat, A. Otaka, Y. Asaumi, S. Fujii, and Y. Iwasaki, Particle-stabilized oil-in-water emulsions as a platform for topical lipophilic drug delivery, Colloids and Surfaces B: Biointerfaces 197, 111423 (2021).
- Kabalnov et al. [1987] A. Kabalnov, A. Pertzov, and E. Shchukin, Ostwald ripening in emulsions: I. direct observations of ostwald ripening in emulsions, Journal of colloid and interface science 118, 590 (1987).
- Taylor [1998] P. Taylor, Ostwald ripening in emulsions, Advances in colloid and interface science 75, 107 (1998).
- Fletcher et al. [1987] P. D. Fletcher, A. M. Howe, and B. H. Robinson, The kinetics of solubilisate exchange between water droplets of a water-in-oil microemulsion, Journal of the Chemical Society, Faraday Transactions 1: Physical Chemistry in Condensed Phases 83, 985 (1987).
- Courtois et al. [2009] F. Courtois, L. F. Olguin, G. Whyte, A. B. Theberge, W. T. Huck, F. Hollfelder, and C. Abell, Controlling the retention of small molecules in emulsion microdroplets for use in cell-based assays, Analytical chemistry 81, 3008 (2009).
- Chen et al. [2012] Y. Chen, A. W. Gani, and S. K. Tang, Characterization of sensitivity and specificity in leaky droplet-based assays, Lab on a Chip 12, 5093 (2012).
- Skhiri et al. [2012] Y. Skhiri, P. Gruner, B. Semin, Q. Brosseau, D. Pekin, L. Mazutis, V. Goust, F. Kleinschmidt, A. El Harrak, J. B. Hutchison, et al., Dynamics of molecular transport by surfactants in emulsions, Soft Matter 8, 10618 (2012).
- Gruner et al. [2016] P. Gruner, B. Riechers, B. Semin, J. Lim, A. Johnston, K. Short, and J.-C. Baret, Controlling molecular transport in minimal emulsions, Nature communications 7, 1 (2016).
- Etienne et al. [2018] G. Etienne, A. Vian, M. Biočanin, B. Deplancke, and E. Amstad, Cross-talk between emulsion drops: how are hydrophilic reagents transported across oil phases?, Lab on a Chip 18, 3903 (2018).
- Kuimova [2012] M. K. Kuimova, Mapping viscosity in cells using molecular rotors, Physical Chemistry Chemical Physics 14, 12671 (2012).
- Wu et al. [2013] Y. Wu, M. Štefl, A. Olzyńska, M. Hof, G. Yahioglu, P. Yip, D. R. Casey, O. Ces, J. Humpolíčková, and M. K. Kuimova, Molecular rheometry: direct determination of viscosity in l o and l d lipid phases via fluorescence lifetime imaging, Physical Chemistry Chemical Physics 15, 14986 (2013).
- López-Duarte et al. [2014] I. López-Duarte, T. T. Vu, M. A. Izquierdo, J. A. Bull, and M. K. Kuimova, A molecular rotor for measuring viscosity in plasma membranes of live cells, Chemical Communications 50, 5282 (2014).
- Mukerjee and Mysels [1971] P. Mukerjee and K. J. Mysels, Critical micelle concentrations of aqueous surfactant systems, Tech. Rep. (National Standard reference data system, 1971).
- Paredes et al. [2013] J. Paredes, M. A. Michels, and D. Bonn, Rheology across the zero-temperature jamming transition, Physical review letters 111, 015701 (2013).
- Dekker et al. [2018] R. I. Dekker, M. Dinkgreve, H. de Cagny, D. J. Koeze, B. P. Tighe, and D. Bonn, Scaling of flow curves: Comparison between experiments and simulations, Journal of non-Newtonian fluid mechanics 261, 33 (2018).
- Wagner and Lindsey [1996] R. W. Wagner and J. S. Lindsey, Boron-dipyrromethene dyes for incorporation in synthetic multi-pigment light-harvesting arrays, Pure and applied chemistry 68, 1373 (1996).
- Hosny et al. [2013] N. A. Hosny, G. Mohamedi, P. Rademeyer, J. Owen, Y. Wu, M.-X. Tang, R. J. Eckersley, E. Stride, and M. K. Kuimova, Mapping microbubble viscosity using fluorescence lifetime imaging of molecular rotors, Proceedings of the National Academy of Sciences 110, 9225 (2013).
- Kang et al. [2020] J. Kang, S. Lhee, J. K. Lee, R. N. Zare, and H. G. Nam, Restricted intramolecular rotation of fluorescent molecular rotors at the periphery of aqueous microdroplets in oil, Scientific reports 10, 1 (2020).
- Schindelin et al. [2012] J. Schindelin, I. Arganda-Carreras, E. Frise, V. Kaynig, M. Longair, T. Pietzsch, S. Preibisch, C. Rueden, S. Saalfeld, B. Schmid, et al., Fiji: an open-source platform for biological-image analysis, Nature methods 9, 676 (2012).
- Legland et al. [2016] D. Legland, I. Arganda-Carreras, and P. Andrey, Morpholibj: integrated library and plugins for mathematical morphology with imagej, Bioinformatics 32, 3532 (2016).
- Wagner and Eglinger [2017] T. Wagner and J. Eglinger, thorstenwagner/ij-ellipsesplit: EllipseSplit 0.6.0 SNAPSHOT (2017).
- Bishop et al. [1979] M. Bishop, M. Kalos, and H. Frisch, Molecular dynamics of polymeric systems, The Journal of Chemical Physics 70, 1299 (1979).
- Roy et al. [2016] S. Roy, S. Dietrich, and F. Höfling, Structure and dynamics of binary liquid mixtures near their continuous demixing transitions, The Journal of chemical physics 145, 134505 (2016).
- Diaz-Herrera et al. [2005] E. Diaz-Herrera, G. Ramirez-Santiago, and J. A. Moreno-Razo, Phase and interfacial behavior of partially miscible symmetric lennard-jones binary mixtures, The Journal of chemical physics 123, 184507 (2005).
- Morozova and Nikoubashman [2019] T. I. Morozova and A. Nikoubashman, Surface activity of soft polymer colloids, Langmuir 35, 16907 (2019).
- Grest and Kremer [1986] G. S. Grest and K. Kremer, Molecular dynamics simulation for polymers in the presence of a heat bath, Physical Review A 33, 3628 (1986).
- Vu and Papavassiliou [2018] T. V. Vu and D. V. Papavassiliou, Oil-water interfaces with surfactants: A systematic approach to determine coarse-grained model parameters, The Journal of Chemical Physics 148, 204704 (2018).
- Liese et al. [2017] S. Liese, M. Gensler, S. Krysiak, R. Schwarzl, A. Achazi, B. Paulus, T. Hugel, J. P. Rabe, and R. R. Netz, Hydration effects turn a highly stretched polymer from an entropic into an energetic spring, ACS nano 11, 702 (2017).
- Zhang and Zhu [2019] X.-F. Zhang and J. Zhu, Bodipy parent compound: fluorescence, singlet oxygen formation and properties revealed by dft calculations, Journal of Luminescence 205, 148 (2019).
- Guo et al. [2006] X. Guo, Z. Rong, and X. Ying, Calculation of hydrophile–lipophile balance for polyethoxylated surfactants by group contribution method, Journal of Colloid and Interface Science 298, 441 (2006).
- Ren et al. [2019] Y. Ren, Q. Zhang, N. Yang, J. Xu, J. Liu, R. Yang, C. Kunkelmann, E. Schreiner, C. Holtze, K. Mülheims, et al., Molecular dynamics simulations of surfactant adsorption at oil/water interface under shear flow, Particuology 44, 36 (2019).
- Kanellopoulos and Owen [1971] A. Kanellopoulos and M. Owen, Adsorption of sodium dodecyl sulphate at the silicone fluid/water interface, Transactions of the Faraday Society 67, 3127 (1971).
- Anderson et al. [2020] J. A. Anderson, J. Glaser, and S. C. Glotzer, Hoomd-blue: A python package for high-performance molecular dynamics and hard particle monte carlo simulations, Computational Materials Science 173, 109363 (2020).
- Osakai et al. [2007] T. Osakai, H. Yamada, H. Nagatani, and T. Sagara, Potential-dependent adsorption of amphoteric rhodamine dyes at the oil/water interface as studied by potential-modulated fluorescence spectroscopy, The Journal of Physical Chemistry C 111, 9480 (2007).
- Zhou et al. [2018] Z. Zhou, X. Yan, Y.-H. Lai, and R. N. Zare, Fluorescence polarization anisotropy in microdroplets, The journal of physical chemistry letters 9, 2928 (2018).
- Xiong et al. [2020] H. Xiong, J. K. Lee, R. N. Zare, and W. Min, Strong concentration enhancement of molecules at the interface of aqueous microdroplets, The Journal of Physical Chemistry B 124, 9938 (2020).
- Zwolinski et al. [1949] B. J. Zwolinski, H. Eyring, and C. E. Reese, Diffusion and membrane permeability., The Journal of physical chemistry 53, 1426 (1949).
- Bruce et al. [2002] C. D. Bruce, M. L. Berkowitz, L. Perera, and M. D. Forbes, Molecular dynamics simulation of sodium dodecyl sulfate micelle in water: micellar structural characteristics and counterion distribution, The Journal of Physical Chemistry B 106, 3788 (2002).
- Tiller et al. [1984] G. E. Tiller, T. J. Mueller, M. E. Dockter, and W. G. Struve, Hydrogenation of triton x-100 eliminates its fluorescence and ultraviolet light absorption while preserving its detergent properties, Analytical biochemistry 141, 262 (1984).
- Chung et al. [2011] P.-H. Chung, J. A. Levitt, M. K. Kuimova, G. Yahioglu, and K. Suhling, Mapping intracellular viscosity by advanced fluorescence imaging of molecular rotors in living cells, in Multiphoton Microscopy in the Biomedical Sciences XI, Vol. 7903 (International Society for Optics and Photonics, 2011) p. 790323.
- Förster and Hoffmann [1971] T. Förster and G. Hoffmann, Die viskositätsabhängigkeit der fluoreszenzquantenausbeuten einiger farbstoffsysteme, Zeitschrift für Physikalische Chemie 75, 63 (1971).
- Seddon et al. [2009] A. M. Seddon, D. Casey, R. V. Law, A. Gee, R. H. Templer, and O. Ces, Drug interactions with lipid membranes, Chemical Society Reviews 38, 2509 (2009).
- Vu et al. [2016] T. T. Vu, R. Méallet-Renault, G. Clavier, B. A. Trofimov, and M. K. Kuimova, Tuning bodipy molecular rotors into the red: sensitivity to viscosity vs. temperature, Journal of Materials Chemistry C 4, 2828 (2016).
- Polita et al. [2020] A. Polita, S. Toliautas, R. Žvirblis, and A. Vyšniauskas, The effect of solvent polarity and macromolecular crowding on the viscosity sensitivity of a molecular rotor bodipy-c 10, Physical Chemistry Chemical Physics 22, 8296 (2020).
- Bittermann et al. [2021] M. R. Bittermann, M. Grzelka, S. Woutersen, A. M. Brouwer, and D. Bonn, Disentangling nano-and macroscopic viscosities of aqueous polymer solutions using a fluorescent molecular rotor, The Journal of Physical Chemistry Letters 12, 3182 (2021).
- Kumbhakar et al. [2004] M. Kumbhakar, S. Nath, T. Mukherjee, and H. Pal, Solvation dynamics in triton-x-100 and triton-x-165 micelles: effect of micellar size and hydration, The Journal of chemical physics 121, 6026 (2004).
- Kumbhakar et al. [2005] M. Kumbhakar, T. Goel, T. Mukherjee, and H. Pal, Nature of the water molecules in the palisade layer of a triton x-100 micelle in the presence of added salts: A solvation dynamics study, The Journal of Physical Chemistry B 109, 14168 (2005).
- Rharbi and Winnik [2001] Y. Rharbi and M. A. Winnik, Solute exchange between surfactant micelles by micelle fragmentation and fusion, Advances in Colloid and Interface Science 89, 25 (2001).
- Rharbi and Winnik [2002] Y. Rharbi and M. A. Winnik, Salt effects on solute exchange in sodium dodecyl sulfate micelles, Journal of the American Chemical Society 124, 2082 (2002).
- Humphrey et al. [1996] W. Humphrey, A. Dalke, and K. Schulten, Vmd: visual molecular dynamics, Journal of molecular graphics 14, 33 (1996).
- Pedregosa et al. [2011] F. Pedregosa, G. Varoquaux, A. Gramfort, V. Michel, B. Thirion, O. Grisel, M. Blondel, P. Prettenhofer, R. Weiss, V. Dubourg, J. Vanderplas, A. Passos, D. Cournapeau, M. Brucher, M. Perrot, and E. Duchesnay, Scikit-learn: Machine learning in Python, Journal of Machine Learning Research 12, 2825 (2011).
- Lu and Gao [2010] G. W. Lu and P. Gao, Emulsions and microemulsions for topical and transdermal drug delivery, in Handbook of non-invasive drug delivery systems (Elsevier, 2010) pp. 59–94.
- Shah et al. [2011] S. W. H. Shah, B. Naseem, W. Rehman, N. Bashir, and S. S. Shah, Investigation of 1-alkanols in organised solutions, Bulletin of the Chemical Society of Ethiopia 25 (2011).