Strain and composition dependencies of the near bandgap optical transitions in monoclinic (AlxGa1-x)2O3 alloys with coherent biaxial in-plane strain on (010) Ga2O3
Abstract
The bowing of the energy of the three lowest band-to-band transitions in -(AlxGa1-x)2O3 alloys was resolved using a combined density functional theory (DFT) and generalized spectroscopic ellipsometry (GSE) approach. The DFT calculations of the electronic band structure of both, -Ga2O3 and -Al2O3, allow extracting of the linear portion of the energy shift in the alloys, and provide a method for quantifying the role of coherent strain present in the -(AlxGa1-x)2O3 thin films on (010) -Ga2O3 substrates. The energies of band-to-band transitions were obtained using the spectroscopic ellipsometry eigenpolarization model approach [A. Mock et al., Phys. Rev. B 95, 165202 (2017)]. After subtracting the effects of strain which also induces additional bowing and after subtraction of the linear portion of the energy shift due to alloying, the bowing parameters associated with the three lowest band-to-band transitions in monoclinic -(AlxGa1-x)2O3 are found.
I Introduction
The ternary alloy (AlxGa1-x)2O3 of gallia (-Ga2O3, bandgap Eg=5.04 eV)Mock et al. (2017) and alumina (-Al2O3, Eg=9.2 eV)Harman et al. (1994) is of current interest for applications in high power electronic devices. The critical electric field in semiconductor electronic devices is proportional to the bandgap energy with the power of 1.83.Slobodyan et al. (2022) Hence, alloys of gallium oxide and aluminum oxide permit for device architectures potentially with very large breakdown fields, and offer a tunable ultrawide bandgap reaching far into the ultraviolet-C spectral region.Spencer et al. (2022) Accurate characterization and understanding of the bandgap properties are prerequisites for future device designs.
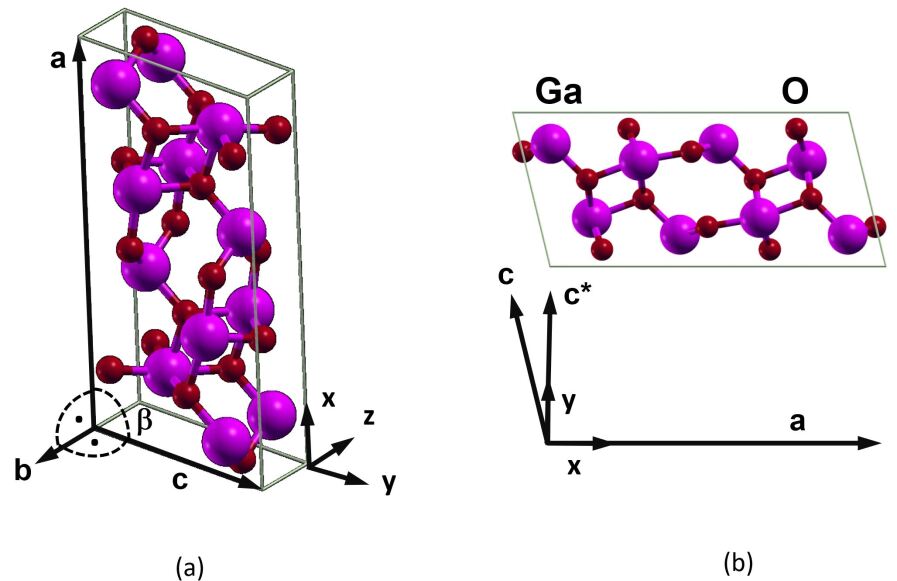
The oxide system (Al,Ga)2O3 exhibits an interesting phase diagram with a number of polymorphs of different symmetries.Peelaers et al. (2018) On the gallium oxide side, the monoclinic phase (space group 12) is stable and relatively easy to grow as a bulk crystal. The unit cell is shown in Fig. 1. The rhombohedral phase (space group 167) is metastable and has been synthesized epitaxially.Shinohara and Fujita (2008) On the aluminum oxide side the rhombohedral phase is stable. The phase of aluminum oxide occurs naturally as the mineral sapphire. The monoclinic polymorph -Al2O3, on the other hand, is metastable and its properties are mostly unknown. Within the ternary alloys the monoclinic structure is expected to be stable and energetically favored up to about 70% of aluminum concentration.Peelaers et al. (2018) The phase, on the other hand, has been demonstrated to exist via epitaxial growth throughout the entire composition range with high crystal quality.Jinno et al. (2021)
Harman et al.Harman et al. (1994) provided a value for Eg=9.2 eV of -Al2O3 not further discriminating between polarization directions and ignoring excitonic contributions. Accurate analysis of the sapphire bandgap, its anisotropy, and excitonic contributions have not been reported yet. Little information is available for the bandgap properties of the obscure monoclinic phase -Al2O3.Wakabayashi et al. (2021) The bandgap energy and direction dependence for rhombohedral structure -Ga2O3 was recently discussed by Hilfiker et al. from a detailed spectroscopic ellipsometry and density functional theory (DFT) analyses.Hilfiker et al. (2021) There, two lowest-energy bandgap transitions were identified with polarization parallel and perpendicular to the lattice axis in the rhombohedral structure. In -Ga2O3 three lowest-energy direct optical transitions at the Brillouin zone center possess different transition energies and are polarized along different directions within the monoclinic unit cell.Sturm et al. (2016); Mock et al. (2017); Ratnaparkhe and Lambrecht (2017) Recently, a generalized spectroscopic ellipsometry analysis revealed the lowest-energy transition between the lowest Brillouin zone center conduction and the highest valence band (transition labeled ) is polarized within the monoclinic plane, and which was determined to occur at a photon energy of 5.04 eV. The onset of absorption caused by exciton formation was found at the lower photon energy of the bandgap reduced by 120 meV. The second-lowest transition () also polarized within the monoclinic plane was determined to be 5.40 eV with its excitonic onset of absorption at 5.17 eV. The third-lowest band-to-band transition () and excitonic onset of absorption, respectively, were recorded at 5.64 eV and 5.46 eV.Mock et al. (2017); Spencer et al. (2022) As these transitions involve different pairs of energy bands, and different transition energies, the edge of the direct bandgap appears slightly different in absorption spectra recorded at different polarization and propagation directions relative to the monoclinic crystal axes. Hence, -Ga2O3 reveals pleochroism in the ultraviolet-A spectral range. This complex anisotropy and bandgap energy behavior evolves within the alloys of monoclinic structure (AlxGa1-x)2O3 and requires detailed discussions. In this paper, we will focus on the three lowest-energy band-to-band transitions and their evolution with composition in the monoclinic (AlxGa1-x)2O3.
Lattice strain affects electronic properties such as eigenvalues and eigenstates. The dependence of the bandgap on strain is often expressed in perturbation theory considerations where small changes to the lattice unit cells cause changes in electronic properties. When such changes are observed to be sufficiently well approximated linear in their causes, i.e., the strain or stress tensor elements, the coefficients rendering analytic expressions between bandgap values and strain or stress parameters are known as strain or stress deformation potential parameters, respectively. Such fist-order deformation potential parameters are very useful in predicting the influence of strain onto bandgap shifts but also for effects on thermal or electrical transport properties, for example. We have recently derived the general strain-stress relationships in linear perturbation theory for monoclinic structure -Ga2O3.Korlacki et al. (2020) Using DFT calculations we provided deformation potential parameters for Brillouin zone center phonon modesKorlacki et al. (2020) as well as for the lowest conduction band level and the top valence band energy levels involved in the three lowest-energy band-to-band transitions.Korlacki et al. (2022) We provide the latter parameters also for monoclinic structure -Al2O3 in this work, and use this set or parameters for numerical reduction of the effect of strain from the anisotropic bandgap values observed from the set of strained -(AlxGa1-x)2O3 samples investigated in this work by spectroscopic ellipsometry.
Heteroepitaxial growth of alloys as thin films often results in strained epitaxial material. The surface onto which the epitaxial layer is deposited – the template – is characterized by the surface orientation under which a given single crystalline substrate is cut. Under pseudomorphic growth the epitaxial thin film adopts the in-plane (interfacial) lattice parameters of the substrate. The thin film lattice dimension perpendicular to the interface then adjusts according to its elastic properties. In case of pure elastic thin film deformation and in the absence of any defect or partial relaxation, the thin film is then fully strained along the interface (coherent biaxial in-plane strain), and stress free perpendicular to its interface. If the substrate is one of the binary compounds, e.g., -Ga2O3, then with increasing composition the misfit between the template and the epitaxial layer -(AlxGa1-x)2O3 enlarges and the magnitude of the coherent biaxial in-plane strain increases. Because Al has a smaller radius than Ga, as a rule of thumb, the in-plane strain will be negative, while the out-of-plane strain will be positive. The strain can be evaluated by measuring x-ray diffraction reciprocal space maps combining analyses of both symmetric and asymmetric reflections and by employing Vegard’s rule. This rule assumes that in a ternary system a given lattice property, can be approximated via a linear shift between the properties of the binary endpoints, and , . Combining x-ray diffraction and Vegard’s rule can also be used to determine the actual composition of a given film. With the in-plane lattice parameters known, the out of plane lattice parameter can be calculated using the elastic constants. The latter can also be calculated using Vegard’s rule from the constants for the binary compounds. It is clear that biaxial in-plane strain will differ for growth on different templates. In this work, we discuss in detail the effects of coherent biaxial in-plane strain with the (010) plane of -Ga2O3 as the interfacial plane. Our analysis details can be easily adopted to any other coherent biaxial in-plane strain for as long as the resulting lattice distortion maintains the monoclinic symmetry of the epitaxial layer.
Typically, in alloys the composition dependence of the bandgap shows a non-linear behavior which is often approximated by a second-order composition dependence also known as bandgap bowing.Peelaers et al. (2018) The evolution of the bandgap for a ternary system such as -(AlxGa1-x)2O3 also depends on the state of strain which in turn depends on the growth condition, for example, in coherent biaxial in-plane strain growth, the strain depends linearly on the composition . It is important to accurately determine the strain-free composition dependence of the bandgap as well as the influence of strain as a function of composition. We note that coherent biaxial in-plane strain due to composition-induced template mismatch causes additional bandgap bowing as we will discuss further below. In addition to composition and strain, effects such as the degree of atomic ordering, e.g., among equally grouped anionic or cationic sites in polar lattices can influence the composition dependence introducing additional bowing.Magri et al. (1991); Wei and Zunger (1994) Other order-disorder phenomena such as defects may even further affect bowing.Wei et al. (2000) To determine the “pure” composition dependence of the bandgap would only be possible for strain free alloys with either perfect atomic order or perfect atomic disorder and in the absence of any defects and impurities. The latter is unrealistic for experimental conditions, however, one may consider high-quality material and assume perfect atomic disorder in the absence of indications for superstructure ordering in electron microscopy investigations. Then, one may ignore the effects of ordering and defects on the bandgap bowing. If the effects of strain are known, one may then access the “pure” bandgap composition dependence by reducing numerically the shifts induced by strain from measured bandgap parameters.
A complete set of bowing parameters for the two lowest anisotropic bandgap energy parameters was determined by Hilfiker et al. for phase (AlxGa1-x)2O3 () using generalized ellipsometry and DFT analyses.Hilfiker et al. (2022) The epitaxial layers were grown on sapphire and free of strain. As an important detail for -(AlxGa1-x)2O3 the character of the valence band structure changes between the two binary compounds. A switch in band order at the top of the valence bands was identified at approximately 40 Al content where the lowest band-to-band transition occurs with polarization perpendicular to lattice direction in -Ga2O3 whereas for -Al2O3 the lowest transition occurs with polarization parallel to lattice direction. Hence, two bowing parameters are needed when describing the lowest-energy transition throughout the composition range.Hilfiker et al. (2022) Additionally, the character of the lowest energy critical point transition for polarization parallel to changes from a Van Hove singularity with type in -Ga2O3 to type van Hove singularity in -Al2O3.Hilfiker et al. (2022) Hilfiker et al. also investigated the lowest band-to-band transitions in -(AlxGa1-x)2O3 for compositions up to 21 .Hilfiker et al. (2019) The epitaxial layers were grown fully strained on (010) templates. The composition dependencies of the three lowest band-to-band transitions and their excitonic contributions were deduced while any strain influences were ignored. At that time, no information on the effect of strain in -(AlxGa1-x)2O3 was available in the literature. No attempt was made to derive bowing parameters because the effect of strain was unknown. Other previous works have reported the lowest-energy onset of absorption in -(AlxGa1-x)2O3 as a function of composition , and various reports were given for bowing parameters (see Table 1). However, except for Hilfiker et al. none of the previous reports considered the peculiar anisotropy and band order in -(AlxGa1-x)2O3 and the bowing parameters for all three lowest-energy band to band transitions are unknown.
In the current paper we perform a combined generalized spectroscopic ellipsometry (GSE) and DFT study of the bandgap bowing of epitaxial -(AlxGa1-x)2O3 grown on (010) templates for compositions up to 21 . GSE is used to determine properties, including exciton parameters, of the near-bandgap direct optical transitions between the valence and conduction bands for compositions between 4.6 and 21 of aluminum, while the strain effects and the linear slope across the alloys are obtained from DFT calculations, respectively. Below we describe the coherent biaxial in-plane strain in the specific circumstance of the (010) coherent biaxial in-plane strain, then we detail our first principles calculations followed by the description of ellipsometry measurements, and finally we present and discuss our results.
| Source | Method | Value (eV) |
|---|---|---|
| Kim et al.Kim et al. (2021) | Calc. | -0.32a |
| Bhattacharjee et al.Bhattacharjee et al. (2021) | Exp. | 0.4 |
| Wang et al.Wang et al. (2018) | Calc. | 0.32 ()a |
| 0.54 ()a | ||
| 1.0a | ||
| Ratnaparkhe and LambrechtRatnaparkhe and Lambrecht (2020) | Calc. | 0.8a |
| Peelaers et al.Peelaers et al. (2018) | Calc. | 0.93a |
| 1.37b | ||
| Bhuiyan et al.Bhuiyan et al. (2020) | Exp. | 1.25c |
| Li et al.Li et al. (2018) | Exp. | 1.3a |
| Ota et al.Ota (2020) | Calc. | 1.4a |
| Jesenovec et al.Jesenovec et al. (2022) | Exp. | 1.69a |
| Wakabayashi et al.Wakabayashi et al. (2021) | Exp. | 2.19 ()a |
| 2.27 ()a |
a Determined for the indirect bandgap.
b Determined for the direct bandgap.
c Determined for the conduction band minimum.
II Theory
II.1 In-plane Strain Parameters
The volume of the unit cell of Al2O3 is smaller than that of Ga2O3. As a result, the incorporation of aluminum into Ga2O3 leads to a dimensional lattice change. In the case of pseudomorphic heteroepitaxial growth when the epitaxial layer adopts the interfacial lattice spacing of the template the epitaxial layer is under strain. As a result, the out-of-plane lattice spacing undergoes elastic changes until it is stress free. X-ray diffraction measurements can be used to verify the thin film lattice parameters. Such measurements are needed to verify that no partial lattice relaxation has occurred, e.g., via defect creation. To calculate the strain tensor elements for the epitaxial layer, we must examine the difference between the relaxed and coherently strained lattice parameters. Kranert et al. determined linear relationships (Vegard’s rule) as a function of composition for all lattice parameters in the case of relaxed -(AlxGa1-x)2O3.Kranert et al. (2015) For coherent biaxial in-plane strain, i.e., without any partial lattice relaxation, the state of strain will depend on the compositon as well as the surface orientation of the substrate. Oshima et al. obtained the relationship between the length of -vector and aluminum concentration for -(AlxGa1-x)2O3 grown on (010) -Ga2O3 substrates.Oshima et al. (2016) In the further analysis we assume the following to be true regarding the lattice parameters of the investigated -(AlxGa1-x)2O3 films: (i) due to the coherent growth, the lattice parameters of the films parallel to (010) (i.e., within the monoclinic plane) maintain the values of the substrate; (ii) as a result, perpendicular to (010) the layer contracts as demonstrated by Oshima et al.Oshima et al. (2016) For every composition , we calculate the strain tensor elements from the differences of the lattice parameters between the coherent values described above and the relaxed values determined by Kranert et al.Kranert et al. (2015)
A monoclinic lattice may be characterized by lattice vectors , as shown, for example, for -Ga2O3 in Fig. 1, reproduced from Schubert et al.Schubert et al. (2016) The monoclinic angle is defined here as the obtuse between axis and . Hence,
| (1) |
with coordinates and lengths , , accordingly. We aim at making use of results in first order perturbation theory, and we require therefore that any strain or stress leaves the symmetry of the unit cell unchanged, hence, we assume that stress () and strain () tensors have monoclinic symmetry as well
| (2) |
| (3) |
In general, a lattice vector under strain changes such as
| (4) |
A state of strain (or stress) maybe expressed by lengths , , , and monoclinic angle . It is further assumed that the monoclinic plane of the strained lattice remains within the plane. Hence,
| (5) |
and
| (6) |
We define and . Then
| (7) |
and
| (8) |
| (9) |
A quadratic equation emerges for with standard normalized coefficients
| (10) |
| (11) |
| (12) |
In the latter equation, the negative branch is discarded as unphysical solution. , , then follow from simple algebra:
| (13) |
| (14) |
For the strain parameter along axis
| (15) |
| (16) |
and
| (17) |
II.2 First Principles Calculations
DFT calculations are employed here to quantitatively estimate two independent effects: the linear slope of the composition dependence, i.e., Vegard’s rule for the energy of selected band-to-band transitions, and the composition dependence of the effect of strain onto these transitions, respectively. To begin with, we have to verify that the band structures of the monoclinic phases of these two materials, -Ga2O3 and -Al2O3, are similar such that a one-to-one correspondence between the -point band-to-band transitions in these two materials is present. Only if such similarity exists between the two binary endpoint one may anticipate the validity of Vegard’s rule, and a linear composition dependence may be valid for the strain free alloys. To maintain maximum consistency between calculations for the two different materials, all parameters and procedures are kept the same where possible, except for lattice dimensions and atomic potentials.
The effects of strain onto the near-bandgap optical transitions in -Ga2O3 were reported by us recently.Korlacki et al. (2022) The previous results serve here as our starting point. DFT calculations were performed with a fine Monkhorst-PackMonkhorst and Pack (1976) grid for Brillouin zone sampling () and a very large plane-wave basis (400 Ry cutoff). A convergence threshold of Ry was used to reach self-consistency. These parameters were selected specifically for studying the effects of strain,Korlacki et al. (2020) and we maintain these parameters in the calculations included here. A convergence threshold of Ry was used to reach self-consistency. All DFT calculations were performed using a plane-wave code Quantum ESPRESSO.[QuantumESPRESSOisavailablefromhttp://www.quantum-espresso.org.Seealso:]GiannozziJPCM2009QE The calculations for -Ga2O3 in Refs. Korlacki et al., 2020, 2022 used generalized-gradient-approximation (GGA) density functional of Perdew, Burke, and ErnzerhofPerdew et al. (1996) in combination with norm-conserving Troullier-Martins pseudopotentials generated using FHI98PPFuchs and Scheffler (1999); Troullier and Martins (1991) code and available in the Quantum ESPRESSO pseudopotentials library. The pseudopotential for gallium did not include the semicore states in the valence configuration. The exact same calculations were repeated for -Al2O3 using a pseudopotential for aluminum from the same family of Fritz-Haber Institute Troullier-Martins pseudopotentials. The equilibrium cell was obtained with the same criteria as used in Ref. Korlacki et al., 2020 for -Ga2O3, i.e., Ry for energy and Ry/bohr for forces.
II.2.1 Strain Free Band Structure Comparison
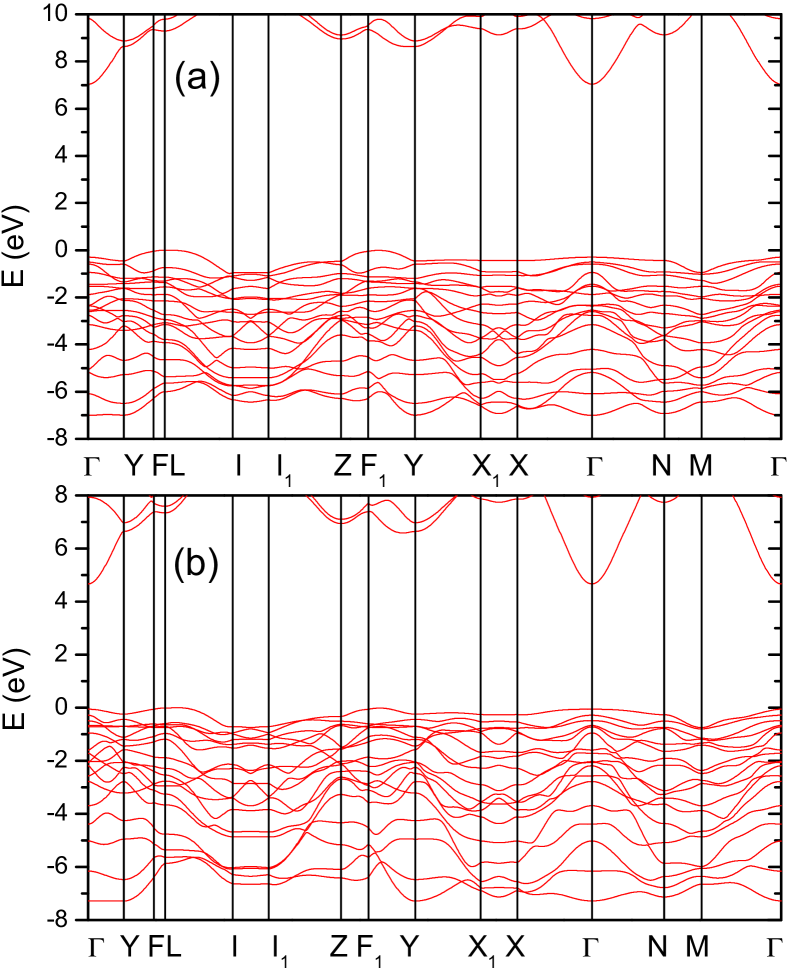
The analysis of optical matrix elements between the valence and the conduction band at the -point indicate that -Al2O3 indeed exhibits a similar structure of lowest band-to-band transitions than -Ga2O3. We consistently use transition labels introduced by Mock et al.,Mock et al. (2017) , where and are indices of the conduction and valence bands, respectively. Numerals begin at the bottom and the top of the conduction and valence bands, respectively, and indicate those participating in a given optical transition. Transitions and are polarized within the monoclinic plane as valence bands and belong to the irreducible representation . The transitions has its transition dipole oriented close to the crystallographic vector , while the transition has its transition dipole oriented close to the crystallographic vector . The transition is polarized along the symmetry axis (parallel to the crystallographic vector ).
In order to compare the band structures of -Ga2O3 and -Al2O3 and obtain reasonably accurate Vegard parameters (slopes) for transition energy parameters, we performed additional band structure calculations using a hybrid Gau-PBESong et al. (2011, 2013) density functional. The hybrid-DFT calculations were performed at the PBE equilibrium geometries and a regular non-shifted Monkhorst-Pack grid for the Brillouin zone sampling and grid for sampling of the Fock operator. The cutoff for the Fock operator was also reduced to 400 Ry. The convergence threshold for self-consistency in hybrid functional calculations was set to Ry. The results of the current calculations for -Ga2O3 agree very well with those previously published by Mock et al.;Mock et al. (2017) the previous calculations performed on a coarser grid and at slightly different geometry due to a smaller basis (100 Ry). The energies of optical transitions between these two calculations are the same to within 0.02 eV (i.e. %). The high-resolution interpolated plots of the band structures, shown in Figure 2, were obtained with the help of the band interpolation method based on the maximally localized Wannier functionsMarzari and Vanderbilt (1997); Souza et al. (2001) as implemented in the software package WANNIER90.Mostofi et al. (2008)
| -Ga2O3 | -Al2O3 | Slope | |
|---|---|---|---|
| Transition | x=0 (eV) | x=1 (eV) | (1) - (0) (eV) |
| 4.87 | 7.51 | 2.64 | |
| 4.87 | 7.74 | 2.87 | |
| 4.51 | 6.91 | 2.40 | |
| 4.725 | 7.337 | 2.613 | |
| 4.952 | 7.546 | 2.594 | |
| 5.333 | 7.980 | 2.648 |
II.2.2 Strain and Composition Effects
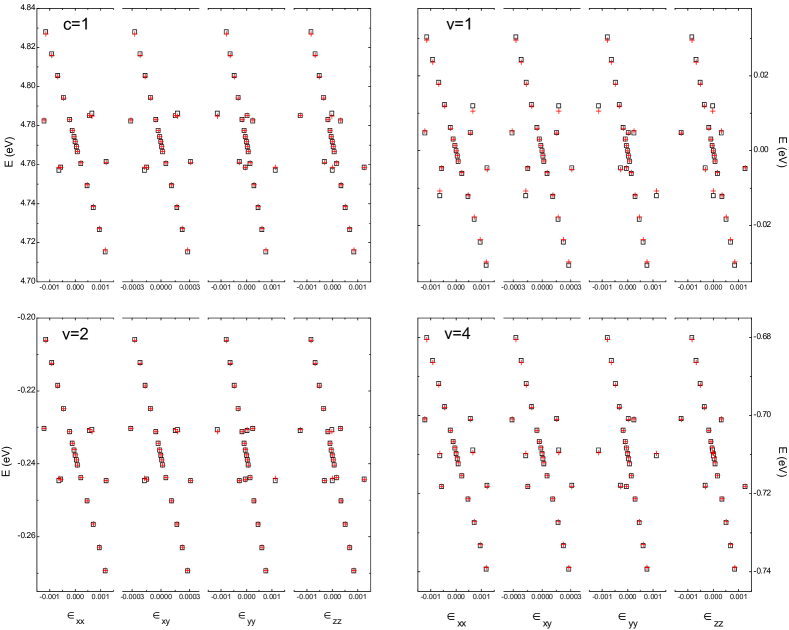
The strain effect on the Brillouin zone center energy levels and , hence, on the energies of the band-to-band transitions for -Ga2O3 were reported previously.Korlacki et al. (2022) They were shown to involve four deformation potentials, one associated with each independent component of the monoclinic strain tensor.Korlacki et al. (2022) Here, we propose a model to account for strain effects in alloys across the entire range of compositions between -Ga2O3 and -Al2O3. First, we apply the methodology from Refs. Korlacki et al., 2020, 2022 to -Al2O3. In these earlier publications, the strain deformation potentials were obtained by testing various deformation patterns (such as hydrostatic pressure, uniaxial stress, and uniaxial strain) and computing energy eigenvalues, i.e., using DFT, for a total of 64 structures representing different deformation scenarios and varying amplitudes of strain. For the determination of the deformation potentials the allowed strain was limited to , corresponding to 35 out of the 64 strain scenarios. In the current study, we performed analogous DFT calculations for -Al2O3. We only performed the calculations for strain patterns within the above limit. However, as the cell volume of -Al2O3 is smaller than -Ga2O3, for the determination of the deformation potentials, we further lowered the strain limit to . As a result, the deformation potentials were obtained from 21 structures and are listed in Table 3. The obtained deformation potentials accurately reproduce band energies under the 21 deformations included here (Figure 3). The explicit strain scenarios are given in the supplement of Ref. Korlacki et al., 2020.
| Band | Pη,xx | Pη,xy | Pη,yy | Pη,zz |
|---|---|---|---|---|
| -20.02 | 5.40 | -21.86 | -19.59 | |
| -10.73 | 4.83 | -14.70 | -8.31 | |
| -11.63 | 1.57 | -11.91 | -10.84 | |
| -12.34 | 2.58 | -6.58 | -12.28 |
To calculate the effect of strain onto the band energy levels as a function of composition we propose to employ Vegard’s rule. Hence, for the deformation potentials for -(AlxGa1-x)2O3 we use values for -Al2O3 in Table 3 and for -Ga2O3 in Table II of Ref. Korlacki et al., 2022. Thus, we propose a set of equations for the combined strain and composition dependencies of the lowest band-to-band transitions (, , and ) in -(AlxGa1-x)2O3:
| (18) |
| (19) |
| (20) |
where is the aluminum concentration and , , , and are the strain tensor elements. The bowing parameters, , , and , are to be determined further below. The strain free transition energies for are experimental values from Ref. Mock et al., 2017, the slope parameters are from Table 2. We note that, although not instantly obvious, the strain parameters depend linearly on composition for coherent biaxial in-plane (010) strain. This can be simply verified by numerical calculations using equations derived above in Sect. II.1. As a consequence, and because the deformation potentials depend on composition, it is obvious that strain introduces a parabolic dependence on composition and can be mistaken as bowing if not considered appropriately.
II.2.3 Elastic tensor
We augment the DFT calculations of -Al2O3 with the calculation of the full tensor of elastic constants with the help of thermo_pw code.Foo This calculation was performed using the same parameters as described above. The tensor of elastic constants (in kbar), in the Voigt notation and standard ordering is given below. Note that the standard ordering is not consistent with our choice of the Cartesian reference system, but rather with and .
| (21) |
The values of the bulk modulus, calculated from the relevant components of the elastic (stiffness) and compliance tensors, are: 1831 kbar (Voigt approximation), 1808 kbar (Reuss approximation), and 1819 kbar (Voigt-Reuss-Hill average).
Together with the elastic tensor for -Ga2O3, provided in the supplementary material of Ref. Korlacki et al., 2020, allows us to once again apply a linear interpolation scheme to obtain a model of the elastic tensor for the -(AlxGa1-x)2O3 alloys:
| (22) |
II.2.4 Coherent biaxial in-plane strain for (010) surface
Strain elements within the monoclinic plane, , , and , can be calculated using equations 12-14, from the differences of the relaxed lattice parameters of alloys versus those of the substrate. Two options arrive for determining , either one determines from XRD measurements, or one may use the tensor of elastic constants, , to calculate . The tensors are discussed in the previous section. The generalized Hooke’s law is then
| (23) |
with
| (24) |
| (25) |
where is the transpose operator. Because for (010) coherent biaxial in-plane strain the stress perpendicular to the monoclinic plane is zero (), one can calculate after determining , , and
| (26) |
In the above equation we used the elastic tensor from Eq. 22.
III Experiment
III.1 Samples
-(AlxGa1-x)2O3 epitaxial thin films were deposited on (010) -Ga2O3 substrates using plasma-assisted molecular beam epitaxy as described in Ref. Oshima et al., 2016. Aluminum compositions of 4.6, 9.7, 12, 15, 16.3, and 21 were determined from X-ray diffraction (XRD) measurements as described by Oshima et al.Oshima et al. (2016) All thin film lattice parameters were obtained from x-ray investigations using symmetric and asymmetric reflections as described by Oshima et al. (Ref. Oshima et al., 2016). Reciprocal space mapping further indicates a fully coherent growth of the alloy thin films on the (010) substrates without any lattice relaxation. Hence, the further modeling of strain effects in the alloy films will be based on the (010) coherent biaxial in-plane strain conditions.
III.2 Generalized Spectroscopic Ellipsometry
The -Ga2O3 substrates are monoclinic and their optical and spectroscopic properties were studied extensively, both experimentally and theoretically.Sturm et al. (2015, 2016); Furthmüller and Bechstedt (2016); Schubert et al. (2016); Mock et al. (2017); Ratnaparkhe and Lambrecht (2017) The details of the generalized spectroscopic ellipsometry measurements and the analysis of the results follow the same model approach described by Mock et al.,Mock et al. (2017) which was applied earlier to a set of -(AlxGa1-x)2O3 thin films on (010) -Ga2O3 substrates.Hilfiker et al. (2019) Here, we augment the previous results with three additional samples.
III.2.1 Ellipsometry Measurements
Generalized spectroscopic ellipsometry data was measured in ambient conditions in the Mueller matrix formalismFujiwara (2007) from 1.5 to 9.0 eV using two separate instruments. Vacuum-ultra-violet (VUV) spectra was acquired from 6.5 eV to 9 eV using a commercially available rotating-analyzer ellipsometer (VUV-VASE, J.A. Woollam Co., Inc.). The rest of the spectral range was collected using a dual-rotating compensator ellipsometer (RC2, J.A. Woollam Co., Inc.), also commercial. All measurements were done at three angles of incidence ( = 50∘, 60∘, 70∘) and at multiple azimuthal angles. For VUV data, the sample was manually rotated in 45∘ steps from 0∘ to 180∘ to fully capture the monoclinic symmetry. For NIR-Visible data (1.5 eV to 6.5 eV), the sample was rotated in 15∘ steps for a full rotation. Note that the VUV instrument does not permit acquisition of the 4th row of the Mueller matrix while the NIR-visible instrument does. This however does not hinder access to the full dielectric tensor in this case as -(AlxGa1-x)2O3 films are neither magnetically nor optically active.
III.2.2 Analysis of the dielectric tensor
To analyze the ellipsometry data, best-match model calculations are employed. Specifically, the substrate-film(layer)-roughness(layer)-ambient model is used here.Fujiwara (2007) Figure 1 shows the coordinate system chosen here common to both the -Ga2O3 substrate and -(AlxGa1-x)2O3 film. Here is parallel to lattice vector a, is parallel to c⋆, where the monoclinic plane is defined by a and c⋆, and is parallel to b. This together describes the dielectric tensor directions. For further discussion about the choice of coordinate system, see Ref. Mock et al., 2017.
| (27) |
The full description of the dielectric tensor of pure -Ga2O3 modeled using an eigendielectric vector summation approach was published in Ref. [Mock et al., 2017]. The same approach and functions were then applied to the dielectric tensor of -(AlxGa1-x)2O3 for 0.21 films similar to those studied here.Hilfiker et al. (2019) We use a critical-point (CP) model dielectric function (MDF) approach, projected within tensor dyadics to perform our best-match model calculations detailed in Refs. Mock et al., 2017; Hilfiker et al., 2019. We permit CP model parameters (amplitude, broadening, transition energy, and angular orientation) to freely vary during best-match parameter calculations. Due to little observed sensitivity, the exciton binding energy parameters for all -(AlxGa1-x)2O3 films were kept constant to the values obtained for -Ga2O3.Mock et al. (2017) We account for surface roughness by adding a thin model layer containing an isotropic average of all tensor elements weighted with 50 void. The best match ellipsometry model parameters for the -(AlxGa1-x)2O3 film thickness and roughness layer thickness are 135.(6) nm and 0.(7) nm for the 4.6 sample, 131.(2) nm and 0.(9) nm for the 9.7 sample, 82.(4) nm and 1.(2) nm for the 12 sample, 120.(6) nm and 1.(8) nm for the 15 sample, 128.(3) nm and 0.(8) nm for the 16.3 sample, and 62.(9) nm and 1.(2) nm for the 21 sample, respectively. The last digit which is determined within the 90 confidence interval is indicated with parentheses. The resulting energies for the three lowest band-to-band transitions are listed in Table 4.
| Aluminum Concentration | ||||||
| 4.6% | 9.7% | 12% | 15% | 16.3% | 21% | |
| Transition Energies (eV)(GSE) | ||||||
| E | 5.15 | 5.22 | 5.23 | 5.31 | 5.34 | 5.42 |
| E | 5.49 | 5.56 | 5.59 | 5.64 | 5.67 | 5.72 |
| E | 5.76 | 5.82 | 5.84 | 5.87 | 5.93 | 5.99 |
| Transition Energies (eV)(Linear Interpolation) | ||||||
| 5.16 | 5.30 | 5.36 | 5.43 | 5.47 | 5.59 | |
| 5.52 | 5.65 | 5.71 | 5.79 | 5.83 | 5.95 | |
| 5.76 | 5.90 | 5.96 | 6.04 | 6.07 | 6.20 | |
| Strain parameters | ||||||
| 0.0016 | 0.0033 | 0.0041 | 0.0052 | 0.0056 | 0.0073 | |
| -0.0003 | -0.0007 | -0.0008 | -0.0010 | -0.0011 | -0.0014 | |
| 0.0015 | 0.0031 | 0.0039 | 0.0049 | 0.0053 | 0.0068 | |
| -0.0010 | -0.0020 | -0.0024 | -0.0031 | -0.0033 | -0.0043 | |
IV Discussion
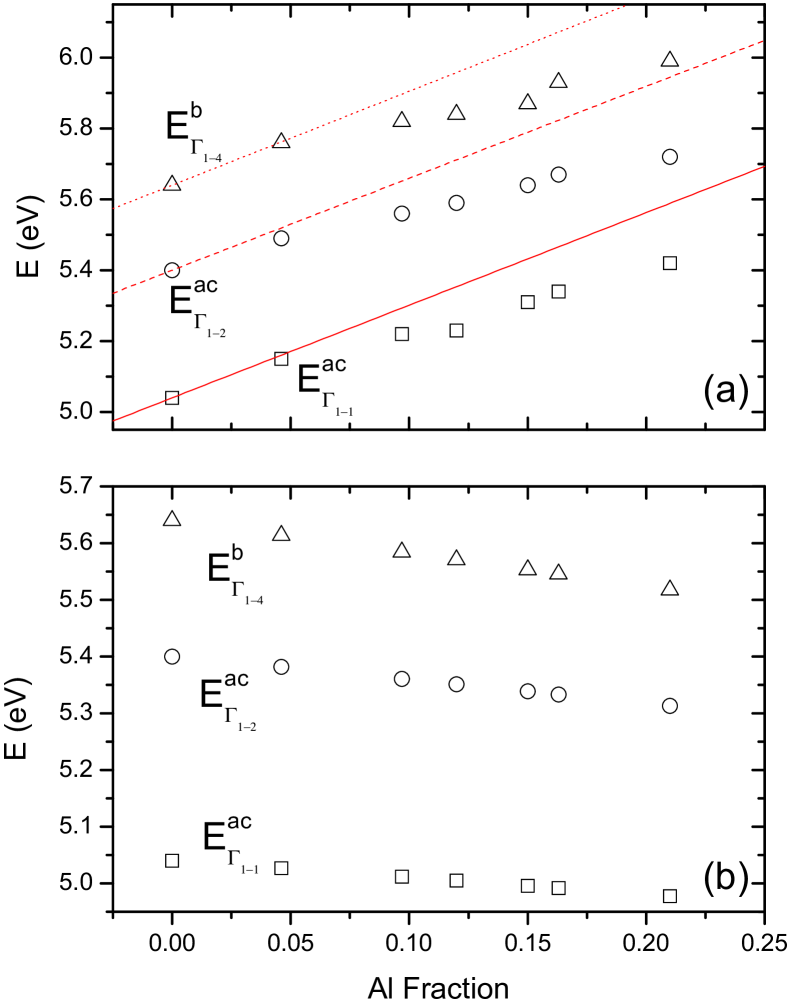
The transition energies listed in Tab. 4 and plotted in Figure 4, as obtained from the analysis of experimental GSE spectra, are a net result of multiple competing physical phenomena, predominantly alloying (the concentration of aluminum within the lattice of gallium oxide), and strain. We now have all the ingredients necessary to untangle these effects and extract the bowing dependence of transition energy versus the aluminum concentration. First, the linear portion of the concentration dependence can be obtained by linear interpolation of the band-to-band transition energies between the two end points corresponding to -Ga2O3 () and -Al2O3 (). By comparing the transition energies obtained from DFT calculations. Here, we find linear band-to-band transition shifts between -Ga2O3 and -Al2O3 to be (Table 2) : 2.613 eV, : 2.594 eV, and : 2.648 eV.
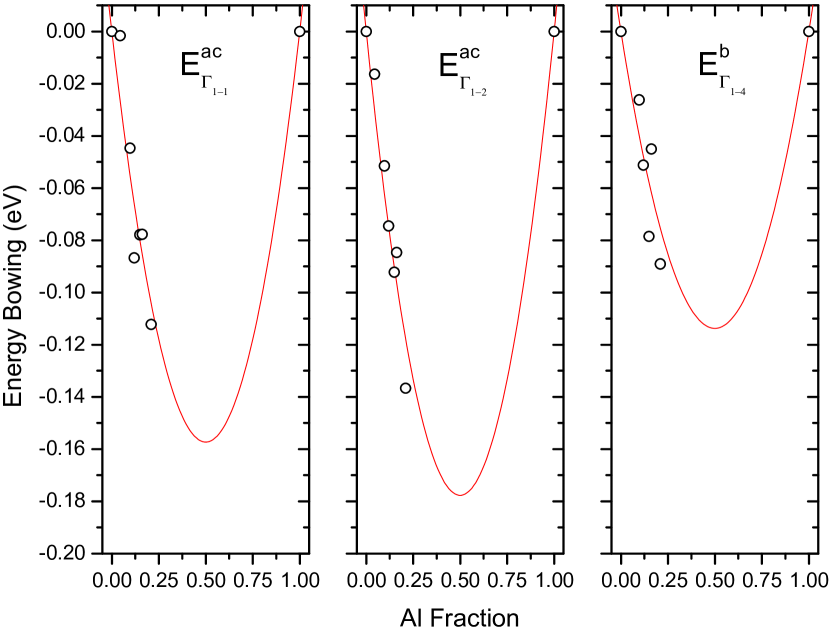
Then, the effects of strain can be accounted for by explicitly estimating the amount of strain in coherently grown films, as described above in Sec. III.1. The energy shifts caused by strain can then be calculated using equations 18-20. Note that we assume the equations to be valid, even though the actual amount of strain in some of the samples exceeds the limit used in the determination of the deformation potentials. The values of strain for all samples studied are listed in Table 4. Note that strain values for were calculated using the approach discussed in Sect. II.1, while the parameters were obtained from XRD measurements from the out-of-plane film lattice parameters. The resulting (strain-induced) energy shifts of the three band-to-band transitions are plotted in Fig. 4. After subtracting the effects of strain and the linear effect of alloying, the remaining effect in the transition energies can be attributed to the bandgap bowing. This is shown in Fig. 5. The dependence of the energy versus aluminum concentration is matched to , and the bowing parameters are found to be = 0.63 eV, = 0.71 eV, = 0.45 eV, respectively, for the three lowest transitions. The resulting bowing parameters are of the same order of magnitude, but on the lower end of values reported in the literature so far, with the majority of results being reported for the indirect bandgap.
To the best of our knowledge, no previous study considered individual Brillouin-zone center optical transitions, with an explicit treatment of excitonic effects, or accounted for the effects of strain in the alloy films. It is also worth mentioning that the outcome for the bowing parameters can be affected by the correction made for the linear composition dependencies of the bandgap energies between -Ga2O3 and -Al2O3. Especially the bandgap value of the latter is insecure, since -Al2O3 does not exist as a bulk single crystal. Peelears et al. calculated values of 7.24 eV and 7.51 eV for the indirect and direct bandgaps of -Al2O3, respectively,Peelaers et al. (2018) which were then assumed in the analysis by Jesenovec et al.Jesenovec et al. (2022) Bhattacharjee et al.Bhattacharjee et al. (2021) included the Al2O3 bandgap as a free parameter within their model, and the value obtained was () eV. In our analysis, we used linear composition dependencies obtained from consistent DFT calculations, which we anchored to experimental transition energies for the -Ga2O3 for a greater accuracy.
Another interesting aspect worth mentioning here is the fact that equations 18-20, used to account for the strain shift of band-to-band transition energies, inherently include some amount of bowing. This is due to the fact that the strain components in these equations are also a linear function of composition, i.e., the samples with higher Aluminum concentration exhibit larger strain. This probably explains why among the values of bowing parameters gathered in Table 1, the results not affected by strain (like those obtained from DFT calculations performed on unstrained equilibrium unit cells) tend to occupy the lower end of this broad range of values. If this is the case, it emphasizes the importance of strain for the properties of thin films, and ultimately in electronic devices.
V Conclusion
The evolution of the three lowest direct band-to-band transition energies in -(AlxGa1-x)2O3 alloys with was studied using a combination of DFT calculations and GSE measurements. The DFT calculations provide a method for quantifying the role of coherent strain present in the -(AlxGa1-x)2O3 thin films on (010) -Ga2O3 substrates. This allowed for an untangling of strain from the band-to-band transition energies determined using the spectroscopic ellipsometry eigenpolarization model approach. We report three individual bowing parameters associated with the three lowest band-to-band transitions in -(AlxGa1-x)2O3. The results described in this work are important for future design of electronic and optoelectronic device structures based on -(AlxGa1-x)2O3.
Acknowledgements.
This work was supported in part by the National Science Foundation (NSF) under awards NSF DMR 1808715 and NSF/EPSCoR RII Track-1: Emergent Quantum Materials and Technologies (EQUATE), Award OIA-2044049, by Air Force Office of Scientific Research under awards FA9550-18-1-0360, FA9550-19-S-0003, and FA9550-21-1-0259, by the Knut and Alice Wallenbergs Foundation award ’Wide-bandgap semiconductors for next generation quantum components’, the Swedish Energy Agency under Award No. P45396-1, the Swedish Governmental Agency for Innovation Systems (VINNOVA) under the Competence Center Program Grant No. 2016-05190, the Swedish Research Council VR under Grands No. 2016-00889, Swedish Foundation for Strategic Research under Grants No. RIF14-055, and No. EM16-0024, and the Swedish Government Strategic Research Area in Materials Science on Functional Materials at Linköping University, Faculty Grant SFO Mat LiU No. 2009-00971. M.S. acknowledges the University of Nebraska Foundation and the J. A. Woollam Foundation for financial support. J.S.S, A.M., and Y.Z. acknowledge funding from AFOSR through programs FA9550-18-1-0059 and FA9550-18-1-0479, and DTRA through program HDTRA 11710034.References
- Mock et al. (2017) A. Mock, R. Korlacki, C. Briley, V. Darakchieva, B. Monemar, Y. Kumagai, K. Goto, M. Higashiwaki, and M. Schubert, Phys. Rev. B 96, 245205 (2017).
- Harman et al. (1994) A. K. Harman, S. Ninomiya, and S. Adachi, J. Appl. Phys. 76, 8032 (1994).
- Slobodyan et al. (2022) O. Slobodyan, J. Flicker, J. Dickerson, J. Shoemaker, A. Binder, T. Smith, S. Goodnick, R. Kaplar, and M. Hollis, Journal of Materials Research 37, 849 (2022).
- Spencer et al. (2022) J. A. Spencer, A. L. Mock, A. G. Jacobs, M. Schubert, Y. Zhang, and M. J. Tadjer, Applied Physics Reviews 9, 011315 (2022).
- Schubert et al. (2016) M. Schubert, R. Korlacki, S. Knight, T. Hofmann, S. Schöche, V. Darakchieva, E. Janzén, B. Monemar, D. Gogova, Q.-T. Thieu, R. Togashi, H. Murakami, Y. Kumagai, K. Goto, A. Kuramata, S. Yamakoshi, and M. Higashiwaki, Phys. Rev. B 93, 125209 (2016).
- Peelaers et al. (2018) H. Peelaers, J. B. Varley, J. S. Speck, and C. G. Van de Walle, Appl. Phys. Lett. 112, 242101 (2018).
- Shinohara and Fujita (2008) D. Shinohara and S. Fujita, Japanese Journal of Applied Physics 47, 7311 (2008).
- Jinno et al. (2021) R. Jinno, C. S. Chang, T. Onuma, Y. Cho, S.-T. Ho, D. Rowe, M. C. Cao, K. Lee, V. Protasenko, D. G. Schlom, D. A. Muller, H. G. Xing, and D. Jena, Science Advances 7, eabd5891 (2021).
- Wakabayashi et al. (2021) R. Wakabayashi, K. Yoshimatsu, M. Hattori, J.-S. Lee, O. Sakata, and A. Ohtomo, Cryst. Growth. Des. 21, 2844 (2021).
- Hilfiker et al. (2021) M. Hilfiker, R. Korlacki, R. Jinno, Y. Cho, H. G. Xing, D. Jena, U. Kilic, M. Stokey, and M. Schubert, Applied Physics Letters 118, 062103 (2021).
- Sturm et al. (2016) C. Sturm, R. Schmidt-Grund, C. Kranert, J. Furthmüller, F. Bechstedt, and M. Grundmann, Phys. Rev. B 94, 035148 (2016).
- Ratnaparkhe and Lambrecht (2017) A. Ratnaparkhe and W. R. L. Lambrecht, Appl. Phys. Lett. 110, 132103 (2017).
- Korlacki et al. (2020) R. Korlacki, M. Stokey, A. Mock, S. Knight, A. Papamichail, V. Darakchieva, and M. Schubert, Phys. Rev. B 102, 180101(R) (2020).
- Korlacki et al. (2022) R. Korlacki, J. Knudtson, M. Stokey, M. Hilfiker, V. Darakchieva, and M. Schubert, Appl. Phys. Lett. 120, 042103 (2022).
- Magri et al. (1991) R. Magri, S. Froyen, and A. Zunger, Phys. Rev. B 44, 7947 (1991).
- Wei and Zunger (1994) S.-H. Wei and A. Zunger, Phys. Rev. B 49, 14337 (1994).
- Wei et al. (2000) S.-H. Wei, S. B. Zhang, and A. Zunger, Journal of Applied Physics 87, 1304 (2000).
- Hilfiker et al. (2022) M. Hilfiker, U. Kilic, M. Stokey, R. Jinno, Y. Cho, H. G. Xing, D. Jena, R. Korlacki, and M. Schubert, Applied Physics Letters 121, 052101 (2022).
- Hilfiker et al. (2019) M. Hilfiker, U. Kilic, A. Mock, V. Darakchieva, S. Knight, R. Korlacki, A. Mauze, Y. Zhang, J. Speck, and M. Schubert, Appl. Phys. Lett. 114, 231901 (2019).
- Kim et al. (2021) H. W. Kim, H. Ko, Y.-C. Chung, and S. B. Cho, J. Eur. Ceramic Soc. 41, 611 (2021).
- Bhattacharjee et al. (2021) J. Bhattacharjee, S. Ghosh, P. Pokhriyal, R. Gangwar, R. Dutt, A. Sagdeo, P. Tiwari, and S. D. Singh, AIP Advances 11, 075025 (2021).
- Wang et al. (2018) T. Wang, W. Li, C. Ni, and A. Janotti, Phys. Rev. Appl. 10, 011003 (2018).
- Ratnaparkhe and Lambrecht (2020) A. Ratnaparkhe and W. R. L. Lambrecht, Phys. Status Solidi B 257, 1900317 (2020).
- Bhuiyan et al. (2020) A. F. M. A. U. Bhuiyan, Z. Feng, J. M. Johnson, H.-L. Huang, J. Hwang, and H. Zhao, Appl. Phys. Lett. 117, 252105 (2020).
- Li et al. (2018) J. Li, X. Chen, T. Ma, X. Cui, F.-F. Ren, S. Gu, R. Zhang, Y. Zheng, S. P. Ringer, L. Fu, H. H. Tan, C. Jagadish, and J. Ye, Appl. Phys. Lett. 113, 041901 (2018).
- Ota (2020) Y. Ota, AIP Advances 10, 125321 (2020).
- Jesenovec et al. (2022) J. Jesenovec, B. Dutton, N. Stone-Weiss, A. Chmielewski, M. Saleh, C. Peterson, N. Alem, S. Krishnamoorthy, and J. S. McCloy, J. Appl. Phys. 131, 155702 (2022).
- Kranert et al. (2015) C. Kranert, M. Jenderka, J. Lenzner, M. Lorenz, H. von Wenckstern, R. Schmidt-Grund, and M. Grundmann, J. Appl. Phys. 117, 125703 (2015).
- Oshima et al. (2016) Y. Oshima, E. Ahmadi, S. C. Badescu, F. Wu, and J. Speck, Appl. Phys. Exp. 9, 061102 (2016).
- Monkhorst and Pack (1976) H. J. Monkhorst and J. D. Pack, Phys. Rev. B 13, 5188 (1976).
- Giannozzi et al. (2009) P. Giannozzi, S. Baroni, N. Bonini, M. Calandra, R. Car, C. Cavazzoni, D. Ceresoli, G. L. Chiarotti, M. Cococcioni, I. Dabo, A. D. Corso, S. de Gironcoli, S. Fabris, G. Fratesi, R. Gebauer, U. Gerstmann, C. Gougoussis, A. Kokalj, M. Lazzeri, L. Martin-Samos, N. Marzari, F. Mauri, R. Mazzarello, S. Paolini, A. Pasquarello, L. Paulatto, C. Sbraccia, S. Scandolo, G. Sclauzero, A. P. Seitsonen, A. Smogunov, P. Umari, and R. M. Wentzcovitch, J. Phys.: Cond. Mat. 21, 395502 (2009).
- Perdew et al. (1996) J. P. Perdew, K. Burke, and M. Ernzerhof, Phys. Rev. Lett. 77, 3865 (1996).
- Fuchs and Scheffler (1999) M. Fuchs and M. Scheffler, Comput. Phys. Commun. 119, 67 (1999).
- Troullier and Martins (1991) N. Troullier and J. L. Martins, Phys. Rev. B 43, 1993 (1991).
- Setyawan and Curtarolo (2010) W. Setyawan and S. Curtarolo, Comput. Mat. Sci. 49, 299 (2010).
- Song et al. (2011) J.-W. Song, K. Yamashita, and K. Hirao, J. Chem. Phys. 135, 071103 (2011).
- Song et al. (2013) J.-W. Song, G. Giorgi, K. Yamashita, and K. Hirao, J. Chem. Phys. 138, 241101 (2013).
- Marzari and Vanderbilt (1997) N. Marzari and D. Vanderbilt, Phys. Rev. B 56, 12847 (1997).
- Souza et al. (2001) I. Souza, N. Marzari, and D. Vanderbilt, Phys. Rev. B 65, 035109 (2001).
- Mostofi et al. (2008) A. A. Mostofi, J. R. Yates, Y.-S. Lee, I. Souza, D. Vanderbilt, and N. Marzari, Comput. Phys. Commun. 178, 685 (2008).
- Mu et al. (2022) S. Mu, M. Wang, J. B. Varley, J. L. Lyons, D. Wickramaratne, , and C. G. Van de Walle, Phys. Rev. B 105, 155201 (2022).
- (42) Thermo_pw code is available from https://dalcorso.github.io/thermo_pw/.
- Sturm et al. (2015) C. Sturm, J. Furthmüller, F. Bechstedt, R. Schmidt-Grund, and M. Grundmann, APL Materials 3, 106106 (2015).
- Furthmüller and Bechstedt (2016) J. Furthmüller and F. Bechstedt, Phys. Rev. B 93, 115204 (2016).
- Fujiwara (2007) H. Fujiwara, Spectroscopic Ellipsometry (John Wiley & Sons, New York, 2007).