[a]Y. Solovyeva
Wind parameters of the new LBV in NGC1156
Abstract
In this work we present the spectrum modeling results for the newly discovered luminous blue variable (LBV) in the NGC 1156 galaxy. Extended atmosphere models were calculated using the non-LTE code CMFGEN. We have obtained the luminosity of the discovered LBV , effective temperature kK and mass-loss rate . The hydrogen abundance in the wind is % for the metallicity of the host galaxy.
1 Introduction
Luminous blue variables are a rare type of luminous massive stars (M>25 M, L L, [1]) at an advanced stage of evolution. They are characterized by noticeable photometric and spectral variability, and their important observational feature is the S Dor type variability, which consists of stellar brightness variations up to simultaneously with spectral changes at an approximately constant (within 0.2 dex) bolometric luminosity [2].
2 Methods
For modeling, we chose a spectrum with the best resolution and the highest signal-to-noise ratio, which was obtained using BTA/SCORPIO-2 in the long slit mode (see details in [3]). The observed spectrum has a spectral resolution of Å in the 3600-7300 Å spectral range.
The spectrum of J025941.21+251412.2 contains hydrogen lines with broad wings and numerous Fe II and [Fe II] lines, which are characteristic of many types of massive stars with a strong gas outflow. In addition to the lines of the object itself, the spectrum exhibits narrow components of hydrogen lines, [O III] , [N II] , [S II] and some other emissions of the nebula surrounding the object together with the neighboring groups of young stars. To remove the nebula contribution, we extracted its pure spectrum in a star-free region located in the slit near the object, then multiplied this spectrum by a scaling factor and subtracted it from the observed spectrum of the object. The scaling factor was calculated in such a way as to achieve the most complete subtraction of all nebula lines from the object spectrum.
Numerous Fe II lines in the spectrum probably indicates the low ionization state of the wind. In addition, the absence of helium lines in the spectrum may also indicate a relatively low photospheric temperature (11 kK) during the corresponding observation period.
Initially, we selected several "cold" models (11-12 kK) from a pre-calculated grid of extended model atmospheres. After that, we scaled the mass-loss rate, radius and luminosity of the most suitable model according to the photometric data, V= mag. The best-fit model was convolved with the absorption curve [5] using interstellar reddening obtained from the Balmer decrement of the star’s surrounding nebula.
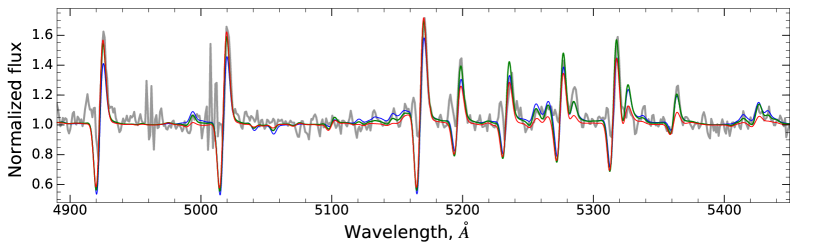
There are no direct temperature indicators (e.g. He I / He II lines ratio) in the optical spectrum, and therefore, we used different Fe II lines for effective temperature estimations. We built a set of models with different temperatures in the range of 7-11 kK. Fig. 1 shows several model spectra with different temperatures and a fixed photospheric radius in a spectral range covering several Fe II lines. As seen in Fig 1, the ratios of the Fe II 4924, 5018, 5169 line equivalent widths to those of the Fe II 5197-5427 line series decrease with lower temperatures. The chosen line ratios are highly sensitive to temperature changes. Hence, we obtained relatively accurate photospheric temperature estimates. The effective temperature ranges from 7.5 to 8.3 kK in models that showed the best agreement with the observed spectrum in the Fe II lines. The model absorption component of several Fe II lines is deeper than in the observed spectrum, probably due to the presence of forbidden [Fe II] lines in the blue wings of the Fe II lines formed in the previously ejected low density gas.
We obtained the mass-loss rate by fitting strong Balmer series lines. The hydrogen abundance estimate 20 % by mass fraction was based on the equivalent width ratio of the , , lines to Fe II 5169. Hydrogen abundance values range from 15 to 20 % in the most suitable models.
The metallicity of the host galaxy NGC 1156 [6] was used in all models. The nitrogen and carbon abundances were assumed to be and , respectively.
There are no forbidden wind lines with clearly identified profiles (e.g. [N II] 5755) in the optical spectrum. Thus, the terminal wind velocity cannot be measured directly from the spectrum, and therefore, we used only the widths of strong Balmer series emission lines for crude wind velocity estimates. We assumed terminal velocity and a simple velocity law [7] in the best-fit model. The microclumping in the wind cannot be estimated properly due to the strong wide wings in the profiles of the , lines. Thus, a typical LBV volume filling-factor was chosen for calculations (e.g. [2]).
3 Results
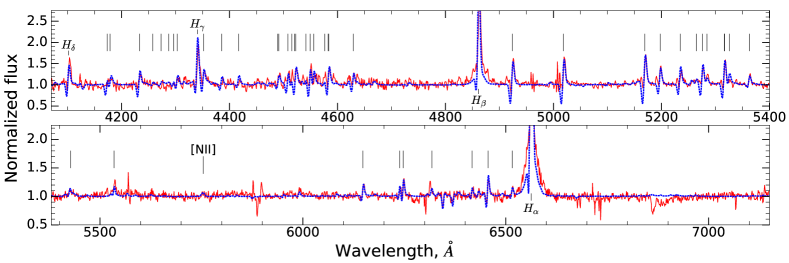
The normalized optical spectra and best-fit model of LBV J025941.21+251412.2 with the most important lines are shown in Fig. 2.
The luminosity of LBV J025941.21+251412.2 is , the effective temperature is kK and the mass-loss rate is . The photospheric radius is for the photometric data, distance and interstellar reddening presented above.
Hydrogen abundance in the wind of J025941.21+251412.2 is significantly lower () than the one for studied LBVs (-40 %, [2]). The chemical composition of J025941.21+251412.2 is similar to that of a late-WN star, which probably indicates the advanced evolutionary stage of the discovered star.
Acknowledgements
Modeling was performed as part of the government contract of SAO RAS approved by the Ministry of Science and Higher Education of the Russian Federation. Observations with the SAO RAS telescopes are supported by the Ministry of Science and Higher Education of the Russian Federation. The renovation of telescope equipment is currently provided within the national project ”Science and universities”.
References
- [1] R.M. Humphreys, K. Weis, K. Davidson and M.S. Gordon, On the Social Traits of Luminous Blue Variables, Astrophys. J. 825 (2016) 64 [1603.01278].
- [2] J.H. Groh, D.J. Hillier, A. Damineli, P.A. Whitelock, F. Marang and C. Rossi, On the Nature of the Prototype Luminous Blue Variable Ag Carinae. I. Fundamental Parameters During Visual Minimum Phases and Changes in the Bolometric Luminosity During the S-Dor Cycle, Astrophys. J. 698 (2009) 1698 [0904.2363].
- [3] Y. Solovyeva, A. Vinokurov, N. Tikhonov, A. Kostenkov, K. Atapin, A. Sarkisyan et al., Search for LBVs in the Local Volume galaxies: study of two stars in NGC 1156, arXiv e-prints (2022) arXiv:2208.05858 [2208.05858].
- [4] D.J. Hillier and D.L. Miller, The Treatment of Non-LTE Line Blanketing in Spherically Expanding Outflows, Astrophys. J. 496 (1998) 407.
- [5] E.L. Fitzpatrick, Correcting for the Effects of Interstellar Extinction, Publ. Astron. Soc. Pac. 111 (1999) 63 [astro-ph/9809387].
- [6] S.C. Kim, H.S. Park, J. Kyeong, J.H. Lee, C.H. Ree and M. Kim, Distance and Reddening of the Isolated Dwarf Irregular Galaxy NGC 1156, Publ. Astron. Soc. Jpn. 64 (2012) 23 [1109.5780].
- [7] D.J. Hillier, WC Stars: Hot Stars with Cold Winds, Astrophys. J. 347 (1989) 392.