Ultrafaint Dwarf Galaxy Candidates in the M81 Group: Signatures of Group Accretion
Abstract
The faint and ultrafaint dwarf galaxies in the Local Group form the observational bedrock upon which our understanding of small-scale cosmology rests. In order to understand whether this insight generalizes, it is imperative to use resolved-star techniques to discover similarly faint satellites in nearby galaxy groups. We describe our search for ultrafaint galaxies in the M81 group using deep ground-based resolved-star data sets from Subaru’s Hyper Suprime-Cam. We present one new ultrafaint dwarf galaxy in the M81 group and identify five additional extremely low surface brightness candidate ultrafaint dwarfs that reach deep into the ultrafaint regime to (similar to current limits for Andromeda satellites). These candidates’ luminosities and sizes are similar to known Local Group dwarf galaxies Tucana B, Canes Venatici I, Hercules, and Boötes I. Most of these candidates are likely to be real, based on tests of our techniques on blank fields. Intriguingly, all of these candidates are spatially clustered around NGC 3077, which is itself an M81 group satellite in an advanced state of tidal disruption. This is somewhat surprising, as M81 itself and its largest satellite M82 are both substantially more massive than NGC 3077 and by virtue of their greater masses, would have been expected to host as many or more ultrafaint candidates. These results lend considerable support to the idea that satellites of satellites are an important contribution to the growth of satellite populations around Milky Way–mass galaxies.
Accepted by The Astrophysical Journal Letters: September 1, 2022
1 Introduction
As the lowest-mass galaxies, the numbers and properties of ultrafaint dwarfs (UFDs; ; Simon 2019; Drlica-Wagner et al. 2020) are extremely sensitive to critical aspects of our theoretical understanding of galaxy formation (Agertz et al., 2020) and are among the best existing probes of the nature of dark matter (DM; Bullock & Boylan-Kolchin 2017; Nadler et al. 2021). Due to their low masses, small variations in galaxy formation physics result in orders-of-magnitude scatter in galaxy stellar-to-halo mass ratios (Bullock & Boylan-Kolchin, 2017; Fitts et al., 2017; Munshi et al., 2019; Agertz et al., 2020) — a behavior that will manifest itself in the luminosity function and properties of UFD satellites (Smercina et al., 2018; Bose et al., 2020; Carlsten et al., 2021).
Because UFDs are intrinsically faint and have extremely low surface brightnesses, the only way of discovering them has been by seeking concentrations of individual resolved stars in survey datasets (e.g., Belokurov et al., 2007; Koposov et al., 2015; Drlica-Wagner et al., 2020), limiting the most sensitive searches to the Milky Way (Drlica-Wagner et al., 2020) and M31 (McConnachie et al., 2018). There are signatures in both satellite systems of substructure and the accretion of satellites in groups: the delivery of satellites by the Magellanic Clouds (Koposov et al., 2015; Patel et al., 2020), differences between the star formation quenching times (Weisz et al., 2019; D’Souza & Bell, 2021) and radial profiles of the Milky Way and M31 satellites (Samuel et al., 2020), and claims of alignments or planes of satellites (Pawlowski et al., 2012; Ibata et al., 2013). Because the Milky Way and M31 experienced particular growth and accretion histories, our models — which have been calibrated entirely in the Local Group by necessity — may not accurately describe the satellite populations of a wider, more representative set of groups (e.g., Carlsten et al., 2022; Smercina et al., 2022).
While the survey power of the Vera C. Rubin Observatory and Nancy Grace Roman Space Telescope will spur rapid progress in this field, current facilities (e.g., Magellan’s Megacam or Subaru’s Hyper Suprime-Cam (HSC)) already allow the discovery of faint (e.g., Smercina et al. 2017, Okamoto et al. 2019 in the M81 group) and ultrafaint (e.g., Mutlu-Pakdil et al. 2022, Sand et al. 2022) galaxies the Local Volume (Mpc). The M81 group ( Mpc; Radburn-Smith et al. 2011) is particularly interesting to study. M81 has a rich satellite population; diffuse light searches with the Canada-France-Hawaii Telescope (Chiboucas et al., 2013) and more recent resolved-star work (Smercina et al., 2017; Okamoto et al., 2019) have revealed 17(!) new group members in the past decade. Deep multiband data (Okamoto et al., 2015; Smercina et al., 2020) are available, allowing the development and testing of satellite search methods (see also Mutlu-Pakdil et al. 2021). Furthermore, M81 is undergoing a group-scale interaction involving the recent arrival and tidal disruption of at least two large satellites (Yun et al., 1994; Okamoto et al., 2015; Smercina et al., 2020), offering a possibility to study the impacts of satellite delivery in group accretions (Li & Helmi, 2008; Deason et al., 2015; D’Souza & Bell, 2021).
Here, we report the discovery using resolved-star techniques of one new M81 group UFD, and we present five lower surface brightness candidate UFDs, with absolute magnitudes reaching toward .
2 Observations
We combine two datasets from HSC (Miyazaki et al., 2018). Okamoto et al. (2015) surveyed the M81 group in and bands using 7 HSC pointings (each 15 field of view), centered on M81. The four eastern pointings have excellent image quality with point-sources size of 07–09, and 50% completeness limits . The three western pointings have worse image quality, and while we analyze them, they do not have competitive depth for dwarf searches (Okamoto et al., 2019). Smercina et al. (2020) surveyed two pointings in each of three () filters, chosen to cover the outer regions of M81, M82, and NGC 3077. Image depth was nearly uniform across the two fields, yielding extinction-corrected point-source detection limits of , , and , measured at 5. Seeing was relatively stable, resulting in consistent point-source sizes of 07–08.
Both datasets were reduced with the HSC optical imaging pipeline, which is a fork of the Legacy Survey of Space and Time (LSST) pipeline whose main features are regularly re-integrated with the LSST pipeline (Bosch et al., 2018). The pipeline performs photometric and astrometric calibration using the Pan-STARRS1 catalog (Magnier et al., 2013), reporting final magnitudes in the HSC natural system. Sources detected in band determine reference positions for forced photometry, which is performed on co-added image stacks in all available passbands. All magnitudes were corrected for Galactic extinction following Schlegel et al. (1998) adopting the updated extinction coefficients from Schlafly & Finkbeiner (2011). For this work, we use size measurements derived using the ext_shapeHSM_HsmSourceMoments algorithms, which have been optimized for applications such as weak lensing where shape measurements are critical (Hirata & Seljak, 2003; Mandelbaum et al., 2005).
In order to search for UFD satellites, we must differentiate between stars at the distance of the M81 group and much more numerous unresolved background galaxies. There is no single perfect method; consequently, we use three different methods.
-
1.
Morphology: In each passband, we determine the spatially variable point-spread function (PSF) on / scales (in the Okamoto et al. 2015 and Smercina et al. 2020 data sets respectively) using bright stars . Morphologically selected stars are then those objects with sizes in each passband smaller than the PSF size plus in the bands for the Okamoto et al. (2015) data set, and in for the Smercina et al. (2020) data set. In artificial galaxy detection experiments, these thresholds yielded the faintest detection limits that could be achieved with modest contamination.
- 2.
-
3.
Nearest Neighbor: The Smercina et al. (2020) data are of uniform enough quality that supervised machine-learning techniques can be used. Nine quantities are used: -band magnitude, , , and the object size in the R.A. and decl. directions for each of , and bands. Each quantity was normalized to have an outlier-resistant standard deviation of unity to carry similar weights in the classification. We select a training set of background objects in areas distant from the M81 group galaxies. In order to assemble a training set of likely stars, we statistically subtract these background objects from the population of objects in a star-rich region of equal area in the stellar envelopes of M82 and NGC 3077. For each background object, the nearest match in the star-rich region is identified in 9-dimensional space, and this object is discarded from the dataset, leaving a sample that is likely to contain primarily stars ( objects). These star and background training sets then classify all objects using the majority vote of the 11 nearest neighbors in this 9-dimensional space (using scikit.learn.neighbors). Classifications for the background and star-rich regions were generated using alternate regions. The detailed choice of training regions does not affect any of our conclusions.
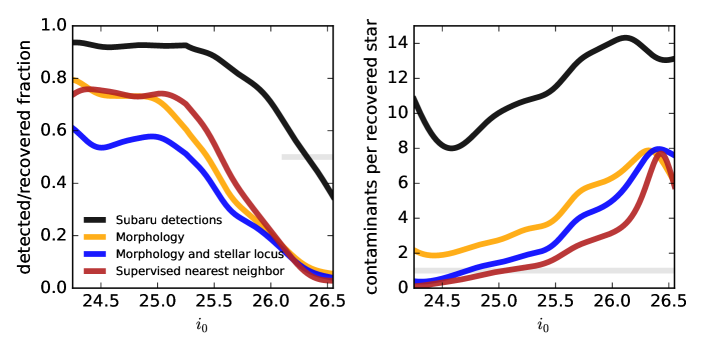
We illustrate the performance of the three different star–galaxy separation techniques in Fig. 1. We use as ground truth stars in uncrowded regions of M81’s halo with Hubble Space Telescope (HST) imaging from the GHOSTS survey (Radburn-Smith et al., 2011)111The relatively small number of HST stars allows star–galaxy separation testing but was insufficient to act as a training set for star–galaxy separation.. The overall completeness remains above 90% for , dropping rapidly thereafter (black curve; left panel). The right panels show the contamination divided by the number of detected stars, which is the position-dependent density of stars multiplied by the completeness (we analyze uncrowded regions and can neglect spatial variations in completeness; Smercina et al. 2020). The GHOSTS fields used to quantify contamination have low stellar density and so give contamination measures that are higher than would be expected at the positions of our UFD candidates, but give a robust measure of the relative performance of star–galaxy separation methods. Notwithstanding this limitation, it is clear that star–galaxy separation is crucial — in the GHOSTS fields, there are 8-14 more galaxies than stars at such limits (black curve, right panel), motivating stringent star–galaxy separation. The three star–galaxy selections already lower completeness at and strongly reduce it for ; contamination by background galaxies is, however, dramatically reduced, permitting a search for UFD candidates that will be less overwhelmed by the clustering of background compact sources.
3 UFD candidate identification
Candidate UFDs will appear as overdensities of objects with the colors and magnitudes expected for metal-poor red giant branch (RGB) stars (e.g., Martin et al., 2008). We select stars within the polygon with corners , and 222This selection region encloses the metal-poor RGB population characteristic of M81’s outer stellar halo (see the 25–35 kpc and 35–45 kpc radial bins in Fig. 7 of Smercina et al. 2020).. This color–magnitude cut is sufficiently red to avoid contamination by the young stars that are widespread across the whole M81 group (e.g., Okamoto et al., 2015). In order to identify overdensities with sizes comparable to the half-light radii of UFDs in the Local Group, we determine the density of metal-poor RGB stars using kernel density estimation using a top-hat kernel with radii of 200 and 400 pc; we sample the distribution on 100 pc scales333Tests show that these kernels recover artificial galaxies with properties similar to Local Group UFDs.. We demand that an overdensity has a Poisson probability of being drawn from the spatially varying background (assessed using a 4 kpc top-hat radius) of . Rapid changes in density in the inner parts of bright galaxies yield spurious overdensities; we therefore conservatively exclude any recovered overdensity within 22, 12, 10, 5, and 4 projected kpc from M81, M82, NGC 3077, IKN, and KDG61, respectively. We then determine a more tailored measure of significance by allowing modest shifts in the center and choosing the best significance in a range of apertures between 100 and 800 pc. Candidates are those objects that have final probability of being drawn from the background by chance alone. We search each dataset separately: Okamoto et al. (2015) using the Morphology cut, and using all three star–galaxy separation methods in the Smercina et al. (2020) dataset. In areas where both datasets overlap, we choose only candidates detected in the Smercina et al. (2020) dataset. Given the search area, probing independent 200 pc radius apertures, candidates would be expected from chance alone.
We quantify the expected degree of contamination by artifacts or groups of background galaxies by analyzing archival data taken by the Subaru Strategic Program of a four-pointing deep HSC mosaic in the COSMOS field (Aihara et al., 2022), where the probability of finding a real Local Volume UFD is very low. This has similar area and depth but has slightly worse seeing. The morphological (stellar locus) cut gives three (one) candidates across the four HSC fields with .
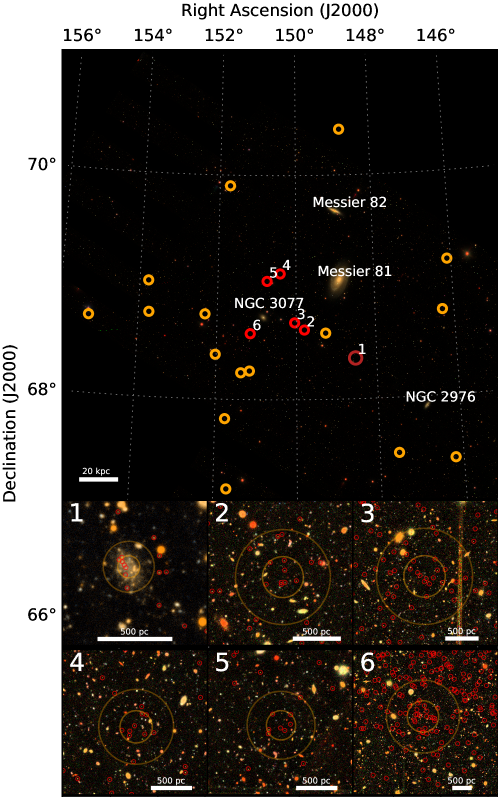
In the M81 datasets, we recover all known dwarf galaxies in the search area (Fig. 2, left) in addition to a background galaxy UGC 5423 ( Mpc; large gray circle). We find 11 additional candidates in the seven-pointing Okamoto et al. (2015) mosaic using the morphology-only cut ( would be expected from our analysis of COSMOS). After experimentation, we found no robust algorithmic methods for rejecting clumps of background objects or spurious detections, so we visually inspect each candidate. Eight candidates are clearly spurious (artifacts near bright stars, field edges, or galactic cirrus) and are discarded completely. Two overlap with the deep coverage with more stringent star–galaxy separation, and are vetoed by that deeper dataset. One candidate — M81-dw J0954+6821 — is compact enough to show diffuse surface brightness; furthermore, the diffuse brightness is bluer in color than the resolved RGB stars, as is expected for a partially resolved dwarf galaxy (as the diffuse light is dominated by bluer subgiants and main-sequence turnoff stars; see e.g., Figure 1 of Sand et al. 2022). On this basis, we argue that it is a clear dwarf galaxy (brick red circle in Fig. 2; Table 1).
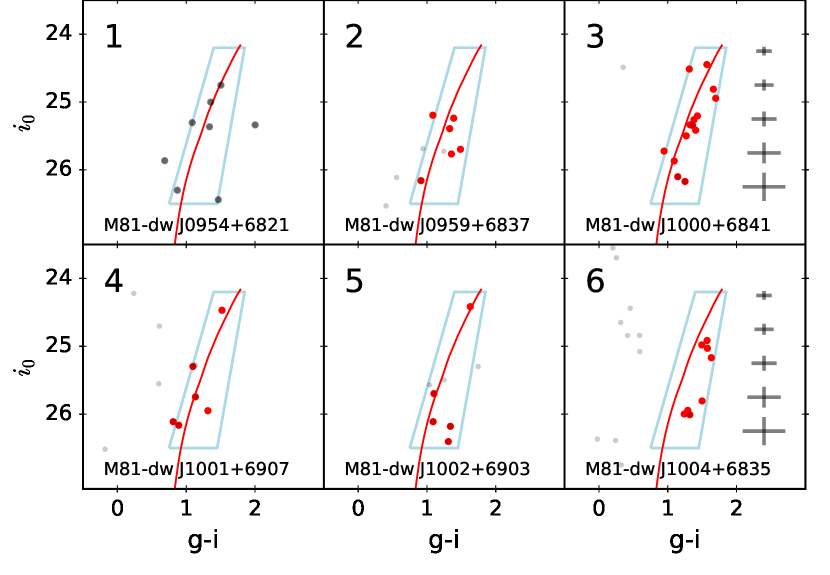
We find eight candidates in the two-pointing deep dataset with stars after background subtraction, where we would expect only 0.5 spurious candidates from our COSMOS analysis. One candidate is close to a bright star and is rejected outright. Seven candidates remain (Table 1). One of them is close enough to a bright background galaxy that we are concerned that the point sources might be globular clusters around those nearby galaxies (an important contaminant of candidate M31 UFDs; Martin et al. 2013). Another appears to be a background galaxy group, given a clear concentration of blue compact sources in that candidate’s color–magnitude diagram (CMD). The remaining five appear to be stellar in nature, and we retain them as candidates, shown as red circles in Fig. 2 (see Table 1). We show postage stamps of the candidates in Fig. 3. Fig. 4 shows background-corrected CMDs for each candidate. We show objects within the 80% light radius (determined from the fits described in §4). In order to background-subtract the CMD, we choose a background annulus of equal area (with inner radius ), and for every object in that background annulus we choose the closest match in color–magnitude space of objects within the 80% light radius and discard it from the CMD. Only the remaining objects — those that are in excess of the background in that region — are shown in Fig. 4. Gray symbols show background-corrected morphologically selected ‘stars’; red symbols (in panels 2–6) show stellar-locus-selected stars444The blue ‘stars’ in M81-dw J1004+6835’s CMD are likely to be real, from young stars in M81’s Hi tidal field (Okamoto et al., 2015)..
| Name | Number | R.A. (J2000) | Decl. (J2000) | Data Set | Note | ||
|---|---|---|---|---|---|---|---|
| (deg) | (deg) | (mag) | (pc) | ||||
| M81-dw J0954+6821a | 1 | Okamoto | Definite dwarf | ||||
| M81-dw J0959+6837 | 2 | Smercina | |||||
| M81-dw J1000+6841 | 3 | Smercina | |||||
| M81-dw J1001+6907 | 4 | Smercina | |||||
| M81-dw J1002+6903 | 5 | Smercina | |||||
| M81-dw J1004+6835 | 6 | Smercina | Superimposed on | ||||
| NGC 3077 tidal debris | |||||||
| M81-dw J1008+6856 | Smercina | Likely Background | |||||
| Galaxy Cluster | |||||||
| M81-dw J1003+6901 | Smercina | Possible background GCs |
Note. — a M81-dw J0954+6821 has high enough surface brightness to have a well-measured ellipticity and PA.
4 The properties and distribution of dwarf and ultrafaint dwarf candidates
4.1 Candidate properties
In order to estimate candidate properties, we assume that each is at the M81 group distance of Mpc. We follow Martin et al. (2008) in fitting a two-dimensional exponential profile with uniform background to the distribution of detected stars. The candidates have so few stars that their ellipticity and position angle are virtually unconstrained. We therefore instead fit a four-parameter model: R.A., decl., the major-axis half-light radius , and the number of stars. A Markov Chain Monte Carlo maximum likelihood fit is performed using emcee (Foreman-Mackey et al., 2013), using uniform priors in all parameters except position; a Gaussian prior on position is applied with pc in each direction. We estimate absolute magnitude by scaling the observed number of stars by the magnitude-dependent completeness (Fig. 1; this correction is roughly a factor of two) and the absolute magnitude per detected RGB star, estimated from a 13.3 Gyr old [M/H] Padova isochrone555http://stev.oapd.inaf.it/cmd, using the PARSEC evolutionary tracks version 1.2S (Bressan et al., 2012). (given the ages and metallicities of similarly luminous UFDs; Brown et al. 2014, Simon 2019; shown in Fig. 4). Dwarf galaxy M81-dw J0954+6821 has high surface brightness and is crowded; we therefore directly calculate the flux and half-light radius from the image itself. The results of these fits are given in Table 1.
M81-dw J0954+6821 has a high surface brightness within the half-light radius (26 mag arcsec-2; Fig. 2a) and is a definite dwarf galaxy. It has well-measured parameters: pc, , PA, and . Its magnitude error is dominated by background uncertainty. Its CMD (Fig. 4) is sparse, due at least partially to crowding. In contrast, our most diffuse (29.5 mag arcsec-2) candidate is M81-dw J1004+6835 — it is just kpc south of NGC 3077 and is superimposed on a rich stellar population from NGC 3077 itself. The other four candidates have between and and values between 200 and 350 pc. Due to their extreme surface brightnesses (29 mag arcsec-2), no diffuse light can be detected; deeper CMD data from HST or JWST will be required for confirmation.
It is clear why these candidates have so far evaded detection: all candidates are fainter than all known M81 group dwarf galaxies, and all but one of the candidates have much lower surface brightness than known M81 dwarfs. Yet the M81 satellites’ properties are not unexpected, overlapping with the ranges of magnitudes and sizes of dwarf galaxies and UFDs in the Local Group (Fig. 2, top right).
Within or near the Local Group, there are two analogs to the relatively compact galaxy M81-dw J0954+6821: Pegasus V/Andromeda XXXIV ( kpc; Collins et al. 2022) and Tucana B ( Mpc; Sand et al. 2022). In their relatively high luminosities and large sizes, M81-dw J1004+6835 and M81-dw J1000+6841 are most similar to Canes Venatici I/Andromeda IX and Hercules/Andromeda XXIV, respectively. The remaining dwarfs are analogs of Boötes I, or equivalently Andromeda XIII or XXII.
4.2 The spatial distribution of candidates
Fig. 2 shows that candidates are not distributed uniformly in the M81 group. One might have expected the M81 group satellites to be clustered around M81 itself, or potentially, given the evidence for infall with the Magellanic Clouds, around M82, M81’s largest satellite. Yet, instead, they are clustered around NGC 3077. One immediate implication is that most of these candidates are likely to be real — our COSMOS blank-field study shows that spurious candidates are more spatially uniform.
Given the spatially varying seeing, fully accounting for completeness requires forward modeling given expected satellite distributions and is beyond the scope of this work. The Smercina et al. (2020) dataset has uniform depth, permitting instead a preliminary estimate of significance. In the northern field, excluding M82, there is one known fainter satellite. In NGC 3077’s field, excluding NGC 3077, there are five known fainter satellites and five new candidates (10 total). The chance of drawing 10 satellites from a Poisson distribution if the mean is 1 is ; alternatively, the chance of drawing one satellite if the mean is 10 is . If the mean is 5.5 (the average), the chance of drawing one or less for one draw and 10 or more for the other is , or . We conclude that there is less than a chance that this difference in satellite counts is from chance alone666Including satellites or candidates outside the Smercina et al. (2020) footprint, excluding those galaxies that are closer to NGC 2976 with R.A. or decl. (2 vs. 14), instead. Restricting our attention conservatively to clear dwarf galaxies in this area (2 vs. 9) gives ..
5 Discussion
Assuming that these candidates are real, and neglecting completeness corrections, we illustrate the impact of these new discoveries on the M81 group luminosity function within a projected radius of kpc (Fig. 2, bottom right), in comparison with kpc Milky Way satellites (purple; Drlica-Wagner et al. 2020) and kpc M31 satellites (cyan; McConnachie et al. 2018). This satellite and these candidates extend the M81 group luminosity function faintward by 1.5 mag (or a factor of 4 in luminosity). Despite M81’s stellar mass being comparable to those of the Milky Way or M31 (with , 6 and 10 respectively; Bell et al. 2017), the M81 group is richer than either the Milky Way’s or M31’s within equivalent radii. At this stage, we refrain from ascribing this difference to a single cause, as several factors should (or have been observed to) correlate with the overall number of satellites — e.g., the stellar mass of the host, virial mass of the DM halo, and delivery of satellites by recent group accretions (Carlsten et al., 2021; D’Souza & Bell, 2021; Smercina et al., 2022).
One of the most interesting features of these candidates is that all of them are projected close to NGC 3077. Clearly, confirmation of the candidates via deep high-resolution HST or JWST photometry and velocity measurements (via semi-resolved spectroscopy, following, e.g., Toloba et al. 2016) would be very valuable to understand this association with NGC 3077. This strengthens the recognition by Chiboucas et al. (2013) of the M81 group’s highly flattened satellite system and is reminiscent of M31’s asymmetric satellite system, where 80% of its satellites are preferentially on the near side of M31 (Fig. 13 in Savino et al. 2022).
The spatial coincidence of NGC 3077 and most of the M81 group satellites is surprising. Since satellite number should scale with DM halo mass (e.g., Jiang & van den Bosch 2015), M81 should host most of the satellites. Yet the satellite distribution is extremely asymmetric, indicating that many of the M81 group’s satellites were recently accreted as a group and have not yet had time to phase-mix (as discussed by, e.g., D’Souza & Bell 2021). This work adds further evidence that satellites of satellites are important in building up the satellite populations of Milky Way–mass galaxies (see also, e.g., Li & Helmi 2008, Deason et al. 2015, Patel et al. 2020, D’Souza & Bell 2021).
In this picture, one would expect most of the recently arrived satellites to be associated with M82, which is clearly undergoing tidal disruption (Okamoto et al., 2015; Smercina et al., 2020) and has a stellar mass 10 larger than the next most massive satellite, NGC 3077 (Smercina et al., 2020). M82 should then have had a more massive DM halo, and therefore have delivered a substantial number of satellites (Smercina et al., 2022). Yet the satellites are spatially clustered around NGC 3077. It is possible that these satellites were instead delivered by NGC 3077, and for some reason M82 had few satellites. Yet it is also possible that these satellites and NGC 3077 itself were M82’s satellites. Satellites are stripped relatively early as a group falls into a larger potential well, while M82, due to its much larger mass, may be subject to much stronger dynamical friction (D’Souza & Bell, 2021). It is therefore possible that these satellites were in fact previously all part of M82’s group but were ‘left behind’ by M82, as it loses energy through dynamical friction as it merges with M81.
6 Conclusions
In this letter, we report the discovery using resolved-star techniques of one new M81 group UFD (similar to Tucana B) and present five lower surface brightness candidate UFDs (similar to Canes Venatici I, Hercules, and Boötes I), with absolute magnitudes reaching toward . While these candidates, with typically between 28 and 29.5 mag arcsec-2, require HST or JWST follow-up for confirmation, blank-field searches with comparable areas yield candidate, and the properties of these candidates overlap with those of Local Group UFDs, suggesting that most or all of the candidates should be real. The candidates are not distributed uniformly but instead cluster strongly around NGC 3077 — the third-brightest galaxy in the central parts of the M81 group — at the 99.9% significance level. This underlines the importance of group accretion in shaping the satellite populations of nearby galaxies. However, it also raises a puzzle of why M81 and M82 — both more massive in stars, and likely more massive in DM — do not host more satellites; this puzzle remains unresolved.
References
- Agertz et al. (2020) Agertz, O., Pontzen, A., Read, J. I., et al. 2020, MNRAS, 491, 1656, doi: 10.1093/mnras/stz3053
- Aihara et al. (2022) Aihara, H., AlSayyad, Y., Ando, M., et al. 2022, PASJ, 74, 247, doi: 10.1093/pasj/psab122
- Astropy Collaboration et al. (2018) Astropy Collaboration, Price-Whelan, A. M., Sipőcz, B. M., et al. 2018, AJ, 156, 123, doi: 10.3847/1538-3881/aabc4f
- Bell et al. (2017) Bell, E. F., Monachesi, A., Harmsen, B., et al. 2017, ApJ, 837, L8, doi: 10.3847/2041-8213/aa6158
- Belokurov et al. (2007) Belokurov, V., Zucker, D. B., Evans, N. W., et al. 2007, ApJ, 654, 897, doi: 10.1086/509718
- Bosch et al. (2018) Bosch, J., Armstrong, R., Bickerton, S., et al. 2018, PASJ, 70, S5, doi: 10.1093/pasj/psx080
- Bose et al. (2020) Bose, S., Deason, A. J., Belokurov, V., & Frenk, C. S. 2020, MNRAS, 495, 743, doi: 10.1093/mnras/staa1199
- Bressan et al. (2012) Bressan, A., Marigo, P., Girardi, L., et al. 2012, MNRAS, 427, 127, doi: 10.1111/j.1365-2966.2012.21948.x
- Brown et al. (2014) Brown, T. M., Tumlinson, J., Geha, M., et al. 2014, ApJ, 796, 91, doi: 10.1088/0004-637X/796/2/91
- Bullock & Boylan-Kolchin (2017) Bullock, J. S., & Boylan-Kolchin, M. 2017, ARA&A, 55, 343, doi: 10.1146/annurev-astro-091916-055313
- Carlsten et al. (2022) Carlsten, S. G., Greene, J. E., Beaton, R. L., Danieli, S., & Greco, J. P. 2022, ApJ, 933, 47, doi: 10.3847/1538-4357/ac6fd7
- Carlsten et al. (2021) Carlsten, S. G., Greene, J. E., Peter, A. H. G., Beaton, R. L., & Greco, J. P. 2021, ApJ, 908, 109, doi: 10.3847/1538-4357/abd039
- Chiboucas et al. (2013) Chiboucas, K., Jacobs, B. A., Tully, R. B., & Karachentsev, I. D. 2013, AJ, 146, 126, doi: 10.1088/0004-6256/146/5/126
- Collins et al. (2022) Collins, M. L. M., Charles, E. J. E., Martínez-Delgado, D., et al. 2022, MNRAS, 515, L72, doi: 10.1093/mnrasl/slac063
- Deason et al. (2015) Deason, A. J., Wetzel, A. R., Garrison-Kimmel, S., & Belokurov, V. 2015, MNRAS, 453, 3568, doi: 10.1093/mnras/stv1939
- Drlica-Wagner et al. (2020) Drlica-Wagner, A., Bechtol, K., Mau, S., et al. 2020, ApJ, 893, 47, doi: 10.3847/1538-4357/ab7eb9
- D’Souza & Bell (2021) D’Souza, R., & Bell, E. F. 2021, MNRAS, 504, 5270, doi: 10.1093/mnras/stab1283
- Fitts et al. (2017) Fitts, A., Boylan-Kolchin, M., Elbert, O. D., et al. 2017, MNRAS, 471, 3547, doi: 10.1093/mnras/stx1757
- Foreman-Mackey et al. (2013) Foreman-Mackey, D., Hogg, D. W., Lang, D., & Goodman, J. 2013, PASP, 125, 306, doi: 10.1086/670067
- Hirata & Seljak (2003) Hirata, C., & Seljak, U. 2003, MNRAS, 343, 459, doi: 10.1046/j.1365-8711.2003.06683.x
- Hunter (2007) Hunter, J. D. 2007, Computing in Science and Engineering, 9, 90, doi: 10.1109/MCSE.2007.55
- Ibata et al. (2013) Ibata, R. A., Lewis, G. F., Conn, A. R., et al. 2013, Nature, 493, 62, doi: 10.1038/nature11717
- Jiang & van den Bosch (2015) Jiang, F., & van den Bosch, F. C. 2015, MNRAS, 453, 3575, doi: 10.1093/mnras/stv1871
- Koposov et al. (2015) Koposov, S. E., Belokurov, V., Torrealba, G., & Evans, N. W. 2015, ApJ, 805, 130, doi: 10.1088/0004-637X/805/2/130
- Li & Helmi (2008) Li, Y.-S., & Helmi, A. 2008, MNRAS, 385, 1365, doi: 10.1111/j.1365-2966.2008.12854.x
- Magnier et al. (2013) Magnier, E. A., Schlafly, E., Finkbeiner, D., et al. 2013, ApJS, 205, 20, doi: 10.1088/0067-0049/205/2/20
- Mandelbaum et al. (2005) Mandelbaum, R., Hirata, C. M., Seljak, U., et al. 2005, MNRAS, 361, 1287, doi: 10.1111/j.1365-2966.2005.09282.x
- Martin et al. (2008) Martin, N. F., de Jong, J. T. A., & Rix, H.-W. 2008, ApJ, 684, 1075, doi: 10.1086/590336
- Martin et al. (2013) Martin, N. F., Ibata, R. A., McConnachie, A. W., et al. 2013, ApJ, 776, 80, doi: 10.1088/0004-637X/776/2/80
- McConnachie et al. (2018) McConnachie, A. W., Ibata, R., Martin, N., et al. 2018, ApJ, 868, 55, doi: 10.3847/1538-4357/aae8e7
- Miyazaki et al. (2018) Miyazaki, S., Komiyama, Y., Kawanomoto, S., et al. 2018, PASJ, 70, S1, doi: 10.1093/pasj/psx063
- Munshi et al. (2019) Munshi, F., Brooks, A. M., Christensen, C., et al. 2019, ApJ, 874, 40, doi: 10.3847/1538-4357/ab0085
- Mutlu-Pakdil et al. (2021) Mutlu-Pakdil, B., Sand, D. J., Crnojević, D., et al. 2021, ApJ, 918, 88, doi: 10.3847/1538-4357/ac0db8
- Mutlu-Pakdil et al. (2022) —. 2022, ApJ, 926, 77, doi: 10.3847/1538-4357/ac4418
- Nadler et al. (2021) Nadler, E. O., Drlica-Wagner, A., Bechtol, K., et al. 2021, Phys. Rev. Lett., 126, 091101, doi: 10.1103/PhysRevLett.126.091101
- Okamoto et al. (2015) Okamoto, S., Arimoto, N., Ferguson, A. M. N., et al. 2015, ApJ, 809, L1, doi: 10.1088/2041-8205/809/1/L1
- Okamoto et al. (2019) —. 2019, ApJ, 884, 128, doi: 10.3847/1538-4357/ab44a7
- Patel et al. (2020) Patel, E., Kallivayalil, N., Garavito-Camargo, N., et al. 2020, ApJ, 893, 121, doi: 10.3847/1538-4357/ab7b75
- Pawlowski et al. (2012) Pawlowski, M. S., Pflamm-Altenburg, J., & Kroupa, P. 2012, MNRAS, 423, 1109, doi: 10.1111/j.1365-2966.2012.20937.x
- Pedregosa et al. (2011) Pedregosa, F., Varoquaux, G., Gramfort, A., et al. 2011, Journal of Machine Learning Research, 12, 2825
- Radburn-Smith et al. (2011) Radburn-Smith, D. J., de Jong, R. S., Seth, A. C., et al. 2011, ApJS, 195, 18, doi: 10.1088/0067-0049/195/2/18
- Samuel et al. (2020) Samuel, J., Wetzel, A., Tollerud, E., et al. 2020, MNRAS, 491, 1471, doi: 10.1093/mnras/stz3054
- Sand et al. (2022) Sand, D. J., Mutlu-Pakdil, B., Jones, M. G., et al. 2022, ApJ, 935, L17, doi: 10.3847/2041-8213/ac85ee
- Savino et al. (2022) Savino, A., Weisz, D. R., Skillman, E. D., et al. 2022, arXiv e-prints, arXiv:2206.02801. https://arxiv.org/abs/2206.02801
- Schlafly & Finkbeiner (2011) Schlafly, E. F., & Finkbeiner, D. P. 2011, ApJ, 737, 103, doi: 10.1088/0004-637X/737/2/103
- Schlegel et al. (1998) Schlegel, D. J., Finkbeiner, D. P., & Davis, M. 1998, ApJ, 500, 525, doi: 10.1086/305772
- Simon (2019) Simon, J. D. 2019, ARA&A, 57, 375, doi: 10.1146/annurev-astro-091918-104453
- Smercina et al. (2018) Smercina, A., Bell, E. F., Price, P. A., et al. 2018, ApJ, 863, 152, doi: 10.3847/1538-4357/aad2d6
- Smercina et al. (2022) Smercina, A., Bell, E. F., Samuel, J., & D’Souza, R. 2022, ApJ, 930, 69, doi: 10.3847/1538-4357/ac5d56
- Smercina et al. (2017) Smercina, A., Bell, E. F., Slater, C. T., et al. 2017, ApJ, 843, L6, doi: 10.3847/2041-8213/aa78fa
- Smercina et al. (2020) Smercina, A., Bell, E. F., Price, P. A., et al. 2020, ApJ, 905, 60, doi: 10.3847/1538-4357/abc485
- Toloba et al. (2016) Toloba, E., Sand, D., Guhathakurta, P., et al. 2016, ApJ, 830, L21, doi: 10.3847/2041-8205/830/1/L21
- Van Der Walt et al. (2011) Van Der Walt, S., Colbert, S. C., & Varoquaux, G. 2011, Computing in Science & Engineering, 13, 22
- Virtanen et al. (2020) Virtanen, P., Gommers, R., Oliphant, T. E., et al. 2020, Nature Methods, 17, 261, doi: 10.1038/s41592-019-0686-2
- Weisz et al. (2019) Weisz, D. R., Martin, N. F., Dolphin, A. E., et al. 2019, ApJ, 885, L8, doi: 10.3847/2041-8213/ab4b52
- Yun et al. (1994) Yun, M. S., Ho, P. T. P., & Lo, K. Y. 1994, Nature, 372, 530, doi: 10.1038/372530a0