aUniversity of Kentucky, Lexington, Kentucky, USA; bQingdao University, Qingdao, Shandong, China
Alcohol Intake Differentiates AD and LATE: A Telltale Lifestyle from Two Large-Scale Datasets
Abstract
Alzheimer’s disease (AD), as a progressive brain disease, affects cognition, memory, and behavior. Similarly, limbic-predominant age-related TDP-43 encephalopathy (LATE) is a recently defined common neurodegenerative disease that mimics the clinical symptoms of AD. At present, the risk factors implicated in LATE and those distinguishing LATE from AD are largely unknown. We leveraged an integrated feature selection-based algorithmic approach, to identify important factors differentiating subjects with LATE and/or AD from Control on significantly imbalanced data. We analyzed two datasets ROSMAP and NACC and discovered that alcohol consumption was a top lifestyle and environmental factor linked with LATE and AD and their associations were differential. In particular, we identified a specific subpopulation consisting of APOE e4 carriers. We found that, for this subpopulation, light-to-moderate alcohol intake was a protective factor against both AD and LATE, but its protective role against AD appeared stronger than LATE. The codes for our algorithms are available at https://github.com/xinxingwu-uk/PFV.
Introduction
Dementia is a heterogeneous group of disorders with various types and causes 1, 2. Alzheimer’s disease (AD) is its leading form that develops from multifactorial genetic, environmental, and epigenetic causes. More than 35 million people were living with AD and the worldwide societal cost of AD reached $1 trillion in 2018, with 115.5 million people projected to live with it by 2050 3, 4, 5. As an AD-mimic, limbic-predominant age-related TDP-43 encephalopathy (LATE) is a recently-defined type of dementia, with 20%-50% of people aged 80 and above having it 6. Meanwhile, existing studies have indicated that LATE may appear alone or as a comorbidity with AD 7, 8. AD usually has a slow onset, and the cognitive deterioration of LATE is even slower than AD; yet, LATE-AD comorbidity generally causes a more rapid clinical decline than either of them individually 9. Their pathological relationship is currently elusive.
Environmental and lifestyle factors play crucial roles in AD and LATE. Managing cardiovascular risk factors, maintaining an active lifestyle (e.g., regular physical, mental, and social activities), and following the Mediterranean diet are associated with a reduced risk for AD or a lower rate of cognitive decline 10. While the interplay of environmental factors with AD has been investigated 11, 12, 13, 14, the findings are inconsistent. No effective imaging, fluid, or other types of biomarkers diagnosing LATE or differentiating it from AD is known in a clinical context (in life), nor what lifestyle or environmental factors influence them specifically. Studies on what and how lifestyle and environmental factors are implicated in LATE and AD specifically are urgently needed to help advance our understanding of these types of dementia and provide an accessible target to modify. Considering the size of affected patients and our increasingly aging society, the potential impact of such studies on public health is high.
To find key environmental and lifestyle factors that are associated with AD and LATE specifically, we developed an innovative integrated feature selection-based approach, consisting of Preprocessing, Feature selection, and Validation, abbreviated as PFV. Then, we performed it on two large-scale cohorts, the Religious Orders Study and Memory and Aging Project (ROSMAP) and the National Alzheimer’s Coordinating Center (NACC). Our results revealed that alcohol consumption was a top lifestyle factor linked with LATE and AD and their associations were differential.
In the literature considerable research on the role alcohol consumption plays in cognitive functions and dementia was conducted 15, 16, 17; nonetheless, the findings were mixed or even contradicting. One major limitation of existing studies is that heterogeneity in dementia subtypes was not adequately considered. Moreover, confounders were also insufficiently discerned or controlled. Thus, with the findings by using our PFV, there is an unmet need to study the specific relationship of alcohol consumption with LATE and AD, adjusted for potential confounders.
To address these limitations, we considered AD and LATE specifically and stratified the cohort according to sex, age, and race. We identified a specific subpopulation comprising APOE e4 carriers. For this subpopulation, we found that light-to-moderate alcohol intake was a protective factor against AD and LATE, but its protective role against AD was stronger than LATE.
Materials and Methods
Machine Learning-Based Analysis
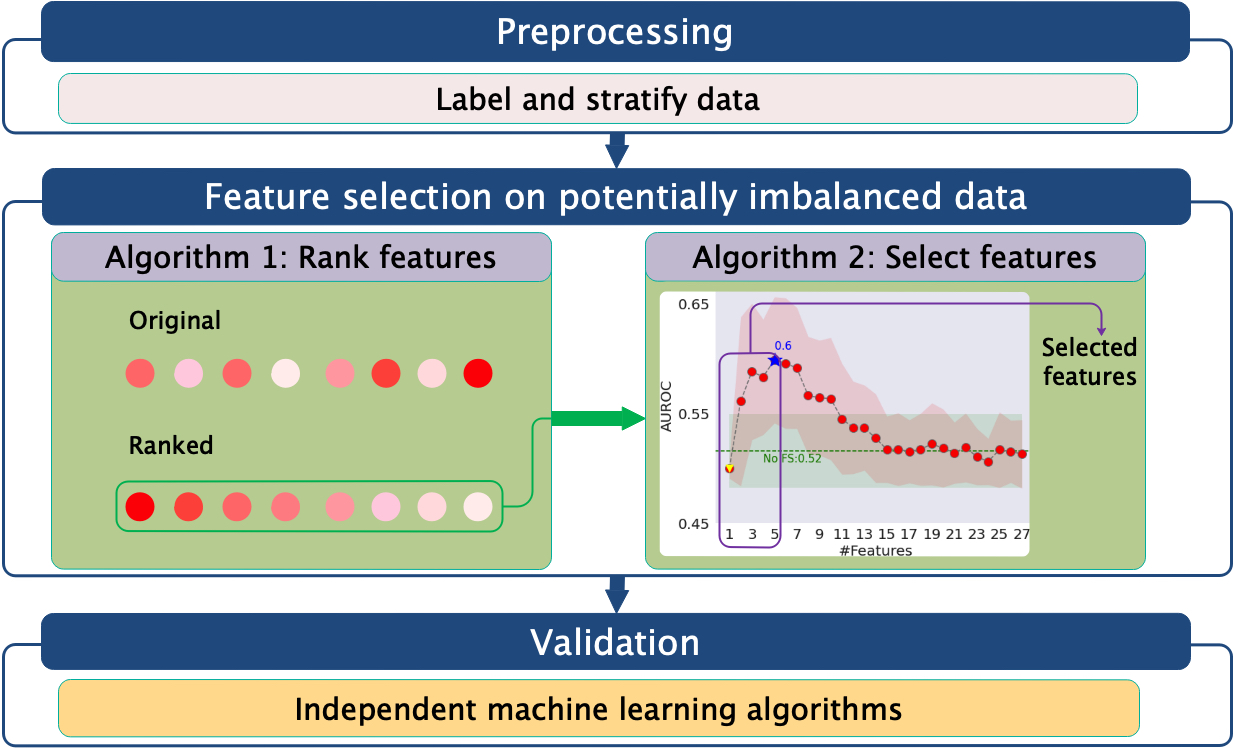
The complexity of lifestyle and environmental factors for neurodegeneration and the heterogeneity across subjects are high, which present challenges to the development of early diagnosis tools and effective strategies for preventing dementia 18. To meet these challenges, this study leveraged machine learning (ML) to identify and rank disease-related environmental and lifestyle factors with large-scale, potentially imbalanced data. Using feature selection (FS) algorithms, we developed an integrated framework, PFV, for ML-based discovery and multi-faceted validation. As summarized in Figure 1, the steps of PFV include: First, labeling samples and stratifying them based on sex, race, and age; next, performing FS-guided ML analysis to pinpoint a proper group of risk factors from each sub-cohort; finally, verifying the selected risk factors through various independent ML algorithms. More concretely, we explain PFV as follows:
Step 1. Preprocessing of samples by labeling the examples and deleting rows with missing values. We adopted three existing clinical or neuropathological diagnostic criteria to categorize whether a subject had AD and/or LATE: 1) Braak score 19, 20; 2) CERAD score 20, 21; 3)TDP-43 stage 22. We followed the detailed rules in 23 for categorization. Taking ROSMAP as an example, we used the first two scores for annotating subjects with AD and the third measure for LATE. Also, we stratified the cohort data according to sex, race, and age.
![[Uncaptioned image]](/html/2209.05438/assets/figures/Alg1.png)
Step 2. FS-guided identification of groups of risk factors via Algorithms 1 and 2. This step represents the core discovery phase of our framework. Algorithm 1 was used for ranking all available variables by performing age-, sex-, and race-stratified multivariate risk factor analysis. The ROSMAP data used in our analysis was substantially imbalanced in terms of the sample sizes of controls and cases in many strata. In the literature, ML algorithms were developed to meet the challenges of imbalanced data for classification 24, 25 and for FS 23. However, this ML-based study needed to consider selecting features to account for feature representativeness and inter-correlations and classifying examples jointly. To this end, we developed the two new algorithms. In this paper, the terms of feature, variable, and factor are used exchangeably. If a part of the samples from the majority class(es) had been used, it would have under-utilized the clinically valuable data and led to misleading importance for the variables. On the other hand, as pointed out in 23, if the majority class(es) had been bootstrapped many times while the remaining minority class(es) had been kept the same, then it would have hardly ensured a sufficient number of used sample subsets for the feature ranking model and, consequently, it would have led to degraded learning performance and made the selected features unstable. To overcome the challenges of imbalanced data, we developed Algorithm 1: First, at each iteration, we generated a new subset by concatenating the minority samples with the under-sampled majority samples, and we applied the FS algorithm to this subset to score the features; next, we averaged the scores obtained from all implemented iterations to get the ranking of all the features. Subsequently, we compared the top features of the current iteration with the top features of the last iteration. If the top features were unchanged for a predefined number of times, we stopped the iteration. Finally, we aggregated the feature importance calculated from all iterations to identify the most informative features in their ability to differentiate distinct classes. In this way, the algorithm can automatically determine the numbers of subsets and iterations to sufficiently analyze and discriminate the imbalanced samples in different classes.
![[Uncaptioned image]](/html/2209.05438/assets/figures/Alg2.png)
For selecting important factors from the ranked variables, we further developed Algorithm 2 to account for the representativeness and correlations between variables inspired by 26. First, for the ranked variables by Algorithm 1, we used Algorithm 2 to iteratively construct subsets of risk factors according to the importance of all variables in descending order. Then, we divided the samples with the constructed subset of variables into training and test data, and we trained a classifier based on the training data and tested it to compute the area under the receiver operating characteristic curve (AUROC) score on the test data. Finally, we obtained AUROC scores, and the one with the maximum AUROC score gave rise to the selected factors. Here, denotes the number of features.
To guarantee the stability 27 of the identified factors, we adopted multiple random seeds for computing AUROC on each subset. Furthermore, we estimated mutual information 28 for scoring factors in Algorithm 1 and used the extra tree classifier 29 for selecting factors in Algorithm 2 by the corresponding library functions in Scikit-learn 30.
Step 3. Validation of selected factors. To assess the efficacy of the identified sets of factors more sufficiently, we adopted further validation by using different independent downstream classifiers. We checked the classification performance with the identified sets of factors using multiple downstream ML algorithms, which were independent of the extra tree classifier in terms of their formulation and property.
In addition, statistical analyses were performed using Python version 3.7.8. Only subjects with complete data were included in the analysis of each specific factor. In ROSMAP, the analysis of variance (ANOVA) test was used to compare alcohol-related variables between groups. The AUROC for accuracy at an optimal cutoff value (i.e., the number of selected features corresponding to the best AUROC) was used to determine factor performance. In NACC, the chi-square test was used to compare discrete variables, including APOE e4 carrier and alcohol-related variables between groups. Logistic regression analysis tested the associations between alcohol intake-related indexes, APOE e4 carrier, and AD/LATE. -value was considered to indicate statistical significance.
Results
Dataset Used
Data used in this study were ROSMAP and NACC. 222ROSMAP was obtained via the link https://www.synapse.org/#!Synapse:syn3219045. NACC was requested via the link https://naccdata.org/ In ROSMAP, the corresponding clinical indexes and pathological annotations were obtained from the RADC research resource sharing hub. Based on the rules for categorizing 23, label association was performed on the data for 4 classes: LATE, AD, comorbid LATE and AD (denoted by LATE+AD), and Control. After preprocessing, such as deleting rows with missing values and filtering the features in ROSMAP, we finally obtained 508 samples, each with 33 features including ID and label. Concretely, the preprocessed data contained 47 samples for LATE+AD, 116 samples for pure LATE, 56 samples for pure AD, and 289 samples for Control. In NACC, after filtering alcohol intake-related indexes including ALCDEM and ALCDEMIF, we got 9,256 samples. Specifically, they included 2,117 samples for LATE+AD, 965 samples for pure LATE, 2,242 samples for pure AD, and 3,932 samples for Control.
| Name | Symbol | Description |
| Lifetime daily alcohol intake | ldaibl | The amount of alcoholic drinks consumed per day during the period the participants drank the |
| most in their lifetime | ||
| Grams of alcohol used per day | alcoholgbl | How much alcohol a participant consumed in the past 12 month |
| Cognitive resources at 40 | cogresage40 | The presence of materials that support cognitive activity in the home at the age of 40 |
| Parental education level | pareduc | Maternal education and paternal education levels |
| Years of education | educ | The number of years of regular school |
| Young adult | yaadultcogactfreq | Frequency of participation in cognitively stimulating activity as a young adult |
| Mobility disability | rosbsum | Ability to do 3 activities: doing heavy work around the house, walking up and down stairs, |
| and walking half a mile without help | ||
| Lifetime (total) | lifetimecogactfreqbl | Frequency of participation in cognitively stimulating activity in lifetime |
| Instrumental activities of daily living | iadlsum | Disability using a sum of 8 items adapted from the Duke Older Americans Resources and |
| Services project | ||
| Basic activities of daily living | katzsum | Measuring six basic physical abilities: walking across a small room, bathing, dressing, eating, |
| getting from bed to chair, and toileting | ||
| Medical conditions | medconsumbl | A composite measure of 7 medical conditions |
Analysis of Risk Factors in ROSMAP
We performed sex-, race-, and age-stratified ML and statistical analyses in ROSMAP. The details of several related indexes we would use later are listed in Table 1, and the resulting samples and subpopulation groups are given in Table 2. Specifically, Algorithm 1 ranked the features, and Algorithm 2 iteratively performed classification on the ranked features and selected the most informative ones as risk factors. For the parameters in Algorithms 1 and 2, we used , , , and . We performed the ML analyses in a similar way for different binary classifications and subpopulations, and we obtained the following results:
For LATE vs. AD, we identified 2 risk factors for the whole cohort, 1 risk factor for the Male subpopulation, 3 risk factors for the Female subpopulation, 2 risk factors for the White subpopulation, and 3 risk factors for the subpopulation. Using these identified risk factors, the classification accuracy for the whole cohort and the subpopulations of Male, Female, White, and improved by about 7%, 26%, 7%, 6%, and 9%, respectively, compared to using all the factors.
For LATE vs. Control, we identified 2 risk factors for the whole cohort, 2 risk factors for the Male subpopulation, 2 risk factors for the Female subpopulation, 7 risk factors for the White subpopulation, 6 risk factors for subpopulation, and 2 risk factors for subpopulation. Using these identified risk factors, the classification accuracy for the whole cohort and the subpopulations of Male, Female, White, , and improved by about 1%, 9%, 4%, 4%, 3%, and 8%, respectively, compared to using all the factors.
For AD vs. Control, we identified 2 risk factors for the whole cohort, 1 risk factor for the Male subpopulation, 2 risk factors for the Female subpopulation, 1 risk factor for the White subpopulation, and 1 risk factor for the subpopulation. Using these identified factors, the classification accuracy for the whole cohort and the subpopulations of Male, Female, White, and improved by about 5%, 9%, 7%, 5%, and 9%, respectively, compared to using all the factors.
For LATE+AD vs. LATE, we identified 3 risk factors for the whole cohort, 5 risk factors for the Female subpopulation, 9 risk factors for the White subpopulation, and 3 risk factors for the subpopulation. Using these identified factors improved the classification accuracy for the whole cohort and the subpopulations of Female, White, and by about 8%, 7%, 3%, and 8%, respectively, compared to using all the factors.
| Classes | Subpopulation | Class 1 | Class 2 | Adequacy |
|---|---|---|---|---|
| LATE (Class 1) | All | 116 | 56 | ✓ |
| vs. | Male | 33 | 15 | ✓ |
| AD (Class 2) | Female | 83 | 41 | ✓ |
| Black | 7 | 3 | ✗ | |
| White | 109 | 53 | ✓ | |
| 16 | 7 | ✗ | ||
| 100 | 49 | ✓ | ||
| LATE+AD (Class 1) | All | 47 | 56 | ✓ |
| vs. | Male | 14 | 15 | ✗ |
| AD (Class 2) | Female | 33 | 41 | ✓ |
| Black | 2 | 3 | ✗ | |
| White | 45 | 53 | ✓ | |
| 2 | 7 | ✗ | ||
| 45 | 49 | ✓ | ||
| LATE+AD (Class 1) | All | 47 | 116 | ✓ |
| vs. | Male | 14 | 33 | ✗ |
| LATE (Class 2) | Female | 33 | 83 | ✓ |
| Black | 2 | 7 | ✗ | |
| White | 45 | 109 | ✓ | |
| 2 | 16 | ✗ | ||
| 45 | 100 | ✓ | ||
| LATE+AD (Class 1) | All | 47 | 289 | ✓ |
| vs. | Male | 14 | 117 | ✓ |
| Control (Class 2) | Female | 33 | 172 | ✓ |
| Black | 2 | 21 | ✗ | |
| White | 45 | 267 | ✓ | |
| 2 | 88 | ✗ | ||
| 45 | 201 | ✓ | ||
| LATE (Class 1) | All | 116 | 289 | ✓ |
| vs. | Male | 33 | 117 | ✓ |
| Control (Class 2) | Female | 83 | 172 | ✓ |
| Black | 7 | 21 | ✗ | |
| White | 109 | 267 | ✓ | |
| 16 | 88 | ✓ | ||
| 100 | 201 | ✓ | ||
| AD (Class 1) | All | 56 | 289 | ✓ |
| vs. | Male | 15 | 117 | ✓ |
| Control (Class 2) | Female | 41 | 172 | ✓ |
| Black | 3 | 21 | ✗ | |
| White | 53 | 267 | ✓ | |
| 7 | 88 | ✗ | ||
| 49 | 201 | ✓ |
For LATE+AD vs. AD, we identified 1 risk factor for the whole cohort, 1 risk factor for the Female subpopulation, 1 risk factor for the White subpopulation, and 3 risk factors for the subpopulation. Using these identified factors improved the classification accuracy for the whole cohort and the subpopulations of Female, White, and by about 12%, 9%, 8%, and 11%, respectively, compared to using all the factors.
For LATE+AD vs. Control, we identified 5 risk factors for the whole cohort, 3 risk factors for the Male subpopulation, 17 risk factors for the Female subpopulation, 4 risk factors for the White subpopulation, and 2 risk factors for the subpopulation. Using these identified factors improved the classification accuracy for the whole cohort and the subpopulations of Male, Female, White, and by about 8%, 16%, 1%, 9%, and 6%, respectively, compared to using all the factors.
Optimal AUROC and Competitive Classification Performance in ROSMAP
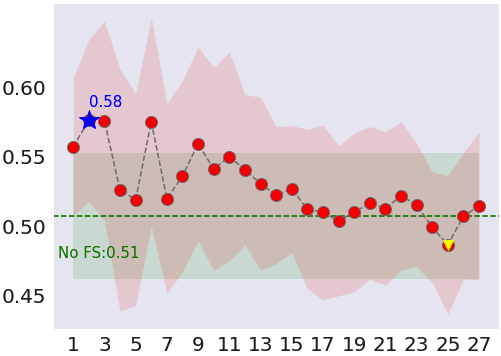
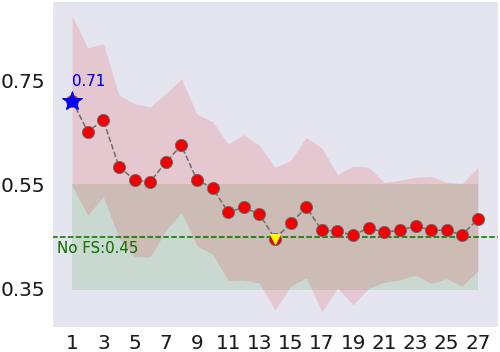
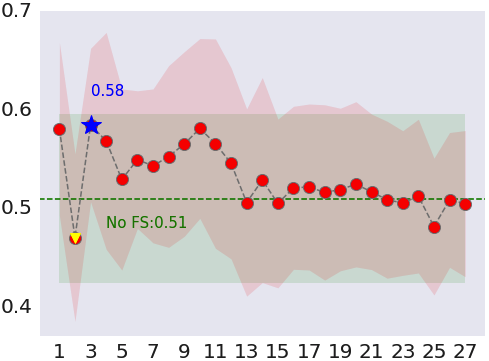
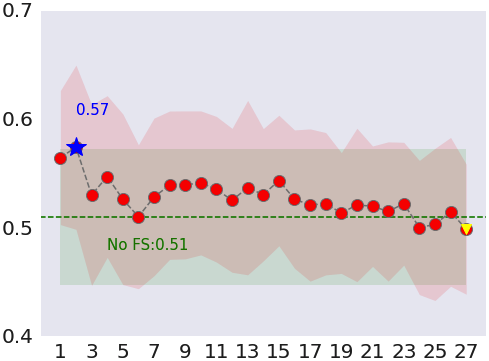
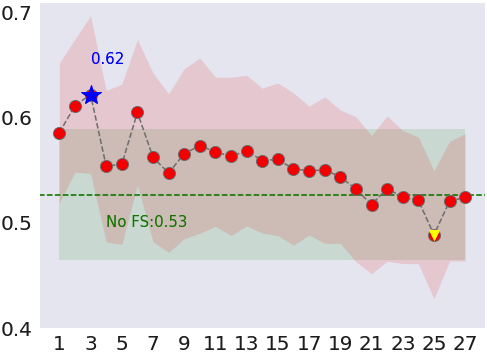
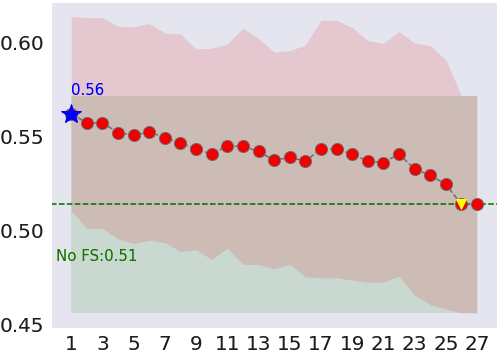
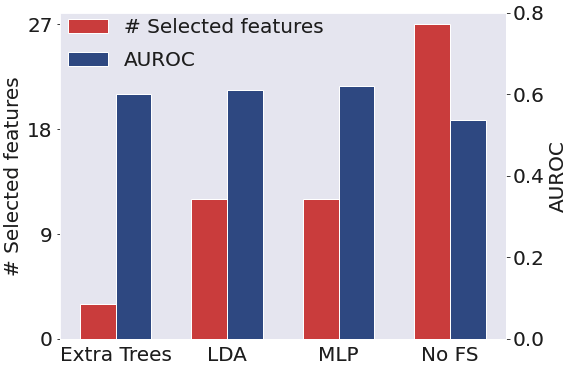
Taking LATE vs. AD as an example, we show the identified results in Figure 2 and Table 3 (L: LATE, A: AD, and C: Control), respectively. In Figure 2, it is observed that, for most subpopulations, the trained classification model achieved the highest accuracy with the first one or two features. On the other hand, with more features, the classification accuracy typically decreased. Hence, these results indicate that the identified groups of risk factors were significant in that they achieved improved and competitive classification performance when compared with using all factors (i.e., no FS).
| Subpopulation | Ranked factors | Classification accuracy |
| (%, FS vs. No FS) | ||
| Whole | 1.ldaibl | 58 (No FS: 51) |
| 2.alcoholgbl | ||
| Male | 1.ldaibl | 71 (No FS: 45) |
| Female | 1.cogresage40 | 58 (No FS: 51) |
| 2.pareduc | ||
| 3.ldaibl | ||
| White | 1.ldaibl | 57 (No FS: 51) |
| 2.alcoholgbl | ||
| 1.ldaibl | 62 (No FS: 53) | |
| 2.alcoholgbl | ||
| 3.educ | ||
| Average | 61.2 (No FS: 50.2) | |
Validation with Independent Downstream ML Models in ROSMAP
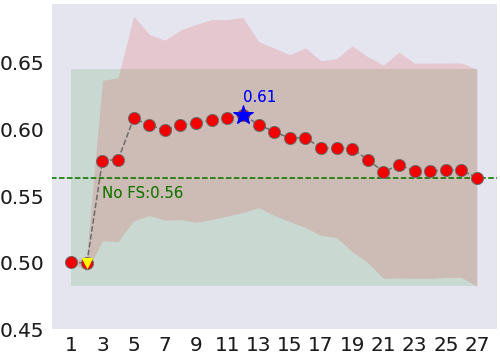
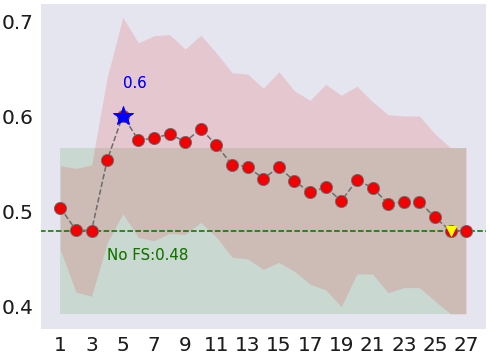
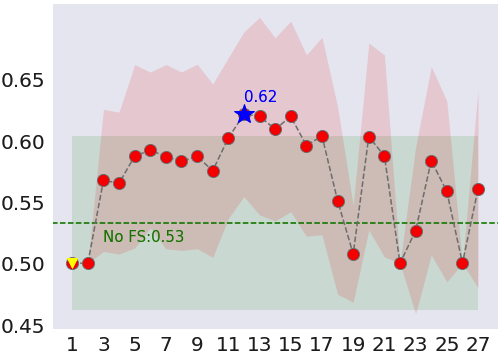
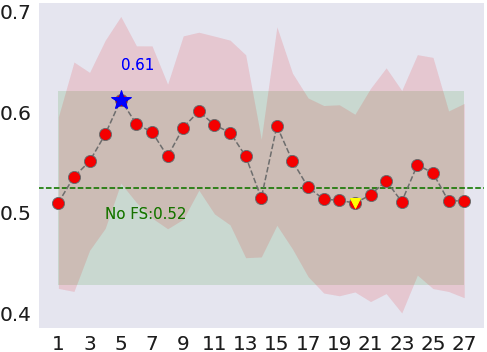
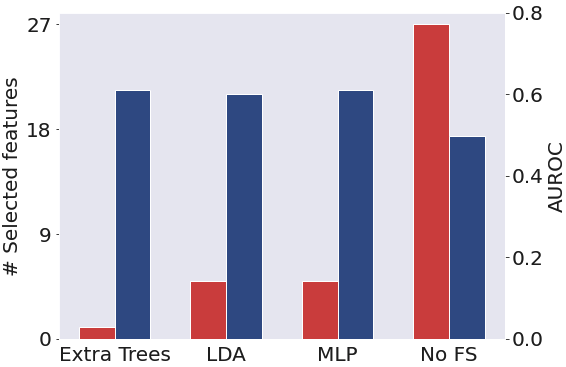
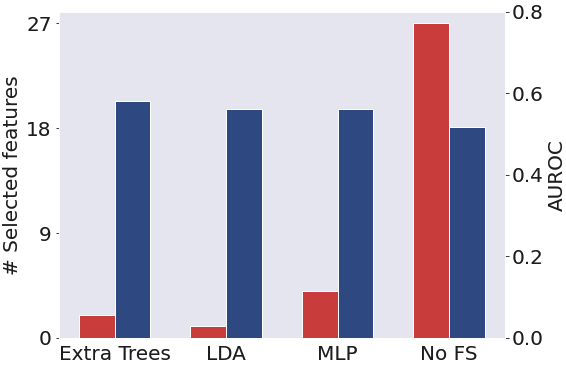
To assess the efficacy of identified risk factors, we replaced the extra tree classier in Algorithm 2 with different ML models. We trained and tested the linear discriminant analysis (LDA) and multilayer perceptron (MLP) methods on the ranked features. The obtained results are summarized in Figure 3. All these ML models generally achieved the highest accuracy with the top-ranked features, being at least about 7% more accurate on average than when all factors were used. These improved testing AUROCs on selected factors with independent downstream ML models confirmed the effectiveness of our approach and the identified top factors.
Identification of Risk Factors in ROSMAP
After analyzing different binary classifications and subpopulations, the identified top factors that could serve as signature patterns were as follows:
LATE vs. AD: ldaibl was the common risk factor for the whole cohort and the subpopulations of Male, Female, White, and ; Notably, it was the single most important factor for the Male subpopulation to differentiate LATE vs. AD, among 27 factors (See Table 3). Also, alcoholgbl was the common risk factor for the whole cohort and the subpopulations of White and .
LATE vs. Control: ldaibl was the common risk factor for the whole cohort and the subpopulations of Male, White, and ; cogresage40 was the common risk factor for the whole cohort and the subpopulations of White and .
LATE+AD vs. LATE: ldaibl and yaadultcogactfreq were the common risk factors for the whole cohort and the subpopulations of Female, White, and ; rosbsum was the common risk factors for the whole cohort and the subpopulations of White and .
AD vs. Control: pareduc was the common risk factor for the whole cohort and the subpopulation of White; lifetime cogactfreqbl was the common risk factor for the whole cohort and the subpopulations of .
LATE+AD vs. Control: iadlsum was the common risk factor for the whole cohort and the subpopulations of Male, Female, White, and ; katzsum, rosbsum, and yaadultcogactfreq were the common risk factors for the whole cohort and the subpopulations of Female and White; katzsum was the common risk factor for the whole cohort and the subpopulations of Female, White, and ; medconsumbl was the common risk factor for the whole cohort and the subpopulations of Male and Female.
For LATE+AD vs. AD, alcoholgbl was the common risk factor for the subpopulations of All and ; katzsum was the common factor for the subpopulations of While and .
| Variable | L+A vs. L | L+A vs. A | L+A vs. C | L vs. A | L vs. C | A vs. C |
|---|---|---|---|---|---|---|
| ldaibl | 0.001 | 0.909 | 0.221 | 0.002 | 0.003 | 0.285 |
| alcoholgbl | 0.040 | 0.563 | 0.433 | 0.245 | 0.119 | 0.991 |
Differential Analysis of Alcohol-related Factors in ROSMAP
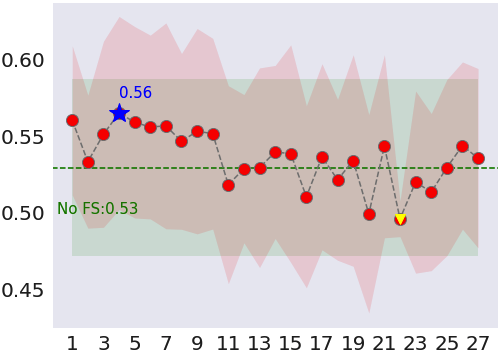
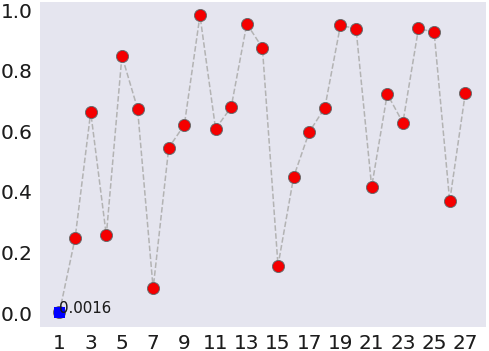
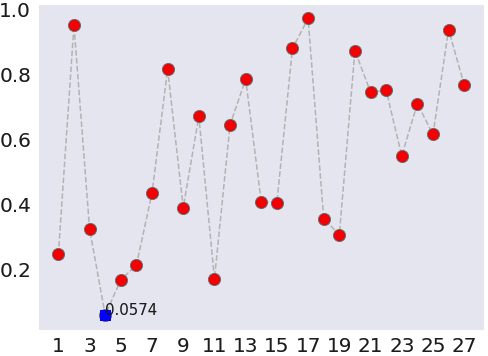
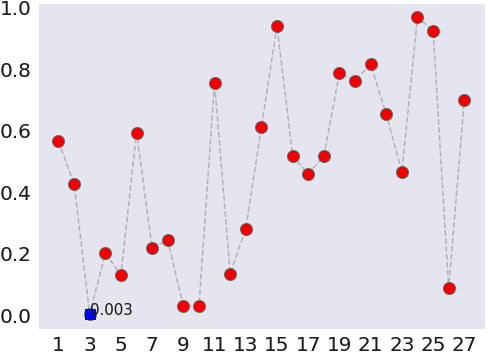
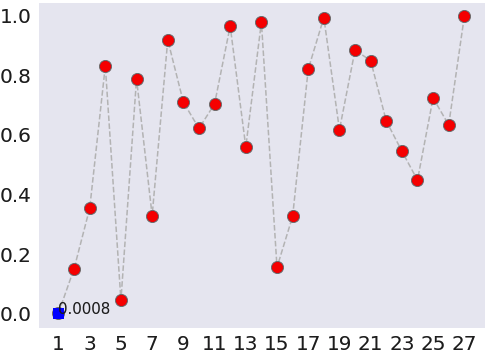
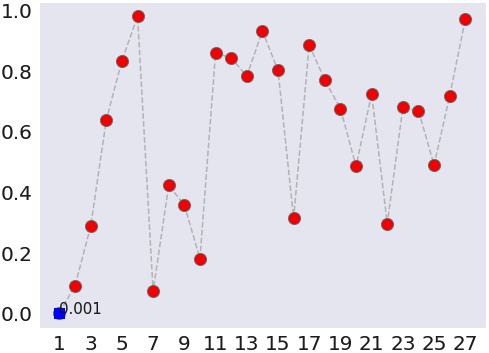
We obtained evidence that the alcohol-related variables had considerably varying, differential importance for the disease types on different strata when adjusting for potential confounders. To confirm the results uncovered by ML algorithms, we performed a differential analysis with one-way ANOVA for each of the two alcohol intake-related factors, ldaibl and alcoholgbl; see Table 4. Alcohol intake was found statistically significant for the scenarios LATE+AD vs. LATE, LATE vs. AD, and LATE vs. Control. Further, we illustrate -values that were obtained with one-way ANOVA for each of the features ranked by our ML-based algorithm for LATE and AD in Figure 4. The top features identified by our ML-based approach had (almost) the smallest -values; for all ranked features, their -values showed an increasing trend. It is worth noting that our ranking of the factors did not yield a strictly increasing curve in -value, because -values were calculated from linear correlations. In contrast, the ML-based algorithm that we used was the extra tree classifier, capable of capturing the more complex nonlinear relationship. We speculate that ML has the potential to more closely model the true relationship between the risk factors and the diseases, which is likely nonlinear due to the high complexity of different forms of dementia.
Overall, the lifestyle factors, such as alcohol intake, daily living activities, and cognitive activities, were top ranked for differentiating four classes: AD, LATE, LATE+AD, and Control. In particular, for alcohol intake, one factor, ldaibl, emerged as a top differentiating factor for the binary classifications of LATE vs. AD, LATE vs. Control, and LATE+AD vs. LATE, in many subpopulations. Besides, another factor, alcoholgbl, was also key to differentiating LATE vs. AD and LATE+AD vs. AD.
| Name | Description | Numerical value | # Samples |
|---|---|---|---|
| ALCDEM | Presumptive etiologic diagnosis of cognitive disorder – Cognitive impairment due to alcohol abuse | No (0, assumed assessed and found not present), Yes (1), and diagnosis of normal cognition (8) | LATE+AD: 2,117, LATE: 965, AD: 2,242, and Control: 3,932 |
| ALCDEMIF | Primary, contributing, or noncontributing cause of cognitive impairment – Alcohol abuse | Primary (1), Contributing (2), Non-contributing (3), Cognitively impaired but no diagnosis of impairment due to alcohol abuse (7), and diagnosis of normal cognition (8) | LATE+AD: 2,117, LATE: 965, AD: 2,242, and Control: 3,932 |
| Variable | L+A vs. L | L+A vs. A | L+A vs. C | L vs. A | L vs. C | A vs. C |
|---|---|---|---|---|---|---|
| ALCDEM | 2.16e-54 | 0.464 | 7.61e-97 | 2.86e-52 | 0.095 | 1.87e-97 |
| ALCDEMIF | 7.06e-70 | 0.297 | 5.06e-130 | 6.72e-70 | 0.037 | 2.77e-134 |
Confirmation of Findings in NACC
We considered two alcohol-related indexes, ALCDEM and ALCDEMIF, which were related to the diagnosis of cognitive impairment due to alcohol abuse in NACC; see Table 5. We performed cross-cohort independent validation of our findings for the two indexes by using the chi-square test. The results are summarized in Table 6. It is observed that the two variables were statistically significant for 4 binary classification scenarios: LATE+AD vs. LATE, LATE+AD vs. Control, LATE vs. AD, and AD vs. Control. However, they could not differentiate LATE+AD vs. AD; and ALCDEM could not work well for LATE vs. Control. The APOE e4 genetic variation was related to LATE and AD 17, 31, so we further examined the relationships of LATE and AD with ALCDEM/ALCDEMIF and APOE e4 carrier. First, by using the chi-square test, we analyzed the relationship between alcohol and APOE e4 carrier status (see Table 7). It is observed that there were statistically significant (-values0.05) associations between ALCDEM/ALCDEMIF and APOE e4 in all 12 scenarios except for ALCDEMIF in the scenario of LATE vs. Control.
| Variable | L+A vs. L | L+A vs. A | L+A vs. C | L vs. A | L vs. C | A vs. C |
|---|---|---|---|---|---|---|
| ALCDEM | 7.17e-14 | 7.06e-12 | 9.23e-35 | 8.39e-10 | 0.042 | 8.59e-31 |
| ALCDEMIF | 2.00e-17 | 5.40e-15 | 6.84e-41 | 9.23e-14 | 0.083 | 8.37e-38 |
Then, we studied the relations of alcohol intake and APOE e4 with AD and/or LATE. We used the logistic regression for each alcohol variable, adjusted for APOE e4 carrier status in Tables 8 and 9 (CI: confidence interval). As is well known, APOE e4 is a potent risk factor for AD, which was re-confirmed by our results. For instance, for AD vs. Control, with ALCDEM and ALCDEMIF as covariates, the odds ratios (OR) for APOE e4 carriers were 2.010 and 5.068, respectively, indicating that APOE e4 carriers were about 2 times and 5 times likely to be affected by AD compared to Control. Also, it is found that APOE e4 was more of a risk factor for AD than for LATE. For instance, for AD vs. LATE, with ALCDEM and ALCDEMIF as independent covariates, the OR were 4.998 and 3.556, respectively, indicating that APOE e4 carriers had a risk for AD about 5 times and 3.6 times that for LATE. In the scenario of LATE vs. LATE+AD, with ALCDEM and ALCDEMIF as independent covariates, the OR were 0.205 and 0.250, respectively, indicating that APOE e4 carriers were about 3.9 times and 3 times more susceptible to LATE+AD than to pure LATE.
| APOE (e4 carrier) and ALCDEM | |||||||||
| LLR -value | APOE | ALCDEM | |||||||
| OR | -value | Coef. | [97.5% CI] | OR | -value | Coef. | [97.5% CI] | ||
| L vs. L+A | 1.91e-90 | 0.205 | 0.001 | -1.587 | [-1.720,-1.454] | 1.177 | 0.001 | 0.163 | [0.135,0.191] |
| A vs. L+A | 1.000 | / | / | / | / | / | / | / | / |
| C vs. L+A | 3.57e-137 | 0.5154 | 0.001 | -0.6643 | [-0.758,-0.570] | 1.327 | 0.001 | 0.283 | [ 0.261,0.305] |
| A vs. L | 2.05e-73 | 4.998 | 0.001 | 1.609 | [1.477,1.741] | 0.865 | 0.001 | -0.146 | [-0.172,-0.119] |
| L vs. C | 1.000 | / | / | / | / | / | / | / | / |
| A vs. C | 1.01e-149 | 2.010 | 0.001 | 0.698 | [0.605,0.791] | 0.766 | 0.001 | -0.266 | [-0.287,-0.246] |
| APOE (e4 carrier) and ALCDEMIF | |||||||||
| LLR -value | APOE | ALCDEMIF | |||||||
| OR | -value | Coef. | [97.5% CI] | OR | -value | Coef. | [97.5% CI] | ||
| L vs. L+A | 6.41e-59 | 0.250 | 0.001 | -1.386 | [ -1.549,-1.222] | 0.997 | 0.675 | -0.003 | [-0.018,0.012] |
| A vs. L+A | 0.081 | 0.892 | 0.077 | -0.115 | [-0.242,0.012] | 1.021 | 0.004 | 0.021 | [0.007,0.035] |
| C vs. L+A | 8.28e-206 | 0.175 | 0.001 | -1.741 | [-1.861,-1.621] | 1.214 | 0.001 | 0.194 | [0.182,0.206] |
| A vs. L | 4.63e-49 | 3.556 | 0.001 | 1.269 | [1.107,1.430] | 1.025 | 0.001 | 0.024 | [0.010,0.039] |
| L vs. C | 9.61e-08 | 1.450 | 0.001 | 0.372 | [0.216, 0.528] | 0.823 | 0.001 | -0.195 | [-0.207,-0.183] |
| A vs. C | 3.44e-189 | 5.068 | 0.001 | 1.623 | [1.507,1.739] | 0.841 | 0.001 | -0.173 | [-0.184,-0.162] |
For the subjects in Control class in Tables 8 and 9, we first calculated the average value of ALCFREQ to be about 2.34. 333ALCFREQ denotes that, during the past three months, how often the subject had at least one drink of any alcoholic beverage: 0 is for less than once a month, 1 for about once a month, 2 for about once a week, 3 for few times a week, and 4 for daily or almost daily. Thus, we could observe significant protective roles of light-to-moderate alcohol intake against AD, LATE, or LATE+AD, adjusted for APOE e4. ALCDEM and ALCDEMIF showed significant (-value0.001) OR=0.766 and OR=0.841 in comparing AD vs. Control, and thus were associated with about 23% and 16% decrease in risk for AD, respectively, adjusted for APOE e4 carrier status. ALCDEM and ALCDEMIF showed significant (-value0.001) OR=1.327 and OR=1.214 in comparing Control vs. LATE+AD, and thus were associated with about 25% and 18% decrease in risk for LATE+AD, respectively, adjusted for APOE e4 carrier status. ALCDEMIF showed a significant (-value0.001) OR=0.823 in comparing LATE vs. Control, and thus were associated with about 18% decrease in risk for LATE, adjusted for APOE e4 carrier status. ALCDEM showed a significant (-value0.001) OR=0.865 in comparing AD vs. LATE, and thus were associated with about 14% lower risk for AD than for LATE, adjusted for APOE e4 carrier status. Essentially, in a cross-cohort independent verification fashion, our findings in ROSMAP were confirmed in NACC. For other alcohol-related variables in NACC, we also confirmed the findings. Due to space limit, we will report the results for other alcohol-related variables in a separate paper.
Discussion
Existing studies 11, 15, 16, 32, 33, 34, 35, 36, 37, 38, 39 have shown that several lifestyle factors, including alcohol, daily living activities, and cognitive activities, are closely linked to AD. In particular, research on the role of alcohol consumption in cognitive functions and dementia was conducted 15, 16, 17; nonetheless, their findings were mixed or even contradicting.
For the first time, our results suggest that alcohol consumption is associated with LATE and its comorbidity with AD. The existing work closely related to our study is 17, which tested the interaction of alcohol with APOE e4 on 7 cognitive measures for a middle-aged cohort without considering dementia types such as AD and LATE. The conclusion of 17 was that the e4 allele might increase vulnerability to the deleterious effects of heavy alcohol intake, while beneficial effects of light or moderate alcohol intake were not seen. Because most LATE and AD cases are typically for the old-aged, the conclusion of 17 cannot be generalized to AD and LATE. In contrast, we examined the old-aged cohorts to dissect the relationship of alcohol consumption with dementia types AD and LATE specifically, thus obtaining starkly different findings from 17. Another related work 40 studied the old-aged male cohort for cognitive functions and clinical dementia diagnosis, without considering APOE or pathological or etiological distinction between AD and LATE. In addition, recent work 31 tested 4 genetic variants for their links with LATE and AD adjusted for APOE e4, with no environmental or lifestyle factors considered.
To our knowledge, we are the first to study the association of alcohol with LATE/AD specifically, and our findings indicate that light-to-moderate alcohol consumption played differential protective roles against AD, LATE, and AD+LATE for APOE e4 carriers in ROSMAP and NACC.
Conclusions
This study explored environmental and lifestyle factors, including lifestyle, education, medical history, diets, and cognitive activity to differentiate between LATE, AD, and Control. We introduced an ML-based approach for identifying important environmental and lifestyle factors in LATE and/or AD. Using the proposed approach, we found that alcohol intake was linked with AD and LATE, which was first identified on a discovery dataset ROSMAP and then further validated on an independent dataset NACC. Notably, for the first time, our results suggest that alcohol consumption was associated with LATE and AD often as a top lifestyle and environmental factor, but its associations with LATE and AD were differential. In particular, we identified a specific subpopulation comprising APOE e4 carriers. We discovered that, for this particular subpopulation, light-to-moderate alcohol intake was a protective factor against AD and LATE, but its protective role against AD was greater than LATE. Our study will potentially contribute to understanding the different lifestyle and environmental factors implicated in LATE and/or AD.
Acknowledgments
This work was partially supported by the NIH grants R21AG070909, R56NS117587, R01HD101508, and ARO W911NF-17-1-0040. And the results published here are in whole or in part based on data obtained from the AD Knowledge Portal and NACC.
References
- [1] Kivipelto M, Mangialasche F, Ngandu T. Lifestyle interventions to prevent cognitive impairment, dementia and Alzheimer disease. Nature Reviews Neurology. 2018 October;14(11):653–666.
- [2] Causes and risk factors for Alzheimer’s disease. https://wwwalzorg/alzheimers-dementia/what-is-alzheimers/causes-and-risk-factors. Accessed September 28, 2021;.
- [3] Mucke L. Alzheimer’s disease. Nature. 2009 October;461(7266):895–897.
- [4] Prince M, Bryce R, Albanese E, Wimo A, Ribeiro W, Ferri CP. The global prevalence of dementia: A systematic review and metaanalysis. Alzheimer’s Dementia. 2013 January;9(1):63–75.
- [5] Wimo A, Guerchet M, Ali GC, Wu YT, Prina AM, Winblad B, et al. The worldwide costs of dementia 2015 and comparisons with 2010. Alzheimer’s Dementia. 2017 January;13(1):1–7.
- [6] Nelson PT, Dickson DW, Trojanowski JQ, Jack CR, Boyle PA, Arfanakis K, et al. Limbic-predominant age-related TDP-43 encephalopathy (LATE): Consensus working group report. Brain. 2019 June;142(6):1503–1527.
- [7] Besser LM, Teylan MA, Nelson PT. Limbic predominant age-related TDP-43 encephalopathy (LATE): Clinical and neuropathological associations. Journal of Neuropathology and Experimental Neurology. 2020 March;79(3):305–313.
- [8] Zhang L, Chen Y, Liu M, Wang Y, Peng G. TDP-43 and limbic-predominant age-related TDP-43 encephalopathy. Frontiers in Aging Neuroscience. 2020 January;11:376.
- [9] Boyle PA, Yang J, Yu L, Leurgans SE, Capuano AW, Schneider JA, et al. Varied effects of age-related neuropathologies on the trajectory of late life cognitive decline. Brain. 2017 March;140(3):804–812.
- [10] Cummings JL, Isaacson RS, Schmitt FA, Velting DM. A practical algorithm for managing Alzheimer’s disease: What, when, and why? Annals of Clinical and Translational Neurology. 2015 March;2(3):307–323.
- [11] Mortimer JA, Graves AB. Education and other socioeconomic determinants of dementia and Alzheimer’s disease. Neurology. 1993 August;43(8, s4):S39–S44.
- [12] Qiu C, Xu W, Fratiglioni L. Vascular and psychosocial factors in Alzheimer’s disease: epidemiological evidence toward intervention. Journal of Alzheimer’s Disease. 2010 May;20(3):689–697.
- [13] Imtiaz B, Tolppanen AM, Kivipelto M, Soininen H. Future directions in Alzheimer’s disease from risk factors to prevention. Biochemical Pharmacology. 2014 January;88(4):661–670.
- [14] Sharp ES, Gatz M. The relationship between education and dementia an updated systematic review. Alzheimer Disease and Associated Disorders. 2011 October;25(4):289–304.
- [15] Sabia S, Fayosse A, Dumurgier J, Dugravot A, Akbaraly T, Britton A, et al. Alcohol consumption and risk of dementia: 23 year follow-up of Whitehall II cohort study. The BMJ. 2018 August;362.
- [16] Rehm J, Hasan OSM, Black SE, Shield KD, Schwarzinger M. Alcohol use and dementia: A systematic scoping review. Alzheimer’s Research Therapy. 2019 December;11(1):1–11.
- [17] Slayday RE, Gustavson DE, Elman JA, Beck A, McEvoy LK, Tu XM, et al. Interaction between alcohol consumption and apolipoprotein E (ApoE) genotype with cognition in middle-aged men. Journal of the International Neuropsychological Society. 2021 January;27(1):56–68.
- [18] Myszczynska MA, Ojamies PN, Lacoste AMB, Neil D, Saffari A, Mead R, et al. Applications of machine learning to diagnosis and treatment of neurodegenerative diseases. Nature Reviews Neurology. 2020 August;16(8):440–456.
- [19] Braak H, Braak E. Neuropathological stageingof Alzheimer-related changes. Acta Neuropathologica. 1991 September;82(4):239–259.
- [20] Bennett DA, Schneider JA, Arvanitakis Z, Kelly JF, Aggarwal NT, Shah RC, et al. Neuropathology of older persons without cognitive impairment from two community-based studies. Neurology. 2006 June;66(12):1837–1844.
- [21] Mirra SS, Heyman A, McKeel D, Sumi SM, Crain BJ, Brownlee LM, et al. The Consortium to Establish a Registry for Alzheimer’s Disease (CERAD). Part II. Standardization of the neuropathologic assessment of Alzheimer’s disease. Neurology. 1991 April;41(5):479–486.
- [22] Nag S, Yu L, Wilson RS, Chen EY, Bennett DA, Schneider JA. TDP-43 pathology and memory impairment in elders without pathologic diagnoses of AD or FTLD. Neurology. 2017 February;88(7):653–660.
- [23] Wu X, Peng C, Nelson PT, Cheng Q. Random forest-integrated analysis in AD and LATE brain transcriptome-wide data to identify disease-specific gene expression. PLOS One. 2021 September;16(9):e0256648.
- [24] Peng C, Cheng Q. Discriminative ridge machine: A classifier for high-dimensional data or imbalanced data. IEEE Transactions on Neural Networks and Learning Systems. 2020 July;32(6):2595–2609.
- [25] He H, Garcia EA. Learning from imbalanced data. Transactions on Knowledge and Data Engineering. 2009 June;21(9):1263–1284.
- [26] Wu X, Cheng Q. Fractal autoencoders for feature selection. In: Proceedings of the AAAI Conference on Artificial Intelligence (AAAI 2021). vol. 35; 2021. p. 10370–10378.
- [27] Wu X, Cheng Q. Algorithmic stability and generalization of an unsupervised feature selection algorithm. Thirty-fifth Conference on Neural Information Processing Systems (NeurIPS 2021). 2021;34.
- [28] Kraskov A, Stögbauer H, Grassberger P. Estimating mutual information. Physical Review E. 2004 June;69(6):066138.
- [29] Geurts P, Ernst D, Wehenkel L. Extremely randomized trees. Machine Learning. 2006 March;63(1):3–42.
- [30] Pedregosa F, Varoquaux G, Gramfort A, Michel V, Thirion B, Grisel O, et al. Scikit-learn: Machine learning in Python. Journal of Machine Learning Research. 2011 October;12(85):2825–2830.
- [31] Dugan AJ, Nelson PT, Katsumata Y, Shade LMP, Boehme KL, Teylan MA, et al. Analysis of genes (TMEM106B, GRN, ABCC9, KCNMB2, and APOE) implicated in risk for LATE-NC and hippocampal sclerosis provides pathogenetic insights: a retrospective genetic association study. Acta Neuropathologica Communications. 2021 September;9(152):1–18.
- [32] Andrew MK, Tierney MC. The puzzle of sex, gender and Alzheimer’s disease: Why are women more often affected than men? Women’s Health. 2018 December;14:1745506518817995.
- [33] Ko K, Byun MS, Yi D, Lee JH, Kim CH, Lee DY. Early-life cognitive activity is related to reduced neurodegeneration in Alzheimer signature regions in late life. Frontiers in Aging Neuroscience. 2018 March;10:70.
- [34] Alcohol and dementia. https://wwwalzheimersorguk/about-dementia/risk-factors-and-prevention/alcohol. Accessed September 28, 2021;.
- [35] Marshall GA, Amariglio RE, Sperling RA, Rentz DM. Activities of daily living: Where do they fit in the diagnosis of Alzheimer’s disease? Neurodegenerative Disease Management. 2012 October;2(5):483–491.
- [36] Marshall GA, Sikkes SAM, Amariglio RE, Gatchel JR, Rentz DM, Johnson KA, et al. Instrumental activities of daily living, amyloid, and cognition in cognitively normal older adults screening for the A4 Study. Assessment Disease Monitoring. 2020 October;12(1):e12118.
- [37] Katzman R. Education and the prevalence of dementia and Alzheimer’s disease. Neurology. 1993 January;43(1):13–20.
- [38] Mezencev R, Chernoff YO. Risk of Alzheimer’s disease in cancer patients: Analysis of mortality data from the US SEER population-based registries. Cancers. 2020 April;12(4):796.
- [39] Tan ZS, Beiser A, Vasan RS, Au R, Auerbach S, Kiel DP, et al. Thyroid function and the risk of Alzheimer disease: The Framingham study. Archives of Internal Medicine. 2008 July;168(14):1514–1520.
- [40] Yan Z, Yingjie Z, Na A, Qi Q, Wei L, Wenzheng W, et al. The effects of light-to-moderate alcohol consumption on the cognitive function of community nondemented male elderly: A cohort study. Behavioural Neurology. 2021 March;Article ID: 5681913.