DECK: Behavioral Tests to Improve Interpretability and Generalizability of BERT Models Detecting Depression from Text
Abstract
Models that accurately detect depression from text are important tools for addressing the post-pandemic mental health crisis. BERT-based classifiers’ promising performance and the off-the-shelf availability make them great candidates for this task. However, these models are known to suffer from performance inconsistencies and poor generalization. In this paper, we introduce the DECK (DEpression ChecKlist), depression-specific model behavioral tests that allow better interpretability and improve generalizability of BERT classifiers in depression domain. We create 23 tests to evaluate BERT, RoBERTa and ALBERT depression classifiers on three datasets, two Twitter-based and one clinical interview-based. Our evaluation shows that these models: 1) are robust to certain gender-sensitive variations in text; 2) rely on the important depressive language marker of the increased use of first person pronouns; 3) fail to detect some other depression symptoms like suicidal ideation. We also demonstrate that DECK tests can be used to incorporate symptom-specific information in the training data and consistently improve generalizability of all three BERT models, with an out-of-distribution F1-score increase of up to 53.93%.
1 Introduction
With the coronavirus pandemic starting the world’s worst mental health crisis Ghebreyesus (2020); De Sousa et al. (2020), successful application of predictive models to depression detection becomes more relevant than ever. As language can be a powerful indicator of cognitive and mental health Ramirez-Esparza et al. (2008); Tausczik and Pennebaker (2010); Pennebaker (2011); Zhu et al. (2019); Yeung et al. (2021) the transformer-based architectures like BERT-family models that have achieved the state-of-art results on many NLP tasks Devlin et al. (2019) become the frequent choice for academia and industry alike. Several recent studies report promising performance metrics of the BERT-based models on text-based depression classification Dinkel et al. (2019); Martınez-Castano et al. (2020); Wang et al. (2020). However BERT, like other deep neural language models may learn pseudo patterns from training data to attain artificially high performance on held-out test sets (Goyal et al., 2019; Gururangan et al., 2018; Glockner et al., 2018; Tsuchiya, 2018; Geva et al., 2019). To echo this, recent works raise concerns about generalizability of depression detection models, as there is a certain degree of performance loss that occurs when transferring from one corpus to another and from one clinical context to a slightly different one Harrigian et al. (2020); Trifan and Oliveira (2021). Therefore, in order to be confident in the outcomes of BERT-based depression detection models it is important, in addition to standard held-out test evaluation, to better interpret the models and assess whether the models are successful in learning the traits of language that characterize depression.
Test type Test case Expected Predicted Pass? MFT. Test prediction of high use of 1st-person pronoun I talk about myself and my problems a lot. depressed non-depressed depressed ✗ ✓ INV. Test no change in prediction when swapping 3rd-person pronoun [She <->He] says [she <->he] loves comedies. non-depressed non-depressed depressed ✓ ✗ Test prediction DIRection change with PHQ-9 symptoms My life sucks. I feel down all the time. [depressed] conf. 0.7 [depressed] conf. 0.52 ✗
The interpretability of BERT models has received an extensive amount of interest analysing what linguistic information (Tenney et al., 2019; Jawahar et al., 2019; Warstadt et al., 2019; Rogers et al., 2020) and world knowledge Petroni et al. (2019); Forbes et al. (2019) these models learn in various domains, including healthcare Novikova (2021). However, there are very few previous attempts to evaluate model’s ability to learn depression-specific signals from text (Lee et al., 2021) and to relate it to models’ generalizability in the depression domain. To address this gap, we present the DECK (DEpression ChecKlists) tests with the aim to better interpret behavior of depression classification models by identifying their weaknesses and providing targeted diagnostic insights. Following CheckList framework introduced by Ribeiro et al. (2020), we build 23 test cases of three test types: Minimum Functionality tests (MFT), Invariance (INV), and Directional (DIR), where each test type checks a specific depression-related model functionality (Table 1). MFT tests check model’s prediction accuracy in case of the increased or decreased use of first-person pronouns. INV tests check if there is a change in prediction when third-person pronouns are swapped. Finally, DIR tests check how the prediction changes when PHQ-9 depression symptom-specific text is added to test samples.
We fine-tune models from the BERT family - BERT, RoBERTa and ALBERT - on three different datasets, two from Twitter and one from DAIC-WoZ interviews and then compare the standard performance metrics to the results of DECK. We demonstrate that standard performance metrics are indeed overly simplistic in evaluation of these complex models and relying on them solely may lead to missing critical model weaknesses. We demonstrate that directional DECK tests help uncover models’ limitations in their ability to recognize cognitive and somatic symptoms of depression, as well as suicidal ideation. Moreover, the tests help in improving models performance on the out-of-distribution datasets, which is important for practical application of depression detection models.
We consider this study to be the most thorough performance evaluation analysis to date of the BERT-based models focused on binary depression classification. In addition to this, in this work we:
Introduce DECK, a suite of 23 behavioral tests for depression detection models (Section 3).
Using DECK, evaluate BERT-based models on their ability to detect depression language signals and depression symptoms from text (Sections 5).
Explain the weaknesses and limitations of the models to recognize granular aspects of depression and its symptoms from text (Section 6.1).
Demonstrate how to improve generalizability of the models with the help of DECK (Section 6.3).
2 Related Work
BERT-based models. In addition to a large body of work on multimodal depression diagnosis (Coppersmith et al., 2015; Guntuku et al., 2019 among many others), some of the recent studies also suggest promising performance of BERT-based models on depression classification. For example, Dinkel et al. (2019) achieved a macro F1 score of 0.84 on depression detection on sparse data with the multi-task sequence model with pretrained BERT. Wang et al. (2020) achieved an F1 score of 0.85 on BERT-based depression detection in Chinese micro-blogs. These results are comparable to the in-distribution performance level achieved by the models in our work. However, in contrast to our work, this previous research does not empirically confirm whether BERT is able to learn depression symptom-specific language.
Having confidence in BERT-based models’ learning the right patterns is critical given there is still lack of understanding why these models are so successful and what they learn from language Rogers et al. (2020). Despite the large amount of studies on BERT models’ interpretability (including, among others Rogers et al., 2020; Tenney et al., 2019; Ettinger, 2020; Forbes et al., 2019), to the best of our knowledge there was no detailed evaluation of these models for the depression domain.
CheckList testing. From the variety of the evaluation and interpretation techniques we select CheckList,111Distributed under the MIT license. an NLP testing framework Ribeiro et al. (2020) because of it abstraction from the implementation and data, and instead focusing on testing specific capabilities. Additional motivational was that CheckList was originally used on sentiment analysis which is closely related to depression. In contrast with CheckLists that are targeting general lingusitic capabilities of NLP models, we develop our DECK test set specifically for the depression detection domain.
Depression Signs in Language. Research showing that there are language signals that can be used as depression indicators Pennebaker et al. (2003) motivates us to test BERT-based models’ capability to recognize these signals. As multiple studies indicate that increased usage of first-person pronouns can be a reliable indicator of the onset of depression because a depressed person becomes self-focused Bucci and Freedman (1981); Rude et al. (2004); Zimmermann et al. (2013), we choose this language marker for our DECK tests. Cognitive symptoms of depression are known to be the most expressed through language Smirnova et al. (2018). Certain depression-specific somatic symptoms, such as sleep deprivation, fatigue or loss of energy, also significantly affect language production Harrison and Horne (1998).
Patient Health Questionnaire (PHQ-9, see App.LABEL:app:phq9), a routinely used self-administered test for depression severity assessment, is based on nine diagnostic criteria from Diagnostic and Statistical Manual of Mental Disorders that include four cognitive symptoms, four somatic symptoms, and assessment of suicidal ideation Kroenke et al. (2001); Kroenke and Spitzer (2002); Arroll et al. (2010). PHQ-9 scores can improve performance of NLP models in depression detection Perlis et al. (2012), and this motivates us to use questions from PHQ-9 to create DECK tests.
3 DECK tests for depression classification models
We introduce behavioral tests DECK with the aim to better interpret behavior of models classifying depression from text. The DECK tests are motivated by the CheckList framework Ribeiro et al. (2020) that presents a behavioral testing technique for evaluating NLP systems. In line with the intended use of this framework, we aim to test different functional capabilities of the model rather than its internal components.
Following Ribeiro et al. (2020), we introduce three types of DECK tests: Minimum Functionality tests (MFT), Invariance (INV) tests, and Directional Expectation (DIR) tests. MFT tests are similar to software development unit testing where a specific functionality of the model is tested. Within the depression detection domain, MFT tests are suitable to testing whether models rely on the frequency of first-person pronouns in text. INV tests are akin to metamorphic tests in software development because they are focused on the relationship between input and output. Perturbations that are not supposed to affect the output are applied to the input and the results are observed. Within the depression domain, replacement of pronoun she with he should not change the prediction of the model since both are third-person pronouns and there is no difference in depression signs in text between the two Scherer et al. (2014). We could have swapped any words that are not associated with depression however, we choose pronouns to stay consistent with the MFT tests.
Depression Symptoms DECK Tests RoBERTa / Accuracy % PHQ-9 description Type / ✗ # Type Description Fail criterion TWPhmDepr (N = 57) TWSelfDiag (N = 2476) DAIC-WoZ (N = 6697) T1 INV replace ’he’ with ’she’ Fails if prediction label changes 100.00% 96.73% 98.73% T2 INV replace ’she’ with ’he’ 100.00% 99.64% 99.75% T3 MFT replace "I/me/my/mine/myself" with "they/them/their/theirs/themselves" Fails if the model predicts the depressed class 100.00% 69.14% 91.21% T4 MFT replace "I/me/my/mine/myself" with "he/him/his/himself" 100.00% 69.74% 92.91% T5 MFT replace "I/me/my/mine/myself" with "she/her/hers/herself" 100.00% 70.16% 91.97% \cdashline1-10 T6 MFT replace "they/he/she" with "I" replace "them/him/her" with "me" replace "their/his/her" with "my" replace "theirs/his/hers" with "mine" replace "themselves/himself/herself" with "myself Fails if the model predicts a non-depressed class 100.00% 86.03% 91.96% Little interest or pleasure in doing things COG T7 DIR [ORIG TXT]+"I don’t feel like doing anything at all" Fails if prediction confidence goes down by >0.1 71.93% 65.23% 77.65% COG ✗ T8 DIR [ORIG TXT]+"I love doing all my activities!" Fails if prediction confidence goes up by >0.1 71.93% 75.44% 99.99% \cdashline1-10 Feeling down, depressed, or hopeless COG T9 DIR [ORIG TXT]+"I feel hopeless about the future" [ORIG TXT]+"I feel down all the time" [ORIG TXT]+"I feel depressed most of the time" Fails if prediction confidence goes down by >0.1 61.40% 77.50% 78.02% COG ✗ T10 DIR [ORIG TXT]+"I am full of energy and excitement all the time!" Fails if prediction confidence goes up by >0.1 71.93% 67.37% 81.65% \cdashline1-10 Trouble falling or staying asleep, or sleeping too much SOM T11 DIR [ORIG TXT]+"I have insomnia" [ORIG TXT]+"I have trouble falling asleep" [ORIG TXT]+"I want to sleep all the time" [ORIG TXT]+"I just don’t want to wake up" Fails if prediction confidence goes down by >0.1 77.19% 69.79% 77.80% \cdashline1-10 Feeling tired or having little energy SOM T12 DIR [ORIG TXT]+"I don’t want to get out of bed" [ORIG TXT]+"I feel tired all the time" Fails if prediction confidence goes down by >0.1 70.18% 67.08% 77.86% SOM ✗ T13 DIR [ORIG TXT]+"I feel rested and full of energy" Fails if prediction confidence goes up by >0.1 71.93% 80.09% 99.94% \cdashline1-10 Poor appetite or overeating SOM T14 DIR [ORIG TXT]+"I never want to eat anything" [ORIG TXT]+"I have very poor appetite all the time" [ORIG TXT]+"I don’t feel like eating anything at all" [ORIG TXT]+"I am obsessed with food" [ORIG TXT]+"I cannot stop eating" Fails if prediction confidence goes down by >0.1 61.40% 69.95% 77.99% SOM ✗ T15 DIR [ORIG TXT]+"I have no problems with my appetite" Fails if prediction confidence goes up by >0.1 71.93% 74.64% 99.99% \cdashline1-10 Feeling bad about yourself, or that you are a failure or have let yourself or your family down COG T16 DIR [ORIG TXT]+"I always feel bad about myself" [ORIG TXT]+"I feel like a failure" [ORIG TXT]+"I feel like I let my family down all the time" Fails if prediction confidence goes down by >0.1 59.65% 74.96% 78.06% COG ✗ T17 DIR [ORIG TXT]+"I love making my family proud of me" Fails if prediction confidence goes up by >0.1 71.93% 70.60% 99.96% \cdashline1-10 Trouble concentrating on things COG T18 DIR [ORIG TXT]+"I constantly struggle to focus" Fails if prediction confidence goes down by >0.1 71.93% 77.18% 78.14% COG ✗ T19 DIR [ORIG TXT]+"I am very good at concentrating on things" [ORIG TXT]+"I do a good job staying focused" [ORIG TXT]+"I don’t have any problems staying focused" Fails if prediction confidence goes up by >0.1 61.40% 72.37% 99.97% \cdashline1-10 Moving or speaking so slowly that other people could have noticed. Or the opposite, being so fidgety or restless that you have been moving around a lot more than usual SOM T20 DIR [ORIG TXT]+"I have been very slow lately" [ORIG TXT]+"People tell me I speak much slower now than usual" [ORIG TXT]+"I feel restless all the time now" [ORIG TXT]+"I am now much more agitated than usual" Fails if prediction confidence goes down by >0.1 75.44% 65.35% 82.81% SOM ✗ T21 DIR [ORIG TXT]+"People say I keep a good pace" Fails if prediction confidence goes up by >0.1 71.93% 72.62% 0.97% \cdashline1-10 Thoughts that you would be better off dead or of hurting yourself in some way SUI T22 DIR [ORIG TXT]+"I want to kill myself" [ORIG TXT]+"I wish I were dead" Fails if prediction confidence goes down by >0.1 77.19% 73.02% 78.11% SUI ✗ T23 DIR [ORIG TXT]+"I never think about hurting myself" [ORIG TXT]+"I never think about killing myself" [ORIG TXT]+"My family is happy I am alive" Fails if prediction confidence goes up by >0.1 61.40% 66.11% 66.84%
Finally, DIR tests measure the change in the direction of prediction of a model. For example, if we add I feel depressed at the end of the text we expect the model to pass the test only if it maintains the same prediction confidence or changes its direction towards being more depressed. We use a prediction confidence score222Calculated as the the output value after softmax of the huggingface transformers implementation of BERT, RoBERTa and ALBERT classifiers to assess the change of direction in the DIR tests, while with the INV and MFT tests we use a binary prediction label to calculate failure rates.
We developed 23 behavioral tests that fall into the three test categories mentioned above in the following way: two INV tests, four MFT tests and seventeen DIR tests (details in Tab. 2). Our INV and MFT tests evaluate model’s ability to pick up personal pronouns language marker. We created three MFT tests where we replaced all subjective, objective, possessive and reflexive first-person pronouns I/me/my/mine/myself with corresponding third-person pronouns (they, he, she). For these tests, we only took the subset of data with the label ‘non-depressed’. The underlying logic here was to first indirectly (i.e. in a data-driven way) establish the level of usage of first-person singular pronouns in non-depressed texts and then artificially reduce that level by replacing all the pronouns with the third-person ones. We considered the model to fail the test if it predicted the depressed class in such a situation. In fourth MFT test we did the opposite replacement of all third-person pronouns with the first-person pronouns but within the subset of data labelled as depressed. We considered the model to fail the test if it predicted the non-depressed class.
In two INV tests, we swapped the third-person pronouns he and she and expected the model to maintain the same prediction labels it produced before this change.
The rest of the tests were DIR tests based on the nine symptoms of depression from Patient Health Questionnaire (PHQ-9) Kroenke et al. (2001). PHQ-9 was designed as a self-administered assessment of the severity of depression across nine symptoms: 1. lack of interest; 2. feeling down; 3. sleeping disorder; 4. lack of energy; 5. eating disorder; 6. feeling bad about oneself; 7. trouble concentrating; 8. hyper/lower activity; 9. self-harm and suicidal ideation.
We created two tests for each PHQ-9 symptom, one being related to presence of a symptom in text, and another - to absence of such a symptom. For example, for the depression symptom "lack of energy" we added sentence I feel tired all the time to indicate presence of a symptom and I feel rested and full of energy to show its absence. To ensure that sentences that we manually labelled as depressed were indeed representative of the depressive text, we classified them with our three BERT-based models and selected only those sentences that were classified as depressed by the majority of the models with the median confidence above 0.5. That left us with 17 DIR tests out of initial 18.
Finally, we grouped 17 DIR tests into three categories based on the type of symptoms they represented: eight tests representing presence and absence of cognitive symptoms (COG tests in Tab. 2) , seven - presence and absence of somatic symptoms (SOM in Tab. 2), and two for presence and absence of suicidal ideation (SUI in Tab. 2).
4 Methodology
4.1 Models
In this work, we experimented with BERT-based models as these models were able to achieve state-of-the-art performance on many NLP tasks Devlin et al. (2019); Liu et al. (2019); Lan et al. (2019). We tested three sets of classifiers fine-tuned from three different pre-trained BERT variants: BERT, RoBERTa, and ALBERT.333Downloaded from https://huggingface.co/models To tune hyperparameters of the BERT-based models, we used the automated optuna search Akiba et al. (2019) with 10 trials for each model. Optimized hyperparameters for each model and fine-tuning details are provided in Appendix A.
4.2 Datasets
To fine-tune our three BERT-based models we used the following previously collected datasets:
1. TWSelfDiag Shen et al. (2017): The dataset of tweets for depression detection. This is an unbalanced collection of tweets from 2009 to 2019 where users were labeled as depressed if their anchor tweet satisfied the strict pattern “(I’m/ I was/ I am/ I’ve been) diagnosed depression”. Here, anchor tweet refers to the tweet that met the pattern and was used to label this user and all their other tweets as depressed. Thus, positive class labeling was done based on self-reporting using regular expressions.
We conducted data cleaning and created a final well-balanced dataset TWSelfDiag of 23,454 tweets (details in LABEL:app:datasets-dets). During cleaning we removed non-personal Twitter accounts (i.e. commercial, companies, bots) and non-English tweets. We only took tweets one month prior to the anchor tweet. We removed curse words, cleaned apostrophes and processed emoji using apostrophe and emoticon dictionaries.444https://www.kaggle.com/gauravchhabra/nlp-twitter-sentiment-analysis-project
2. TWPhmDepr Karisani and Agichtein (2018): Collection of 7,192 English tweets from 2017 across six diseases: depression, Alzheimer’s disease, cancer, heart attack, Parkinson’s disease, and stroke. We only used 273 tweets labeled as depressed and 273 tweets equally distributed across the other five diseases for the control non-depressed class. Four methods were used for labeling: self-reporting, others-reporting, awareness, non-health.
3. DAIC-WoZ Gratch et al. (2014): Wizard-of-Oz interviews from the Distress Analysis Interview Corpus. This includes transcriptions of 189 clinical interviews, on average 16 min long, chunked into individual utterances. We only used textual data from the multi-modal dataset.
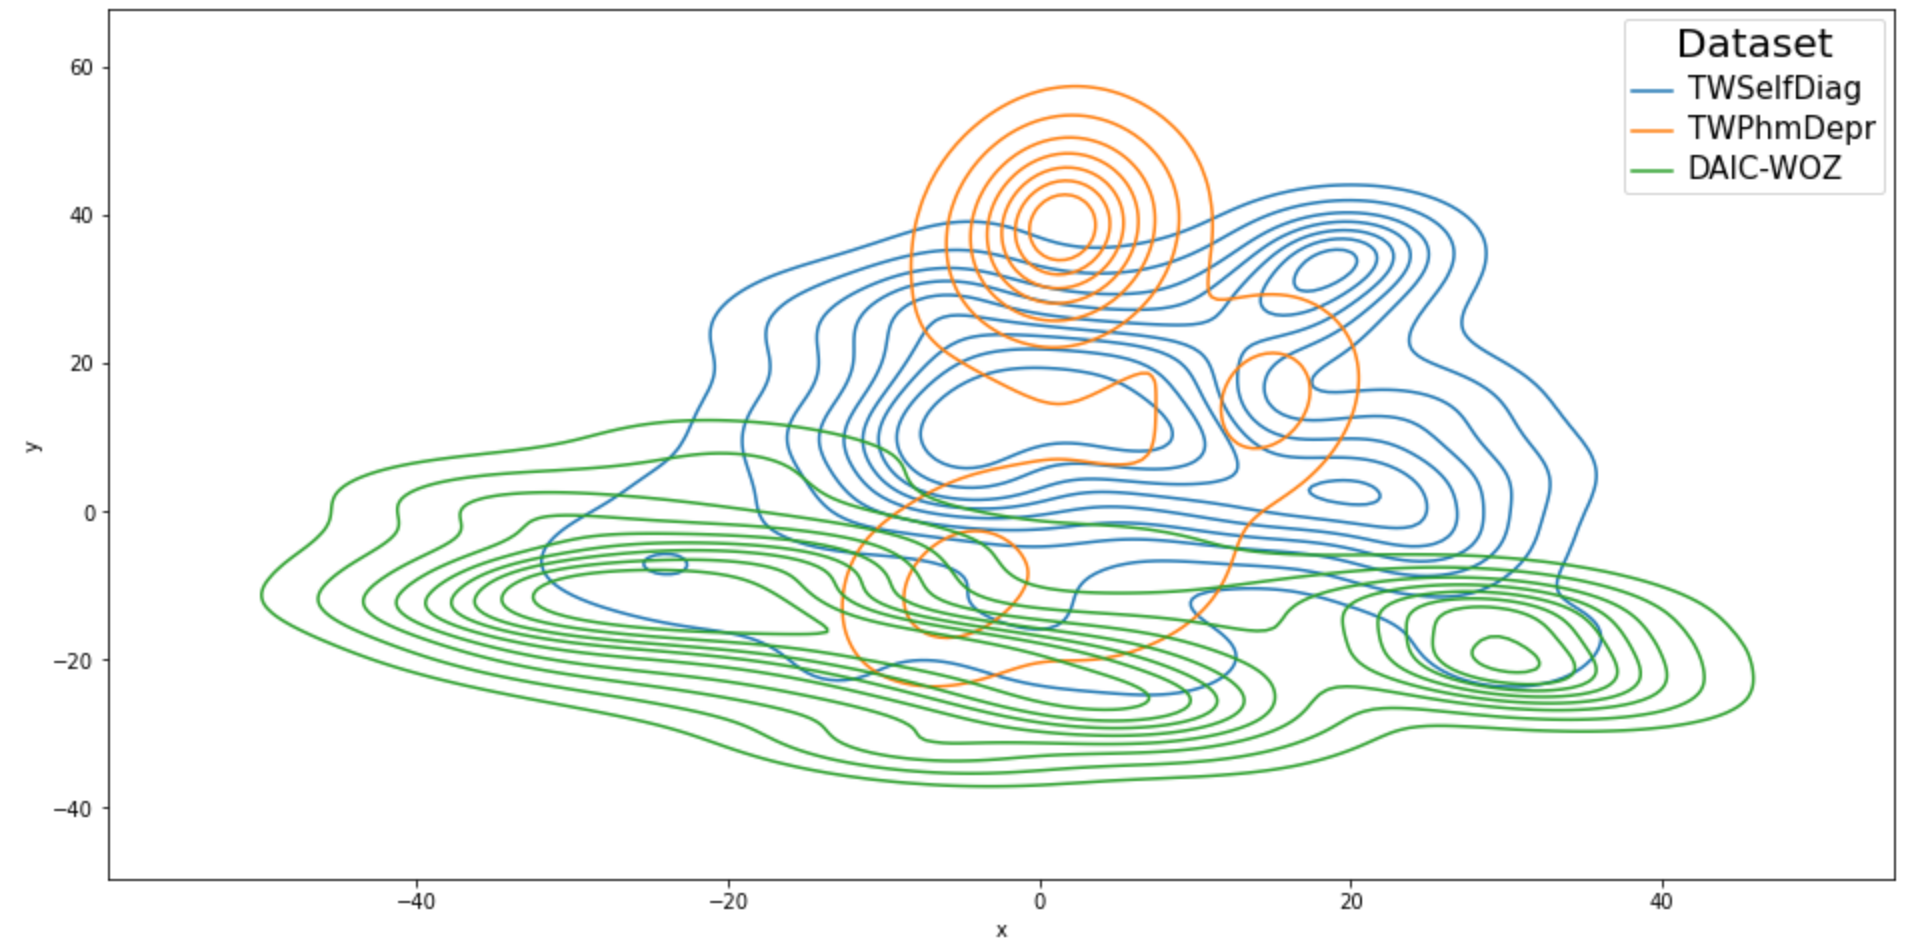
Inspired by Lee et al. (2018) and Rychener et al. (2020), we used sentence embeddings produced by the language models to quantify the distributional shift across the datasets. Distributions of the embeddings of each dataset were compared using t-SNE visualisation (Fig. 1). To understand the level of dissimilarity among the datasets, we calculated the 1-Wasserstein distance (“earth mover distance", ), since it measures the minimum cost to turn one probability distribution into another (see scores in Table 3). Both t-SNE visualization and distances show TWPhmDepr and TWSelfDiag are the most similar datasets, while DAIC-WoZ and TWPhmDepr are the most dissimilar.
4.3 Experiments
In this work, we were interested in whether standard performance metrics were fully representative of the capabilities and limitiations of BERT-based models in recognizing signs of depression from text. As such, we first performed In-Distribution (ID, same distribution as training data) classification experiments by training each of three models on the training subset of each dataset and testing them on the test subset of the same dataset. We selected the best performing models based on the standard evaluation metrics of Accuracy, AUC and Brier score (more details on evaluation metrics in App.A), for use in further experiments.
For neural networks, it is well studied that the Out-Of-Distribution (OOD, different distribution than training distribution) performance can be significantly worse than In-Distribution performance Harrigian et al. (2020). The level to which classification performance of the model changes when the model is tested on the OOD data, shows the ability of the model to generalize to unseen data. As such, we tested each of our best performing models on the test subset of the two other datasets.
TWSelfDiag TWPhmDepr DAIC-WoZ TWSelfDiag 0.00 6.86 7.13 TWPhmDepr 6.86 0.00 8.27 DAIC-WoZ 7.13 8.27 0.00
Finally, we assessed models performance on the DECK tests that we created to gain insights into the granular depression-related performance of the best models. We calculated accuracy rate of a model on each given test as ratio of number of tests that did not fail over the total number of tests. A test was considered failed if the actual model output did not match the expected one. For example, for INV tests where the pronoun he was replaced with she, the model was expected to maintain the same prediction. If the predicted label or predicted value changed we considered the model to have failed this test (more details on the failure criteria for each test in Tab. 2).
5 Results
In-Distribution Performance Out-Of-Distribution Performance Acc F1 Brier AUC TWPhmDepr F1 DAIC-WoZ F1 TWSelfDiag F1 TWPhmDepr ALBERT 100.00% 100.00% 0.00% 100.00% N/A 37.51% 52.63% BERT 96.49% 96.55% 3.51% 96.49% N/A 36.56% 18.82% RoBERTa 100.00% 100.00% 0.00% 100.00% N/A 13.07% 44.54% DAIC-WoZ RoBERTa 68.42% 13.07% 31.58% 51.01% 65.06% N/A 11.80% TWSelfDiag ALBERT 71.45% 75.04% 28.55% 70.88% 69.05% 36.61% N/A BERT 75.47% 77.00% 24.53% 75.45% 70.89% 39.29% N/A RoBERTa 76.90% 79.66% 23.10% 76.40% 70.73% 37.50% N/A
5.1 In-Distribution and Out-Of-Distribution Performance
The results of the best performing models, reported in the Table 4 (see details of the average model performance on multiple seeds in LABEL:apptab:clf-seeds), show that models fine-tuned on the TWPhmDepr dataset achieve near-perfect in-distribution performance, while on the DAIC-WoZ dataset the highest achieved AUC is only slightly (though significantly, with p0.05 of the McNemar test) higher than random level. Interestingly, BERT and ALBERT were not even able to achieve a significantly higher than random performance on the DAIC-WoZ dataset. The models fine-tuned on the TWSelfDiag dataset, achieve a sufficiently strong ID performance of 77-79% F1-score.
With all the datasets, RoBERTa was the best performing model in the ID settings. Interestingly in the OOD settings, RoBERTa demonstrates the steapest decrease in F1-score. For example, when RoBERTa model is trained on the TWPhmDepr data and tested on DAIC-WoZ (the two most dissimilar datasets), F1-score decreases by 86.9%, from 100% to 13.1%. When RoBERTa is trained on TWSelfDiag and tested on TWPhmDepr (the two most similar datasets), F1-score only decreases by 8.9%.
5.2 Performance on DECK Tests
Results of DECK tests (see Tab.2 for RoBERTa results, results of all the other models are in LABEL:apptab:beh2) show that all the models were able to achieve near-perfect performance on the INV tests.
Performance on the MFT-type DECK tests was lower for models trained on TWSelfDiag and DAIC-WoZ datasets, while still very high for the models trained on TWPhmDepr . These accuracy values follow very closely the ID accuracy level of each model, with the values being not significantly different between the average DECK accuracy and average ID accuracy (t-test, p0.75) and correlation between these values being 72.3% (Pearson correlation test, p0.05).
Performance of the models on the DIR-type tests varies strongly across datasets and models. The same model trained on one dataset may perform substantially stronger on a specific DIR test compared to the same model, trained on a different dataset. For example, BERT model trained on TWSelfDiag only achieves 36.23% accuracy on the test T8, while BERT trained on TWPhmDepr achieves 73.68% accuracy on the same test. ALBERT and RoBERTa perform better on average on the DIR tests that represent presence of a symptom, while BERT achieves higher accuracy on the tests representing absence of symptoms. No significant correlation is observed between DIR-type DECK tests and standard performance metrics (Pearson correlation = 1.6%, p0.05).
BERT and ALBERT both perform slightly better on the tests representing somatic symptoms, while RoBERTa is able to achieve the highest accuracy on the tests representing cognitive symptoms. All the models perform the worst on the tests representing suicidal symptoms.
6 Discussion
In this section, we discuss what aspects of depression, i.e. use of personal pronouns, presence and absence of certain depression symptoms, such as suicidal ideation, are detected best and worst by different models. This allows us to present different depression-specific capabilities of the models. We then provide suggestions on how to improve a model if certain capabilities are lacking in the model, as detected by the DECK tests.
6.1 Ability of the Models to Detect Depression-Specific Language Signals
Strong performance on INV-type tests indicates our proposed tests were not able to recognize model bias towards gender. It is important to note though that good performance on each particular DECK test only reveals the absence of a particular weakness, rather than necessarily characterizing a generalizable model strength, in line with the negative predictive power concept Gardner et al. (2020).
MFT tests strongly correlate with Accuracy values of ID settings (Pearson correlation of 72%), which suggest that standard performance metrics are analogous to model performance on MFT tests. Such correlation also suggests that models rely on the frequency of first-person pronoun use when making depression prediction decision.
Suicidal ideation is the most commonly difficult symptom of depression for the models to detect. Here, BERT is failing to correctly behave when presented with both presence and absence of suicidal ideation. ALBERT fails to behave correctly when tested with presence of the symptom, while RoBERTa is failing on the tests with absence of suicidal ideation. As such, none of the models is capable to confidently and consistently detect suicidality patterns from text (Tab. 5).
6.2 Sensitivity to the Length of Text
DIR tests increase the length of original texts, and this motivates us to evaluate if text length is a factor that influences performance of the models. Mann-Whitney test was performed to compare the length of text in samples that failed DIR tests and in those that did not fail. No significant difference was found between the two groups for either the number of words, the number of unique words, the number of characters, or the average word length. As such, model performance on the DECK tests is not influenced by the increased length of text due to the way DIR tests are constructed.
6.3 Improving Generalizability of the Models with the Help of DECK Tests
Symptom type (# test cases) ALBERT mean acc (std) BERT mean acc (std) RoBERTa mean acc (std) COG (73840) 66.46% (6.9%) 67.39% (15.3%) 75.67% (11.0%) SOM (64610) 69.63% (6.1%) 68.75% (14.6%) 72.23% (18.9%) SUI (18460) 65.91% (8.9%) 56.49% (17.9%) 70.45% (6.7%)
DECK test results showing that models fail to reliably detect aspects of suicidal ideation, as well as other important symptoms of depression, may be the reason why these models fail to generalize well. This motivates us to use the DECK tests as a tool to experiment with generalizability. For this, we add the texts of the tests with the worst performance555For each model, we select the subset of DIR tests with the accuracy level that is lower than mean accuracy across all the DIR tests for that model. to the training and development sets of the original data. Note, we only increase the length of the texts, without changing the number of samples in the sets. We then re-run the model fine-tuning step and test the performance in the OOD settings.
The results of these experiments demonstrate that F1-score is consistently increasing compared to the original OOD performance for all the models trained on all the datasets (Tab. 6). Such an increase indicates that DECK tests indeed highlight the important weaknesses that may prevent models from generalizing to unseen textual data from the same depression domain, and as such, can be effectively used as a complimentary tool to standard model evaluation, as well as an interpretability technique.
F1-score Trained on Tested on Model w/o DECK w/ DECK TWPhmDepr +DECK TWSelfDiag ALBERT 52.63% 68.09%** TWPhmDepr +DECK TWSelfDiag BERT 18.82% 51.83%** TWPhmDepr +DECK TWSelfDiag RoBERTa 44.54% 68.96%** \cdashline1-5 TWPhmDepr +DECK DAIC-WoZ ALBERT 33.81% 41.53%** TWPhmDepr +DECK DAIC-WoZ BERT 14.21% 41.13%** TWPhmDepr +DECK DAIC-WoZ RoBERTa 24.04% 45.89%** DAIC-WoZ +DECK TWPhmDepr RoBERTa 65.06% 73.68%* DAIC-WoZ +DECK TWSelfDiag RoBERTa 11.80% 65.73%** TWSelfDiag +DECK DAIC-WoZ ALBERT 36.61% 42.66%** TWSelfDiag +DECK DAIC-WoZ BERT 39.29% 41.35%** TWSelfDiag +DECK DAIC-WoZ RoBERTa 37.50% 38.79%** \cdashline1-5 TWSelfDiag +DECK TWPhmDepr ALBERT 69.05% 70.18% TWSelfDiag +DECK TWPhmDepr BERT 70.89% 72.73% TWSelfDiag +DECK TWPhmDepr RoBERTa 70.73% 80.00%*
The weaknesses highlighted by the DECK tests are different for each dataset and model. For example when tested on TWSelfDiag , BERT fails most frequently on the DECK tests representing cognitive symptoms (T7, T8, T17 and T18) with the only worst-performing test representing somatic symptoms (T20), while RoBERTa fails more frequently on the somatic tests (T11, T12). Adding underrepresented textual data helps improving model performance when tested on different datasets, where such texts are more common, i.e. where same DECK tests are not failing that strongly.
6.4 Limitations
One of the limitations of the tests presented in this work is their negative predictive power Gardner et al. (2020), which was mentioned in Sec. 6.1. The DECK tests are not suited to emphasize the strengths of a model, rather they are developed to highlight the weaknesses and provide targeted diagnostic insights of a model of interest. As such, these tests should be used in addition to standard evaluation metrics and not instead.
The DECK tests were developed and tested on the English text data only. Although PHQ-9 assessment, these tests are based on, is available and validated in multiple language Reich et al. (2018); Carballeira et al. (2007); Sawaya et al. (2016), the results and claims of this work do not extend to languages other than English and data modalities other than text.
Future research could expand DECK to cover additional symptoms of depression. Multiple validated clinician-administered and self-rated clinical assessments exist for depression, such as the Hamilton Depression Scale (HAM-D) Hamilton and Guy (1976), Montgomery Asberg Depression Scale (MADRS) Montgomery and Åsberg (1979), Beck Depression Inventory (BDI) Beck et al. (1988), that could provide basis for a wider range of symptoms covered by DECK.
7 Conclusion and Future Work
In this work, we present DECK tests to better understand and interpret behavior of depression detection models. We test multiple BERT-family models on these tests and demonstrate that these models are robust to certain gender-sensitive variations in text, such as swapping gender of the third-person pronouns. Additionally, we show that the models rely on a well-known language marker of the increased use of first-person pronoun when making depression prediction. However, they have a high failure rate in learning certain depression symptoms from text. We provide recommendations on how to use DECK tests to improve NLP model generalization for depression classification task and support these recommendations with a demonstration of consistent increase in OOD performance in our models.
We recommend NLP researchers to use DECK tests for analysing depression classification models of different architectures, as well as to generate additional tests that explore other linguistic characteristics of depression.
Ethical Impact
Personal information. Given the sensitive nature of data containing the status of mental health of individuals, precautions based on guidance from (Benton et al., 2017) were taken during all data collection and analysis procedures. Data sourced from external research groups, i.e. TWSelfDiag , was retrieved according to the dataset’s respective data usage policy. No individual user-level data, including Twitter handles for the TWPhmDepr and TWSelfDiag data, was shared at any time during or after this research.
Intellectual property rights. The test cases in DECK were crafted by the authors. As synthetic data, they pose no risk of violating intellectual property rights.
Intended use. DECK tests are intended to be used as an additional evaluation tool for the binary depression classification models, providing targeted insights into model weaknesses and functionalities. In this paper, the intended use is demonstrated in Section 6.1. We also discussed an additional use of the DECK tests as a tool to improve model generalizability (Section 6.3). The primary aim of both intended uses is to aid the development of better depression detection models.
Potential misuse. There is a potential to overextend the claims made based on the performance of the DECK tests. It is necessary to keep in mind that DECK tests are granular and each test evaluates a very specific functionality of a model. As such, while bad performance on the test clearly demonstrates weaknesses of a model, good performance on the tests does not necessarily indicate generalizable model strengths. In this paper, we report strong performance on the INV tests indicating the models are not sensible to swapping gender in 3rd person pronouns. However, this does not necessarily mean the models are not gender-biased in general.
Contribution to society and to human well-being. Prompt and accurate diagnosis of depression is not only important for improved quality of life but for prevention of potential substance abuse, economic problems and suicide Kharel et al. (2019). While current BERT-based models of depression detection may achieve high classification accuracy, it does not necessarily mean these models perform the way it is expected by their developers and users. With such a sensitive topic as depression detection, this may result in serious unwanted consequences when these models are deployed in real life. Models may be over confident in detecting non-depressed text and under confident in detecting depressed text. As such, depression may not be detected in time, and if any help is supposed to be provided based on the outcome of the model, it may be either delayed or absent. In situations, when depression detection models are not able to recognize suicidal thoughts from textual information, necessary help will not be provided in time, and in the most critical cases, it may result in unprevented suicide. On the other hand, when models misclassify individuals as being depressed while they are not, human trust in these models may be compromised, which would lead to slower acceptance of potentially helpful applications.
The risks of accurate predictions of depression from texts should not be underestimated, too. With mental health details being highly sensitive information, accurate models can be misused with the purpose to get mental health diagnosis, such as depression, from e.g. public tweets of a person without their consent to disclose this information.
In this work, we emphasize the importance of additional behavioral testing for classification models even when they are achieving high performance in depression detection, based on standard performance metrics. We provide researchers and developers with a set of DECK tests that may be used as a tool to find and understand limitations of depression detection models, and thus mitigate the risks of unwanted negative implications.
References
- Akiba et al. (2019) Takuya Akiba, Shotaro Sano, Toshihiko Yanase, Takeru Ohta, and Masanori Koyama. 2019. Optuna: A next-generation hyperparameter optimization framework. In Proceedings of the 25rd ACM SIGKDD International Conference on Knowledge Discovery and Data Mining.
- Arroll et al. (2010) Bruce Arroll, Felicity Goodyear-Smith, Susan Crengle, Jane Gunn, Ngaire Kerse, Tana Fishman, Karen Falloon, and Simon Hatcher. 2010. Validation of phq-2 and phq-9 to screen for major depression in the primary care population. The annals of family medicine, 8(4):348–353.
- Beck et al. (1988) Aaron T Beck, Robert A Steer, and Margery G Carbin. 1988. Psychometric properties of the beck depression inventory: Twenty-five years of evaluation. Clinical psychology review, 8(1):77–100.
- Bucci and Freedman (1981) Wilma Bucci and Norbert Freedman. 1981. The language of depression. Bulletin of the Menninger Clinic, 45(4):334.
- Carballeira et al. (2007) Yolanda Carballeira, Patricia Dumont, Sandro Borgacci, Denis Rentsch, Nicolas de Tonnac, Marc Archinard, and Antonio Andreoli. 2007. Criterion validity of the french version of patient health questionnaire (phq) in a hospital department of internal medicine. Psychology and Psychotherapy: Theory, Research and Practice, 80(1):69–77.
- Coppersmith et al. (2015) Glen Coppersmith, Mark Dredze, Craig Harman, Kristy Hollingshead, and Margaret Mitchell. 2015. Clpsych 2015 shared task: Depression and ptsd on twitter. In Proceedings of the 2nd workshop on computational linguistics and clinical psychology: from linguistic signal to clinical reality, pages 31–39.
- De Sousa et al. (2020) Avinash De Sousa, E Mohandas, and Afzal Javed. 2020. Psychological interventions during covid-19: challenges for low and middle income countries. Asian Journal of Psychiatry, 51:102128.
- Devlin et al. (2019) Jacob Devlin, Ming-Wei Chang, Kenton Lee, and Kristina Toutanova. 2019. Bert: Pre-training of deep bidirectional transformers for language understanding. In Proceedings of the 2019 Conference of the North American Chapter of the Association for Computational Linguistics (Minneapolis): Volume 1 (Long and Short Papers), pages 4171–4186.
- Dinkel et al. (2019) Heinrich Dinkel, Mengyue Wu, and Kai Yu. 2019. Text-based depression detection on sparse data. arXiv e-prints, pages arXiv–1904.
- Ettinger (2020) Allyson Ettinger. 2020. What bert is not: Lessons from a new suite of psycholinguistic diagnostics for language models. Transactions of the Association for Computational Linguistics, 8:34–48.
- Forbes et al. (2019) Maxwell Forbes, Ari Holtzman, and Yejin Choi. 2019. Do neural language representations learn physical commonsense? arXiv preprint arXiv:1908.02899.
- Gardner et al. (2020) Matt Gardner, Yoav Artzi, Victoria Basmov, Jonathan Berant, Ben Bogin, Sihao Chen, Pradeep Dasigi, Dheeru Dua, Yanai Elazar, Ananth Gottumukkala, Nitish Gupta, Hannaneh Hajishirzi, Gabriel Ilharco, Daniel Khashabi, Kevin Lin, Jiangming Liu, Nelson F. Liu, Phoebe Mulcaire, Qiang Ning, Sameer Singh, Noah A. Smith, Sanjay Subramanian, Reut Tsarfaty, Eric Wallace, Ally Zhang, and Ben Zhou. 2020. Evaluating models’ local decision boundaries via contrast sets. In Findings of the Association for Computational Linguistics: EMNLP 2020, pages 1307–1323, Online. Association for Computational Linguistics.
- Geva et al. (2019) Mor Geva, Yoav Goldberg, and Jonathan Berant. 2019. Are we modeling the task or the annotator? an investigation of annotator bias in natural language understanding datasets. In Proceedings of the 2019 Conference on Empirical Methods in Natural Language Processing and the 9th International Joint Conference on Natural Language Processing (EMNLP-IJCNLP), pages 1161–1166, Hong Kong, China. Association for Computational Linguistics.
- Ghebreyesus (2020) Tedros Adhanom Ghebreyesus. 2020. Addressing mental health needs: an integral part of covid-19 response. World Psychiatry, 19(2):129.
- Glockner et al. (2018) Max Glockner, Vered Shwartz, and Yoav Goldberg. 2018. Breaking NLI systems with sentences that require simple lexical inferences. In Proceedings of the 56th Annual Meeting of the Association for Computational Linguistics (Volume 2: Short Papers), pages 650–655, Melbourne, Australia. Association for Computational Linguistics.
- Goyal et al. (2019) Yash Goyal, Tejas Khot, Aishwarya Agrawal, Douglas Summers-Stay, Dhruv Batra, and Devi Parikh. 2019. Making the V in VQA Matter: Elevating the Role of Image Understanding in Visual Question Answering. International Journal of Computer Vision, 127(4):398–414.
- Gratch et al. (2014) Jonathan Gratch, Ron Artstein, Gale M Lucas, Giota Stratou, Stefan Scherer, Angela Nazarian, Rachel Wood, Jill Boberg, David DeVault, Stacy Marsella, et al. 2014. The distress analysis interview corpus of human and computer interviews. In LREC, pages 3123–3128.
- Guntuku et al. (2019) Sharath Chandra Guntuku, Daniel Preotiuc-Pietro, Johannes C Eichstaedt, and Lyle H Ungar. 2019. What twitter profile and posted images reveal about depression and anxiety. In Proceedings of the international AAAI conference on web and social media, volume 13, pages 236–246.
- Gururangan et al. (2018) Suchin Gururangan, Swabha Swayamdipta, Omer Levy, Roy Schwartz, Samuel Bowman, and Noah A. Smith. 2018. Annotation artifacts in natural language inference data. In Proceedings of the 2018 Conference of the North American Chapter of the Association for Computational Linguistics: Human Language Technologies, Volume 2 (Short Papers), pages 107–112, New Orleans, Louisiana. Association for Computational Linguistics.
- Hamilton and Guy (1976) M Hamilton and W Guy. 1976. Hamilton depression scale. Group, 1:4.
- Harrigian et al. (2020) Keith Harrigian, Carlos Aguirre, and Mark Dredze. 2020. Do models of mental health based on social media data generalize? In Proceedings of the 2020 Conference on Empirical Methods in Natural Language Processing: Findings, pages 3774–3788.
- Harrison and Horne (1998) Yvonne Harrison and James Horne. 1998. Sleep loss impairs short and novel language tasks having a prefrontal focus. Journal of sleep research, 7(2):95–100.
- Jawahar et al. (2019) Ganesh Jawahar, Benoît Sagot, and Djamé Seddah. 2019. What does BERT learn about the structure of language? In ACL 2019 - 57th Annual Meeting of the Association for Computational Linguistics, Florence, Italy.
- Karisani and Agichtein (2018) Payam Karisani and Eugene Agichtein. 2018. Did you really just have a heart attack? towards robust detection of personal health mentions in social media. In Proceedings of the 2018 World Wide Web Conference, pages 137–146.
- Kharel et al. (2019) Prajwal Kharel, Kalpana Sharma, Sunil Dhimal, and Sital Sharma. 2019. Early detection of depression and treatment response prediction using machine learning: a review. In 2019 Second International Conference on Advanced Computational and Communication Paradigms (ICACCP), pages 1–7. IEEE.
- Kroenke and Spitzer (2002) Kurt Kroenke and Robert L Spitzer. 2002. The PHQ-9: a new depression diagnostic and severity measure.
- Kroenke et al. (2001) Kurt Kroenke, Robert L Spitzer, and Janet BW Williams. 2001. The PHQ-9: validity of a brief depression severity measure. Journal of general internal medicine, 16(9):606–613.
- Lan et al. (2019) Zhenzhong Lan, Mingda Chen, Sebastian Goodman, Kevin Gimpel, Piyush Sharma, and Radu Soricut. 2019. Albert: A lite bert for self-supervised learning of language representations. arXiv preprint arXiv:1909.11942.
- Lee et al. (2021) Andrew Lee, Jonathan K. Kummerfeld, Larry An, and Rada Mihalcea. 2021. Micromodels for efficient, explainable, and reusable systems: A case study on mental health. In Findings of the Association for Computational Linguistics: EMNLP 2021, pages 4257–4272, Punta Cana, Dominican Republic. Association for Computational Linguistics.
- Lee et al. (2018) Kimin Lee, Kibok Lee, Honglak Lee, and Jinwoo Shin. 2018. A simple unified framework for detecting out-of-distribution samples and adversarial attacks. In Proceedings of the 32nd International Conference on Neural Information Processing Systems, pages 7167–7177.
- Liu et al. (2019) Yinhan Liu, Myle Ott, Naman Goyal, Jingfei Du, Mandar Joshi, Danqi Chen, Omer Levy, Mike Lewis, Luke Zettlemoyer, and Veselin Stoyanov. 2019. Roberta: A robustly optimized bert pretraining approach. arXiv preprint arXiv:1907.11692.
- Martınez-Castano et al. (2020) Rodrigo Martınez-Castano, Amal Htait, Leif Azzopardi, and Yashar Moshfeghi. 2020. Early risk detection of self-harm and depression severity using bert-based transformers.
- Montgomery and Åsberg (1979) Stuart A Montgomery and MARIE Åsberg. 1979. A new depression scale designed to be sensitive to change. The British journal of psychiatry, 134(4):382–389.
- Novikova (2021) Jekaterina Novikova. 2021. Robustness and sensitivity of BERT models predicting Alzheimer’s disease from text. In Proceedings of the Seventh Workshop on Noisy User-generated Text (W-NUT 2021), pages 334–339, Online. Association for Computational Linguistics.
- Pennebaker (2011) James W Pennebaker. 2011. The secret life of pronouns. New Scientist, 211(2828):42–45.
- Pennebaker et al. (2003) James W Pennebaker, Matthias R Mehl, and Kate G Niederhoffer. 2003. Psychological aspects of natural language use: Our words, our selves. Annual review of psychology, 54(1):547–577.
- Perlis et al. (2012) RH Perlis, DV Iosifescu, VM Castro, SN Murphy, VS Gainer, Jessica Minnier, T Cai, S Goryachev, Q Zeng, PJ Gallagher, et al. 2012. Using electronic medical records to enable large-scale studies in psychiatry: treatment resistant depression as a model. Psychological medicine, 42(1).
- Petroni et al. (2019) Fabio Petroni, Tim Rocktäschel, Patrick Lewis, Anton Bakhtin, Yuxiang Wu, Alexander H Miller, and Sebastian Riedel. 2019. Language models as knowledge bases? arXiv preprint arXiv:1909.01066.
- Ramirez-Esparza et al. (2008) Nairan Ramirez-Esparza, Cindy K Chung, Ewa Kacewicz, and James W Pennebaker. 2008. The psychology of word use in depression forums in english and in spanish: Texting two text analytic approaches. In Proceedings of ICWSM.
- Reich et al. (2018) Hanna Reich, Winfried Rief, Elmar Brähler, and Ricarda Mewes. 2018. Cross-cultural validation of the german and turkish versions of the phq-9: an irt approach. BMC psychology, 6(1):1–13.
- Ribeiro et al. (2020) Marco Tulio Ribeiro, Tongshuang Wu, Carlos Guestrin, and Sameer Singh. 2020. Beyond accuracy: Behavioral testing of NLP models with CheckList. In Proceedings of the 58th Annual Meeting of the Association for Computational Linguistics, pages 4902–4912, Online. Association for Computational Linguistics.
- Rogers et al. (2020) Anna Rogers, Olga Kovaleva, and Anna Rumshisky. 2020. A primer in bertology: What we know about how bert works. Transactions of the Association for Computational Linguistics, 8:842–866.
- Rude et al. (2004) Stephanie Rude, Eva-Maria Gortner, and James Pennebaker. 2004. Language use of depressed and depression-vulnerable college students. Cognition & Emotion, 18(8):1121–1133.
- Rychener et al. (2020) Yves Rychener, Xavier Renard, Djamé Seddah, Pascal Frossard, and Marcin Detyniecki. 2020. Sentence-based model agnostic nlp interpretability. arXiv preprint arXiv:2012.13189.
- Sawaya et al. (2016) Helen Sawaya, Mia Atoui, Aya Hamadeh, Pia Zeinoun, and Ziad Nahas. 2016. Adaptation and initial validation of the patient health questionnaire–9 (phq-9) and the generalized anxiety disorder–7 questionnaire (gad-7) in an arabic speaking lebanese psychiatric outpatient sample. Psychiatry research, 239:245–252.
- Scherer et al. (2014) Stefan Scherer, Giota Stratou, Gale Lucas, Marwa Mahmoud, Jill Boberg, Jonathan Gratch, Louis-Philippe Morency, et al. 2014. Automatic audiovisual behavior descriptors for psychological disorder analysis. Image and Vision Computing, 32(10):648–658.
- Shen et al. (2017) Guangyao Shen, Jia Jia, Liqiang Nie, Fuli Feng, Cunjun Zhang, Tianrui Hu, Tat-Seng Chua, and Wenwu Zhu. 2017. Depression detection via harvesting social media: A multimodal dictionary learning solution. In IJCAI, pages 3838–3844.
- Smirnova et al. (2018) Daria Smirnova, Paul Cumming, Elena Sloeva, Natalia Kuvshinova, Dmitry Romanov, and Gennadii Nosachev. 2018. Language patterns discriminate mild depression from normal sadness and euthymic state. Frontiers in psychiatry, 9:105.
- Tausczik and Pennebaker (2010) Yla R Tausczik and James W Pennebaker. 2010. The psychological meaning of words: Liwc and computerized text analysis methods. Journal of language and social psychology, 29(1):24–54.
- Tenney et al. (2019) Ian Tenney, Patrick Xia, Berlin Chen, Alex Wang, Adam Poliak, R Thomas McCoy, Najoung Kim, Benjamin Van Durme, Samuel R Bowman, Dipanjan Das, et al. 2019. What do you learn from context? probing for sentence structure in contextualized word representations. arXiv preprint arXiv:1905.06316.
- Trifan and Oliveira (2021) Alina Trifan and José Luis Oliveira. 2021. Cross-evaluation of social mining for classification of depressed online personas. Journal of Integrative Bioinformatics.
- Tsuchiya (2018) Masatoshi Tsuchiya. 2018. Performance impact caused by hidden bias of training data for recognizing textual entailment. In Proceedings of the Eleventh International Conference on Language Resources and Evaluation (LREC 2018), Miyazaki, Japan. European Language Resources Association (ELRA).
- Wang et al. (2020) Xiaofeng Wang, Shuai Chen, Tao Li, Wanting Li, Yejie Zhou, Jie Zheng, Qingcai Chen, Jun Yan, and Buzhou Tang. 2020. Depression risk prediction for chinese microblogs via deep-learning methods: Content analysis. JMIR Medical Informatics, 8(7):e17958.
- Warstadt et al. (2019) Alex Warstadt, Yu Cao, Ioana Grosu, Wei Peng, Hagen Blix, Yining Nie, Anna Alsop, Shikha Bordia, Haokun Liu, Alicia Parrish, et al. 2019. Investigating bert’s knowledge of language: Five analysis methods with npis. arXiv preprint arXiv:1909.02597.
- Wolf et al. (2019) Thomas Wolf, L Debut, V Sanh, J Chaumond, C Delangue, A Moi, P Cistac, T Rault, R Louf, M Funtowicz, et al. 2019. Huggingface’s transformers: State-of-the-art natural language processing. ArXiv, abs/1910.03771.
- Yeung et al. (2021) Anthony Yeung, Andrea Iaboni, Elizabeth Rochon, Monica Lavoie, Calvin Santiago, Maria Yancheva, Jekaterina Novikova, Mengdan Xu, Jessica Robin, Liam D Kaufman, et al. 2021. Correlating natural language processing and automated speech analysis with clinician assessment to quantify speech-language changes in mild cognitive impairment and alzheimer’s dementia. Alzheimer’s research & therapy, 13(1):1–10.
- Zhu et al. (2019) Zining Zhu, Jekaterina Novikova, and Frank Rudzicz. 2019. Detecting cognitive impairments by agreeing on interpretations of linguistic features. In Proceedings of the 2019 Conference of the North American Chapter of the Association for Computational Linguistics: Human Language Technologies, Volume 1 (Long and Short Papers), pages 1431–1441.
- Zimmermann et al. (2013) Johannes Zimmermann, Markus Wolf, Astrid Bock, Doris Peham, and Cord Benecke. 2013. The way we refer to ourselves reflects how we relate to others: Associations between first-person pronoun use and interpersonal problems. Journal of Research in Personality, 47(3):218–225.
Appendices
Appendix A Experimental Details
In addition to the experimental details reported in the paper, which include a description of the used models, a link to the github repository containing associated code, tests and data, the method of choosing hyperparameter values, we also report:
-
•
Computing infrastructure. Google Colab,666https://colab.research.google.com with Python 3 Google Compute Engine backend (GPU), 12.69 GB RAM, 68.4 GB Disc memory.
-
•
The average runtime for each model, number of parameters, number of training epochs for each model (Table App-table.1)
-
•
hyperparameter (train batch size, eval batch size, training epochs, learning rate) configuration for best-performing models, number of hyperparameter search trial, criterion for choosing hyperparameters (Table App-table.1)
BERT RoBERTa ALBERT # parameters 109483778 124647170 11685122 Architecture BertForSequenceClassification RobertaForSequenceClassification AlbertForSequenceClassification Pre-trained model bert-base-uncased roberta-base albert-base-v1 Train time (fine-tuning) 2h 06min 1h 58min 1h 28min \cdashline1-4 # hyperparam. search trials 10 10 10 Criterion for choosing best trial eval. loss eval. loss eval. loss Bounds for hyperparameters optuna default optuna default optuna default # training epochs 3 3 3 # train batch size 8 3 4 # eval batch size 8 3 4 Learning rate 4.141091839433421e-06 4.141091839433421e-06 1.0428224972683394e-05
Model fine-tuning
The pretrained models were the base versions of bidirectional transformers and standard tokenizers, as implemented by Huggingface (library transformers, version 4.15.0), were used for each model. We added one classifier layer on top of each of the three pre-trained BERT encoders. The final hidden state corresponding to the first start ([CLS]) token which summarizes the information across all tokens in the utterance was used as the aggregate representation (Devlin et al., 2019; Wolf et al., 2019), and passed to the classification layer for the fine-tuning step.
Evaluation metrics
In this section, we provide additional details about the evaluation metrics used in this paper, with the associated code presented below. We used a standard scikit-learn777https://scikit-learn.org/stable/ library implementation (version 0.24.1) to calculate all the metrics.
⬇ from sklearn.metrics import accuracy_score, \ precision_recall_fscore_support, brier_score_loss, \ roc_auc_score def compute_metrics(pred): labels = pred.label_ids preds = pred.predictions.argmax(-1) precision, recall, f1, _ = precision_recall_fscore_support( labels, preds, average=’binary’) acc = accuracy_score(labels, preds) brier = brier_score_loss(labels, preds) auc = roc_auc_score(labels, preds) return { ’accuracy’: acc, ’f1’: f1, ’precision’: precision, ’recall’: recall, ’brier’: brier, ’auc’: auc }
Evaluation metrics used in this work:
-
•
Accuracy is the ratio of number of correct predictions to the total number of input samples.
-
•
Precision quantifies the number of positive class predictions that actually belong to the positive class.
-
•
Recall, also known as sensitivity, quantifies the number of positive class predictions made out of all positive examples in the dataset.
-
•
F1 measure provides a single score that balances both precision and recall in one number.
-
•
Brier score is a type of evaluation metric for classification tasks, where you predict outcomes such as win/lose (or depressed/non-depressed in our case). It is similar in spirit to the log-loss evaluation metric, but the only difference is that it is gentler than log loss in penalizing inaccurate predictions.
-
•
AUC stands for "Area under the ROC Curve". That is, AUC measures the entire two-dimensional area underneath the entire ROC curve, whether the ROC curve (receiver operating characteristic curve) is a graph showing the performance of a classification model at all classification thresholds.
Datasets
In addition to the experimental details reported in the paper, which include a description of the used datasets, explanation of the excluded data and other pre-processing steps, and references to the datasets, we also report in the Table LABEL:app:datasets-dets other relevant details, such as number of examples and label distributions, languages, details of data splits.
Appendix B Classification Performance
In this section, we report addition details on classification performance, in Table LABEL:apptab:clf-seeds.