2021
[1]\fnmOle \surKönig [1]\fnmJörn \surWilms
[1]\orgdivDr. Karl Remeis-Observatory and Erlangen Centre for Astroparticle Physics, \orgnameFriedrich-Alexander-Universität Erlangen-Nürnberg, \orgaddress\streetSternwartstr. 7, \postcode96049 \cityBamberg, \countryGermany
2]\orgnameMax-Planck-Institut für extraterrestrische Physik, \orgaddress\streetGießenbachstraße 1, \postcode85748 \cityGarching, \countryGermany
3]\orgdivInstitut für Astronomie und Astrophysik, Kepler Center for Astro and Particle Physics, \orgnameEberhard Karls Universität, \orgaddress\streetSand 1, \postcode72076 \cityTübingen, \countryGermany
4]\orgdivDepartament de Física EEBE, \orgnameUniversitat Politécnica de Catalunya (UPC), \orgaddress\streetAv. Eduard Maristany 10–14, \cityBarcelona, \postcode08019, \countrySpain
5]\orgnameInstitut d’Estudis Espacials de Catalunya (IEEC), \orgaddress\streetCarrer del Gran Capità 2, \cityBarcelona, \postcode08034, \countrySpain
6]\orgnameLeibniz-Institut für Astrophysik Potsdam, \orgaddress\streetAn der Sternwarte 16, \postcode14482 \cityPotsdam, \countryGermany
X-ray detection of a nova in the fireball phase
Abstract
Novae are caused by runaway thermonuclear burning in the hydrogen-rich envelopes of accreting white dwarfs, which results in the envelope to expand rapidly and to eject most of its mass(Chomiuk21a, ; starrfield16a, ). For more than 30 years, nova theory has predicted the existence of a “fireball” phase following directly the runaway fusion, which should be observable as a short, bright, and soft X-ray flash before the nova becomes visible in the optical(hillman14, ; Starrfield90a, ; Krautter08a, ). Here we present the unequivocal detection of an extremely bright and very soft X-ray flash of the classical Galactic nova YZ Reticuli 11 hours prior to its 9 mag optical brightening. No X-ray source was detected 4 hours before and after the event, constraining the duration of the flash to shorter than 8 hours. In agreement with theoretical predictions(Starrfield90a, ; Kato15a, ; Kato16a, ; Morii16a, ), the source’s spectral shape is consistent with a black body of K ( eV), or a white dwarf atmosphere, radiating at the Eddington luminosity, with a photosphere that is only slightly larger than a typical white dwarf. This detection of the expanding white dwarf photosphere before the ejection of the envelope provides the last link of the predicted photospheric lightcurve evolution and opens a new window to measure the total nova energetics.
keywords:
novae, cataclysmic variables, stars: individual (YZ Reticuli), white dwarfs, X-rays: binarieseROSITA detection of YZ Reticuli
During its second all-sky survey (2020-06-11 – 2020-12-15), the eROSITA instrument(Predehl21a, ) on board Spectrum-Roentgen-Gamma (SRG)(Sunyaev21a, ) scanned the field around , twenty-eight times, separated by 4 hours each. No source was detected for the first 22 scans. During the 23rd passage over the position, which started on -07-07 16:47:20 TT, a new and extremely bright source was detected (Fig. 1). No source was visible in the subsequent scans, constraining the event’s duration to . The position coincides with the location of Nova YZ Reticuli (= EC 035725455 = Nova Reticuli 2020), for which an optical outburst was discovered(McNaughtCBET4811, ) on 2020-07-15 14:09 UT. Subsequently, the object was classified as a classical He/N Galactic nova(Aydi20a, ; Carr20a, ) with a geometric distance of kpc.
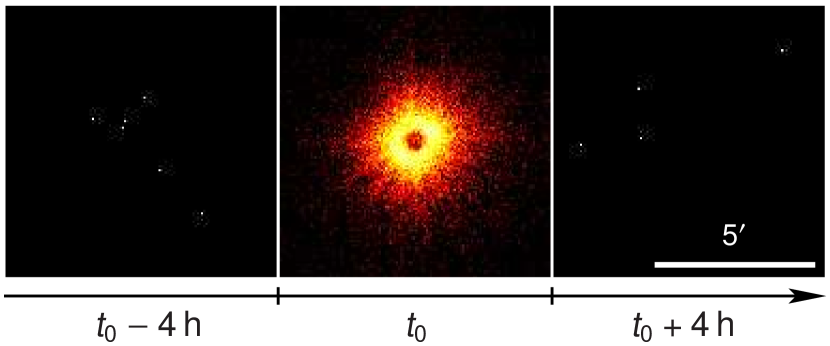
Figure 2 shows the combined multi-wavelength lightcurve of YZ Ret. At , ASAS-SN monitoring indicates the source close to the 16.4 mag detection limit at 15.8 mag. At h an optical (V-band) non-detection with a lower limit of 5.5 mag was reported(McNaughtCBET4812, ; Sokolovsky20a, ), followed by a fast brightening at (2020-07-08 04:05:58 UT). The nova reached a peak V-band brightness of 3.7 mag(McNaughtCBET4812, ) at , making it visible to the naked eye and the second brightest nova of the decade. From this chronology of the events we conclude that eROSITA has detected the X-ray ignition flash of a nova and that the X-ray flash happened a few hours before the optical rise, as theoretically predicted(Krautter08a, ; Kato16a, ; Chomiuk21a, ).
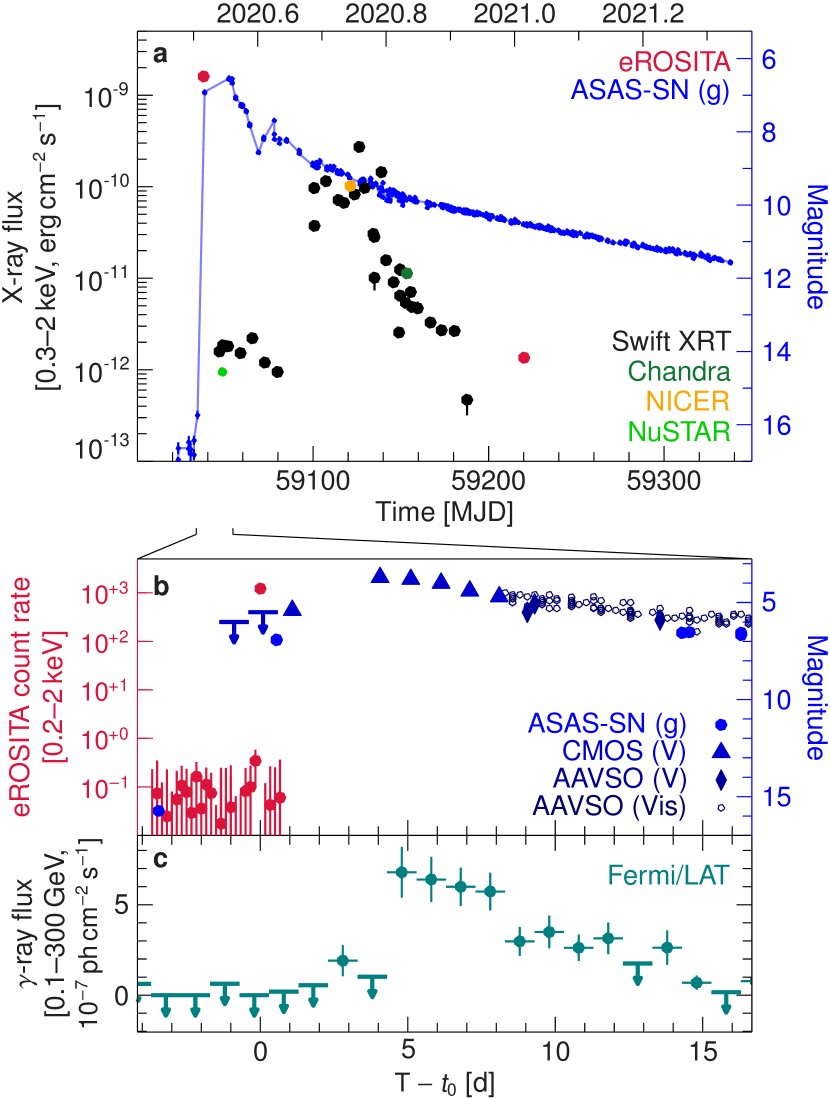
In other wavelengths, Fermi/LAT detected significant -ray emission starting at d (ref.(Li20a, )), and a NuSTAR observation detected hard X-rays at d (ref.(Sokolovsky22a, )). The hard emission is due to internal shocks within the expanding shell. Starting approximately two months after the X-ray flash, multiple missions(Sokolovsky22a, ), including eROSITA (Extended Data Fig. 1), showed that YZ Ret had entered the supersoft state.
The progenitor of YZ Ret is the known WD system MGAB-V207 (Kilkenny15a, ), which had a pre-eruption orbital period of 0.1324539(98) days(schaefer21a, ). Irregular variations in the optical before the nova event suggest the system to be a VY Scl type cataclysmic variable(Sokolovsky22a, ). The nature and composition of the WD is still unclear(Sokolovsky22a, ).
Spectral Analysis
During the eROSITA detection of the flash, YZ Ret was in the field of view for 35.8 s, with a count rate in excess of 1,000 (see Fig. 2b). Although the strong signal makes the detection of the flash unambiguous, it complicates a more detailed analysis of the properties of the nova: eROSITA’s detectors are severely affected by photon pile-up at such high count rates. The nonlinear distortion of the spectral information requires careful modeling of the response of the instrument to such a bright source. As discussed in more detail in the Methods section, our approach includes simulations using the same observing strategy as in the real observation. The Simulation of X-ray Telescopes (SIXTE)(Dauser19a, ) software package is a generic Monte Carlo toolkit for X-ray astronomical instrumentation and has been particularly tailored to model pile-up in the eROSITA detectors. The simulations allow us to perform a quantitative analysis and robustly recover the basic properties of the source even when considering the remaining systematic uncertainties. In the following, unless mentioned otherwise, all uncertainties denote confidence levels.
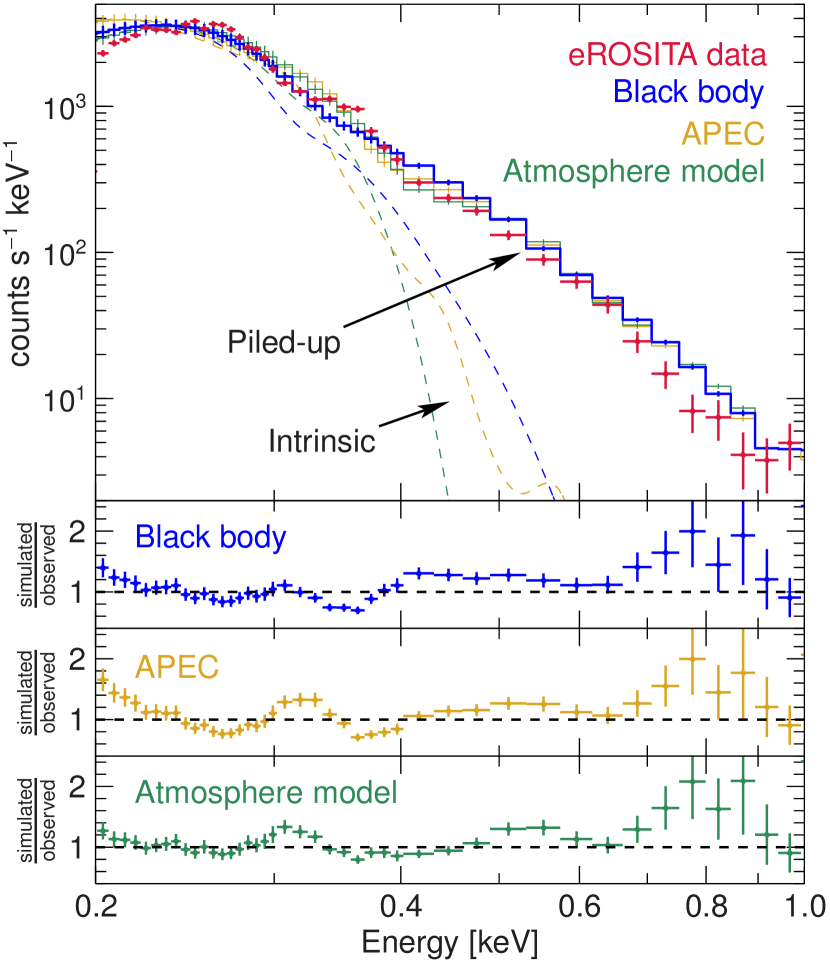
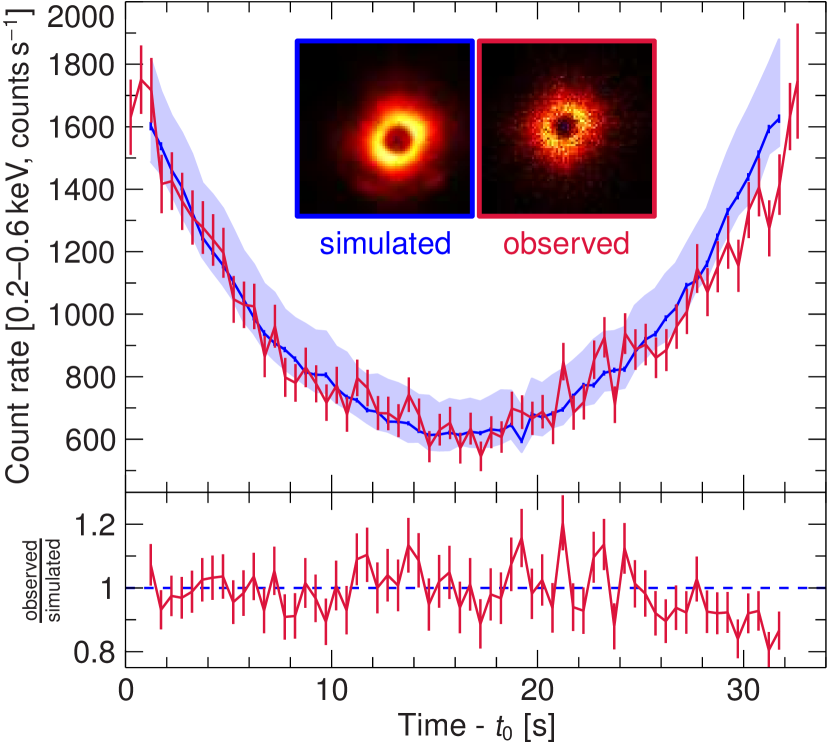
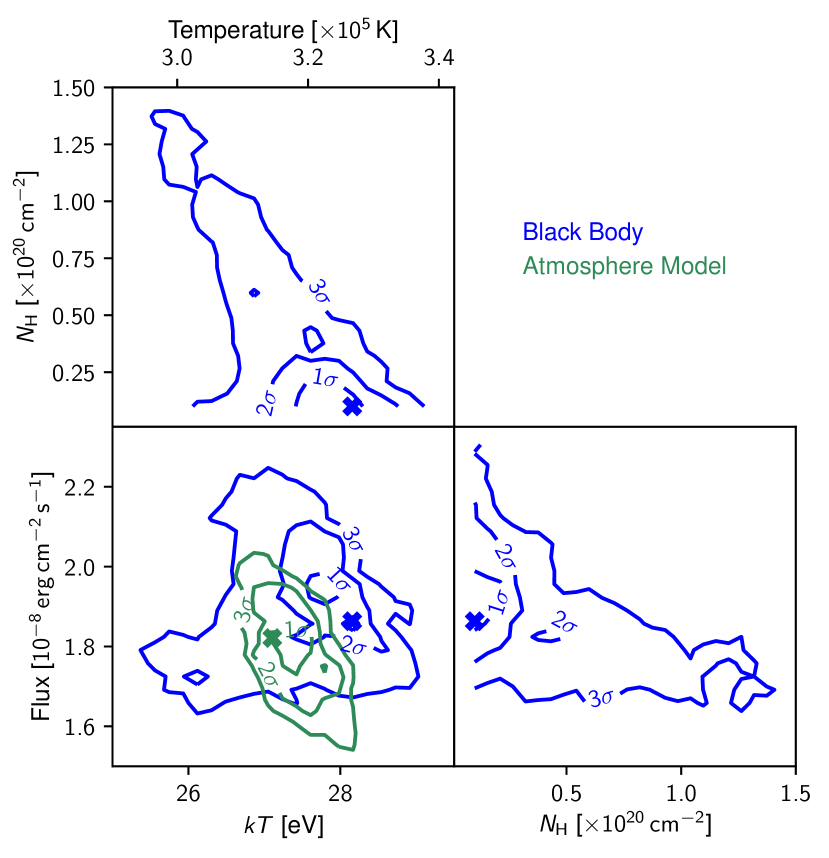
We investigate the data using three different models representative for the range of expected spectral shapes, an empirical black body, an optically thin collisional plasma (APEC)(smith01a, ), and a WD atmosphere model(Suleimanov13a, ; Suleimanov14a, ). The best-fitting models are shown in Fig. 3 and in the Extended Data Table 1. For the black body model we find that the spectrum can be best described at a 0.2–10 keV absorbed flux of with a temperature of eV ( K), where is the Boltzmann constant. The foreground and internal absorption column to the source is not very well known and the latter can also vary throughout the outburst. Estimates of the Galactic equivalent hydrogen column are , and intrinsic absorption has been estimated to be at (refs.(Izzo20a, ; Sokolovsky22a, )). Our black body fit constrains the equivalent hydrogen column density to , indicating no major intrinsic absorption during the X-ray flash. A comparison of the measured and simulated lightcurve shows a possible decline during the last few seconds of the observation (see Methods, Extended Data Fig. 2).
The best-fit atmosphere model has a 0.2–10 keV absorbed flux of and a temperature of , consistent with the parameters of the black body model. In the fits we fixed , i.e., we set to the lower limit of Galactic equivalent hydrogen column estimates(Izzo20a, ). Within the systematic uncertainties of the pile-up modeling, the black body and atmosphere models cannot be further distinguished.
The residuals of the APEC fit are significantly worse, especially at low energies, consistent with results that emission lines, presumably due to shocks, typically emerge in the X-rays only days to months after the eruption(Chomiuk21a, ). Similar to the later supersoft phase, any shocked plasma emission is likely orders of magnitude fainter than the supersoft emission. Therefore, we conclude that eROSITA detected an optically thick thermal spectrum from the photosphere.
The photosphere of YZ Ret during the flash
Assuming spherical emission and the Gaia distance of kpc, the unabsorbed bolometric flux of the black body model, , corresponds to a bolometric luminosity of . This luminosity is consistent with the theoretical prediction that the source radiates at the Eddington luminosity during the “fireball” phase ( for a canonical WD(Kato15a, ; Kato16a, )). At Nova YZ Ret was estimated(Sokolovsky22a, ) to have a peak optical bolometric luminosity of (correcting the distance from Gaia DR2 to Gaia EDR3). Since the high-energy luminosity at that time is a factor of fainter(Sokolovsky22a, ), we can assume that this luminosity is representative of the total bolometric luminosity. The nova is expected to evolve at approximately constant, Eddington-limited bolometric luminosity, with the spectral peak moving from the X-rays during the initial flash, to a peak in the optical at the maximum expansion of the photosphere. Our derived luminosity is on the same order of magnitude as at , implying that the total nova energetics are approximately conserved throughout the outburst. The bolometric luminosity from the black body model during the flash corresponds to a photospheric radius of . The atmosphere model yields a consistent radius of .
Theoretical work on nova outbursts shows that in the minutes after the thermonuclear runaway the rise in bolometric luminosity occurs at approximately constant radius(JoseHernanz98a, ; hillman14, ). Once the energy has diffused from the bottom of the envelope to the photosphere (about 5–10 minutes after the onset of the runaway) expansion starts immediately, and the envelope is ejected(aydi20, ) with velocities that can eventually reach up to . Thus, the photosphere will become orders of magnitude larger than a WD in a matter of minutes to hours. Given that our derived photospheric radius is only a few times larger than a typical WD radius ( km)(Bedard17a, ), eROSITA detected the “naked” photosphere just after the released energy reached the surface of the photosphere, before the main expansion of the envelope. At d the shocked region of YZ Ret had expanded to an estimated astronomical units(Sokolovsky22a, ).
The eROSITA detection provides further constraints on the temperature evolution of the photosphere during a complete nova outburst. The effective temperature during the flash is expected to peak in the range and then gradually decline to eV as the envelope expands over a period of a few hours to days and the peak emission shifts to the optical(hillman14, ; Kato16a, ). When the photosphere recedes back closer to the WD surface during the supersoft state, the temperature is expected to take a similar value as during the flash. The detailed temperature profile depends on the core temperature, accretion rate, and mass of the WD, but this overall pattern is ubiquitous for typical novae(hillman14, ). The temperature during the eROSITA observation, eV, is slightly below the expected peak temperature, suggesting that the observation was in the gradual decay phase of the flash. This interpretation is consistent with the possible flux decrease in the last s of the observation. During the supersoft state the temperature was eV (Extended Data Fig. 1)(Sokolovsky20b, ), which confirms that similar temperatures are measured during the flash and the supersoft phase.
Theoretical studies also predict that the existence and duration of the ignition flash correlates with the WD mass (hillman14, ; Kato17a, ). Low-mass WDs with are predicted to show only near-UV flashes, with durations of 5–10 d, while X-ray flashes are expected in moderate to high-mass WDs with durations of 6–12 h for a mass of (ref.(hillman14, )). The existence of the X-ray flash seen in YZ Ret therefore implies a relatively massive WD, which is confirmed by the short duration of the flash, and consistent with the mass inferred from the atmosphere model fits, , although this model does not include the effects of the expansion of the atmosphere.
While UV emission has been detected for a few novae(cao12, ; pietsch07a, ), searches for the X-ray flash(Morii16a, ; Kato16a, ) have so far been unsuccessful. The luminosity limit from MAXI(Morii16a, ) was significantly above that expected from nova theory due to its 2 keV low energy threshold, while the Swift monitoring of the recurrent nova M31N 2008-12A(Kato16a, ) was optimized for a nova with an hours-long X-ray flash at a luminosity comparable to that of YZ Ret, and would likely have missed shorter duration flashes of a similar brightness.
With the successful detection of the flash of YZ Ret by SRG/eROSITA, the existence of X-ray flashes has now been observationally confirmed. Based on estimates for the Galactic nova rate(kishalay2021, ), eROSITA is expected to detect at most 1–2 of such events during its 4 year survey phase. The eROSITA data provide the last link of the predicted photospheric lightcurve evolution, since the initial UV flashes and all post-maximum phases have been detected. Therefore, our detection also adds the missing piece to measure the total nova energetics and completes the whole picture of the photospheric evolution of the thermonuclear runaway.
Methods
eROSITA data reduction
The eROSITA data analysis was performed with eSASS v201009, the official analysis software of eROSITA. We exclude data of telescope modules 5 and 7 that are contaminated by a light-leak. Images were extracted using evtool and lightcurves and spectra using srctool, selecting all valid patterns and a symmetric PSF with no further event flagging. The data products of the flash are extracted for the time range with a fractional exposure . We use a source radius of for the extraction of the X-ray flash data, and for the data taken during the supersoft phase half a year later. In both cases we subtract a background spectrum, accumulated from an annulus of radii and around the source position. Throughout this paper, absorption modeling assumes the wilm abundances for the interstellar medium(Wilms00a, ) and vern cross-sections(Verner96a, ).
Quantitative modeling of the spectra observed by eROSITA
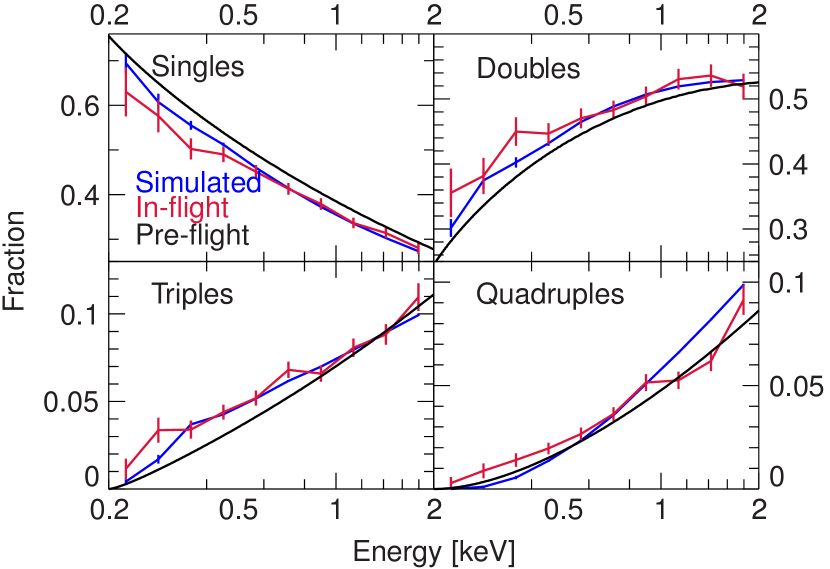
The major complexity in the modeling of the eROSITA data is the so-called pile-up that is caused by the high photon flux of the source(Ballet99a, ; Davis01a, ; Dauser19a, ; Tamba22a, ). When an X-ray photon impacts a charged-coupled device (CCD) it creates a cloud of electrons in the semiconductor. These electrons are then collected in one or multiple detector pixels. During detector read-out, charge below a certain threshold is discarded. The initial step of the event reconstruction in the event processing pipelines reconstructs the events from the measured charge distribution. Depending on the number of pixels in which charge is detected during one read-out cycle, events are classified into four patterns: singles, i.e., only one pixel contains charge, doubles, triples, and quadruples. Because the charge cloud size is energy-dependent, and because of thresholding effects, the relative fraction of each of these pattern types depends on energy.
Virtually all currently operating imaging X-ray telescopes are designed to operate in single-photon mode, which allows direct reconstruction of the energy of each incident photon. For a moderate photon rate, the processing algorithm can correctly identify the patterns and reconstruct the original photon energy from the summed charges. For bright sources, however, multiple photons can hit the same or neighboring pixels during one readout cycle. In the extreme case the illuminated pixels produce extended charge distributions that can be discarded in the event reconstruction, leading to a complete loss of the signal, and a depression in brightness at the center of the source (see Fig. 1 and Extended Data Fig. 2). For many other cases, however, the charge pattern deposited in the sensor by multiple photons cannot be distinguished from that deposited by a single photon that has a higher energy(Ballet99a, ; Davis01a, ). As a result the reconstructed count rate is reduced and the spectral shape is hardened (see Fig. 3).
Because pile-up is strongly dependent on the source flux and spectral shape, the typical forward-fitting approach of X-ray astronomy where detector effects are modeled solely through a linear response matrix (lampton76, ) is not applicable. An additional problem in the case of eROSITA’s slew observations is that the pile-up is time-dependent because vignetting degrades the point-spread function (PSF) at the edge of the field-of-view (FOV). As a result, photons are distributed over a larger number of pixels when the source enters and leaves the FOV, resulting in less pile-up at the beginning and end of the slew observation. This complexity also makes an excising of the PSF core, which is a common mitigation approach for moderate pile-up in pointed observations, unpractical for the eROSITA slew.
SIXTE(Dauser19a, ), the official eROSITA end-to-end simulator, is capable of modeling the charge cloud, vignetting, and event reconstruction during slew observations (see refs.(Townsley02a, ; Tamba22a, ) for similar approaches). Comparison between existing on-ground and in-flight eROSITA calibration measurements shows that the pre-flight PSF and vignetting data reproduce the observations well. Since the pile-up behavior of the detector is sensitively dependent on the charge cloud size, the largest uncertainty in our simulation lies in the charge cloud model. SIXTE models the charge cloud as a 2D rotationally symmetric Gaussian distribution, where the charge fraction in the detector pixel is . is the impact position of the photon, the total generated charge, and the standard deviation of the Gaussian charge cloud(Dauser19a, ). Because the distribution of events in the real detector is energy-dependent, can be determined from the measured pattern fractions. To this end, we derive the in-orbit energy-dependent pattern fraction based on a large number of eROSITA slew observations of bright Active Galactic Nuclei. Only events from the source regions are included, as the particle background affects the low and high energies (due to the abrupt reduction in effective area above the Au M-edge of eROSITA’s mirror system). Thus, we can empirically determine by minimizing the simulation against the calibration curve in the 0.2–2 keV range. The best-fit can be found at . The resulting pattern fractions are shown in Extended Data Fig. 3, indicating that SIXTE can reproduce the eROSITA in-flight pattern fractions at an accuracy of a few percent in the energy range relevant here.
Spectral fitting with SIXTE
For a given spectral model, which is characterized by a constant flux and parameters such as the temperature, and modeling the foreground absorption using interstellar medium abundances(Wilms00a, ), a sufficiently large number of Monte Carlo realizations is averaged to minimize the statistical noise in the simulated piled-up spectra. We compute such model observations on a dense grid of spectral parameters using SIMPUT v2.5.0, SIXTE v2.7.0, and the eROSITA instrument files v1.9.1. For each grid point we simulate 1,000 slews (corresponding to an effective exposure time of 31.5 ks) using the attitude file of the SRG spacecraft and the optical position of the source (). We then compare the simulated spectra against the measured data, varying the parameters to minimize the -statistics. This approach allows us to derive the parameter uncertainties from the -contours (Extended Data Fig. 4). We estimate that due to the uncertainties inherent to the charge cloud modeling, systematic errors of 10% will dominate the final error budget. This systematic uncertainty is incorporated into the error propagation.
The simulation is accurate enough to determine the black body or atmosphere temperature to a relative uncertainty of and the flux to (see Extended Data Table 1). We emphasize that due to our fitting approach and remaining uncertainties in the SIXTE pile-up model and other calibration data, the modeling is dominated by systematic uncertainties. Our approach also allows us to simulate the piled-up lightcurve and sky image, which are both very similar to the measurement (Extended Data Fig. 2). The fact that we can reproduce the piled-up image, lightcurve, and spectrum with a reasonable set of parameters shows that SIXTE is indeed capable of adequately modeling the very strong pile-up of this source.
Atmosphere model
The plane-parallel atmosphere model assumes hydrostatic and local thermodynamical equilibrium with abundances of hydrogen and helium fixed to the solar value. We include the relevant heavier elements at an abundance of half of the solar value. Photoionisation cross-sections are computed for the ground(Verner96a, ), and excited energy states(Seaton94a, ). In total, we consider bound-bound transitions predominantly placed in the UV and soft X-ray energy bands(Dere97a, ). The atmosphere model is computed in the range – () at a step size of 25 kK (2.2 eV). The second free parameter, the surface gravity, is fixed to throughout this paper, where is the surface gravity corresponding to the Eddington luminosity at a given effective temperature(Suleimanov13a, ). Since we do not consider the line-driven wind arising in the upper layers of the atmospheres (Suleimanov13a, ), the atmospheric parameters derived from the spectral model should only be considered a first approximation. Note, however, that the systematic uncertainties due to the treatment of pile-up preclude a more detailed analysis using more physically motivated models.
Multi-wavelength data
For the optical lightcurve of YZ Ret, we use complementary V-band (Å, Å) and g-band (Å, Å) data from the All-Sky Automated Survey for Supernovae (ASAS-SN)(Kochanek17a, ), V-band and visual (human eye, Å) CCD data from the American Association of Variable Star Observers (AAVSO).
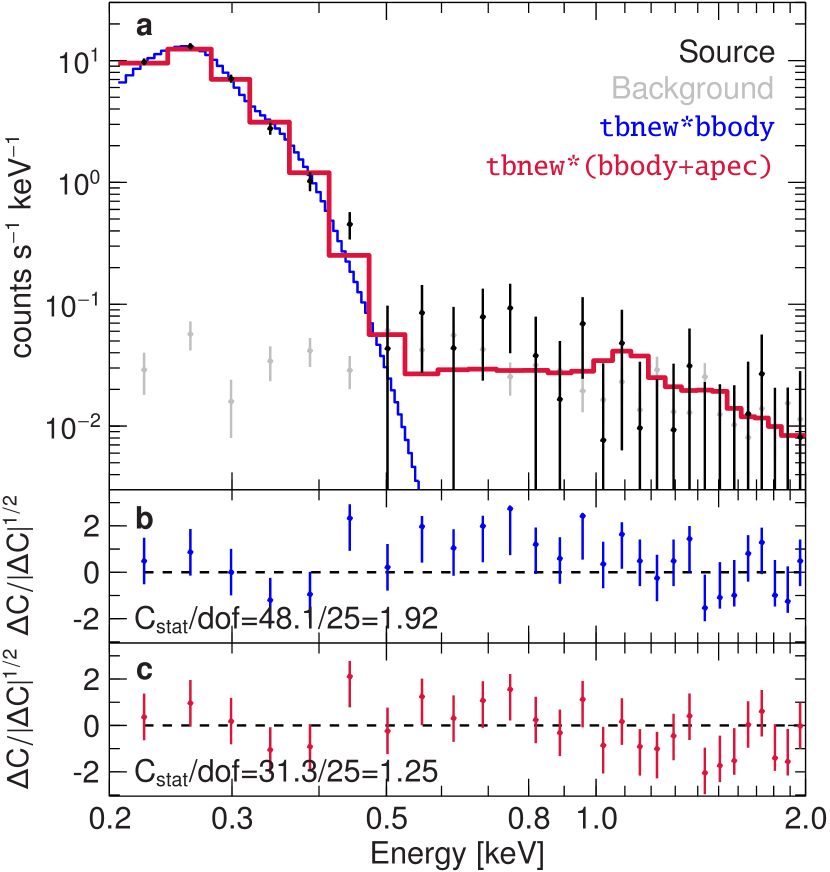
The first X-ray measurement following the eROSITA observations was taken only at with Swift XRT, when the nova entered the supersoft state. We reduced the XRT spectra with HEASOFT v6.26, using xselect v2.4k. A source extraction radius of for data taken in the photon counting (PC) mode and the same background region as for eROSITA was used. We limited the PC and windowed timing mode spectra to the 0.35–10 keV energy range and modeled the spectra with an absorbed black body of 30–40 eV and, when applicable, a thermal plasma model of (see also ref.(Sokolovsky20b, )). At the X-ray flux of YZ Ret was (0.3–10 keV, see Fig. 2, which also includes complementary data from NICER(Pei20a, ), Chandra(Drake20a, ) and NuSTAR(Sokolovsky20a, )). The subsequent outburst behavior is fully consistent with the picture of a nova in the supersoft source state.
We extracted the 0.1–300 GeV Fermi/LAT(Atwood09a, ) daily binned lightcurve using the Sciencetools (v1.2.23) and fermipy (v0.20.0)(WoodFermipy17, ). The region of interest is centered on the eROSITA position of YZ Ret, with SOURCE class events being selected and quality cuts being applied (DATA_QUAL0 && LAT_CONFIG==1). Events with zenith angles were discarded. We used the P8R3_SOURCE_V2 response for the extraction and gll_iem_v07 and iso_P8R3_SOURCE_V2_v1 to model the Galactic diffusion and the isotropic diffusion emission, respectively. Datapoints with are given as upper limits.
Expected rate of nova detections with eROSITA
To estimate the expected number of nova detections during the eROSITA survey, we use Monte Carlo simulations. Based on the Galactic rate(kishalay2021, ) of , we generate nova outburst times and nova positions. These are uniformly distributed within of the Galactic plane. We then use the as-flown attitude of eROSITA for the year 2021 to determine the nova outbursts that would have been detected during that year. In order to derive an upper limit for the detection rate, we assume that all novae that pass through the field of view are detected, i.e., we ignore the potentially severe effects of Galactic absorption at lower Galactic latitudes, distance effects, and the softening of the emitted radiation during the X-ray flash. To accumulate statistics, we repeat this exercise for 10,000 times. We find that the probability of having one detection per year is 8.6% for X-ray flash durations of 3,600 s, the probability of having two detections per year is 0.4%. The detection probability drops to 2.6% for one detection per year and a flash duration of 1,000 s. Increasing the nova rate to 100 per year and assuming a 3,600 s flash duration, the annual detection probability increases to 16%. We therefore expect at most two detections of short X-ray flashes for the four years of the eROSITA survey.
Acknowledgments This work is based on data from eROSITA, the soft X-ray instrument aboard SRG, a joint Russian-German science mission supported by the Russian Space Agency (Roskosmos), in the interests of the Russian Academy of Sciences represented by its Space Research Institute (IKI), and the Deutsches Zentrum für Luft- und Raumfahrt (DLR). This work was supported by the Bundesministerium für Forschung und Technologie under DLR grants 50 QR 1603, 50 QR 2103, and 50 QR 2104. GS acknowledges support from the Spanish MINECO grant PID2020-117252GB-I00. VS thanks the Deutsche Forschungsgemeinschaft (DFG) for financial support (WE1312/53-1). This research has made use of ISIS functions (ISISscripts) provided by ECAP/Remeis observatory and MIT (http://www.sternwarte.uni-erlangen.de/isis/). We acknowledge with thanks the variable star observations from the AAVSO International Database contributed by observers worldwide and used in this research. This version of the article has been accepted for publication, after peer review but is not the Version of Record and does not reflect post-acceptance improvements, or any corrections. The Version of Record is available online at: http://dx.doi.org/10.1038/s41586-022-04635-y. Use of this Accepted Version is subject to the publisher’s Accepted Manuscript terms of use https://www.springernature.com/gp/open-research/policies/accepted-manuscript-terms.
Author contributions R.A. identified the original event. The eROSITA near real time analysis was developed by I.K., A.R., and P.W., the final data extraction and reduction was performed by O.K., J.W., R.A., S.H., A.Ma., including calibration information from K.D.. The pattern fraction analysis for SIXTE was performed by O.K., S.H., T.D., and K.D.. SIXTE is being developed by T.D., C.K., M.L., O.K., and J.W.. The interpretation of the result was done by O.K., J.W., G.S., A.Me., A.Ma., T.D., K.W., V.D., A.S., F.H., and R.A.. The white dwarf atmosphere models are provided by V.S., T.R., and K.W.. The manuscript was written by O.K., J.W.. J.W. and A.S. acquired funding for this work.
Data Availability SIMPUT files for the best-fit model and calibrated eROSITA products of the observation are available from https://erosita.mpe.mpg.de/specialreleases/.
Code Availability The SIXTE code and eROSITA instrument files are publicly available at https://www.sternwarte.uni-erlangen.de/research/sixte/. The eROSITA analysis software, eSASS, is available at https://erosita.mpe.mpg.de/.
Competing Interests The authors declare no competing interests.
Material and Correspondence Requests for data and correspondence should be sent to O. König or J. Wilms.
Extended Data
| Model | tbnew*bbody | tbnew*atmos | tbnew*apec |
|---|---|---|---|
| [eV] | 25.9 | ||
| Absorption111Equivalent hydrogen column density in units of cm-2. | 0.1 (fixed) | 1.7 | |
| Absorbed flux222Absorbed flux in units of in 0.2–10 keV. | |||
| Luminosity [] | |||
| Radius [km] | |||
| Notes | Solar abundances | ||
| \botrule |
Uncertainties are given at the confidence level for one parameter of interest.
References
- (1) Chomiuk, L., Metzger, B. D. & Shen, K. J. New Insights into Classical Novae. Annu. Rev. Astron. Astrophys. 59 (2021).
- (2) Starrfield, S., Iliadis, C. & Hix, W. R. The Thermonuclear Runaway and the Classical Nova Outburst. Publ. Astron. Soc. Pacific 128, 051001 (2016).
- (3) Hillman, Y., Prialnik, D., Kovetz, A., Shara, M. M. & Neill, J. D. Nova multiwavelength light curves: predicting UV precursor flashes and pre-maximum halts. Mon. Not. R. Astron. Soc. 437, 1962–1975 (2014).
- (4) Starrfield, S., Truran, J. W., Sparks, W. M., Krautter, J. & MacDonald, J. Soft x-ray emission from classical novae in outburst. In Physics of Classical Novae (eds. Cassatella, A. & Viotti, R.) 306–310 (Springer Verlag, Berlin, Heidelberg, 1990).
- (5) Krautter, J. The Super-soft Phase in Novae. In RS Ophiuchi (2006) and the Recurrent Nova Phenomenon (eds. Evans, A., Bode, M. F., O’Brien, T. J. & Darnley, M. J.), vol. 401 of Astron. Soc. Pacific Conf. Ser., 139 (Astron. Soc. Pacific, San Francisco, 2008).
- (6) Kato, M., Saio, H. & Hachisu, I. Multi-wavelength Light Curve Model of the One-year Recurrence Period Nova M31N 2008-12A. Astrophys. J. 808, 52 (2015).
- (7) Kato, M. et al. X-ray Flashes in Recurrent Novae: M31N 2008-12a and the Implications of the Swift Nondetection. Astrophys. J. 830, 40 (2016).
- (8) Morii, M., Yamaoka, H., Mihara, T., Matsuoka, M. & Kawai, N. Search for soft X-ray flashes at the fireball phase of classical/recurrent novae using MAXI/GSC data. Publ. Astron. Soc. Japan 68, S11 (2016).
- (9) Predehl, P. et al. The eROSITA X-ray telescope on SRG. Astron. & Astrophys. 647, A1 (2021).
- (10) Sunyaev, R. et al. SRG X-ray orbital observatory. Its telescopes and first scientific results. Astron. & Astrophys. 656, A132 (2021).
- (11) McNaught, R. H. Apparent Nova in Reticulum. CBET 4811 (2020).
- (12) Aydi, E. et al. SALT spectroscopic classification of MGAB-V207 as a classical nova. ATEL 13867 (2020).
- (13) Carr, A., Said, K., Davis, T. M., Lidman, C. & Tucker, B. E. WiFeS follow-up observations of the naked-eye nova associated to MGAB-V207. ATEL 13874 (2020).
- (14) McNaught, R. H. Nova Reticuli 2020. CBET 4812 (2020).
- (15) Sokolovsky, K. V. et al. NuSTAR detection of Nova Reticuli 2020 = MGAB-V207. ATEL 13900 (2020).
- (16) Li, K.-L. et al. Fermi-LAT detection of the naked-eye classical nova MGAB-V207. ATEL 13868 (2020).
- (17) Sokolovsky, K. V.. et al. The first nova eruption in a novalike variable: YZ Ret as seen in X-rays and -rays. Mon. Not. R. Astron. Soc. 514, 2239–2258 (2022).
- (18) Kilkenny, D. et al. The Edinburgh-Cape Blue Object Survey - IV. Zone 3: Galactic latitudes . Mon. Not. R. Astron. Soc. 453, 1879–1887 (2015).
- (19) Schaefer, B. E. Discovery of 13 New Orbital Periods for Classical Novae. Res. Notes American Astron. Soc. 5, 150 (2021).
- (20) Dauser, T. et al. SIXTE: a generic X-ray instrument simulation toolkit. Astron. & Astrophys. 630, A66 (2019).
- (21) Smith, R. K., Brickhouse, N. S., Liedahl, D. A. & Raymond, J. C. Collisional Plasma Models with APEC/APED: Emission-Line Diagnostics of Hydrogen-like and Helium-like Ions. Astrophys. J. 556, L91–L95 (2001).
- (22) Suleimanov, V. F., Mauche, C. W., Zhuchkov, R. Y. & Werner, K. Fitting the Chandra LETG Spectrum of SS Cygni in Outburst with Model Atmosphere Spectra. In 18th European White Dwarf Workshop. (eds. Krzesiński, J., Stachowski, G., Moskalik, P. & Bajan, K.), vol. 469 of Astron. Soc. Pacific Conf. Ser., 349 (Astron. Soc. Pacific, San Francisco, 2013).
- (23) Suleimanov, V., Hertfelder, M., Werner, K. & Kley, W. Modeling the EUV spectra of optically thick boundary layers of dwarf novae in outburst. Astron. & Astrophys. 571, A55 (2014).
- (24) Izzo, L. et al. UVES observations of Nova Reticuli 2020 during Minimal Science Operations show it is entering the nebular phase. ATEL 14048 (2020).
- (25) José, J. & Hernanz, M. Nucleosynthesis in Classical Novae: CO versus ONe White Dwarfs. Astrophys. J. 494, 680–690 (1998).
- (26) Aydi, E. et al. Early Spectral Evolution of Classical Novae: Consistent Evidence for Multiple Distinct Outflows. Astrophys. J. 905, 62 (2020).
- (27) Bédard, A., Bergeron, P. & Fontaine, G. Measurements of Physical Parameters of White Dwarfs: A Test of the Mass-Radius Relation. Astrophys. J. 848, 11 (2017).
- (28) Sokolovsky, K. et al. Super-soft X-ray emission of Nova Reticuli 2020. ATEL 14043 (2020).
- (29) Kato, M., Saio, H. & Hachisu, I. A Self-consistent Model for a Full Cycle of Recurrent Novae—Wind Mass-Loss Rate and X-Ray Luminosity. Astrophys. J. 838, 153 (2017).
- (30) Cao, Y. et al. Classical Novae in Andromeda: Light Curves from the Palomar Transient Factory and GALEX. Astrophys. J. 752, 133 (2012).
- (31) Pietsch, W., Sala, G., Haberl, F. & Greiner, J. Detection of nova M31N 2007-07c with Swift UVOT in the UVW2 filter. ATEL 1149 (2007).
- (32) De, K. et al. A Population of Heavily Reddened, Optically Missed Novae from Palomar Gattini-IR: Constraints on the Galactic Nova Rate. Astrophys. J. 912, 19 (2021).
- (33) Wilms, J., Allen, A. & McCray, R. On the Absorption of X-Rays in the Interstellar Medium. Astrophys. J. 542, 914–924 (2000).
- (34) Verner, D. A., Ferland, G. J., Korista, K. T. & Yakovlev, D. G. Atomic Data for Astrophysics. II. New Analytic FITS for Photoionization Cross Sections of Atoms and Ions. Astrophys. J. 465, 487 (1996).
- (35) Ballet, J. Pile-up on X-ray CCD instruments. Astron. Astrophys. Supp. 135, 371–381 (1999).
- (36) Davis, J. E. Event Pileup in Charge-coupled Devices. Astrophys. J. 562, 575–582 (2001).
- (37) Tamba, T. et al. Simulation-based spectral analysis of X-ray CCD data affected by photon pile-up. Publ. Astron. Soc. Japan 74, 364–383 (2022).
- (38) Lampton, M., Margon, B. & Bowyer, S. Parameter estimation in X-ray astronomy. Astrophys. J. 208, 177–190 (1976).
- (39) Townsley, L. K. et al. Simulating CCDs for the Chandra Advanced CCD Imaging Spectrometer. Nucl. Inst. Methods Phys. Res. A 486, 716–750 (2002).
- (40) Seaton, M. J., Yan, Y., Mihalas, D. & Pradhan, A. K. Opacities for stellar envelopes. Mon. Not. R. Astron. Soc. 266, 805 (1994).
- (41) Dere, K. P., Landi, E., Mason, H. E., Monsignori Fossi, B. C. & Young, P. R. CHIANTI - an atomic database for emission lines. Astron. Astrophys. Suppl. 125, 149–173 (1997).
- (42) Kochanek, C. S. et al. The All-Sky Automated Survey for Supernovae (ASAS-SN) Light Curve Server v1.0. Publ. Astron. Soc. Pacific 129, 104502 (2017).
- (43) Pei, S. et al. NICER observations of Nova Ret 2020. ATEL 14067 (2020).
- (44) Drake, J. J. et al. Chandra high resolution X-ray spectroscopy of Nova Ret 2020. ATEL 14214 (2020).
- (45) Atwood, W. B. et al. The Large Area Telescope on the Fermi Gamma-Ray Space Telescope Mission. Astrophys. J. 697, 1071–1102 (2009).
- (46) Wood, M. et al. Fermipy: An open-source Python package for analysis of Fermi-LAT Data. In 35th International Cosmic Ray Conference (ICRC2017), vol. 301 of International Cosmic Ray Conference, 824 (2017).
- (47) Dennerl, K. et al. Determination of the eROSITA mirror half energy width (HEW) with subpixel resolution. In Space Telescopes and Instrumentation 2012: Ultraviolet to Gamma Ray (eds. Takahashi, T., Murray, S. S. & den Herder, J.-W. A.), vol. 8443 of Society of Photo-Optical Instrumentation Engineers Conf. Ser., 844350 (SPIE, Amsterdam, Netherlands, 2012).
- (48) Cash, W. Parameter estimation in astronomy through application of the likelihood ratio. Astrophys. J. 228, 939–947 (1979).