11email: prajwel.pj@gmail.com 22institutetext: Indian Institute of Astrophysics, Bangalore 560034, India 33institutetext: Faculty of Physics, Ludwig-Maximilians-Universität, Scheinerstr. 1, Munich 81679, Germany
Active galactic nucleus feedback in NGC 3982
The energetic feedback from supermassive black holes can influence star formation at the centres of galaxies. Observational evidence for active galactic nucleus (AGN) impact on star formation can be searched for in galaxies by combining ultraviolet imaging and optical integral field unit data. The ultraviolet flux directly traces recent star formation, and the integral field unit data can reveal dust attenuation, gas ionisation mechanisms, and gas kinematics from the central regions of the galaxy disk. A pilot study on NGC 3982 shows star formation suppression in the central regions of the galaxy, likely due to negative AGN feedback, and enhanced star formation in the outer regions. The case of NGC 3982 could be observational evidence of AGN feedback operating in a Seyfert galaxy.
Key Words.:
ultraviolet: galaxies – galaxies: individual: NGC 3982 – galaxies: active – galaxies: star formation1 Introduction
Galaxies in the local Universe host supermassive black holes (SMBHs) with masses 106 M⊙ at their centres, which can accrete large amounts of gas from the immediate vicinity (Kormendy & Ho, 2013). The accretion changes the SMBH and the host galaxy to an active galactic nucleus (AGN) phase with a net effect of energy release in the form of radiation, jets, and outflows. The energy output can heat the cold molecular gas and increase the turbulence, suppressing star formation and regulating the gas accretion onto the SMBH. This self-regulating process is termed AGN feedback. It is believed to be an important aspect of galaxy formation and evolution, with various pieces of observational evidence supporting it as a star formation quenching pathway for galaxies (see Fabian 2012 and Morganti 2017 for reviews). Active galactic nucleus feedback is included in galaxy simulations to match observed galaxy properties (Springel et al., 2005; Di Matteo et al., 2005; Somerville et al., 2008; Beckmann et al., 2017). While it may be anticipated that this feedback results in the suppression of star formation (negative AGN feedback) due to the copious amount of energy released by the AGN, there is also the inverse case of positive feedback, where star formation is triggered due to AGN activity (Zinn et al., 2013).
Although evidence for AGN feedback is available, direct observations of its influence on star formation in the local Universe remain limited. One reason for the scarcity of direct observations could be that AGN luminosities vary considerably during a typical star-forming episode, and the effect of feedback on star formation may not be readily apparent (Hickox et al., 2014). Such variability can give rise to situations where even if a galaxy’s star formation were affected by AGN activity, the corresponding signatures of a strong AGN could have become undetectable. Similarities in star formation efficiencies between Seyfert and inactive local galaxies have been found by Rosario et al. (2018); while this observation may suggest that the AGN activity does not affect star formation efficiencies in AGN host galaxies, it is also possible that the AGN could have been active in the past in inactive galaxies. In studies where the sample of galaxies is selected by AGN activity, it may be challenging to obtain a correlation between the highly variable activity of AGN feedback and star formation that takes place on a relatively long timescale.
However, there may exist galaxies that hosted AGN in the recent past, where we can directly probe the evidence of AGN activity affecting star formation. If we can find such galaxies and study recent star formation in the central regions and its connection to any recent AGN activity, it may lead to a better understanding of the complex relationship of AGN feedback with star formation. Such studies might make it possible to find relatively smoothly time-variable parameters connected to AGN feedback and explore their relationship with star formation as a proxy to unravel how AGN feedback transforms the galaxy.
Among the observations of AGN feedback affecting star formation in nearby galaxies, there are cases of both positive and negative feedback. The AGN jet-induced positive feedback is found in Centaurus A, NGC 1275, and Minkowski’s Object (Mould et al., 2000; Canning et al., 2010; Van Breugel et al., 1985). Outflow-induced star formation exists near the nuclear region of NGC 5643 (Cresci et al., 2015). In NGC 7252 and the jellyfish galaxy JO201, AGN activity is proposed to have suppressed star formation in the central region George et al. (2018, 2019). Both positive and negative feedback has been observed in NGC 5728 (Shin et al., 2019). It will be interesting to increase the statistics of galaxies with evidence of AGN feedback on star formation present in the local Universe.
A comprehensive search for observational signatures of AGN feedback on star formation in nearby galaxies could help unravel the complex spatial and temporal relationship of AGN interaction with its host galaxy environment. Since AGN are known to impart energy through radiative (sometimes called quasar or wind) and mechanical modes (also known as radio, kinetic, or jet; Harrison 2017), they leave behind observational signatures that could be identified. The gas around AGN will be ionised by the large energy throughput and produce excitation lines that can be spatially mapped. Similarly, star formation can be suppressed or triggered in the galaxy, which can be observed via the absence or presence of emitted ultraviolet (UV) flux associated with star formation activity.
Integral field unit (IFU) based spectroscopy of a galaxy disk allows us to spatially resolve the excitation mechanisms present in the galaxy; this is particularly useful in identifying the extent of AGN-excited regions. The UV imaging data directly probe recent star formation (¡ 200 Myr, Kennicutt Jr & Evans 2012), and any effect of AGN feedback on the galaxy should be revealed in UV images as reduced flux due to suppressed star formation. Integral field unit observations of nearby galaxies from Mapping Nearby Galaxies at APO (MaNGA) and UV data from the Galaxy Evolution Explorer (GALEX) can be used to check for possible spatial evidence of AGN feedback (Martin et al., 2005; Bundy et al., 2014; Gunn et al., 2006; Drory et al., 2015; Smee et al., 2013).
Our objective is to study the impact of AGN activity on star formation using MaNGA and GALEX data. We created a sample of galaxies with the Sloan Digital Sky Survey (SDSS) optical spectral classifications111https://www.sdss.org/dr17/spectro/catalogs/\#Objectinformation of ‘AGN’ or ‘BROADLINE’. We removed edge-on galaxies from our sample following a visual check of SDSS urz imaging data and selected only those galaxies with both MaNGA and GALEX data. There are 86 galaxies in the sample. NGC 3982 is the nearest face-on galaxy in the sample and was selected for our pilot study, where we demonstrate the feasibility of our project in identifying the effect of AGN activity on star formation. NGC 3982222http://simbad.u-strasbg.fr/simbad/sim-id?Ident=NGC\%203982 (UGC 6918) is a late-type galaxy at z = 0.00371333http://skyserver.sdss.org/dr17/VisualTools/explore/summary?sid=1146264831163131904. NGC 3982 is classified as a Seyfert 1.9 type galaxy based on optical spectra (Véron-Cetty & Véron, 2010). Very-long-baseline interferometry (VLBI) observations of NGC 3982 in 1.7 and 5 GHz reveal that there could be jet or outflow structures on milliarcsecond scales (Bontempi et al., 2012). González-Delgado & Pérez (1993) noted the presence of circum-nuclear star formation in the galaxy. We note that 1 arcsecond in the sky corresponds to 0.076 kpc at a distance of 15.6 Mpc (Wright, 2006).
The paper is organised as follows. Section 2 describes the MaNGA, GALEX, and Very Large Array Sky Survey (VLASS) data used for the study and the associated analysis. We discuss the possibility of AGN feedback in NGC 3982 and provide a summary in Sect. 3. We adopt a flat Universe cosmology with H, , and (Komatsu et al., 2009).
2 Data and analysis
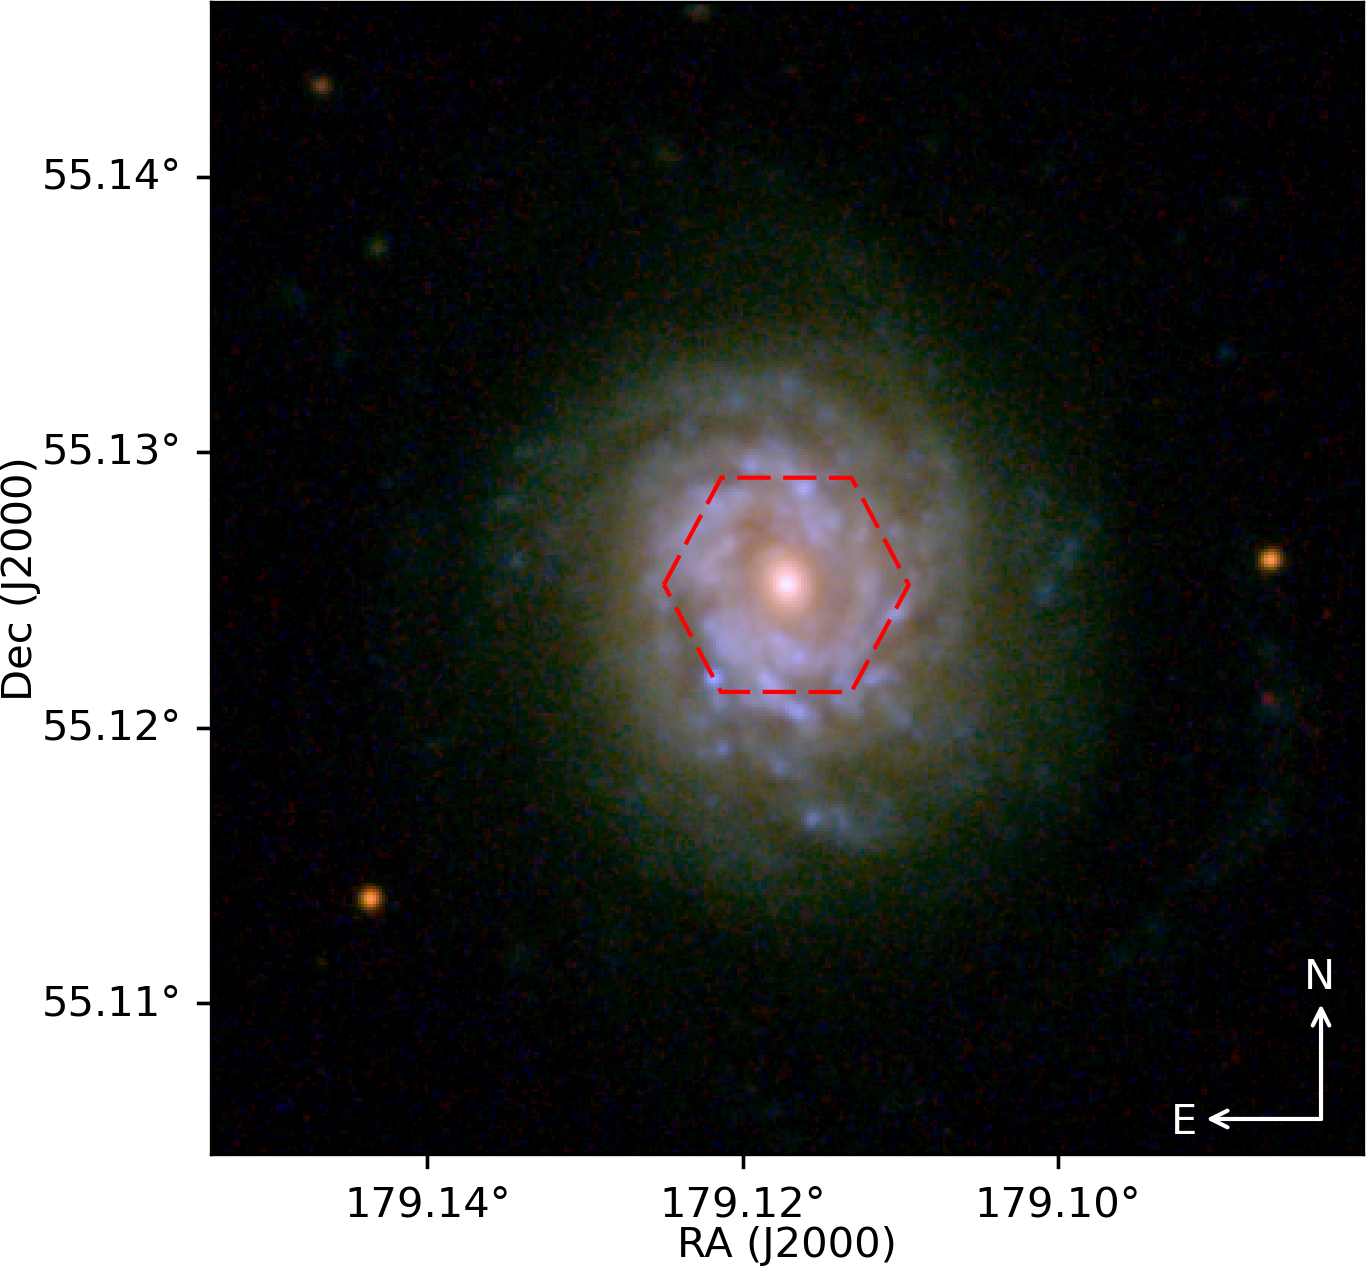
The MaNGA survey observed galaxies up to redshift z 0.03. There are 10010 unique galaxies in the final MaNGA data release, DR17 (Accetta et al., 2022). The reduced MaNGA data have a median angular resolution of 2.54 arcseconds (Law et al., 2016). A detailed description of the MaNGA sample design can be found in Wake et al. (2017). NGC 3982 was observed with a 127-fibre IFU of 32 arcseconds diameter as part of the MaNGA survey (Manga-ID: 1-189584). A summary of a few observed and derived properties of the galaxy is given in Table 1. The SDSS urz colour image cutout of NGC 3982 with the MaNGA IFU hexagonal aperture is shown in Fig. 1.
GALEX was a UV survey mission that had near-ultraviolet (NUV; 5.3 arcseconds full width at half maximum) and far-ultraviolet (FUV; 4.2 arcseconds full width at half maximum) channels (Morrissey et al., 2007). GALEX observed NGC 3982 in the NUV channel for an effective exposure time of 2200 seconds (GALEX tile: GI6_012039_HRS74_75). We accessed the NUV imaging data from the Mikulski Archive for Space Telescopes (MAST) GALEX archive (no FUV data were available). The MaNGA resolution corresponds to 0.193 kpc, and the GALEX NUV resolution is 0.403 kpc at the galaxy’s distance.
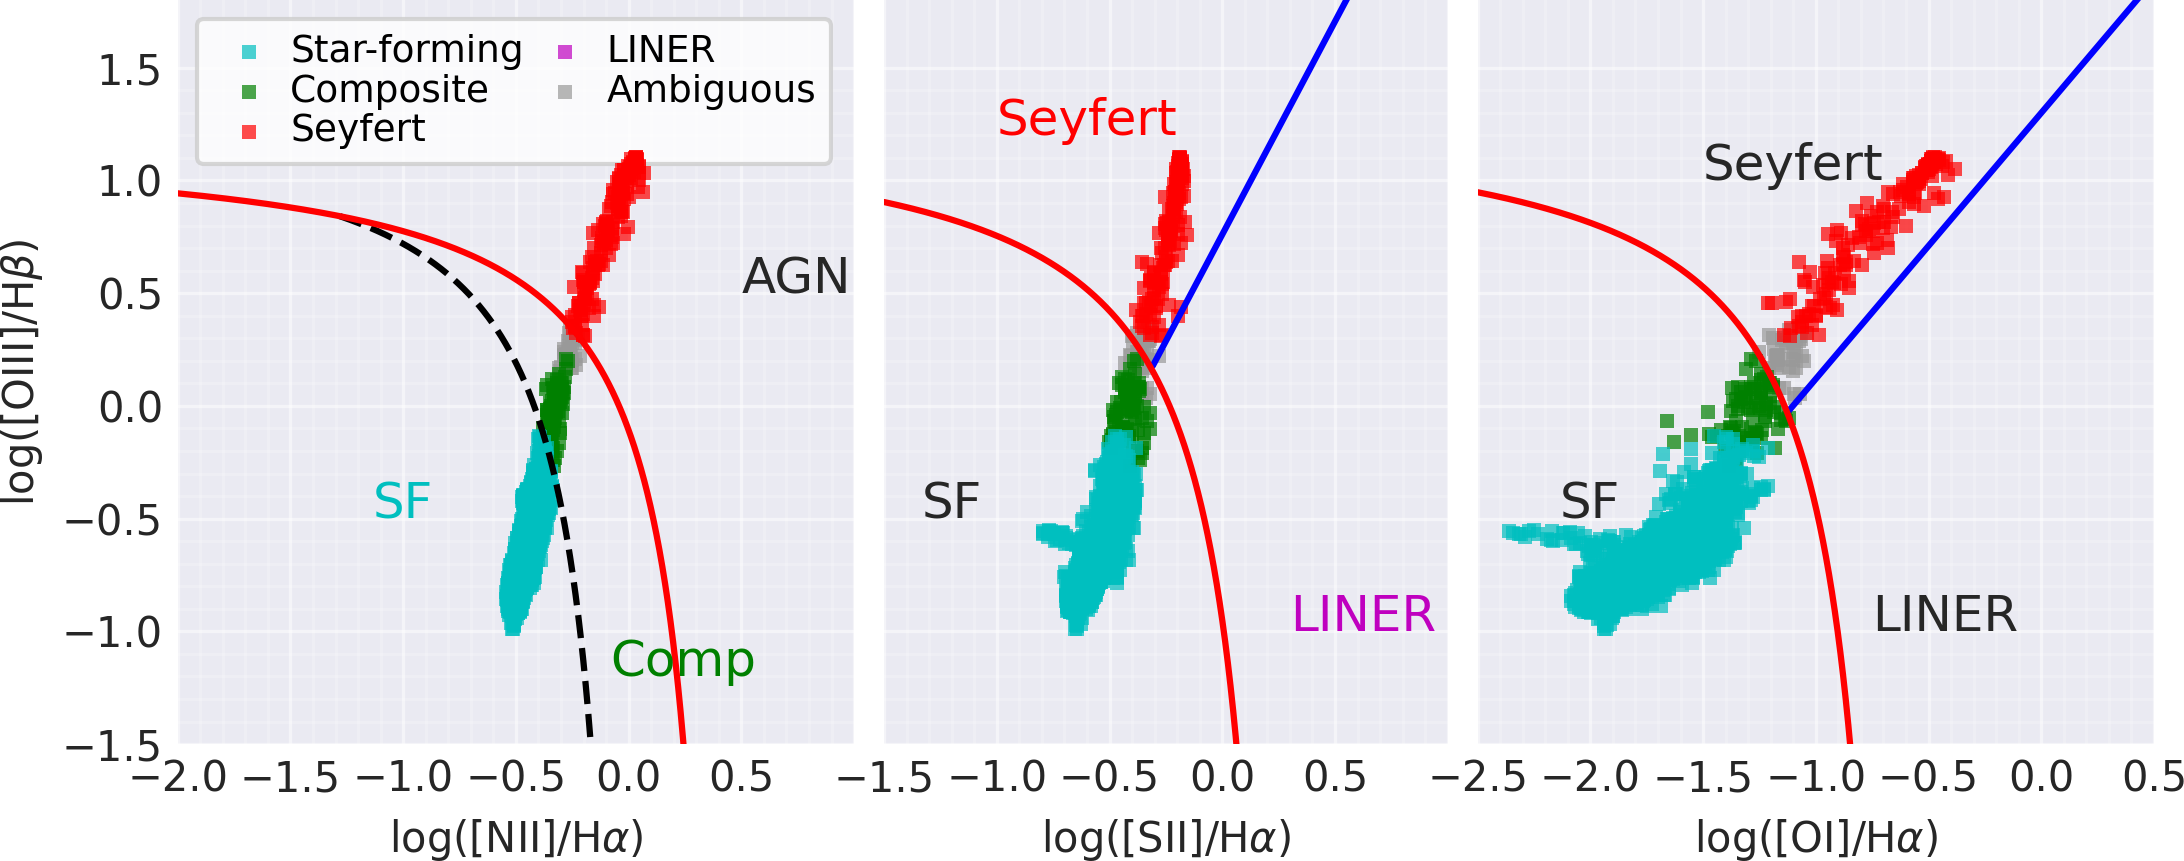
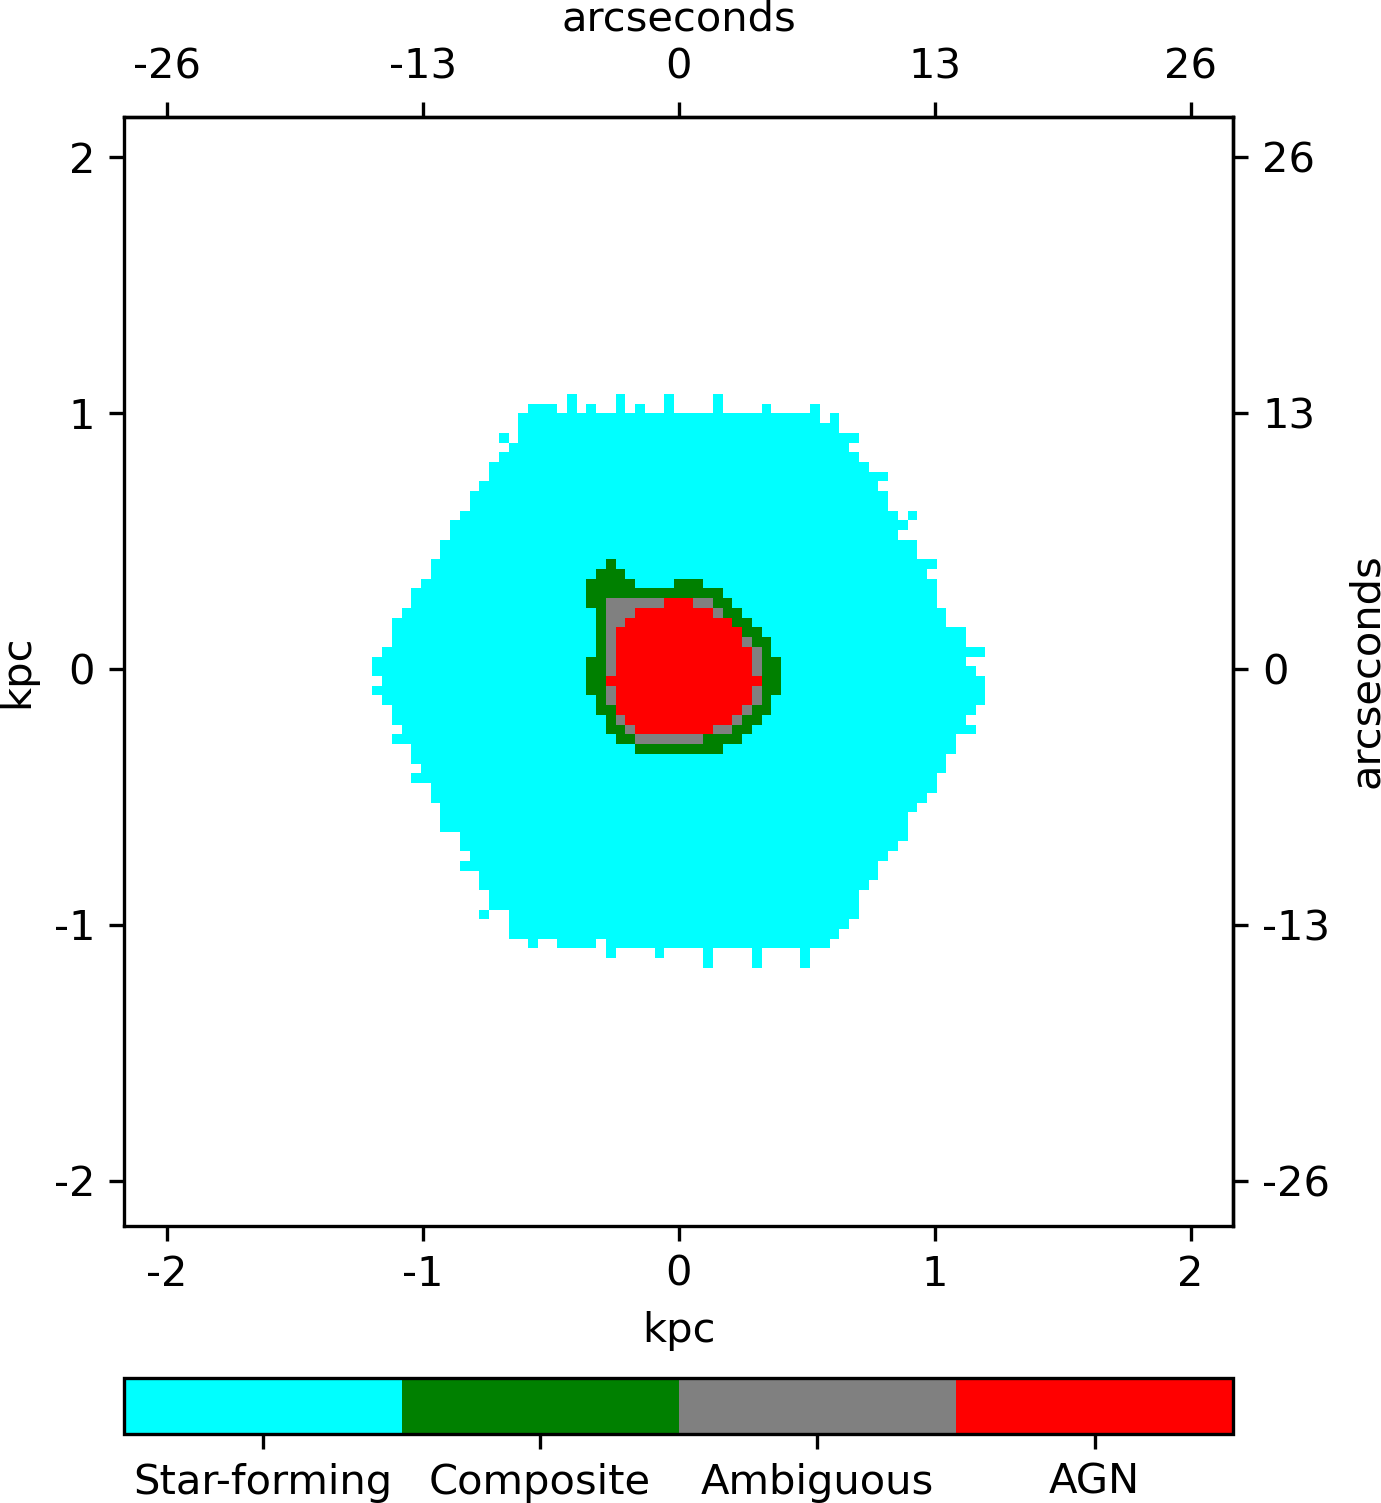
We checked the nature and extent of AGN ionisation in the central region of NGC 3982 as described below. The MaNGA data-analysis pipeline (DAP) generates secondary data products derived from MaNGA spectroscopy (Westfall et al., 2019). The stellar and emission-line kinematics are derived using penalised pixel-fitting (PPXF) software by simultaneously fitting a modified MILES stellar library and Gaussian emission-line templates to the MaNGA spectra (the PPXF software employs a maximum penalised likelihood approach to fit templates to spectra; Cappellari 2017; Westfall et al. 2019; Sánchez-Blázquez et al. 2006; Falcón-Barroso et al. 2011). MaNGA DAP products are accessible through Marvin software (Cherinka et al., 2019). MaNGA DAP-generated maps of Hα, Hβ, , , , and emission line intensities were used in our subsequent analysis. To make a spaxel map of the present gas excitation mechanisms, we created a Baldwin-Phillips-Terlevich (BPT) diagram for NGC 3982 using the get_bpt function of Marvin (Baldwin et al., 1981). Marvin uses the classification system of Kewley et al. (2006) and all three diagnostic criteria from versus , versus , and versus plots. It labels MaNGA spaxels as star-forming (SF), AGN, or composite (AGN + SF). The function marks spaxels as ambiguous when it fails to classify them into one of these three categories. Seyfert galaxy (Seyfert) and low-ionisation narrow emission-line region (LINER) classification is also carried out. A detailed explanation of the function can be found on the Marvin documentation website444https://sdss-marvin.readthedocs.io/en/latest/tools/bpt.html. The generated BPT diagram is shown in Fig. 3, and the on-sky map of spaxel classification in Fig. 3.
We used the GALEX NUV band image to find the spatial distribution of recent star formation. The GALEX NUV image pixel units are in counts per second (CPS), which we converted to flux using the unit conversion factor given in Morrissey et al. (2007):
| (1) |
where is the NUV flux in erg s-1 cm-2 Å-1. The image in CPS units was subtracted for background before flux conversion. The NUV flux was corrected for Galactic extinction by adopting a Cardelli et al. (1989) law with A = 0.0437 (Schlegel et al., 1998) and R = 3.1. The dust present in NGC 3982 can attenuate the observed NUV band fluxes, leading to inaccurate interpretation. Therefore, we need to understand the spatial variation of dust attenuation levels, especially in the galaxy’s central regions. We used the Balmer decrement, the ratio between two H and H emission line flux values, to estimate the dust attenuation. We created the observed Balmer decrement map by calculating the ratio between observed and emission line maps, . Equation 4 from Domínguez et al. (2013) was then used to convert the Balmer decrement to a colour excess map:
| (2) |
where is the colour excess map and is the expected Balmer decrement map without dust attenuation. We used = 3.1 for spaxels falling inside the AGN region of Fig. 3 and 2.86 for the remaining ones (Groves et al., 2012). Finally, we converted the colour excess map to an A map (NUV band attenuation in magnitude) using a Calzetti attenuation law (Calzetti et al., 2000):
| (3) |
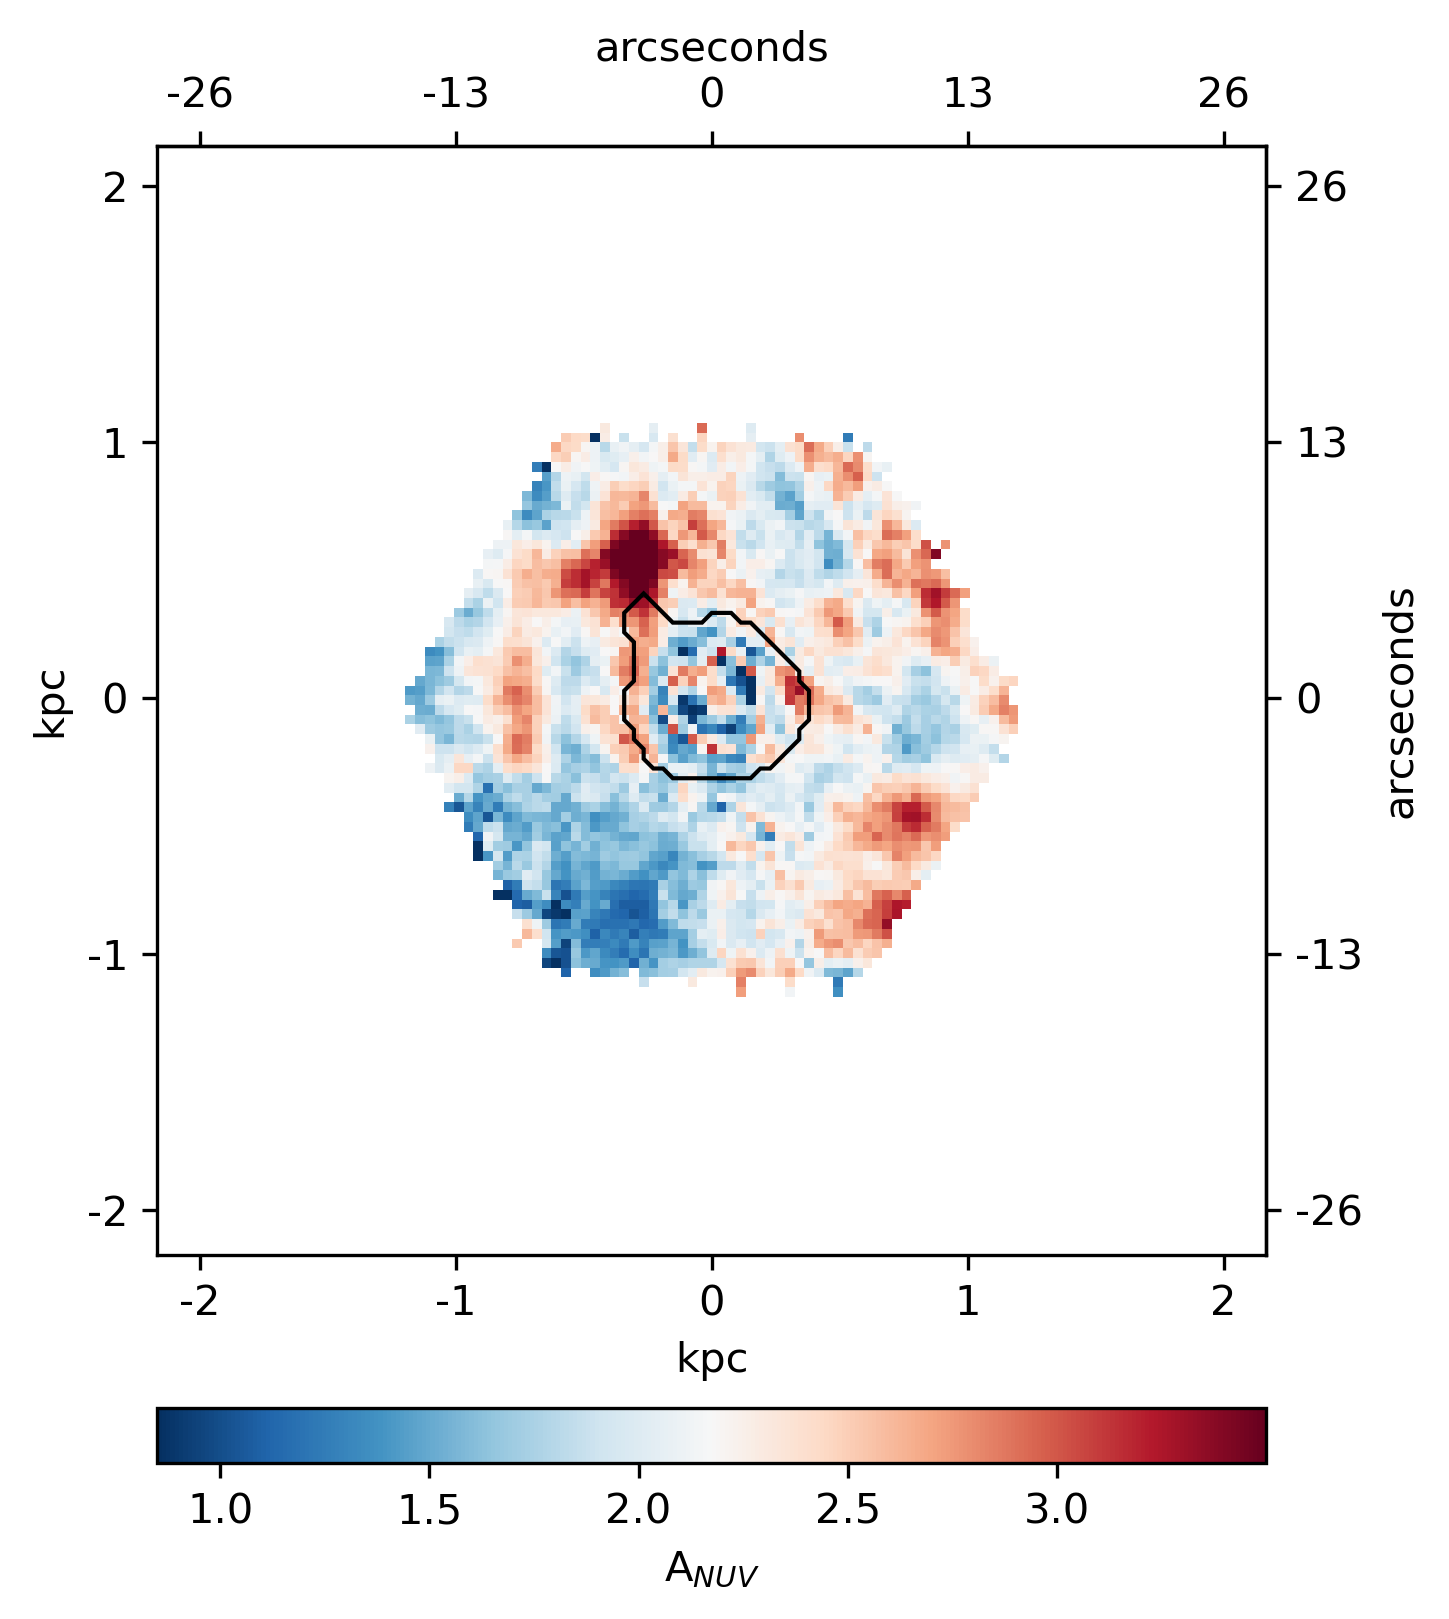
where is the value on the Calzetti reddening curve evaluated at the NUV effective wavelength (2315.7 ). We find from the A map (see Fig. 4) that the outer and central regions have comparable attenuation levels, with a median A value of 2.04 in the central AGN ionised regions and 2.15 in the galaxy disk.
To correct attenuation by dust in NGC 3982, we used the A map. The extinction- and attenuation-corrected NUV flux was calculated using
| (4) |
where is the NUV flux, is the Galactic extinction in the NUV band, and is the extinction- and attenuation-corrected NUV flux. The A map created from the MaNGA data only covers the footprint shown in Fig. 1, which we need to extrapolate to the full galaxy to get the integrated extinction. Therefore, we used the median value of the A map for the full extent of the NUV image of the galaxy. We note that this estimate should be considered a lower limit; it suggests that the flux could be attenuated by at least a factor of 7.2.
The NUV band luminosity, , was calculated using
| (5) |
where D is the distance (see Table 1) and is the attenuation-corrected flux. The NUV band luminosity is in erg s-1. The NUV luminosity was converted to the star formation rate (SFR), assuming constant star formation for 108 yr. Equation 4 from Cortese et al. (2008) was used to derive the SFR from :
| (6) |
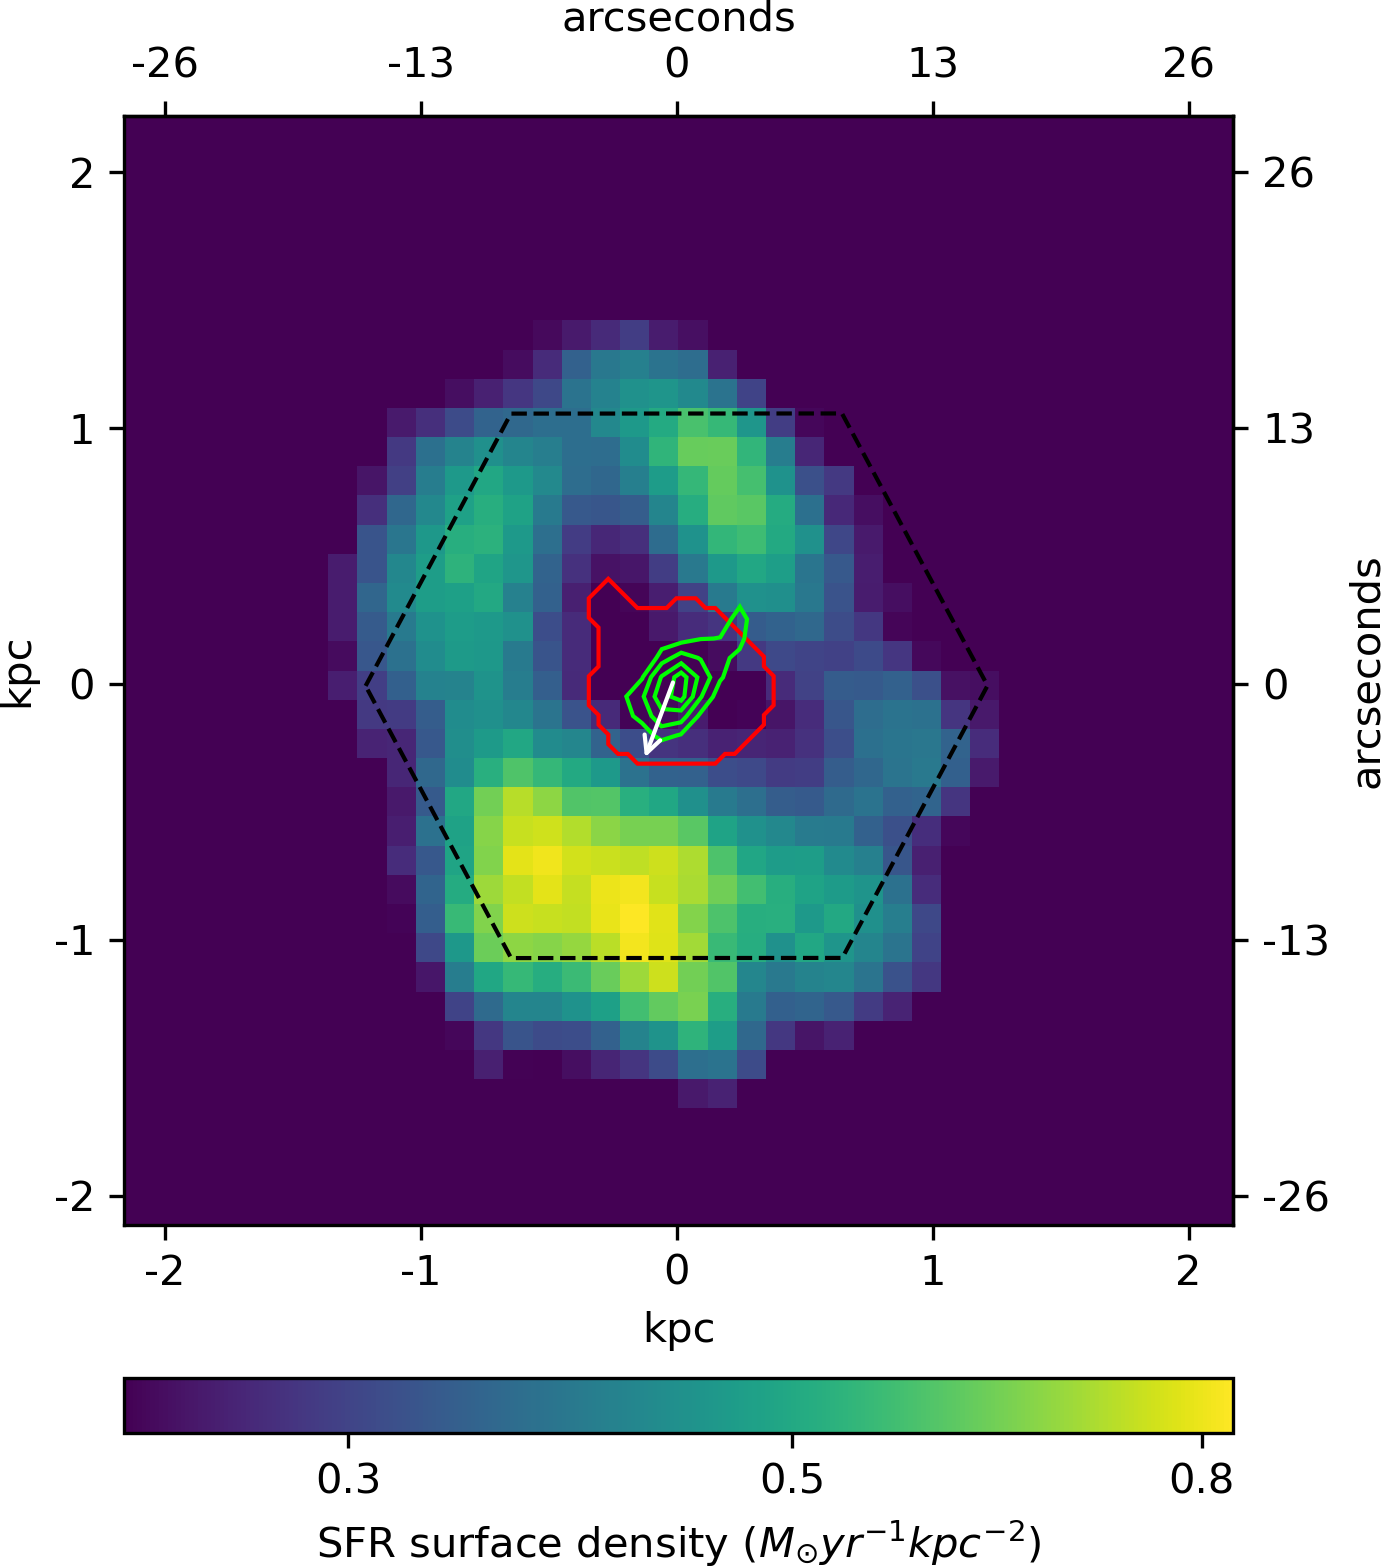
Figure 5 shows the NUV-derived SFR surface map of the galaxy. A boundary contour encompassing the composite and AGN regions from Fig. 3 is overlaid on the figure. Also shown in the figure is the hexagonal aperture footprint of the MaNGA IFU. The cavity region in the centre matches the composite and AGN photoionised region. We estimated the median SFR density observed in the cavity and the ring-shaped region; there is a factor of 2 reduction in the SFR density of the cavity region compared to the ring-shaped region.
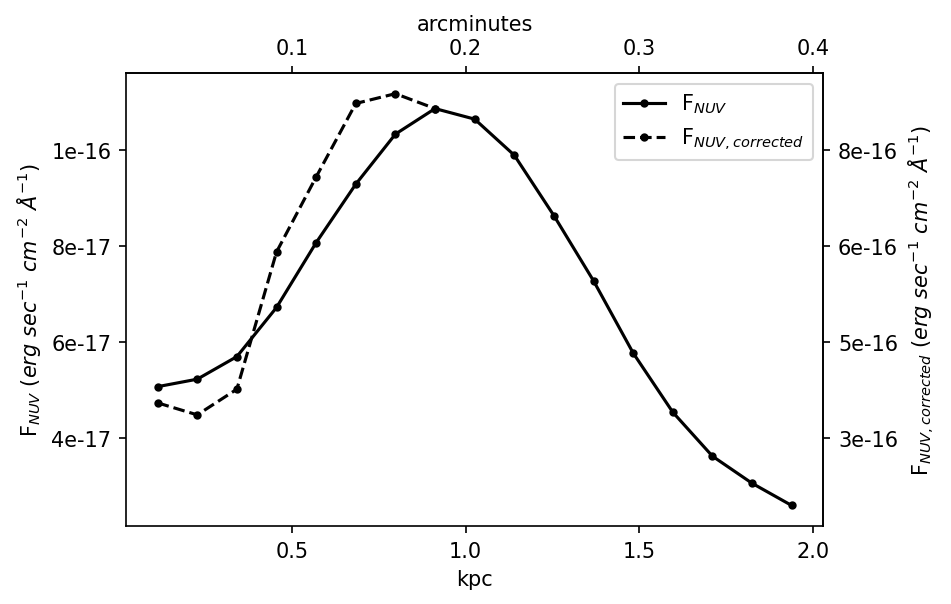
To check whether the lack of a full disk attenuation map of the galaxy affects our interpretation of the observed cavity region in the centre, we created an azimuthally averaged flux profile of the galaxy using the NUV image as follows. The axis ratio and position angle of NGC 3982 were found on the NASA/IPAC Extragalactic Database (NED) website555https://ned.ipac.caltech.edu/byname?objname=ngc+3982. Multiple elliptical apertures were defined centred on NGC 3982 with an axis ratio of 0.901 and a position angle of 14.5, each separated by 1.5 arcseconds along the minor axis. The apertures were placed at up to 0.4 arcminutes (2 kpc), and NUV fluxes were estimated. Then the differences between the aperture fluxes were found to get the annuli fluxes. Finally, annuli average fluxes were found by dividing by the annuli area. The annuli average flux is plotted as a function of distance from the galaxy centre in Fig. 6. Similarly, elliptical apertures were used on the A map to estimate the annuli average attenuation levels. These levels were then used to correct the annuli average flux values. Attenuation-corrected annuli average fluxes are also plotted in Fig. 6. We note that the A map only covers the central region of the NUV image. Therefore, we can correct NUV fluxes for attenuation up to 0.2 arcminutes. We stress that attenuation does not affect the NUV profile of the galaxy’s central region, as demonstrated in Fig. 6.
We used Very Large Array Sky Survey (VLASS2.1) 2-4 GHz radio sky survey data with an angular resolution of 2.5 arcseconds (Lacy et al., 2020) to probe AGN activity in NGC 3982. We accessed the Quick Look images from the VLASS archive666https://archive-new.nrao.edu/vlass/quicklook/. The VLASS contours are overlaid on the NUV image in Fig. 5. The contours show an elongated structure lying in a south-east to north-west direction. Interestingly, VLBI observations of NGC 3982 in 1.7 and 5 GHz using the European VLBI Network reveal that there could be jet or outflow structures on milliarcsecond scales (Bontempi et al., 2012). The VLBI-detected features are also oriented in a south-east to north-west direction.
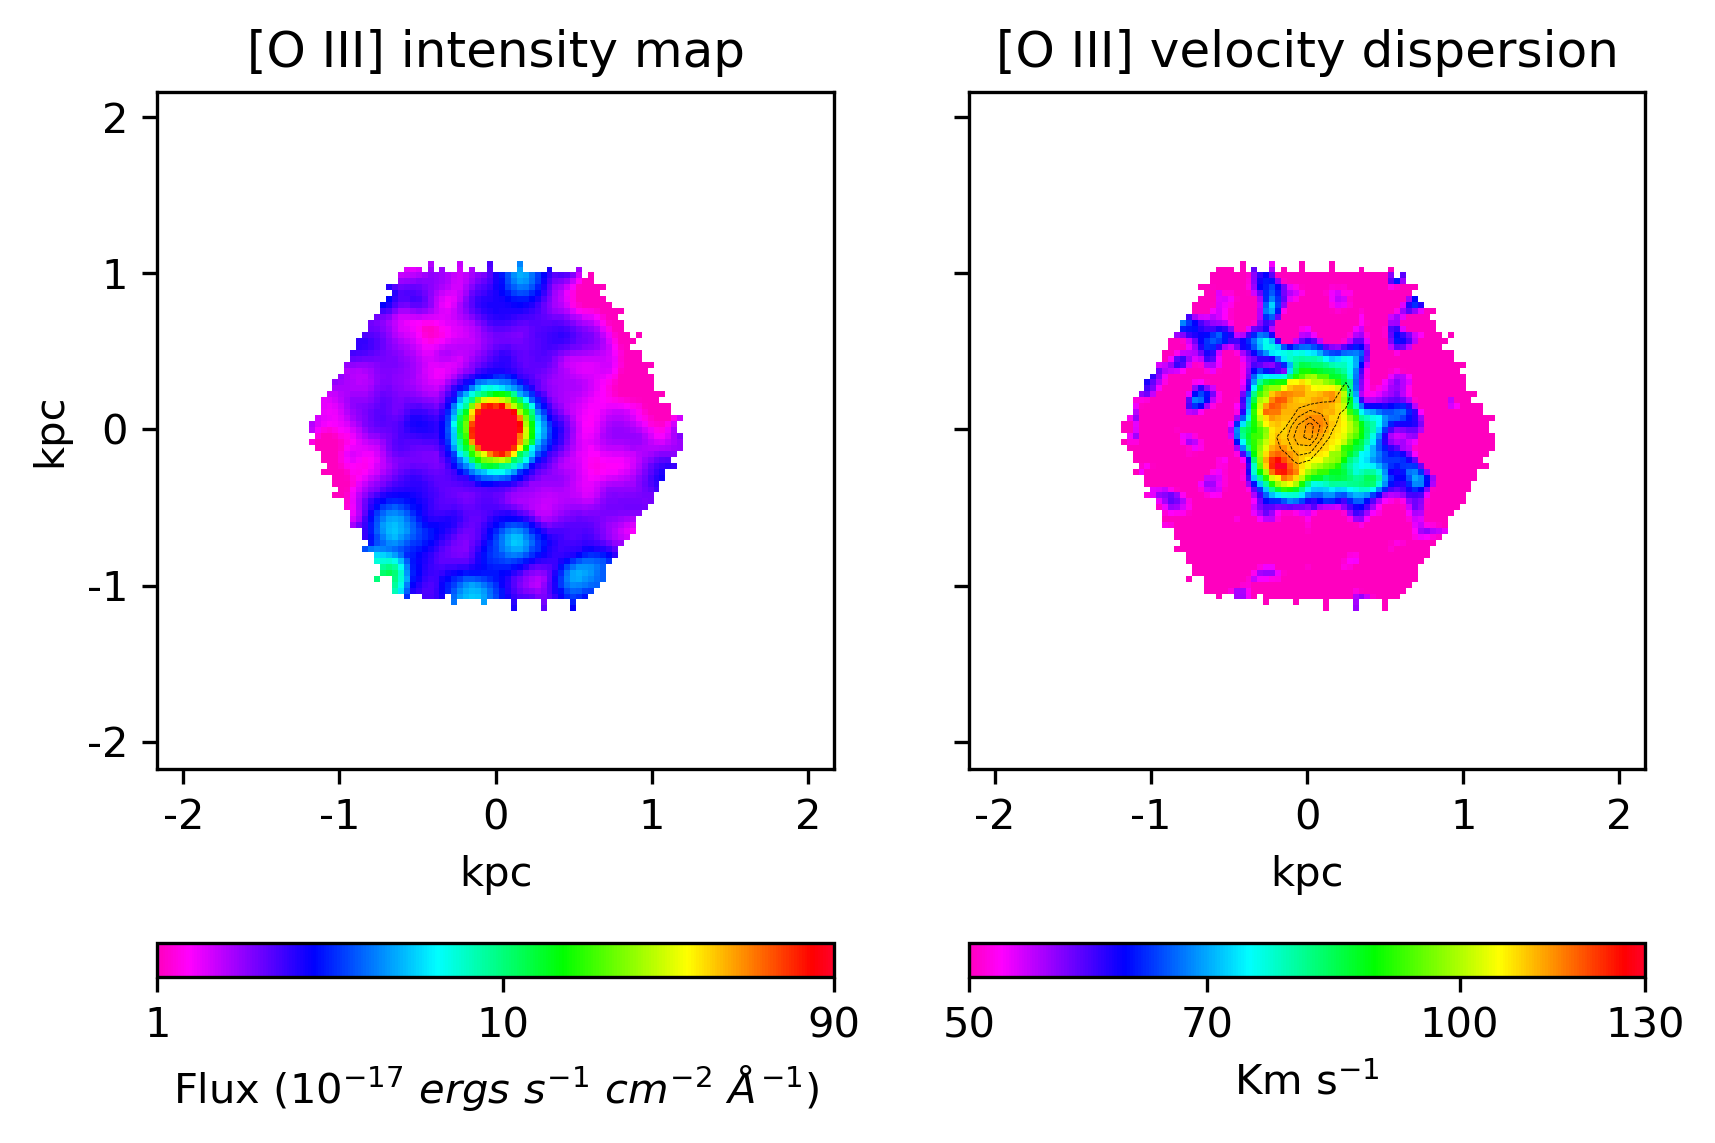
is a forbidden optical emission line that is more excited by strong ionising sources, such as AGN, than star-forming regions. Spatially resolved flux and kinematics maps have been used in AGN feedback studies to trace ionised gas outflows (for example: Shin et al. 2019; Ruschel-Dutra et al. 2021). The velocity dispersion in AGN host galaxies is mostly due to AGN activity (Rakshit & Woo, 2018; Woo et al., 2016). The MaNGA DAP maps of flux and -traced ionised gas velocity dispersion are shown in Fig. 8. The velocity dispersion map has been corrected for instrumental dispersion.
3 Discussion and summary
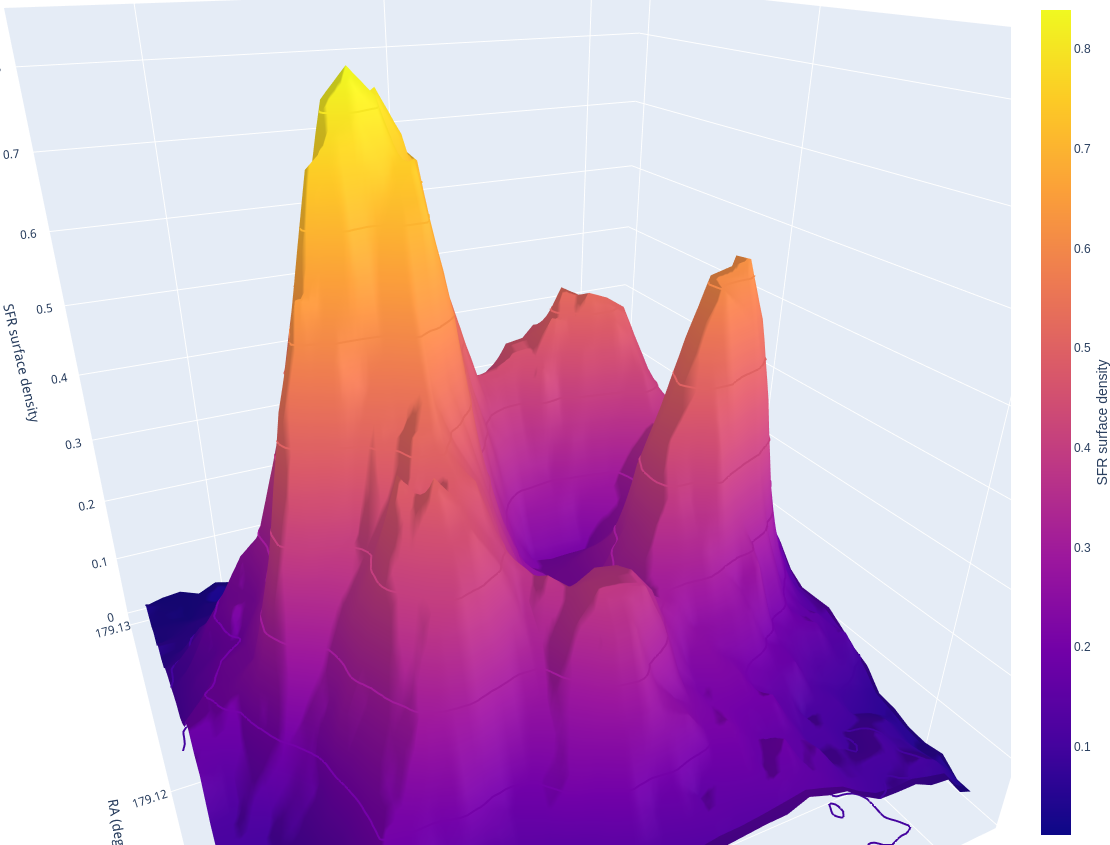
The NUV band directly traces stars formed over the last 200 Myr and, therefore, probes recent star formation (Kennicutt Jr & Evans, 2012). The GALEX NUV-derived profile of SFR surface density shows recent star formation in a ring-like region around the centre of NGC 3982 (see Fig. 5). We also created an interactive 3D visualisation777The visualisation is hosted at https://prajwel.github.io/NGC3982/ of the SFR surface density profile. A snapshot from the interactive plot is shown in Fig. 7. It appears that star formation is suppressed in the central region of NGC 3982.
The intrinsic UV flux from star-forming regions can be modified due to dust attenuation. Even if the central region has the same levels of intrinsic NUV emission as the ring-like region, a large attenuation in the central region can produce the presently observed NUV profile. However, the A map shown in Fig. 4 has comparable dust attenuation levels in the central and outer regions, with a median A value of 2.04 in the central AGN ionised regions and 2.15 in the galaxy disk. We do not see large attenuation levels in the central region. Also, the profile of the galaxy closely matches the profile (see Fig. 6). Therefore, dust attenuation of NUV flux in the galaxy cannot explain the cavity.
The observed suppression of star formation should be a real feature, not an artefact of attenuation. This suggests that processes in the central region prevented star formation in the last 200 Myr. The observed NUV cavity is approximately shaped like an elongated ellipse. We estimate that it has major and minor axis lengths of 17 and 8 arcseconds, respectively (1.3/0.6 kpc). The two distinct observational features that require explanation are the ring-like star-forming and star-formation-suppressed central regions.
The first possible explanation we considered is the presence of a bar. Bars are observed to induce star formation along the co-rotation radius and suppress star formation inside it (George et al., 2020). If present, a bar may produce the observed NUV profile in the galaxy. However, Regan & Mulchaey (1999) studied the central region of NGC 3982 using the Hubble Space Telescope and ruled out the presence of even a weak bar. NGC 3982 hosts an AGN, and the cavity region is covered by composite and AGN emissions. The boundary contour encompassing the composite and AGN regions overlaid in Fig. 5 shows the extent of AGN ionisation in the galaxy estimated using a BPT diagram. Active galactic nuclei are known to suppress star formation and can also be associated with positive feedback. Therefore, the likely mechanism for star formation suppression in NGC 3982 is a jet or outflow associated with the AGN activity.
The radio observations and flux and velocity dispersion maps provide clues regarding AGN activity. The VLASS2.1 observations reveal an extended structure with elongation in the south-east to north-west direction (see Fig. 5). While the flux map shows a symmetrically distributed high emission at the central region, the velocity dispersion map shows signs of perturbations in the gas (see Fig. 8). The perturbations are most prominently observed in the south-east (130 km s-1) and north-east (120 km s-1) regions. The perturbed gas in the south-east is aligned with the elongated VLASS radio structure, and the perturbed gas in the north-east runs parallel to it. These observations clearly show that the ionised gas is perturbed in the AGN-dominated region and that such perturbation may be driven by an AGN jet or outflow. Brum et al. (2017), who analysed the ionised gas kinematics, noted that a mild nuclear outflow could be present in the galaxy. But compared to other local galaxies hosting outflows, ionised gas outflow signatures in NGC 3982 are not prominent (Ruschel-Dutra et al., 2021).
The AGN hosted in NGC3982 is classified as Seyfert 1.9 and likely belongs to the radiative-mode AGN population. Therefore, the galaxy may have an outflow driven by radiation. We note that the AGN X-ray luminosity is 5 orders of magnitude greater than the radio luminosity (see Table 1). Nevertheless, the AGN luminosities in different bands may vary within a short time span (for example, 3C 273; Soldi et al. 2008). A jet may produce outflows with features similar to that generated by radiation (Cielo et al., 2018). Regardless of the nature of the AGN activity, NGC 3982 is perhaps one of the best examples of a nearby low-mass AGN that affects star formation in the disk.
It is interesting to compare the NGC 3982 case with other observations of AGN feedback. Although the activity is presently not detectable, the AGN in NGC 7252 could have been active until recently (Schweizer et al., 2013) and suppressed star formation in the central region of the galaxy (George et al., 2018). In NGC 5728, a star-forming ring with a radius of 1 kpc and a cavity is observed, and AGN outflow is found to be responsible (Shin et al., 2019). Surprisingly, ring-like star formation is also observed in NGC 7252 and NGC 3982 at a radius of 1 kpc from the centre. While all three galaxies may host a ring-like star-forming region with a radius of 1 kpc attributed to AGN feedback, they differ in galaxy morphology and AGN activity.
Based on a multi-wavelength analysis, we present evidence for star formation suppression in the central region of the Seyfert galaxy NGC 3982. As revealed from line diagnostic analysis, the galaxy’s central region with reduced star formation is dominated by AGN+composite emission. This is further supported by an AGN jet or outflow revealed from radio and gas velocity dispersion map analysis. The most plausible explanation for the observed scenario presented here is suppression of star formation in the central regions due to feedback from recent AGN activity.
Acknowledgements.
Astropy, IPython, Matplotlib, NumPy, Photutils, Plotly, Reproject, SAOImage DS9, and SciServer were used for data analysis, viewing, and plotting (Astropy Collaboration et al., 2013, 2018; Pérez & Granger, 2007; Hunter, 2007; Harris et al., 2020; Bradley et al., 2022; Inc., 2015; Robitaille et al., 2020; Joye & Mandel, 2003; Taghizadeh-Popp et al., 2020). Funding for the Sloan Digital Sky Survey IV has been provided by the Alfred P. Sloan Foundation, the U.S. Department of Energy Office of Science, and the Participating Institutions. SDSS-IV acknowledges support and resources from the Center for High Performance Computing at the University of Utah. The SDSS website is www.sdss.org. SDSS-IV is managed by the Astrophysical Research Consortium for the Participating Institutions of the SDSS Collaboration including the Brazilian Participation Group, the Carnegie Institution for Science, Carnegie Mellon University, Center for Astrophysics — Harvard & Smithsonian, the Chilean Participation Group, the French Participation Group, Instituto de Astrofísica de Canarias, The Johns Hopkins University, Kavli Institute for the Physics and Mathematics of the Universe (IPMU) / University of Tokyo, the Korean Participation Group, Lawrence Berkeley National Laboratory, Leibniz Institut für Astrophysik Potsdam (AIP), Max-Planck-Institut für Astronomie (MPIA Heidelberg), Max-Planck-Institut für Astrophysik (MPA Garching), Max-Planck-Institut für Extraterrestrische Physik (MPE), National Astronomical Observatories of China, New Mexico State University, New York University, University of Notre Dame, Observatário Nacional / MCTI, The Ohio State University, Pennsylvania State University, Shanghai Astronomical Observatory, United Kingdom Participation Group, Universidad Nacional Autónoma de México, University of Arizona, University of Colorado Boulder, University of Oxford, University of Portsmouth, University of Utah, University of Virginia, University of Washington, University of Wisconsin, Vanderbilt University, and Yale University.References
- Accetta et al. (2022) Accetta, K., Aerts, C., Aguirre, V. S., et al. 2022, The Astrophysical Journal Supplement Series, 259, 35
- Astropy Collaboration et al. (2018) Astropy Collaboration, Price-Whelan, A. M., Sipőcz, B. M., et al. 2018, AJ, 156, 123
- Astropy Collaboration et al. (2013) Astropy Collaboration, Robitaille, T. P., Tollerud, E. J., et al. 2013, A&A, 558, A33
- Baldwin et al. (1981) Baldwin, J. A., Phillips, M. M., & Terlevich, R. 1981, Publications of the Astronomical Society of the Pacific, 93, 5
- Beckmann et al. (2017) Beckmann, R., Devriendt, J., Slyz, A., et al. 2017, Monthly Notices of the Royal Astronomical Society, 472, 949
- Beifiori et al. (2009) Beifiori, A., Sarzi, M., Corsini, E., et al. 2009, The Astrophysical Journal, 692, 856
- Bontempi et al. (2012) Bontempi, P., Giroletti, M., Panessa, F., Orienti, M., & Doi, A. 2012, Monthly Notices of the Royal Astronomical Society, 426, 588
- Bradley et al. (2022) Bradley, L., Sipőcz, B., Robitaille, T., et al. 2022, astropy/photutils:
- Brum et al. (2017) Brum, C., Riffel, R. A., Storchi-Bergmann, T., et al. 2017, Monthly Notices of the Royal Astronomical Society, 469, 3405
- Bundy et al. (2014) Bundy, K., Bershady, M. A., Law, D. R., et al. 2014, The Astrophysical Journal, 798, 7
- Calzetti et al. (2000) Calzetti, D., Armus, L., Bohlin, R. C., et al. 2000, The Astrophysical Journal, 533, 682
- Canning et al. (2010) Canning, R., Fabian, A., Johnstone, R., et al. 2010, Monthly Notices of the Royal Astronomical Society, 405, 115
- Cappellari (2017) Cappellari, M. 2017, Monthly Notices of the Royal Astronomical Society, 466, 798
- Cardelli et al. (1989) Cardelli, J. A., Clayton, G. C., & Mathis, J. S. 1989, The Astrophysical Journal, 345, 245
- Cherinka et al. (2019) Cherinka, B., Andrews, B. H., Sánchez-Gallego, J., et al. 2019, The Astronomical Journal, 158, 74
- Cielo et al. (2018) Cielo, S., Bieri, R., Volonteri, M., Wagner, A. Y., & Dubois, Y. 2018, Monthly Notices of the Royal Astronomical Society, 477, 1336
- Cortese et al. (2008) Cortese, L., Gavazzi, G., & Boselli, A. 2008, Monthly Notices of the Royal Astronomical Society, 390, 1282
- Cresci et al. (2015) Cresci, G., Marconi, A., Zibetti, S., et al. 2015, Astronomy & Astrophysics, 582, A63
- Di Matteo et al. (2005) Di Matteo, T., Springel, V., & Hernquist, L. 2005, nature, 433, 604
- Domínguez et al. (2013) Domínguez, A., Siana, B., Henry, A., et al. 2013, The Astrophysical Journal, 763, 145
- Drory et al. (2015) Drory, N., MacDonald, N., Bershady, M., et al. 2015, The Astronomical Journal, 149, 77
- Fabian (2012) Fabian, A. C. 2012, Annual Review of Astronomy and Astrophysics, 50, 455
- Falcón-Barroso et al. (2011) Falcón-Barroso, J., Sánchez-Blázquez, P., Vazdekis, A., et al. 2011, Astronomy & Astrophysics, 532, A95
- George et al. (2018) George, K., Joseph, P., Mondal, C., et al. 2018, Astronomy & Astrophysics, 613, L9
- George et al. (2020) George, K., Joseph, P., Mondal, C., et al. 2020, Astronomy & Astrophysics, 644, A79
- George et al. (2019) George, K., Poggianti, B. M., Bellhouse, C., et al. 2019, Monthly Notices of the Royal Astronomical Society, 487, 3102
- González-Delgado & Pérez (1993) González-Delgado, R. M. & Pérez, E. 1993, Astrophysics and space science, 205, 127
- Groves et al. (2012) Groves, B., Brinchmann, J., & Walcher, C. J. 2012, Monthly Notices of the Royal Astronomical Society, 419, 1402
- Gunn et al. (2006) Gunn, J. E., Siegmund, W. A., Mannery, E. J., et al. 2006, The Astronomical Journal, 131, 2332
- Harris et al. (2020) Harris, C. R., Millman, K. J., van der Walt, S. J., et al. 2020, Nature, 585, 357
- Harrison (2017) Harrison, C. 2017, Nature Astronomy, 1, 1
- Hickox et al. (2014) Hickox, R. C., Mullaney, J. R., Alexander, D. M., et al. 2014, The Astrophysical Journal, 782, 9
- Hunter (2007) Hunter, J. D. 2007, Computing in Science & Engineering, 9, 90
- Inc. (2015) Inc., P. T. 2015, Collaborative data science
- Joye & Mandel (2003) Joye, W. A. & Mandel, E. 2003, in Astronomical data analysis software and systems XII, Vol. 295, 489
- Kammoun et al. (2020) Kammoun, E., Miller, J., Koss, M., et al. 2020, The Astrophysical Journal, 901, 161
- Kennicutt Jr & Evans (2012) Kennicutt Jr, R. C. & Evans, N. J. 2012, Annual Review of Astronomy and Astrophysics, 50, 531
- Kewley et al. (2006) Kewley, L. J., Groves, B., Kauffmann, G., & Heckman, T. 2006, Monthly Notices of the Royal Astronomical Society, 372, 961
- Komatsu et al. (2009) Komatsu, E., Dunkley, J., Nolta, M., et al. 2009, The Astrophysical Journal Supplement Series, 180, 330
- Kormendy & Ho (2013) Kormendy, J. & Ho, L. C. 2013, ARA&A, 51, 511
- Lacy et al. (2020) Lacy, M., Baum, S., Chandler, C., et al. 2020, Publications of the Astronomical Society of the Pacific, 132, 035001
- Law et al. (2016) Law, D. R., Cherinka, B., Yan, R., et al. 2016, The Astronomical Journal, 152, 83
- Martin et al. (2005) Martin, D. C., Fanson, J., Schiminovich, D., et al. 2005, The Astrophysical Journal, 619, L1
- Morganti (2017) Morganti, R. 2017, Frontiers in Astronomy and Space Sciences, 4, 42
- Morrissey et al. (2007) Morrissey, P., Conrow, T., Barlow, T. A., et al. 2007, The Astrophysical Journal Supplement Series, 173, 682
- Mould et al. (2000) Mould, J. R., Ridgewell, A., Gallagher III, J. S., et al. 2000, The Astrophysical Journal, 536, 266
- Pérez & Granger (2007) Pérez, F. & Granger, B. E. 2007, Computing in Science and Engineering, 9, 21
- Rakshit & Woo (2018) Rakshit, S. & Woo, J.-H. 2018, The Astrophysical Journal, 865, 5
- Regan & Mulchaey (1999) Regan, M. W. & Mulchaey, J. S. 1999, The Astronomical Journal, 117, 2676
- Robitaille et al. (2020) Robitaille, T., Deil, C., & Ginsburg, A. 2020, Astrophysics Source Code Library, ascl
- Rosario et al. (2018) Rosario, D., Burtscher, L., Davies, R. I., et al. 2018, Monthly Notices of the Royal Astronomical Society, 473, 5658
- Ruschel-Dutra et al. (2021) Ruschel-Dutra, D., Storchi-Bergmann, T., Schnorr-Müller, A., et al. 2021, Monthly Notices of the Royal Astronomical Society, 507, 74
- Sánchez-Blázquez et al. (2006) Sánchez-Blázquez, P., Peletier, R., Jiménez-Vicente, J., et al. 2006, Monthly Notices of the Royal Astronomical Society, 371, 703
- Schlegel et al. (1998) Schlegel, D. J., Finkbeiner, D. P., & Davis, M. 1998, The Astrophysical Journal, 500, 525
- Schweizer et al. (2013) Schweizer, F., Seitzer, P., Kelson, D. D., Villanueva, E. V., & Walth, G. L. 2013, The Astrophysical Journal, 773, 148
- Shin et al. (2019) Shin, J., Woo, J.-H., Chung, A., et al. 2019, The Astrophysical Journal, 881, 147
- Smee et al. (2013) Smee, S. A., Gunn, J. E., Uomoto, A., et al. 2013, The Astronomical Journal, 146, 32
- Soldi et al. (2008) Soldi, S., Türler, M., Paltani, S., et al. 2008, Astronomy & Astrophysics, 486, 411
- Somerville et al. (2008) Somerville, R. S., Hopkins, P. F., Cox, T. J., Robertson, B. E., & Hernquist, L. 2008, Monthly Notices of the Royal Astronomical Society, 391, 481
- Springel et al. (2005) Springel, V., Di Matteo, T., & Hernquist, L. 2005, The Astrophysical Journal, 620, L79
- Taghizadeh-Popp et al. (2020) Taghizadeh-Popp, M., Kim, J. W., Lemson, G., et al. 2020, Astronomy and Computing, 33, 100412
- Van Breugel et al. (1985) Van Breugel, W., Filippenko, A., Heckman, T., & Miley, G. 1985, The Astrophysical Journal, 293, 83
- Véron-Cetty & Véron (2010) Véron-Cetty, M.-P. & Véron, P. 2010, Astronomy & Astrophysics, 518, A10
- Wake et al. (2017) Wake, D. A., Bundy, K., Diamond-Stanic, A. M., et al. 2017, The Astronomical Journal, 154, 86
- Westfall et al. (2019) Westfall, K. B., Cappellari, M., Bershady, M. A., et al. 2019, The Astronomical Journal, 158, 231
- Woo et al. (2016) Woo, J.-H., Bae, H.-J., Son, D., & Karouzos, M. 2016, The Astrophysical Journal, 817, 108
- Wright (2006) Wright, E. L. 2006, Publications of the Astronomical Society of the Pacific, 118, 1711
- Zinn et al. (2013) Zinn, P.-C., Middelberg, E., Norris, R. P., & Dettmar, R.-J. 2013, The Astrophysical Journal, 774, 66