A Statistical Perspective for Predicting the Strength of Metals: Revisiting the Hall-Petch Relationship using Machine Learning
Abstract
The mechanical properties of a material are intimately related to its microstructure. This is particularly important for predicting mechanical behavior of polycrystalline metals, where microstructural variations dictate the expected material strength. Until now, the lack of microstructural variability in available datasets precluded the development of robust physics-based theoretical models that account for randomness of microstructures. To address this, we have developed a probabilistic machine learning framework to predict the flow stress as a function of variations in the microstructural features. In this framework, we first generated an extensive database of flow stress for a set of over a million randomly sampled microstructural features, and then applied a combination of mixture models and neural networks on the generated database to quantify the flow stress distribution and the relative importance of microstructural features. The results show excellent agreement with experiments and demonstrate that across a wide range of grain size, the conventional Hall-Petch relationship is statistically valid for correlating the strength to the average grain size and its comparative importance versus other microstructural features. This work demonstrates the power of the machine-learning based probabilistic approach for predicting polycrystalline strength, directly accounting for microstructural variations, resulting in a tool to guide the design of polycrystalline metallic materials with superior strength, and a method for overcoming sparse data limitations.
keywords:
Dislocation-mediated Crystal Plasticity , Polycrystal Strength , Size Effects , Mixture Models , Neural Networksupplement.pdf
[a]organization=Institute of High Performance Computing, A*STAR,city=Singapore, postcode=138632, country=Singapore \affiliation[b]organization=Department of Mechanical Engineering, Johns Hopkins University, city=Baltimore, postcode=21218, state=MD, country=USA \affiliation[c]organization=Research and Exploratory Development Department, Johns Hopkins University Applied Physics Laboratory, cite=Laurel, postcode=20723, state=MD, country=USA
1 Introduction
Discovering and designing materials with extraordinary properties is the ultimate goal of materials science. For structural materials, high strength is one of the most important mechanical properties, which can be enhanced by optimizing the microstructures [1, 2]. Among all strengthening mechanisms (grain refinement, strain hardening, solid solution strengthening, precipitate strengthening, and grain boundary hardening, etc.), grain refinement is arguably one of the simplest and most effective ways to increase the material strength. It is commonly known that the flow stress, , at a given macroscopic plastic strain, , increases when the average grain size, , decreases. This size effect is usually expressed by an empirical-based power law relationship in the form [3, 4]:
| (1) |
where and are fitting constants that depend on the chemistry, microstructure, and strain, while is the grain size exponent, and is approximately the flow stress of the coarse-grained and untextured polycrystal. When , Eq. (1) becomes the conventional Hall-Petch relationship, which was postulated by Hall and Petch in the early 1950’s [5, 6]. Experimental results of metallic materials generally support the empirical validity of Eq. (1) [7, 8, 9, 4]. It should be noted that here denotes the plastic strain, which is the subtraction of the total strain and the elastic strain. Under the tensile loading conditions, the elastic strain is , where is the Young’s modulus. Thus, the total strain, , is related to the plastic strain by .
Many theoretical models have been proposed in literature to explain the physics that may be responsible for such a power law relationship between the average grain size and the polycrystal flow stress, including the pile-up model [5, 10], the composite model [11, 12], and the grain boundary source model [13, 14]. Numerical computational methods, such as molecular dynamics simulations [15, 16], discrete dislocation dynamics (DDD) simulations [17, 18, 19, 20, 21, 22, 23], and continuum crystal plasticity models [24, 25, 26, 27, 28] have also been used to quantify the underlying deformation mechanisms that may dominate such a power-law relationship. Nevertheless, it is noteworthy that the reported values in literature for the grain size exponent, , based on experiments and simulations are largely not consistent, even for the same material when studied by different groups. For example, various experimental fitting values for the grain size exponents were reported [29, 30, 31, 32]. For Cu, Jiang et al. reported a value of 0.5 at low strains but not for high strains [33], while a wider range, between 0.22 and 1.37, was found by Li et al. [34]. Additionally, DDD simulations show that the grain size exponent varies from to [35, 17, 18, 36, 37], which strongly depends on dislocation density and strain level.
The reported values for also vary considerably in literature. For example, in -iron, the maximum reported value of is up to two times as large as the minimum one [38, 39, 40]. Moreover, the reported strain-dependency of on the strain level in literature lacks consistency. In some experiments, was reported to be constant (iron [39] and copper [41]) or decrease with increasing strain (copper [41] and steels [42]). In other studies, was observed to first decrease then slightly increase with strain (nickel and steel [43] and iron [40]).
This large discrepancy in the reported parameters was attributed to variations in microstructure (e.g., initial dislocation density, penetrability of grain boundaries (GBs), and grain size distributions), as well as the competition between different deformation mechanisms that control the flow stress. On the other hand, other studies have suggested that the Hall-Petch model is an artefact of faulty data analysis [44, 34] that the fitting parameters are sensitive to the error in determining the grain size. Their Bayesian meta-analysis suggested that the strength could be proportional to either or , with being the average grain size.
Due to the complications associated with characterizing the microstructural features and the wide spread in the reported flow stresses for different metals, a dataset that contains a large number of possible configurations is needed to sufficiently account for the effect of randomness in microstructures and gain a comprehensive understanding of the relationship between the flow stress and the microstructural features for any given material system. However there is scarcity in the available experimental and simulation datasets in the literature, with only a hundred data points at most for any given material. This lack of data represents a major barrier for drawing any conclusive statements about the proper fitting law for the flow stress or the dependence of the parameters on the strain magnitude or other microstructural features. Recent advances in data driven approaches (e.g., statistical machine learning (ML), and data mining) have gained increasing interest to enable better strength predictions for metals and alloys. In the past decade, deterministic ML techniques (including support vector machines, surrogate models and artificial neural networks) have been applied to steels [45], copper alloys [46], aluminium alloys [47], titanium alloys [48], nickel-based superalloys [49], and several types of multi-principal element alloys [50, 51, 52]. Data mining is another data driven method that collects data and extracts physical insights from literature [53, 54, 55, 56]. One of the major issues with such studies is the lack of representative datasets that ultimately diminish the robustness of knowledge gained through the use of these data driven approaches. On the other hand, almost all those studies focused on the composition and phase design of alloys without considering the effects of microstructural features, such as dislocations and grain boundaries, since the role of defects in determining the materials strength are much more difficult to be quantified in experiments and simulations, as compared to the composition-strength relationship. In addition, the point estimate (i.e., using a single value to represent the parameters of an unknown population) for the parameters in Eq. (1) in literature cannot be utilized to evaluate the uncertainty in flow stress associated with different microstructures, which is vital for accurate predictions of the material strength [57]. To address these issues, we present a ML-aided framework for the probabilistic prediction of the flow stress of a polycrystalline metal as a function of microstructural features, in contrast to the traditional approach in materials modeling, which focuses on the prediction of the averaged flow stress [58].
We first formulate a physics informed theoretical framework to predict the flow stress as a function of microstructural features in a randomized polycrystal sample to generate representative datasets. This allows us to investigate the applicability of the Hall-Petch relationship and derive an appropriate form to describe the dependency of grain size on strengthening. We then apply a machine learning framework that combines mixture models and neural networks on the generated dataset to derive the material flow stress distribution as a function of microstructural features. Finally, we systematically analyze the relative importance of the different microstructural features that control the size effects of the flow stress.
2 Results
In dislocation-mediated crystal plasticity, the polycrystal stress as a function of plastic strain and different microstructural features is formulated here based on the generalized size-dependent Taylor-strengthening law [23, 59] and the weakest link mechanism [60, 59]. In this model, the critical resolved shear stress (CRSS) of a specific slip system, , is determined as the minimum stress required for slip activation over all dislocation sources:
| (2) |
where is the shear modulus, is the magnitude of the Burgers vector, is the effective length of a dislocation source on the slip system, is a geometrical constant (typically around ), is the dislocation density, and is the friction stress [59]. In Eq. (2), is the stress required to overcome the dislocation line tension, while is the forest hardening term. The detailed description of the variables in Eq. (2) can be found in Sec. S1 of SI Appendix.
The strength of an individual grain can then be computed as the smallest value of the minimum CRSSs of all slip systems in the grain and the crystal theoretical shear strength for dislocation nucleation, , divided by the corresponding Schmid factor, , such that:
| (3) |
where is the Schmid factor as a function of the grain orientation, , which can be defined by the Euler angle triplets and the Bunge convention (i.e., [61, 62]).
Additionally, the dislocation density in a grain deformed to a plastic strain, , can be expressed as [23]
| (4) |
where is a geometrical constant, is the initial dislocation density in the grain, and is the effective grain size, which is defined as the cube root of the grain volume.
Finally, consider a cuboid polycrystal divided into an arbitrary number of sections each having an arbitrary thickness along the loading direction. Each section is composed of various through-thickness grains having different grain sizes. The polycrystal strength, , can thus be defined to be equal to the strength of the weakest section along the loading direction (i.e., iso-strain condition), and the strength of each section is controlled by the strongest grain in that section (i.e., iso-stress condition) [63, 59], thus,
| (5) |
This formulation for the polycrystal strength represented by Eqs (2) and (5), are based on experiments [63] and simulations [23] that have been critically examined in Ref. [59].
Here, a total of 1,199,946 face centered cubic (FCC) Ni polycrystalline cuboid samples with random grain sizes, grain numbers, grain orientations, and initial dislocation densities, were randomly generated and the flow stresses at different plastic strain levels (up to , where the dislocation-mediated plasticity is the dominant deformation mechanism) for each case were calculated using the combination of Eq. (3-5), which will be hereafter referred to as “theoretically predicted data”. The details of the polycrystalline sample generation and the material properties are discussed in the Methods Section and Sec. S1 of SI Appendix. The theoretically predicted data for all samples are summarized in Fig. 1(a), and the results are shown to be in excellent agreement with experimentally reported results in the literature for pure Ni [43, 64, 65, 66, 67, 68, 69, 70, 71, 72, 73, 74] (all data are from tensile tests under quasi-steady loading conditions, i.e., strain rate between and ). The results show that when the average grain size increases, the theoretically predicted flow stresses decrease and are bounded by two curves that have a reciprocal square root dependency on the average grain size, namely, and . The upper bound at the theoretical strength when the average grain size, , is smaller than , represents the cases when the flow strength reaches the theoretical strength for dislocation nucleation. The value of is obtained from Eq. (5) with the CRSS being , which is also equivalent to the theoretical shear strength of Ni, , divided by the Taylor factor of the sample. Fig. 1(a) and (b) also clearly demonstrate the effect of pre-straining, i.e., the flow stress generally increases with increasing strain, which is consistent with experimental observations [43, 73] and supported by the strain hardening model [31, 23, 75]. Furthermore, the theoretically predicted yield strength (i.e., the flow stress at 0.2% offset) from all cases is shown in Fig. 1(c). Similar to the flow stress data in Fig. 1(b), all results are observed to be bounded by two curves inversely proportional to the square root of the average grain size: and , respectively.
Additionally, for coarse-grained samples with , the upper limit of the strength data plateaus at as shown in Fig. 1(c). This upper bound is mainly controlled by the forest hardening term , as the dislocation slip in large grains are easily activated. This is also in agreement with 3D DDD simulation results [36].
As aforementioned, the different terms in Eq. (2) represent the contributions from different deformation mechanisms to the flow stress. This is illustrated in Fig. 1 by the changes in the slope in different grain size regions. The domain of dominance for each deformation mechanism is shown schematically by the colored regions in Fig. 2(a). It should be noted that these regions can overlap in response to different microstructural features even with the same average grain size. In the green region where the average grain size is small, the deformation is driven by dislocation nucleation from the grain boundaries or surfaces. Thus, the flow stress is equal to the theoretical stress for dislocation nucleation. On the other hand, when the average grain size, the strain, and the dislocation density are relatively low as shown by the red region, the flow stress is dominated by slip activation. However, when the average grain size, the strain, and dislocation density are high, shown by the magenta region, the flow stress is governed predominantly by dislocation forest hardening. Finally, in the intermediate region, the flow stress becomes a function of both slip activation and forest hardening. In Fig. 2(a), a transition grain size, , can be defined as the point at which the governing deformation mechanism changes from dislocation nucleation to a combination of slip activation and forest hardening. The variation of as a function of strain is shown in Fig. 2(b). It is observed that increases with increasing strain and reaches at . Since the transition grain size is interpreted as the turning point from a constant flow stress equal to (when ) to a decreasing flow stress with increasing strain (when ), at higher strains, the higher flow stress from strain hardening results in a larger transition grain size. However, when the grain size is above , the grains are large enough that slip activation and forest hardening overtake the dislocation nucleation to be the dominant mechanisms. Thus the flow stresses are below when .
The best fit from the constrained least squares regression (LSR) analysis on Eq. (1) (subject to ), linking the flow strength and average grain size, is shown in Fig. 2(c). Fig. 2(c) is a multiple line graph showing the fitting curves for the flow stress at different strain levels and in different ranges of grain size. The red dashed and dash-dotted lines having a slope of are reference lines to compare the theoretically predicted data with the inverse square root law (i.e., the Hall-Petch relationship with a vanished ). The upper panel in Fig. 2(c) shows the fitting curves for the entire range of grain sizes under consideration here as denoted by , while the lower panel shows the curves fitted in the sub-transition grain size range that is denoted by or the super-transition grain size range defined by , denoted as , respectively. The fitting parameters of the curves shown in Fig. 2(c) are presented in Fig. 2(d-f) as a function of strain. Fig. 2(d) shows that the grain size exponent in the super-transition grain size range () varies between and for all strain levels. This demonstrates that the conventional Hall-Petch relationship is statistically valid for correlating the strength to the average grain size in this grain size range. On the other hand, the exponents in both and gradually decrease from towards with an increasing strain. This trend can be rationalized by the more significant contribution of the theoretical stress manifested by the increasing with increasing strain at larger strain levels in . For comparison, the exponents in the size effect power law as reported in literature, based on fitting to a significantly smaller number of data points, are typically between and [76, 44, 77, 23]. The main reason for the discrepancy between the model predictions and that from the experimental predictions is the lack of statistically representative data from the experiments, which is overcome by the large set of data in the model.
Previous studies evaluating different forms of size effect laws from simulations or experiments (including both power law and non-power law) attempted to rationalize the wide range of exponents to the variations in deformation temperatures and the range of grain sizes investigated [31, 23]. Nevertheless, it is shown here that another major source for variations in the size effect laws is data scarcity in those previous studies, which failed to fully account for the likely variations in the statistics of the microstructural features (grain size distribution, grain orientation distribution, dislocation density, etc.) from one experiment to another. More specifically, the fitting may be sensitive to and compounded by the presence or absence of a few data points when the dataset size is not statistically satisfactory [78], such that there are many possible fitting curves to the data. On the other hand, with the unprecedentedly large size of representative data points examined here, the Hall-Petch relationship is shown to statistically describe the overall trend of the flow stresses as a function of average grain sizes that are larger than (i.e., in ).
The fitting of the other two parameters, (here is scaled by to keep the unit consistency) and , from the current data points as a function of strain, are also shown in Fig. 2(e) and (f), respectively. It is observed that monotonically increases with increasing strain, emphasizing the pre-straining effect on the flow stress. Additionally, despite some scatter in the variation of with strain, is always well below for the range of strains studied here. This indicates that the contribution of in Eq. (1) to the flow stress can be considered negligible, as compared to the term, except for large and small .
The overall trend of the flow stress as a function of the average grain size and strain level has been quantified above using the LSR method. Nevertheless, it is clear from Fig. 1 that the flow stress varies from its mean values by nearly an order of magnitude at the same average grain size and at the same strain level. Hence, the deterministic prediction of the flow stress through Eq. (1) cannot describe the wide distribution in the flow stress associated with different microstructures, which should be accounted for in order to precisely predict the flow stress for materials discovery and optimization. We overcome this by considering the polycrystal flow stress as a random variable and obtaining its probability distribution, as an extension of the classical Hall-Petch relationship. Using the Gaussian mixture model, the probability density function (PDF) of the flow stress with the given average grain size and strain level can be described as a mixture of PDFs, where the -th PDF follows a normal distribution with the mean and the standard deviation ,
| (6) |
Here is the weight of the -th PDF with . It should be noted that here the flow stress is scaled by the logarithmic transformation since the flow stress varies by multiple orders of magnitude in the range of average grain sizes chosen. Eq. (6) can be extended to the case with further given microstructural features (e.g., average dislocation densities and volume weighted average Taylor factors). The parameters of the mixture components in Eq. (6) are estimated using an effective probabilistic machine learning algorithm [79, 80], termed the “mixture density network” (MDN). The trained MDN models are available on Zenodo, which repository address is provided in Sec. Data and Code Availability.
The theoretical and MDN predicted flow stress distributions and quartile box plots for four different average grain sizes at three different strain levels are shown in Fig. 3. The histograms and the lines are the distributions of the theoretical flow stresses and the MDN predicted flow stresses, respectively. Similarly, the white and grey boxes at the top of each subfigure represent the quartiles of the theoretically predicted and the MDN predicted flow stresses, respectively. The flow stresses at different grain sizes and strain levels are shown to follow a bimodal distribution. The existence of two local maxima of flow stress arises from the complicated relationship between the flow stress and microstructural features. The first quartile (Q1), second quartile (Q2) and third quartile (Q3) are defined as the cases under which 25%, 50% and 75% of the data points are found when they are arranged in ascending order, respectively. While Fig. 3 only shows some representative results of the trained MDN model, all MDN predicted distributions are shown to be in excellent agreement with the theoretical predictions (see SI Appendix Sec. S3 for all results).
Further analysis of the quartiles of the theoretical and MDN predicted flow stresses is shown in Fig. 4. In Fig. 4(a), the lines are colored according to the strain levels. The left and right columns are from the theoretical and the MDN predicted distributions of the flow stresses, respectively. Similar to the LSR results, the quartile slopes from both the theoretical and the MDN predicted distributions are quite different for small () and large () grain sizes, which is again due to the transition in the dominant deformation mechanisms. The curve fitting parameters, , and , of the quartiles, are shown in Fig. 4(b-d), respectively. From Fig. 4(b), the exponents in the coarse-grained materials (i.e., in ) are around , indicating a good alignment of the curves with dependence. While in fine-grained materials (i.e., in ), the grain size exponent gradually decreases from to as the grain size increases. The values of and for the quartiles have the same trends as those from the LSR fitting curves shown in Figs 2(e,f), i.e., monotonically increases as strain increases, and are relatively small and negligible. The analysis based on the probability distribution of flow stress leads to concluding that for materials having average grain sizes larger than , the Hall-Petch relationship holds for the spread of the flow stress data, and the applicability of the Hall-Petch relationship is not a coincidence for the average flow stress.
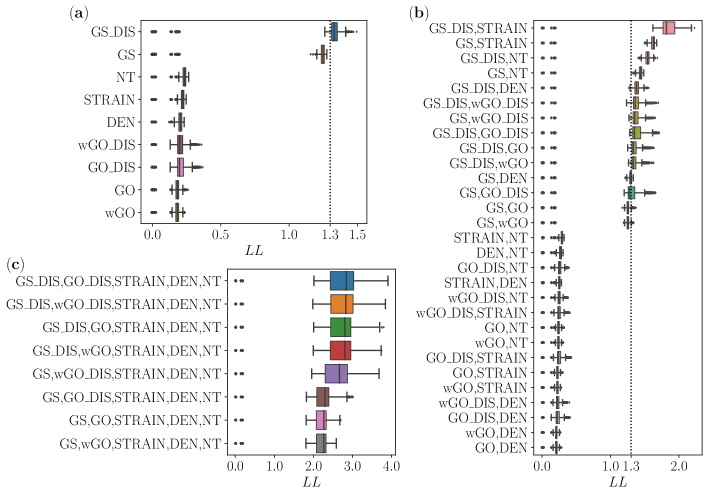
In the above analysis, an assumption was made based on empirical prior knowledge that the average grain size and strain level are two important factors in determining the flow stress. This assumption can be examined by analyzing the feature importance based on the trained MDN models. In particular, a series of commonly used microstructural features are analyzed in this work: 1. the average grain size (termed as “GS”); 2. the grain size distribution (termed as “GS_DIS”) defined by the average grain size, the smallest grain size, the largest grain size, and the standard deviation in the grain size; 3. the average Taylor factor (termed as “GO”); 4. the grain orientation distribution (termed as “GO_DIS”) defined by the average Taylor factor (of each grain), the smallest Taylor factor, the largest Taylor factor, and the standard deviation in the Taylor factor; 5. the volume weighted average Taylor factor (termed as “wGO”), where the applied weight is defined as the grain volume divided by the average grain volume; 6. the volume weighted average grain orientation distribution (termed as “wGO_DIS”) defined by the volume weighted average Taylor factor (of each grain), the smallest volume weighted Taylor factor, the largest volume weighted Taylor factor and the (volume weighted) standard deviation of Taylor factor; 7. plastic strain level (termed as “STRAIN”); 8. average initial dislocation density (termed as “DEN”); and 9. normalized thickness (termed as “NT”) defined as the averaged number of grains along one dimension in a cross section.
The contributions from those microstructural features on the flow stress are ranked by the median score of the mean log likelihood (denoted by “LL”) as shown in Fig. 5. It can be observed that the grain size related features, namely, the grain size distribution (“GS_DIS”) and average grain size (“GS”) are the two most dominant factors in determining the flow stress. Since the feature average grain size (“GS”) is fully contained in the feature grain size distribution (“GS_DIS”), the scores of the feature combinations with the grain size distribution are always higher than those of the same feature combination with the average grain size. According to the scores of a single type of features in Fig. 5(a), each single feature not related to the grain size has average scores between and . Even though the difference between the scores of different single features other than grain size is subtle, Fig. 5(b) shows that scores associated with the dual features of the grain size/grain size distribution and strain are clearly higher than any other dual feature combination. Therefore, the features related to the grain size (“GS_DIS” or “GS”) and strain are demonstrated to be the most important factors in controlling the flow stress. This analysis validates the widely adopted form of the Hall-Petch relationship as a function of average grain size and strain, as expressed by Eq. (1). The grain size related features coupled with the normalized thickness also produce relatively high scores (ranking 3rd and 4th in Fig. 5(b)), indicating the vital role of the normalized thickness in determining the flow strength [63, 59]. The scores from the grain size related features and the other two types of micrustructural features (average initial dislocation density, and grain orientation related features) are quite close, which sheds light on the complicated interdependence of deformation mechanisms related to dislocation density and grain orientation. When all five types of microstructural features are accounted for, the average scores are higher than 2, as demonstrated in Fig. 5(c). This suggests that when the microstructural statistics are fully incorporated, the credibility of the MDN model prediction can be much improved.
3 Discussion and Conclusions
In this work, the conventional Hall-Petch relationship alone is shown to be a statistically valid manifestation to describe the correlation between the flow stress and the average grain size that are larger than (in ), with the generation of over one million data points from Eq. (3) and Eq. (5). Nevertheless, the large scatter in the observed stress values requires a quantification of the prediction uncertainty. To enhance the predictive accuracy, the Hall-Petch relationship must be complimented by a probabilistic description of flow stress distributions. This method characterizes the uncertainty and provides a method towards assessing the confidence level for a flow stress prediction. This approach provides the fundamental understanding and the statistics that are not always easily accessible through experiments alone. Furthermore, the trained MDN model can be used to generate results that are broader and more complete than the previous 70 years of experimental research without the use of any additional physical experiment. Therefore, this computational work has the potential to replace experimental testing by leveraging efficient while accurate strength prediction and deep insight on deformation mechanisms to meet material design targets on time and on cost. Here we propose an approach that is centered on harnessing the power of data to accelerate materials design and its deployment. We combine the discovery of fundamental physical principles (i.e., a Newtonian paradigm) with machine learning approaches to enable scientific discoveries (i.e., a Keplerian paradigm). The approach enables producing accurate and representative datasets from physics-based models, and then effectively learn from the data to enable making accurate predictions. The problem we chose as a demonstrative case of this approach is the classical Hall-Petch relationship, which is arguably one of the most extensively used phenomenological relationships for predicting materials strength. However, this relationship has been debated for decades due to the scarcity of available experimental data. Our approach both overcomes this scarcity in data and harnesses the ability of machine learning to extract useful and novel physics. Some important aspects in the current framework development will be discussed below.
Formulation of flow stress
In the formulation of the current theoretical model for the prediction of the FCC polycrystal flow stress, a few simplifications were employed, e.g., the effect of strain rate on the flow stress [81, 82] was ignored. It has been shown not to significantly change the stress-strain curves of all nanocrystalline, ultra-fine crystalline and microcrystalline Ni when the strain rates are between and [69]. Thus the results of this work can be directly applied for such a strain rate range. While the strain rate beyond this range possibly leads to a very different dislocation density evolution, which requires more systematic studies to improve the capability of this model for wider strain rate ranges. Furthermore, to apply this model from FCC materials to other crystal structures, some extra factors should be addressed, e.g., more complicated slip systems and anisotropy in slip resistance for different dislocation characters and on different slip systems in body-centred cubic and hexagonal close-packed materials. In addition, it should be noted that this theoretical model was developed for homogeneous or weak texture materials at small strains, and some homogenization methods were used for microscopic plastic strains and non-equivalent grain growth/recovery. This approximation is accurate for predicting the homogenized properties at the macroscopic level (average behaviors of many grains, e.g., yield) [83, 84]. Nevertheless, the model can be improved to account for heterogeneous deformation, large strains and rotations, contact, and complex local strain histories to predict the macroscopic properties dominated by local microstructures (fatigue and creep crack initiation, crack propagation, etc.), which is beyond the current study. Finally, the formulation developed here only applies to pure metals. To extend this formulation to predict the material flow stresses in alloys, additional terms associated with the strengthening mechanisms due to solid solutions or precipitates should be incorporated [2].
Sources of uncertainty in the flow stress
There are two sources of the flow stress uncertainty in this work [85, 58]: One is the deficiency due to an imperfection in calculations or a lack of knowledge of the physics law, which is referred to as the the epistemic (or systematic) uncertainty. The other is associated with the random microstructures of materials, which is referred to as the aleatoric (or statistical) uncertainty. The epistemic uncertainty can usually be eliminated to a sufficient degree by calibrating and validating the physics model using reliable results from experiments. In this work, this procedure has been performed during formulating the flow stress. While the aleatoric uncertainty is more significant with the information loss or the dimension reduction when the model is upscaled to a coarse-grained model, leading to the inherent randomness of the microstructures being not completely represented. The effect of the incomplete information of the microstructural randomness can be quantified using probability distributions, as presented in this work. Thus, the collection of more representative data would help characterize a more accurate probability distribution of flow stress, albeit this aleatoric uncertainty is irreducible and cannot be effectively mitigated. On the other hand, coarse-grained models are desired in order to overcome the inefficiency issue of atomistic resolution simulations to reach higher spatial and temporal scales, by decreasing the degrees of freedom. The capability and accuracy of coarse-grained models can be enhanced by properly choosing a series of homogenization methods or quantities that store and preserve key information to a large extent. For example, we have shown that the grain size distributions described by the average, standard deviation, lower bound and upper bound of grain sizes (i.e., GS_DIS) can better predict the flow stress distribution than only taking average grain sizes, which highlights the paramount importance of appropriate dimension reduction in minimizing the aleatoric uncertainty.
Treatment of data bias
The reliability of the knowledge extracted from data-driven approaches is highly dependent on the collection of a large assembly of unbiased data. The most practical way to reduce bias is to increase the dataset size. In this work, the one million simulation samples are equally generated from different microstructure distributions with different random seeds, such that there is no specific distribution being predominantly used and no skewed sample generated.
Appendix A Materials and Methods
Formulation of polycrystal strength
Consider a cuboidal polycrystal under a loading parallel to the z-axis, as shown in Fig. S1 of the supporting materials, with length (in the z-direction), thickness (in the y-direction), and width (in the y-direction). The polycrystal can be divided into multiple sections along the z-axis. Each section is composed of various grains. Since GB sliding and grain rotations are only relevant for the prediction of strength in nanocrystalline materials (i.e., grain sizes ) [86, 87, 88], these mechanisms are not accounted for in our model which focuses on grain sizes . To be consistent with this assumption, and for the sake of simplicity, the grains can be visualized as right prisms with all grain boundaries either being parallel or perpendicular to the loading direction. It should also be noted that the details of the grain shape (irregular grain boundaries and random grain boundary directions) can influence local strains and local dislocation density. However, these influences have been shown to average out when predicting the overall strength and when the strain level is below 8% [89, 90, 91, 92, 93]. The average grain size is defined as the cube root of the average grain volume, i.e., , where is the total number of grains in the polycrystal.
The following three steps are taken to mathematically formulate the strength in polycrystals [59].
1. (Strength of a single grain) For a slip system in a grain, the CRSS determined by the dislocation source that has the largest effective length , , is capped at the theoretical strength related to thermal activation events of dislocations, . Thus, the grain strength is related to the CRSS, i.e., , by the Schmid factor, which is defined in Eq. (3).
2. (Strength of the section) The strength of a given section is equal to that of the strongest grain in that section [63].
| (7) |
3. (Strength of the sample) The flow stress for the entire sample is determined by the weakest section:
| (8) |
The polycrystal strength is equal to the weakest section strength along the loading direction, while the section strength is defined as the strongest grain strength [63, 59]. Thus the polycrystal strength in Eq. (5) becomes Eq. (A).
| (9) | ||||
Moreover, the dislocation storage rate in a grain with the size, , under the quasi-static loading condition, is of the form [94, 95, 96, 21, 92]:
| (10) |
where is a constant for dislocation density evolution, which leads to a linear relationship (i.e., Eq. (4)) between the dislocation density, , and the macroscopic plastic strain, . In Eq. (4), for each grain is expected to be inversely proportional with the grain size [94, 96]:
| (11) |
where is a random variable ranging between 0.5 and 2 to account for the heterogeneity of the dislocation density in different grains, is a characteristic grain size, and is the mean initial dislocation density in the polycrystal.
It should be noted that the dislocation length distributions and dislocation density evolutions are actually dependent on the structures and properties of grain boundaries. Here for simplicity, also due to the lack of systematic studies on such grain boundary dependencies, the dislocation length distributions and dislocation density evolutions are assumed to be the same in all grains. The implementation with a more complete description of the dislocation length distributions and dislocation density evolution at larger deformation stages (e.g., Kocks-Mecking model [97, 98]), will improve the accuracy of the flow stress prediction and will be presented elsewhere.
Mixture density networks
A typical mixture density network is built from two basic components [79, 80]: a Gaussian mixture model and a neural network. The MDN possesses the benefits of both constituting models. The Gaussian mixture model can be used to estimate the distributions without imposing an ad hoc inductive biased assumption on the forms and functions of distributions. On the other hand, the neural network can calculate the parameters in the Gaussian mixture model by optimizing a given loss function. It confers excellent predictive capabilities on non-linear and complex relationships, as well as better generalization performance and better robustness [79, 80, 99]. MDN is chosen over other ML models as it is a well-established technique with significant flexibility to learn complex dynamics, and can be coupled with the Gaussian mixture method [100, 101]. Many other ML model architectures, and configurations might also have the potential for such predictions and couplings. However, they are beyond the scope of this work. The MDN models are implemented in Python 3 using Keras and TensorFlow libraries [102], see more details in SI Appendix Sec. S4.
Data and Code Availability
The dataset generated, the trained MDN models, and the codes used in this paper are available on Zenodo with the repository address: https://www.doi.org/10.5281/zenodo.7762663
Acknoledgement
YG and JAE acknowledge financial support from the Office of Naval Research under grant #N00014-18-1-2858. YG acknowledges financial support by the Structural Metal Alloys Program (A18B1b0061) of A*STAR in Singapore. JAE acknowledges support from U.S. National Science Foundation (NSF) award number DMR-1807708 and the Army Research Laboratory under Cooperative Agreement Number W911NF-22-2-0014. The authors also gratefully acknowledge internal financial support from the Johns Hopkins University Applied Physics Laboratory’s Internal Research & Development (IR&D) Program for funding portions of this work. The simulations were conducted at (1) the Advanced Research Computing at Hopkins (ARCH) core facility (rockfish.jhu.edu), which is supported by an NSF grant number OAC-1920103, (2) the Extreme Science and Engineering Discovery Environment (XSEDE) Expanse supercomputer at the San Diego Supercomputer Center (SDSC) through allocation TG-MAT210003, which is supported by National Science Foundation grant number ACI-1548562, and (3) the National Supercomputing Centre of Singapore through Allocation 13002696. We also thank Mr. Dylan Madisetti for helping publishing codes online. The views and conclusions contained in this document are those of the authors and should not be interpreted as representing the official policies, either expressed or implied, of the Army Research Office or the U.S. Government. The U.S. Government is authorized to reproduce and distribute reprints for Government purposes notwithstanding any copyright notation herein.
References
- [1] G. E. Dieter, Mechanical Metallurgy, McGraw-hill New York, 1961.
- [2] S. Timoshenko, History of strength of materials: with a brief account of the history of theory of elasticity and theory of structures, Courier Corporation, 1983.
-
[3]
R. W. Armstrong,
60
Years of Hall-Petch: Past to Present Nano-Scale Connections, Materials
Transcations 55 (1) (2014) 2–12.
doi:10.2320/matertrans.MA201302.
URL https://www.jstage.jst.go.jp/article/matertrans/55/1/55{_}MA201302/{_}article -
[4]
Z. C. Cordero, B. E. Knight, C. A. Schuh,
Six
decades of the Hall–Petch effect – a survey of grain-size strengthening
studies on pure metals, International Materials Reviews 61 (8) (2016)
495–512.
doi:10.1080/09506608.2016.1191808.
URL https://www.tandfonline.com/doi/full/10.1080/09506608.2016.1191808 -
[5]
E. O. Hall,
The
Deformation and Ageing of Mild Steel: III Discussion of Results,
Proceedings of the Physical Society. Section B 64 (9) (1951) 747–753.
doi:10.1088/0370-1301/64/9/303.
URL https://iopscience.iop.org/article/10.1088/0370-1301/64/9/303 -
[6]
N. J. Petch,
The
cleavage strength of polycrystals, Journal of the Iron and Steel Institute
174 (1953) 25–28.
URL http://garfield.library.upenn.edu/classics1982/A1982NM35100001.pdf -
[7]
H. Conrad,
Effect
of grain size on the lower yield and flow stress of iron and steel, Acta
Metallurgica 11 (1) (1963) 75–77.
doi:10.1016/0001-6160(63)90134-2.
URL https://linkinghub.elsevier.com/retrieve/pii/0001616063901342 -
[8]
J. P. Hirth, The influence
of grain boundaries on mechanical properties, Metallurgical Transactions
3 (12) (1972) 3047–3067.
doi:10.1007/BF02661312.
URL http://link.springer.com/10.1007/BF02661312 -
[9]
N. Hansen,
Hall–Petch
relation and boundary strengthening, Scripta Materialia 51 (8) (2004)
801–806.
doi:10.1016/j.scriptamat.2004.06.002.
URL https://linkinghub.elsevier.com/retrieve/pii/S1359646204003434 - [10] A. Cottrell, Theory of brittle fracture in steel and similar metals, Trans. Metallurgical Society (1978).
-
[11]
A. W. Thompson, M. I. Baskes, W. F. Flanagan,
The
dependence of polycrystal work hardening on grain size, Acta Metallurgica
21 (7) (1973) 1017–1028.
doi:10.1016/0001-6160(73)90158-2.
URL https://linkinghub.elsevier.com/retrieve/pii/0001616073901582 -
[12]
M. A. Meyersm, E. Ashworth,
A model
for the effect of grain size on the yield stress of metals, Philosophical
Magazine A 46 (5) (1982) 737–759.
doi:10.1080/01418618208236928.
URL http://www.tandfonline.com/doi/abs/10.1080/01418618208236928 -
[13]
J. C. M. Li,
Petch
Relation and Grain Boundary Sources, Transactions of the Metallurgical
Society of AIME (1963).
URL http://garfield.library.upenn.edu/classics1981/A1981MQ76000001.pdf -
[14]
V. Bata, E. V. Pereloma,
An
alternative physical explanation of the Hall–Petch relation, Acta
Materialia 52 (3) (2004) 657–665.
doi:10.1016/j.actamat.2003.10.002.
URL https://linkinghub.elsevier.com/retrieve/pii/S1359645403006177 -
[15]
J. B. Jeon, B.-J. Lee, Y. W. Chang,
Molecular
dynamics simulation study of the effect of grain size on the deformation
behavior of nanocrystalline body-centered cubic iron, Scripta Materialia
64 (6) (2011) 494–497.
doi:10.1016/j.scriptamat.2010.11.019.
URL https://linkinghub.elsevier.com/retrieve/pii/S1359646210007773 -
[16]
W. Xu, L. P. Dávila,
Tensile
nanomechanics and the Hall-Petch effect in nanocrystalline aluminium,
Materials Science and Engineering: A 710 (2018) 413–418.
doi:10.1016/j.msea.2017.10.021.
URL https://linkinghub.elsevier.com/retrieve/pii/S0921509317313382 -
[17]
S. B. Biner, J. R. Morris,
A
two-dimensional discrete dislocation simulation of the effect of grain size
on strengthening behaviour, Modelling and Simulation in Materials Science
and Engineering 10 (6) (2002) 617–635.
doi:10.1088/0965-0393/10/6/303.
URL https://iopscience.iop.org/article/10.1088/0965-0393/10/6/303 -
[18]
S. B. Biner, J. R. Morris,
The
effects of grain size and dislocation source density on the strengthening
behaviour of polycrystals: a two-dimensional discrete dislocation
simulation, Philosophical Magazine 83 (31-34) (2003) 3677–3690.
doi:10.1080/14786430310001599414.
URL http://www.tandfonline.com/doi/abs/10.1080/14786430310001599414 -
[19]
D. Balint, V. Deshpande, A. Needleman, E. Van der Giessen,
A
discrete dislocation plasticity analysis of grain-size strengthening,
Materials Science and Engineering: A 400-401 (2005) 186–190.
doi:10.1016/j.msea.2005.02.082.
URL https://linkinghub.elsevier.com/retrieve/pii/S092150930500362X -
[20]
D. Balint, V. Deshpande, A. Needleman, E. Van der Giessen,
Discrete
dislocation plasticity analysis of the grain size dependence of the flow
strength of polycrystals, International Journal of Plasticity 24 (12)
(2008) 2149–2172.
doi:10.1016/j.ijplas.2007.08.005.
URL https://linkinghub.elsevier.com/retrieve/pii/S0749641907001167 -
[21]
C. de Sansal, B. Devincre, L. P. Kubin,
Grain Size Strengthening in
Microcrystalline Copper: A Three-Dimensional Dislocation Dynamics
Simulation, Key Engineering Materials 423 (2009) 25–32.
doi:10.4028/www.scientific.net/KEM.423.25.
URL https://www.scientific.net/KEM.423.25 - [22] L. E. Levine, B. C. Larson, W. Yang, M. E. Kassner, J. Z. Tischler, M. A. Delos-Reyes, R. J. Fields, W. Liu, X-ray microbeam measurements of individual dislocation cell elastic strains in deformed single-crystal copper, Nature Materials 5 (8) (2006) 619–622. doi:10.1038/nmat1698.
-
[23]
J. A. El-Awady, Unravelling
the physics of size-dependent dislocation-mediated plasticity, Nature
Communications 6 (1) (2015) 5926.
doi:10.1038/ncomms6926.
URL http://www.nature.com/articles/ncomms6926 -
[24]
A. Acharya, A. Beaudoin,
Grain-size
effect in viscoplastic polycrystals at moderate strains, Journal of the
Mechanics and Physics of Solids 48 (10) (2000) 2213–2230.
doi:10.1016/S0022-5096(00)00013-2.
URL https://linkinghub.elsevier.com/retrieve/pii/S0022509600000132 - [25] K. E. Aifantis, W. A. Soer, J. T. M. De Hosson, J. R. Willis, Interfaces within strain gradient plasticity: Theory and experiments, Acta Materialia (2006). doi:10.1016/j.actamat.2006.06.040.
-
[26]
N. Ohno, D. Okumura,
Higher-order
stress and grain size effects due to self-energy of geometrically necessary
dislocations, Journal of the Mechanics and Physics of Solids 55 (9) (2007)
1879–1898.
doi:10.1016/j.jmps.2007.02.007.
URL https://linkinghub.elsevier.com/retrieve/pii/S0022509607000361 -
[27]
S. Haouala, J. Segurado, J. LLorca,
An
analysis of the influence of grain size on the strength of FCC polycrystals
by means of computational homogenization, Acta Materialia 148 (2018)
72–85.
doi:10.1016/j.actamat.2018.01.024.
URL https://linkinghub.elsevier.com/retrieve/pii/S1359645418300557 -
[28]
S. Haouala, S. Lucarini, J. LLorca, J. Segurado,
Simulation
of the Hall-Petch effect in FCC polycrystals by means of strain gradient
crystal plasticity and FFT homogenization, Journal of the Mechanics and
Physics of Solids 134 (2020) 103755.
doi:10.1016/j.jmps.2019.103755.
URL https://linkinghub.elsevier.com/retrieve/pii/S0022509619306969 -
[29]
W. Baldwin,
Yield
strength of metals as a function of grain size, Acta Metallurgica 6 (2)
(1958) 139–141.
doi:10.1016/0001-6160(58)90136-6.
URL https://linkinghub.elsevier.com/retrieve/pii/0001616058901366 - [30] S. Raj, G. Pharr, A compilation and analysis of data for the stress dependence of the subgrain size, Materials Science and Engineering 81 (1986) 217–237.
- [31] T. Narutani, J. Takamura, Grain-size strengthening in terms of dislocation density measured by resistivity, Acta Metallurgica Et Materialia (1991). doi:10.1016/0956-7151(91)90173-X.
- [32] M. Aghaie-Khafri, F. Honarvar, S. Zanganeh, Characterization of grain size and yield strength in aisi 301 stainless steel using ultrasonic attenuation measurements, Journal of Nondestructive Evaluation 31 (3) (2012) 191–196.
-
[33]
J. Jiang, T. Britton, A. Wilkinson,
Evolution
of dislocation density distributions in copper during tensile deformation,
Acta Materialia 61 (19) (2013) 7227–7239.
doi:10.1016/j.actamat.2013.08.027.
URL https://linkinghub.elsevier.com/retrieve/pii/S135964541300623X -
[34]
Y. Li, A. J. Bushby, D. J. Dunstan,
The
Hall–Petch effect as a manifestation of the general size effect,
Proceedings of the Royal Society A: Mathematical, Physical and Engineering
Sciences 472 (2190) (2016) 20150890.
doi:10.1098/rspa.2015.0890.
URL https://royalsocietypublishing.org/doi/10.1098/rspa.2015.0890 - [35] B. Von Blanckenhagen, P. Gumbsch, E. Arzt, Dislocation sources in discrete dislocation simulations of thin-film plasticity and the hall-petch relation, Modelling and Simulation in Materials Science and Engineering 9 (3) (2001) 157.
- [36] R. N. Yellakara, Z. Wang, A three-dimensional dislocation dynamics study of the effects of grain size and shape on strengthening behavior of fcc cu, Computational Materials Science 87 (2014) 253–259.
-
[37]
M. Jiang, B. Devincre, G. Monnet,
Effects
of the grain size and shape on the flow stress: A dislocation dynamics
study, International Journal of Plasticity 113 (2019) 111–124.
doi:10.1016/j.ijplas.2018.09.008.
URL https://linkinghub.elsevier.com/retrieve/pii/S0749641918303425 - [38] H. Conrad, G. Schoeck, Cottrell locking and the flow stress in iron, Acta Metall. (1960). doi:10.1016/0001-6160(60)90175-9.
-
[39]
H. Tjerkstra,
The
effect of grain size on the stress-strain curve of -iron and the
connection with the plastic deformation of the grain boundaries, Acta
Metallurgica 9 (4) (1961) 259–263.
doi:10.1016/0001-6160(61)90218-8.
URL https://linkinghub.elsevier.com/retrieve/pii/0001616061902188 - [40] R. A. Jago, N. Hansen, Grain size effects in the deformation of polycrystalline iron, Acta Metallurgica (1986). doi:10.1016/0001-6160(86)90118-5.
-
[41]
M. A. Meyers, U. R. Andrade, A. H. Chokshi,
The effect of grain size
on the high-strain, high-strain-rate behavior of copper, Metallurgical and
Materials Transactions A 26 (11) (1995) 2881–2893.
doi:10.1007/BF02669646.
URL http://link.springer.com/10.1007/BF02669646 -
[42]
N. Tsuchida, H. Masuda, Y. Harada, K. Fukaura, Y. Tomota, K. Nagai,
Effect
of ferrite grain size on tensile deformation behavior of a ferrite-cementite
low carbon steel, Materials Science and Engineering: A 488 (1-2) (2008)
446–452.
doi:10.1016/j.msea.2007.11.047.
URL https://linkinghub.elsevier.com/retrieve/pii/S0921509307018485 - [43] X. Feaugas, H. Haddou, Grain-size effects on tensile behavior of nickel and AlSl 316L stainless steel, Metallurgical and Materials Transactions A: Physical Metallurgy and Materials Science (2003). doi:10.1007/s11661-003-0296-5.
-
[44]
D. Dunstan, A. Bushby,
The
scaling exponent in the size effect of small scale plastic deformation,
International Journal of Plasticity 40 (2013) 152–162.
doi:10.1016/j.ijplas.2012.08.002.
URL https://linkinghub.elsevier.com/retrieve/pii/S0749641912001180 - [45] C. Shen, C. Wang, X. Wei, Y. Li, S. van der Zwaag, W. Xu, Physical metallurgy-guided machine learning and artificial intelligent design of ultrahigh-strength stainless steel, Acta Materialia 179 (2019) 201–214.
- [46] C. Wang, H. Fu, L. Jiang, D. Xue, J. Xie, A property-oriented design strategy for high performance copper alloys via machine learning, npj Computational Materials 5 (1) (2019) 87.
- [47] J. Li, Y. Zhang, X. Cao, Q. Zeng, Y. Zhuang, X. Qian, H. Chen, Accelerated discovery of high-strength aluminum alloys by machine learning, Communications Materials 1 (1) (2020) 73.
- [48] N. Reddy, B. B. Panigrahi, C. M. Ho, J. H. Kim, C. S. Lee, Artificial neural network modeling on the relative importance of alloying elements and heat treatment temperature to the stability of and phase in titanium alloys, Computational Materials Science 107 (2015) 175–183.
- [49] Y. Deng, Y. Zhang, X. Gong, W. Hu, Y. Wang, Y. Liu, L. Lian, An intelligent design for Ni-based superalloy based on machine learning and multi-objective optimization, Materials & Design 221 (2022) 110935.
- [50] C. Wen, Y. Zhang, C. Wang, D. Xue, Y. Bai, S. Antonov, L. Dai, T. Lookman, Y. Su, Machine learning assisted design of high entropy alloys with desired property, Acta Materialia 170 (2019) 109–117.
- [51] Y.-J. Chang, C.-Y. Jui, W.-J. Lee, A.-C. Yeh, Prediction of the composition and hardness of high-entropy alloys by machine learning, Jom 71 (2019) 3433–3442.
- [52] D. Raabe, J. R. Mianroodi, J. Neugebauer, Accelerating the design of compositionally complex materials via physics-informed artificial intelligence, Nature Computational Science 3 (3) (2023) 198–209.
- [53] K. Rajan, Materials informatics, Materials Today 8 (10) (2005) 38–45.
- [54] K. Rajan, Materials informatics: The materials “gene” and big data, Annual Review of Materials Research 45 (2015) 153–169.
- [55] C. Zou, J. Li, W. Y. Wang, Y. Zhang, D. Lin, R. Yuan, X. Wang, B. Tang, J. Wang, X. Gao, et al., Integrating data mining and machine learning to discover high-strength ductile titanium alloys, Acta Materialia 202 (2021) 211–221.
- [56] Z. Pei, J. Yin, P. K. Liaw, D. Raabe, Toward the design of ultrahigh-entropy alloys via mining six million texts, Nature Communications 14 (1) (2023) 54.
- [57] P. M. Derlet, R. Maaß, Universal power-law strengthening in metals?, Scripta Materialia 109 (2015) 19–22.
- [58] E. Van Der Giessen, P. A. Schultz, N. Bertin, V. V. Bulatov, W. Cai, G. Csányi, S. M. Foiles, M. G. D. Geers, C. González, M. Hütter, W. K. Kim, D. M. Kochmann, J. Llorca, A. E. Mattsson, J. Rottler, A. Shluger, R. B. Sills, I. Steinbach, A. Strachan, E. B. Tadmor, Roadmap on multiscale materials modeling, Modelling and Simulation in Materials Science and Engineering 28 (4) (2020) 043001.
-
[59]
Y. Gu, D. W. Eastman, K. J. Hemker, J. A. El-Awady,
A
statistical model for predicting size effects on the yield strength in
dislocation-mediated crystal plasticity, Journal of the Mechanics and
Physics of Solids (2020) 104245doi:10.1016/j.jmps.2020.104245.
URL https://linkinghub.elsevier.com/retrieve/pii/S0022509620304567 -
[60]
J. A. El-Awady, M. Wen, N. M. Ghoniem,
The
role of the weakest-link mechanism in controlling the plasticity of
micropillars, Journal of the Mechanics and Physics of Solids 57 (1) (2009)
32–50.
doi:10.1016/j.jmps.2008.10.004.
URL https://linkinghub.elsevier.com/retrieve/pii/S0022509608001737 - [61] H.-J. Bunge, Texture Analysis in Material Science-Mathematical methods, Elsevier, 2013.
-
[62]
D. Rowenhorst, A. D. Rollett, G. S. Rohrer, M. Groeber, M. Jackson, P. J.
Konijnenberg, M. De Graef,
Consistent
representations of and conversions between 3D rotations, Modelling and
Simulation in Materials Science and Engineering 23 (8) (2015) 083501.
doi:10.1088/0965-0393/23/8/083501.
URL https://iopscience.iop.org/article/10.1088/0965-0393/23/8/083501 -
[63]
D. W. Eastman, Z. Alam, G. Weber, P. A. Shade, M. D. Uchic, W. C. Lenthe, T. M.
Pollock, K. J. Hemker,
Benchmarking Crystal
Plasticity Models with Microtensile Evaluation and 3D Characterization of
René 88DT, in: Superalloys 2016, John Wiley & Sons, Inc., Hoboken,
NJ, USA, 2016, pp. 811–820.
doi:10.1002/9781119075646.ch87.
URL http://doi.wiley.com/10.1002/9781119075646.ch87 -
[64]
S. Floreen, J. Westbrook,
Grain
boundary segregation and the grain size dependence of strength of
nickel-sulfur alloys, Acta Metallurgica 17 (9) (1969) 1175–1181.
doi:10.1016/0001-6160(69)90095-9.
URL https://linkinghub.elsevier.com/retrieve/pii/0001616069900959 -
[65]
B. Wilcox, A. Clauer,
The
role of grain size and shape in strengthening of dispersion hardened nickel
alloys, Acta Metallurgica 20 (5) (1972) 743–757.
doi:10.1016/0001-6160(72)90103-4.
URL https://linkinghub.elsevier.com/retrieve/pii/0001616072901034 - [66] A. A. Thompson, Yielding in nickel as a function of grain or cell size, Acta Metallurgica (1975). doi:10.1016/0001-6160(75)90142-X.
-
[67]
F. Ebrahimi, G. Bourne, M. Kelly, T. Matthews,
Mechanical
properties of nanocrystalline nickel produced by electrodeposition,
Nanostructured Materials 11 (3) (1999) 343–350.
doi:10.1016/S0965-9773(99)00050-1.
URL https://linkinghub.elsevier.com/retrieve/pii/S0965977399000501 -
[68]
C. Xiao, R. Mirshams, S. Whang, W. Yin,
Tensile
behavior and fracture in nickel and carbon doped nanocrystalline nickel,
Materials Science and Engineering: A 301 (1) (2001) 35–43.
doi:10.1016/S0921-5093(00)01392-7.
URL https://linkinghub.elsevier.com/retrieve/pii/S0921509300013927 -
[69]
R. Schwaiger, B. Moser, M. Dao, N. Chollacoop, S. Suresh,
Some
critical experiments on the strain-rate sensitivity of nanocrystalline
nickel, Acta Materialia 51 (17) (2003) 5159–5172.
doi:10.1016/S1359-6454(03)00365-3.
URL https://linkinghub.elsevier.com/retrieve/pii/S1359645403003653 -
[70]
M. Meyers, A. Mishra, D. Benson,
Mechanical
properties of nanocrystalline materials, Progress in Materials Science
51 (4) (2006) 427–556.
doi:10.1016/j.pmatsci.2005.08.003.
URL https://linkinghub.elsevier.com/retrieve/pii/S0079642505000447 - [71] L. Hollang, E. Hieckmann, D. Brunner, C. Holste, W. Skrotzki, Scaling effects in the plasticity of nickel, Materials Science and Engineering: A 424 (1-2) (2006) 138–153.
-
[72]
C. Keller, E. Hug,
Hall–Petch
behaviour of Ni polycrystals with a few grains per thickness, Materials
Letters 62 (10-11) (2008) 1718–1720.
doi:10.1016/j.matlet.2007.09.069.
URL https://linkinghub.elsevier.com/retrieve/pii/S0167577X07009883 - [73] C. Keller, E. Hug, X. Feaugas, Microstructural size effects on mechanical properties of high purity nickel, International Journal of Plasticity (2011). doi:10.1016/j.ijplas.2010.08.002.
- [74] A. W. Thompson, Effect of grain size on work hardening in nickel, Acta Metallurgica 25 (1) (1977) 83–86.
-
[75]
S. N. Naik, S. M. Walley,
The Hall–Petch
and inverse Hall–Petch relations and the hardness of nanocrystalline
metals, Journal of Materials Science 55 (7) (2020) 2661–2681.
doi:10.1007/s10853-019-04160-w.
URL http://link.springer.com/10.1007/s10853-019-04160-w -
[76]
S. Lefebvre, B. Devincre, T. Hoc,
Simulation
of the Hall–Petch effect in ultra-fine grained copper, Materials Science
and Engineering: A 400-401 (2005) 150–153.
doi:10.1016/j.msea.2005.02.067.
URL https://linkinghub.elsevier.com/retrieve/pii/S0921509305002741 -
[77]
D. Dunstan, A. Bushby,
Grain
size dependence of the strength of metals: The Hall–Petch effect does not
scale as the inverse square root of grain size, International Journal of
Plasticity 53 (2014) 56–65.
doi:10.1016/j.ijplas.2013.07.004.
URL https://linkinghub.elsevier.com/retrieve/pii/S074964191300140X - [78] T. P. Ryan, Sample Size Determination and Power, 2013. doi:10.1002/9781118439241.
- [79] C. M. Bishop, Mixture density networks (1994).
- [80] C. M. Bishop, Pattern recognition and machine learning, springer, 2006.
- [81] U. Messerschmidt, B. V. Petukhov, M. Bartsch, C. Dietzsch, B. Geyer, D. Häussler, L. Ledig, M. Feuerbacher, P. Schall, K. Urban, Dislocation mobility versus dislocation substructure controlled deformation of icosahedral al–pd–mn single quasicrystals, Materials Science and Engineering: A 319 (2001) 107–110.
- [82] H. Fan, Q. Wang, J. A. El-Awady, D. Raabe, M. Zaiser, Strain rate dependency of dislocation plasticity, Nature Communications 12 (1) (2021) 1–11.
- [83] J. Segurado, R. A. Lebensohn, J. LLorca, Computational homogenization of polycrystals, Advances in Applied Mechanics 51 (2018) 1–114.
- [84] K. Thool, A. Patra, D. Fullwood, K. V. M. Krishna, D. Srivastava, I. Samajdar, The role of crystallographic orientations on heterogeneous deformation in a zirconium alloy: a combined experimental and modeling study, International Journal of Plasticity 133 (2020) 102785.
- [85] A. Chernatynskiy, S. R. Phillpot, R. LeSar, Uncertainty quantification in multiscale simulation of materials: A prospective, Annual Review of Materials Research 43 (2013) 157–182.
- [86] H. Van Swygenhoven, P. M. Derlet, Grain-boundary sliding in nanocrystalline fcc metals, Physical review B 64 (22) (2001) 224105.
- [87] Y. J. Wei, L. Anand, Grain-boundary sliding and separation in polycrystalline metals: application to nanocrystalline fcc metals, Journal of the Mechanics and Physics of Solids 52 (11) (2004) 2587–2616.
-
[88]
J. Han, S. L. Thomas, D. J. Srolovitz,
Grain-boundary
kinetics: A unified approach, Progress in Materials Science 98 (2018)
386–476.
doi:10.1016/j.pmatsci.2018.05.004.
URL https://linkinghub.elsevier.com/retrieve/pii/S0079642518300641 - [89] P. Feltham, Grain growth in metals, Acta metallurgica 5 (2) (1957) 97–105.
- [90] S. Sun, V. Sundararaghavan, A probabilistic crystal plasticity model for modeling grain shape effects based on slip geometry, Acta Materialia 60 (13-14) (2012) 5233–5244.
- [91] M. Diehl, M. Groeber, C. Haase, D. A. Molodov, F. Roters, D. Raabe, Identifying structure–property relationships through dream. 3d representative volume elements and damask crystal plasticity simulations: an integrated computational materials engineering approach, Jom 69 (5) (2017) 848–855.
- [92] F. Sun, E. D. Meade, N. P. O’Dowd, Strain gradient crystal plasticity modelling of size effects in a hierarchical martensitic steel using the voronoi tessellation method, International Journal of Plasticity 119 (2019) 215–229.
- [93] D.-H. Ahn, G.-G. Lee, J. Moon, H. S. Kim, Y.-B. Chun, Analysis of texture and grain shape effects on the yield anisotropy of zr-2.5 wt% Nb pressure tube alloy using crystal plasticity finite element method, Journal of Nuclear Materials 555 (2021) 153112.
- [94] H. Conrad, S. Feuerstein, L. Rice, Effects of grain size on the dislocation density and flow stress of niobium, Materials Science and Engineering (1967). doi:10.1016/0025-5416(67)90032-8.
- [95] J. D. Embury, in: A. Kelly, R. B. Nicholson (Eds.), Strengthening Methods in crystals, Applied Science Publishers, 1971.
- [96] H. Conrad, Grain-size dependence of the flow stress of cu from millimeters to nanometers, Metallurgical and Materials Transactions A 35 (9) (2004) 2681–2695.
- [97] H. Mecking, U. F. Kocks, Kinetics of flow and strain-hardening, Acta Metallurgica 29 (11) (1981) 1865–1875.
-
[98]
U. Kocks, H. Mecking,
Physics
and phenomenology of strain hardening: the FCC case, Progress in Materials
Science 48 (3) (2003) 171–273.
doi:10.1016/S0079-6425(02)00003-8.
URL https://linkinghub.elsevier.com/retrieve/pii/S0079642502000038 - [99] J. Schmidhuber, Deep learning in neural networks: An overview, Neural Networks 61 (2015) 85–117. doi:10.1016/j.neunet.2014.09.003.
- [100] A. Graves, Generating sequences with recurrent neural networks, arXiv preprint arXiv:1308.0850 (2013).
- [101] T. Capes, P. Coles, A. Conkie, L. Golipour, A. Hadjitarkhani, Q. Hu, N. Huddleston, M. Hunt, J. Li, M. Neeracher, et al., Siri on-device deep learning-guided unit selection text-to-speech system., in: Interspeech, 2017, pp. 4011–4015.
- [102] C. Martin, D. Duhaime, cpmpercussion/keras-mdn-layer v0.3.0, https://doi.org/10.5281/zenodo.3526753 (Nov. 2019). doi:10.5281/zenodo.3526753.