GOALS-JWST: NIRCam and MIRI Imaging of the Circumnuclear Starburst Ring in NGC 7469
Abstract
We present James Webb Space Telescope (JWST) imaging of NGC 7469 with the Near-Infrared Camera (NIRCam) and the Mid-InfraRed Instrument (MIRI). NGC 7469 is a nearby, , luminous infrared galaxy (LIRG) that hosts both a Seyfert Type-1.5 nucleus and a circumnuclear starburst ring with a radius of 0.5 kpc. The new near-infrared (NIR) JWST imaging reveals 66 star-forming regions, 37 of which were not detected by HST observations. Twenty-eight of the 37 sources have very red NIR colors that indicate obscurations up to A and a contribution of at least 25 from hot dust emission to the 4.4m band. Their NIR colors are also consistent with young (5 Myr) stellar populations and more than half of them are coincident with the MIR emission peaks. These younger, dusty star-forming regions account for 6 and 17 of the total 1.5m and 4.4m luminosity of the starburst ring, respectively. Thanks to JWST, we find a significant number of young dusty sources that were previously unseen due to dust extinction. The newly identified 28 young sources are a significant increase compared to the number of HST-detected young sources (4—5). This makes the total percentage of the young population rise from 15 to 48. These results illustrate the effectiveness of JWST in identifying and characterizing previously hidden star formation in the densest star-forming environments around AGN.
1 Introduction
NGC 7469 is a nearby () luminous infrared galaxy () that is part of the Great Observatories All-sky LIRGs Survey (GOALS; Armus et al., 2009). NGC 7469 hosts both a Type-1.5 Seyfert nucleus (Landt et al., 2008) and a compact ( kpc) circumnuclear starburst ring (Miles et al., 1994; Genzel et al., 1995; Fathi et al., 2015; Song et al., 2021). Extensive multi-band imaging and spectroscopy have been reported in the literature (e.g., Stierwalt et al., 2013; Inami et al., 2013, 2018), and its Type-1.5 nucleus is one of the most extensively studied in the sky (e.g., Behar et al., 2017; Linden et al., 2019; Larson et al., 2020). Reverberation mapping measurements indicate a black hole mass of (Peterson et al., 2014; Lu et al., 2021) and an AGN-driven biconical outflow of highly ionized gas has been observed (Müller-Sánchez et al., 2011; Robleto-Orús et al., 2021; Xu & Wang, 2022). Radio observations also reveal a nuclear CO molecular bar inside the ring that crosses the AGN (Davies et al., 2004; Izumi et al., 2015, 2020).
The circumnuclear starburst ring accounts for about two-thirds of the bolometric luminosity of the galaxy (Genzel et al., 1995; Song et al., 2021). Hubble Space Telescope (HST)-based UV-through-NIR spectral energy distribution (SED) fitting of thirty 1.1m-selected star-forming regions found in the ring suggests a bi-modality in the stellar population (Díaz-Santos et al., 2007, hereafter DS07). DS07 found that nineteen of the regions are likely of intermediate age (8—20 Myr) and are found in regions of low extinction, 1.25 mag. Five of the remaining regions were classified as having younger ages (1—3 Myr) and are located in regions of higher extinction, 3 mag. This younger, obscured population coincides with the peaks in the radio free-free emission (DS07; Orienti & Prieto, 2010). The intermediate-aged population, on the other hand, is responsible for the UV, optical, and NIR continuum emission.
NGC 7469 provides the unique opportunity to study the starburst-AGN connection since it hosts an AGN surrounded by a starburst ring. However, due to the compact nature of this system, it was difficult to achieve both the resolution and sensitivity needed to study the circumnuclear environment in the MIR on sub-kpc scales. With JWST, we can now explore the dustiest regions of the starburst ring on these scales.
In this Letter, we examine NIRCam and MIRI imaging of the circumnuclear starburst ring in NGC 7469. With the unprecedented spatial resolution and sensitivity of JWST, we identify a new set of previously undetected star-forming regions that are heavily obscured by dust. A cosmology of km s-1 Mpc-1, , and is adopted. With this cosmology, NGC 7469 is located 70.8 Mpc away, and 1′′ subtends 330 pc.
2 Observations
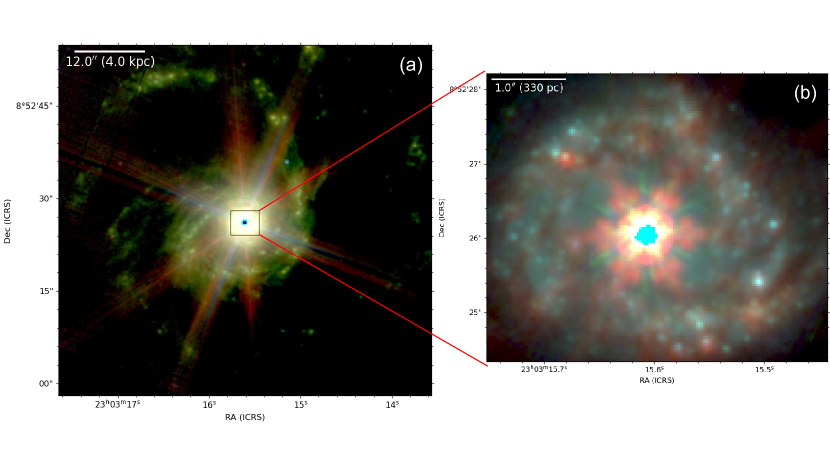
JWST/MIRI (Bouchet et al., 2015; Rieke et al., 2015) imaging was obtained with the F560W (5.6m), F770W (7.7m), and F1500W (15.0m) filters with both the BRIGHTSKY and SUB128 subarray modes. Our analysis was done on the SUB128 subarray data where the full starburst ring was observable in the field of view (FoV: ). Here, the nucleus remained unsaturated by the AGN. Observations of the SUB128 were taken on 2022-07-02, where the exposure time was 46 seconds for the F560W filter and 48 seconds for the F770W and F1500W filters. Figure 1a shows a false-color image of the MIRI/BRIGHTSKY subarray data.
JWST/NIRCam (Greene et al., 2016) imaging was taken with the F150W (1.5m), F200W (2.0m), F335M (3.4m), and F444W (4.4m) filters. Like MIRI, we use the SUB160P subarray data due to the nucleus being saturated by the AGN in all of the full array images. The entire starburst ring fits within the FoV (short—, long—) of the subarray mode and the nucleus was only partially saturated in the F335M and F444W filters. SUB160P observations were taken on 2022-07-03, where the exposure time for each filter was 67 seconds. Figure 1b shows a false-color image of the NIRCam/SUB160P subarray data.
All images were processed through the standard JWST reduction pipeline (Gordon et al., 2015), and we selected stage 3 calibrated images for analysis. We made corrections to the WCS coordinates to align all the NIRCam and MIRI calibrated images to the Gaia reference frame using publicly available routines111https://github.com/dancoe/NIRCam,222https://github.com/STScI-MIRI/Imaging_ExampleNB. Due to the contemporary state of JWST, the reduction pipeline is continuously receiving updates. As such, we have applied the most current up-to-date zero-point corrections (CRDS0989) to the flux densities in each NIRCam filter (Boyer et al., 2022)333https://www.stsci.edu/contents/news/jwst/2022/an-improved-nircam-flux-calibration-is-now-available.
3 Analysis
Before source identification was performed, the complex point spread function (PSF) was fit and subtracted from the central source to minimize contamination from instrumental scattered light. This was done by first fitting the AGN with a PSF model using GALFIT (Peng et al., 2010), where the PSF was constructed using the WebbPSF simulation tool (Perrin et al., 2014)444https://www.stsci.edu/jwst/science-planning/proposal-planning-toolbox/psf-simulation-tool. The best-fit PSF model was then subtracted, and pixels showing excess emission within the AGN were masked.
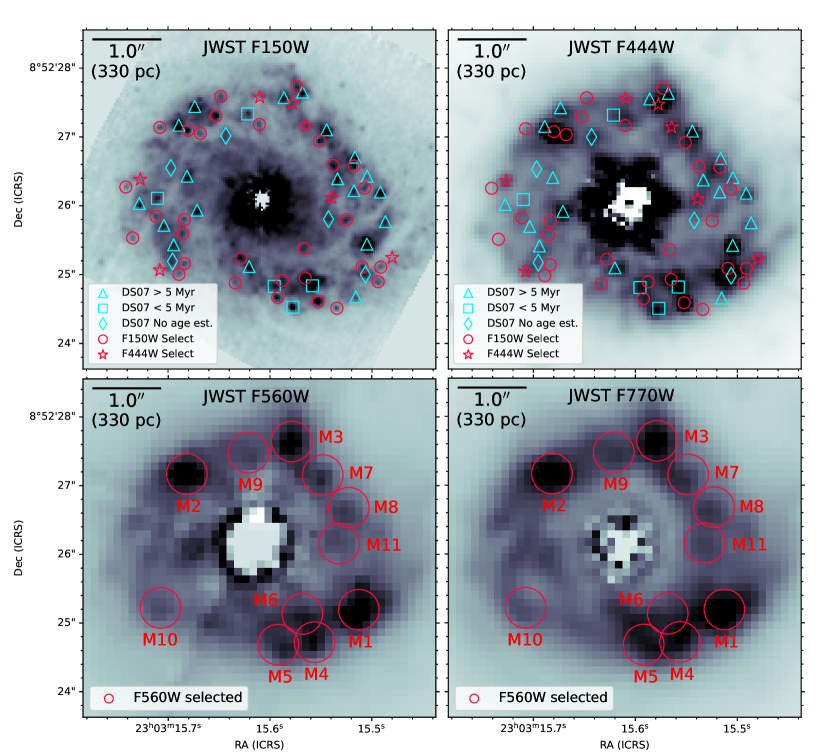
Source identification over the starburst ring was then performed, first on the NIRCam/F150W image to take advantage of the high spatial resolution (see Figure 2). The lack of strong emission lines within its wavelength coverage makes it well-suited to sample the continuum emission. To identify sources, the DAOFIND (Stetson, 1987) algorithm from the photutils detection package (Bradley et al., 2022) was used, where a detected source needed to have a full-width half-maximum (FWHM) greater than or equal to the PSF FWHM of the filter and a peak emission 3 above the local background. This results in a detection limit of 400 MJy/sr.
A total of 59 star-forming regions were detected in the starburst ring in the F150W filter. About 40 (67) of these objects appear as unresolved sources. Because the measured FWHM of the PSF of the F150W filter, as determined by field stars, corresponds to 22 pc, the sizes of the unresolved sources are consistent with those of stellar clusters in nearby galaxies, making them viable candidates for compact clusters (Linden et al., 2017; Norris et al., 2019; Brown & Gnedin, 2021). We do not refer to the resolved sources as compact clusters because a cluster refers to a distinct grouping of stars, which is best modeled as a single stellar population, and are likely gravitationally bound (Krumholz et al., 2019). For consistency, we refer to all detected sources as “regions”, whether they are resolved or not. We also note that 29 of the F150W-detected sources were selected via HST/F110W (1.1m) filter imaging in DS07. An additional source, C26, was detected in DS07 but only in the HST 1.1m band. This source is not detected in the JWST images and we exclude it from the analysis.
| ID | RA | Dec | Dist. from | F150W | F200W | F335M | F444W | F560W | F770W | F1500W |
|---|---|---|---|---|---|---|---|---|---|---|
| Degrees (ICRS) | Center (kpc) | mJy | mJy | mJy | mJy | mJy | mJy | mJy | ||
| C1 | 345.814664 | 8.8737306 | 0.58 | 0.260.02 | 0.270.02 | 0.220.02 | 0.230.02 | — | — | — |
| C2 | 345.8148249 | 8.874195 | 0.47 | 0.140.02 | 0.130.01 | 0.170.03 | 0.210.02 | — | — | — |
| C3 | 345.8153678 | 8.8742908 | 0.54 | 0.130.02 | 0.140.02 | 0.150.02 | 0.130.02 | — | — | — |
| C4 | 345.8148865 | 8.8735722 | 0.49 | 0.140.02 | 0.170.02 | 0.190.04 | 0.160.02 | — | — | — |
| C5 | 345.8146074 | 8.8739447 | 0.60 | 0.130.01 | 0.140.01 | 0.130.01 | 0.120.01 | — | — | — |
| N1 | 345.8149157 | 8.8736028 | 0.44 | 0.110.02 | 0.120.03 | 0.180.03 | 0.160.02 | — | — | — |
| N2 | 345.8148628 | 8.8735086 | 0.57 | 0.100.01 | 0.100.01 | 0.180.02 | 0.260.02 | — | — | — |
| N3 | 345.8152803 | 8.8742575 | 0.45 | 0.070.01 | 0.080.02 | 0.080.02 | 0.07 | — | — | — |
| N4 | 345.8147162 | 8.8740557 | 0.50 | 0.070.01 | 0.080.02 | 0.130.03 | 0.110.02 | — | — | — |
| N5 | 345.8153949 | 8.8741989 | 0.48 | 0.070.02 | 0.110.02 | 0.270.03 | 0.440.03 | — | — | — |
| … | … | … | … | … | … | … | … | … | … | |
| N36 | 345.8145609 | 8.8736856 | 0.71 | 0.02 | 0.04 | 0.090.01 | 0.100.02 | — | — | — |
| N37 | 345.8155022 | 8.8736348 | 0.59 | 0.02 | 0.03 | 0.070.02 | 0.090.02 | — | — | — |
| P1 | 345.8153549 | 8.8737623 | 0.30 | 0.03 | 0.02 | 0.090.03 | 0.06 | — | — | — |
| P2 | 345.8152995 | 8.8737334 | 0.33 | 0.02 | 0.03 | 0.090.02 | 0.08 | — | — | — |
| M1 | 345.8146537 | 8.8736629 | 0.59 | — | — | — | — | 3.30.7 | 15.42.9 | 33.94.3 |
| M2 | 345.8153581 | 8.8742113 | 0.48 | — | — | — | — | 3.20.6 | 15.31.7 | 47.14.0 |
| M3 | 345.8149285 | 8.8743432 | 0.52 | — | — | — | — | 2.70.6 | 13.62.8 | 26.62.6 |
| M4 | 345.8148351 | 8.8735317 | 0.54 | — | — | — | — | 2.50.7 | 12.32.0 | 32.52.8 |
| … | … | … | … | … | … | … | … | … | … | |
| M10 | 345.8154655 | 8.8736699 | 0.56 | — | — | — | — | 1.30.5 | 6.00.8 | 13.61.8 |
| M11 | 345.814734 | 8.8739304 | 0.39 | — | — | — | — | 1.00.4 | 6.01.2 | 6.73.6 |
Note. — The distance for each source is measured from the central AGN. All flux densities are in units of mJy. Source labels are structured as follows: C—regions first identified by DS07, N—new regions identified in the F150W and F444W filters, P—new regions specifically identified in the NIRCam/F335M filter, M—new MIRI/F560W-identified star-forming regions. HST-identified sources (C1-C30) are in order of decreasing HST 1.1m flux as measured and presented in DS07. All other sources are in order of decreasing 1.5m (NIRCam) or 5.6m (MIRI) flux density. Upper-limits indicate the source flux is below the 3 detection threshold for that filter.
(This table is available in its entirety in a machine-readable form.)
To investigate potentially missing sources due to extreme dust obscuration, we ran a similar selection scheme on the F444W image. The F444W filter better samples the continuum than the F335M filter, which may be contaminated by the 3.3m polycyclic aromatic hydrocarbon (PAH) feature. An additional seven sources were discovered this way, resulting in a total of 66 star-forming regions detected in the F150W and F444W images (see Figure 2). For sources that are not detected in a particular filter, we denote the extracted flux as an upper limit (see Table 1). Lastly, we note that two star-forming regions were detected only in the F335M filter. These are likely PAH-dominated sources and we list them in Table 1 together with the F150W and F444W-selected sources.
Due to the angular resolution differences between NIRCam and MIRI, a separate sample of star-forming regions were identified in the MIR. Thirteen regions were found in the F560W image using the same method as used above. Of these, two regions were rejected due to intersection with the AGN diffraction spikes. The remaining eleven sources serve as our MIRI sample and their locations are shown in Figure 2.
Aperture photometry was performed using the photutils photometry package555https://photutils.readthedocs.io/en/stable/aperture.html. For NIRCam, the radius of the extraction aperture was set to 0.073′′, the largest size at which there is no source overlap in all four filters. For MIRI, the aperture radius for all three filters was set to 0.31′′, where source overlap was also kept to a minimum. To perform local background subtraction, background annuli with varying radii were used. The inner and outer radii ranged from 1.1—2.0 and 1.5—4.0 times the radius of each aperture, respectively. Any source overlapping with the background annuli was masked and the three sigma-clipped median of the annuli measurements was used for background subtraction (typically 30–45 of the source flux). Following this, aperture corrections were applied using the encircled aperture-to-total energy of each filter.666https://jwst-docs.stsci.edu/jwst-near-infrared-camera/nircam-performance/nircam-point-spread-functions,777https://jwst-docs.stsci.edu/jwst-mid-infrared-instrument/miri-performance/miri-point-spread-functions The resulting flux densities are listed in Table 1.
4 Results
The significant improvement in sensitivity of JWST over previous NIR and MIR observations is evident from the number of new sources identified. Thirty-seven star-forming regions were newly discovered with NIRCam, with some single HST sources being resolved into two or more sources. Additionally, eleven regions are detected in the MIRI/F560W image. In the following sections, we discuss the spatial locations, colors, and estimates of the ages of this new population of star-forming regions.
4.1 Locations of Sources
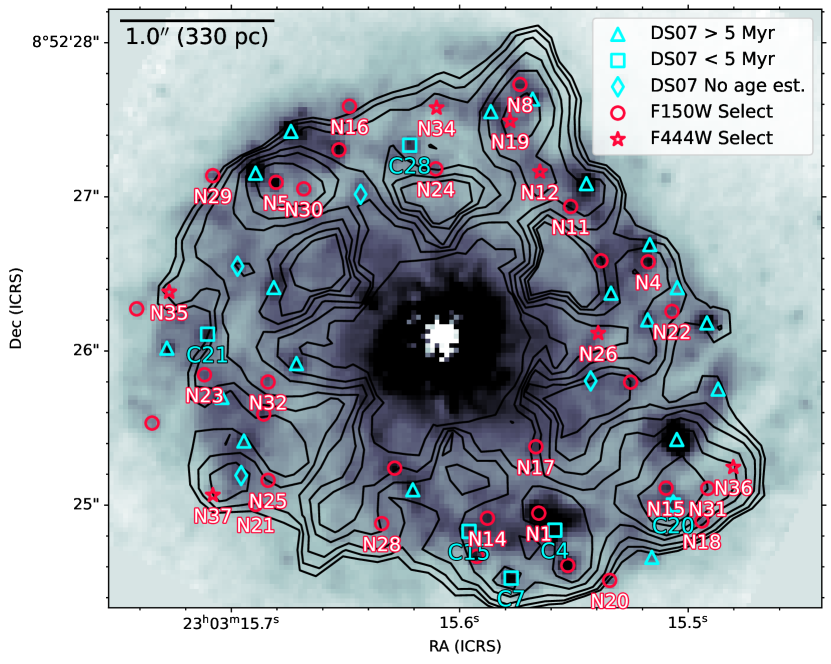
Figure 3 displays the locations of the NIRCam star-forming regions. Overall, the 66 detected sources are evenly distributed azimuthally throughout the ring. However, we find that the newly detected JWST sources are somewhat clustered towards the North and Southwest regions, which coincide with the peaks of radio emission at the both ends of the nuclear CO molecular bar (see Section 5 for further discussion).
In the MIRI images, seven regions of strong MIR emission (M1—M6, M10) are clearly seen in the ring (see Figure 2). The locations of these regions match well with previous ground-based MIR observations of the starburst ring (Soifer et al., 2003; Ramos Almeida et al., 2011). With JWST, an additional four new regions are identified in the Northwest (M7, M8, M11) and Northeast (M9). The combined luminosity of these seven regions accounts for 36 of the total luminosity of the starburst ring at 5.6m.
A comparison of Figures 1b and 3 reveals that the sources detected by HST in DS07 tend to be the bluest and brightest sources in the F150W filter, while JWST uncovers the reddest and faintest sources. Indeed, some of the brightest regions in the F444W filter (N5, N15, N19) are not detected by HST. The brightest source at 4.4m is N5, and is clearly seen as a red source in Figure 1b. Lastly, as shown in Figure 3, over half of the newly detected NIRCam sources—the majority of which have redder colors—fall within regions of strong MIR emission.
4.2 NIR Colors of Sources
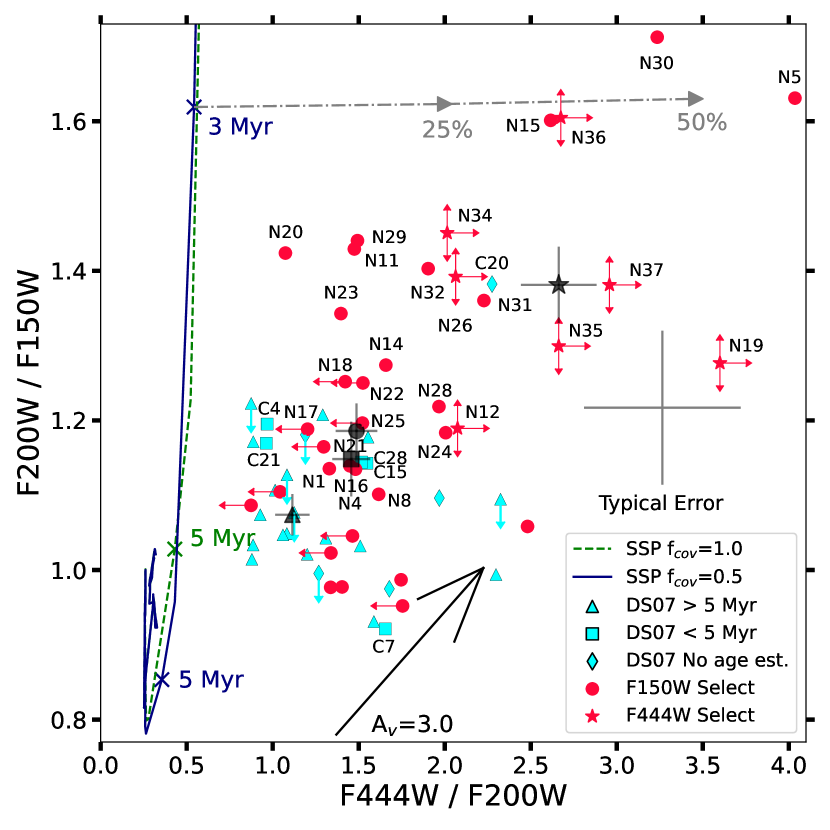
Figure 4 shows the F200W/F150W flux ratios against the F444W/F200W flux ratios for all 66 NIRCam sources. The median values for each group of sources, calculated from Bayesian bootstrapping (3,000 iterations and 1 confidence), are shown as the black matching markers. Among the 37 newly identified JWST sources, the median F444W/F150W flux ratio is 40 higher than that of the 29 sources reported in DS07. The median and flux ratios of the JWST-detected sources are also 16 and 57 higher than those of the HST-detected sources, respectively. In addition, of these 37 new sources, 28 show red colors ( or ). However, there are some newly identified regions with blue NIR colors ( and ) that are consistent with the colors of the intermediate-aged HST sample. These sources were previously missed by HST, either due to being below the detection limit or blended with other sources.
Due to the large range in the resolution of the NIRCam filters used, we cross-convolved each NIRCam image with the PSF of the other filters used in Figure 4 to bring the image pairs to a common resolution and verify the colors measured in Section 3. The photometric measurements of these convolved images were found to be consistent with those of the non-convolved images, indicating our photometric calibrations are accurate.
5 Discussion
As previously mentioned, 28 of the newly discovered sources show redder NIR colors, or , than the rest of the sample. To help explain these red colors, we plot in Figure 4 Yggdrasil single-stellar population (SSP) models888https://www.astro.uu.se/~ez/yggdrasil/yggdrasil.html (Zackrisson et al., 2011), assuming a Kroupa initial mass function (Kroupa, 2001) and solar metallicity. We include two models, where we altered the fraction of ionizing photons () which ionize the cloud from 50 to 100. Comparing the colors of our sample to the SSP models, we find that all regions have extinction levels of 1 or greater, which is consistent with the values reported in DS07.
We separate the DS07 sample into three groups, as determined by their SED fits: sources older than 5 Myr, younger than 5 Myr, and those where ages could not be determined. To roughly estimate the ages of the NIRCam star-forming regions, we use their NIR colors, and compare them to those of the HST-identified regions with younger stellar populations (5 Myr). The majority of these younger HST sources span a specific color space, and , and are redder than most of the other HST sources. The median and ratios of these HST-detected young sources are 7 and 35 higher than the intermediate-aged HST-detected sources. One of these young sources, C7, has a significantly lower F200W/F150W value than the rest, but it lacks HST photometry longwards of 1.1m, which suggests that the inferred age for C7 may be inaccurate.
Most of the newly discovered JWST sources are redder in both colors than the young regions catalogued in DS07. Many of these sources are likely very young with significant dust obscuration and hot dust emission affecting their NIR colors. Some regions (N17, N20) fall close to the SSP models and thus likely contain a younger stellar population in a less obscured environment. Other regions (N14, N28) likely host younger stellar populations, but are highly obscured. Their colors can be mainly explained through varying degrees of attenuation, which can be as high as 7. They are also located within regions of strong MIR emission as shown in Figure 3. For the reddest sources, , heavy obscuration alone cannot explain the observed colors; a contribution of at least 25 from hot dust to the 4.4m band is needed. The degree to which all these red sources are obscured can provide some further insight into the ages of the stellar populations. Timescales of stellar feedback in young clusters indicate the surrounding gas clouds can be expulsed as fast as 2 Myr (Corbelli et al., 2017), or can take as long as 5 Myr (Messa et al., 2021). A progression of stellar ages has also been linked with obscuration, where younger populations (3 Myr) were shown to be more highly obscured than older populations (5 Myr, Hannon et al., 2019). This would suggest that the reddest sources in the SB ring could be as young or younger than 3 Myr, which is consistent with the ages of dusty SF regions found in this work. Indeed, spectral fitting of MIRI/MRS data reveals that the detected sources are in some of the most obscured locations in the ring (Lai et al., 2022). In addition, star formation rates (SFRs) estimated via the Pf, [Ne II], and [Ne III] emission lines indicate that these regions have the highest SFRs in the ring. The 28 newly identified red sources account for 6 of the total luminosity of the starburst ring in the 1.5m band and 17 in the 4.4m band.
As mentioned in Section 4.1, radio observations have shown a molecular CO(3-2) gas bar oriented 45∘ North-of-East that connects the starburst ring through the center (Izumi et al., 2015). Comparison with the MIRI 5.6m imaging reveals that the three strongest MIR emission regions (M1—M3) are co-spatial with the radio peaks of the bar (D, B, C of Figure 6 in Izumi et al., 2015). These also coincide with the peak emission seen at 8.4 and 33 GHz (Orienti & Prieto, 2010; Song et al., 2021). Analysis of the SEDs of these regions show a relatively steep spectral index (0.4—0.9), suggesting a non-thermal origin (Orienti & Prieto, 2010). Since about half of the HST and JWST-identified sources with younger ages in the Northeast and Southwest regions (N5, N15, N19, etc.) are aligned with these radio peaks, the origin of this non-thermal emission is most likely from supernovae events. If we assume the populations to be 3—5 Myr, then this emission could be from a second wave of OB stars.
Lastly, we note that seven of the red NIRCam sources are located outside of the bar: six in the East/Southeast (N21, N23, N25, N32, N35, N37) and five in the North/Northwest (N4, N11, N12, N22, N26). In the North/Northwest, the NIRCam sources are located in the region of the CO(3-2) emission, which could be an extension of the bar (or a part of a spiral arm; Izumi et al., 2015, 2020). We also detect MIR emission at the same location (M3, M7, M8, M11). In the East/Southeast, weak CO(2-1) and CO(3-2) emission that is co-spatial with the East/Southeastern sources is seen (Davies et al., 2004; Izumi et al., 2020). In addition, U et al. (2022) report [Ar II] strong emission that aligns well with the locations of our MIR sources. As such, these indicate a young stellar population and active star formation are occurring outside the bar.
6 Summary
In this Letter, we present JWST NIRCam/SUB160P and MIRI/SUB128 multi-band imaging of the circumnuclear starburst ring of NGC 7469. Our broadband imaging includes NIRCam F150W, F200W, F335M, F444W, and MIRI F560W, F770W, and F1500W filters for a full wavelength coverage of 1.5—15m. The significant improvement in sensitivity and resolution at NIR and MIR wavelengths has provided the most detailed look at the ages and colors of the star-forming regions in this starburst ring to date. The main results are:
• We report the detection of 59 star-forming regions in NIRCam/F150W imaging and seven star-forming regions in NIRCam/F444W, for a total of 66 detected regions. This more than doubles the 30 sources previously identified by HST. In addition, we detect eleven star-forming regions in the MIRI/F560W imaging.
• Based on NIRCam imaging, the new JWST-identified sources tend to be the reddest and faintest sources. Among these newly discovered regions, the median flux ratio is about 40 higher than that of previously HST-identified regions. Their median and flux ratios are also higher by about 16 and 57.
• We compare SSP models to the NIR colors of the newly discovered sources to estimate their ages. We find that heavy dust obscuration and hot dust emission are necessary to account for their red colors. Finally, we identify 28 star-forming regions with very red NIR colors that likely have young (5 Myr) stellar populations. These sources account for 6 and 17 of the total luminosity of the starburst ring at 1.5m and 4.4m, respectively. The 28 newly-detected, young sources hidden by dust are a significant increase over the 4-5 young sources previously identified by HST.
• The MIRI-selected regions contribute 36 of the total MIR emission of the starburst ring at 5.6m. More than half of these regions lie within the previously known CO molecular bar. Most of the red NIRCam-identified sources also fall within these MIR regions, indicating that with JWST we are discovering a large number of heavily obscured sources previously missed by HST.
• The locations of three of the MIRI-selected regions agree well with the 8.4 and 33 GHz emission peaks found in the CO molecular bar. Since the origin of this emission is likely non-thermal, supernovae could be contributing significantly to the radio peaks. We also find four red NIRCam sources in an East/Southeastern CO emitting region that are likely not associated with the bar. These regions could therefore be areas of active star formation that are off-axis from the bar.
We thank the referee for their insightful feedback that helped improve the manuscript. The JWST data presented in this paper were obtained from the Mikulski Archive for Space Telescopes (MAST) at the Space Telescope Science Institute. The specific observations analyzed can be accessed at 10.17909/1ct2-x706 (catalog https://doi.org/10.17909/1ct2-x706). STScI is operated by the Association of Universities for Research in Astronomy, Inc., under NASA contract NAS5–26555. Support to MAST for these data is provided by the NASA Office of Space Science via grant NAG5–7584 and by other grants and contracts. This work is based on observations made with the NASA/ESA/CSA James Webb Space Telescope. These observations are associated with program 1328 and are supported by NASA grant ERS-01328. H.I. and T.B. acknowledge support from JSPS KAKENHI Grant Number JP21H01129 and the Ito Foundation for Promotion of Science. YS is supported by the NSF through grant AST 1816838 and the Grote Reber Fellowship Program administered by the Associated Universities, Inc./ National Radio Astronomy Observatory. The Flatiron Institute is supported by the Simons Foundation. V.U acknowledges funding support from NASA Astrophysics Data Analysis Program (ADAP) grant 80NSSC20K0450. AMM acknowledges support from the National Science Foundation under Grant No. 2009416. S.A. gratefully acknowledges support from an ERC Advanced Grant 789410, from the Swedish Research Council and from the Knut and Alice Wallenberg (KAW) foundation. KI acknowledges support by the Spanish MCIN under grant PID2019-105510GBC33/AEI/10.13039/501100011033. This work was also partly supported by the Spanish program Unidad de Excelencia María de Maeztu CEX2020-001058-M, financed by MCIN/AEI/10.13039/501100011033.
References
- Armus et al. (2009) Armus, L., Mazzarella, J. M., Evans, A. S., et al. 2009, PASP, 121, 559, doi: 10.1086/600092
- Behar et al. (2017) Behar, E., Peretz, U., Kriss, G. A., et al. 2017, A&A, 601, A17, doi: 10.1051/0004-6361/201629943
- Bouchet et al. (2015) Bouchet, P., García-Marín, M., Lagage, P. O., et al. 2015, PASP, 127, 612, doi: 10.1086/682254
- Boyer et al. (2022) Boyer, M. L., Anderson, J., Gennaro, M., et al. 2022, Research Notes of the American Astronomical Society, 6, 191, doi: 10.3847/2515-5172/ac923a
- Bradley et al. (2022) Bradley, L., Sipőcz, B., Robitaille, T., et al. 2022, astropy/photutils: 1.5.0, Zenodo, doi: 10.5281/zenodo.6825092
- Brown & Gnedin (2021) Brown, G., & Gnedin, O. Y. 2021, MNRAS, 508, 5935, doi: 10.1093/mnras/stab2907
- Corbelli et al. (2017) Corbelli, E., Braine, J., Bandiera, R., et al. 2017, A&A, 601, A146, doi: 10.1051/0004-6361/201630034
- Davies et al. (2004) Davies, R. I., Tacconi, L. J., & Genzel, R. 2004, ApJ, 602, 148, doi: 10.1086/380995
- Díaz-Santos et al. (2007) Díaz-Santos, T., Alonso-Herrero, A., Colina, L., Ryder, S. D., & Knapen, J. H. 2007, ApJ, 661, 149, doi: 10.1086/513089
- Fathi et al. (2015) Fathi, K., Izumi, T., Romeo, A. B., et al. 2015, ApJ, 806, L34, doi: 10.1088/2041-8205/806/2/L34
- Genzel et al. (1995) Genzel, R., Weitzel, L., Tacconi-Garman, L. E., et al. 1995, ApJ, 444, 129, doi: 10.1086/175588
- Gordon et al. (2015) Gordon, K. D., Chen, C. H., Anderson, R. E., et al. 2015, PASP, 127, 696, doi: 10.1086/682260
- Greene et al. (2016) Greene, T. P., Chu, L., Egami, E., et al. 2016, in Society of Photo-Optical Instrumentation Engineers (SPIE) Conference Series, Vol. 9904, Space Telescopes and Instrumentation 2016: Optical, Infrared, and Millimeter Wave, ed. H. A. MacEwen, G. G. Fazio, M. Lystrup, N. Batalha, N. Siegler, & E. C. Tong, 99040E, doi: 10.1117/12.2231347
- Hannon et al. (2019) Hannon, S., Lee, J. C., Whitmore, B. C., et al. 2019, MNRAS, 490, 4648, doi: 10.1093/mnras/stz2820
- Inami et al. (2013) Inami, H., Armus, L., Charmandaris, V., et al. 2013, ApJ, 777, 156, doi: 10.1088/0004-637X/777/2/156
- Inami et al. (2018) Inami, H., Armus, L., Matsuhara, H., et al. 2018, A&A, 617, A130, doi: 10.1051/0004-6361/201833053
- Izumi et al. (2015) Izumi, T., Kohno, K., Aalto, S., et al. 2015, ApJ, 811, 39, doi: 10.1088/0004-637X/811/1/39
- Izumi et al. (2020) Izumi, T., Nguyen, D. D., Imanishi, M., et al. 2020, ApJ, 898, 75, doi: 10.3847/1538-4357/ab9cb1
- Kroupa (2001) Kroupa, P. 2001, MNRAS, 322, 231, doi: 10.1046/j.1365-8711.2001.04022.x
- Krumholz et al. (2019) Krumholz, M. R., McKee, C. F., & Bland-Hawthorn, J. 2019, ARA&A, 57, 227, doi: 10.1146/annurev-astro-091918-104430
- Lai et al. (2022) Lai, T. S. Y., Armus, L., U, V., et al. 2022, arXiv e-prints, arXiv:2209.06741. https://arxiv.org/abs/2209.06741
- Landt et al. (2008) Landt, H., Bentz, M. C., Ward, M. J., et al. 2008, ApJS, 174, 282, doi: 10.1086/522373
- Larson et al. (2020) Larson, K. L., Díaz-Santos, T., Armus, L., et al. 2020, ApJ, 888, 92, doi: 10.3847/1538-4357/ab5dc3
- Linden et al. (2017) Linden, S. T., Evans, A. S., Rich, J., et al. 2017, ApJ, 843, 91, doi: 10.3847/1538-4357/aa7266
- Linden et al. (2019) Linden, S. T., Song, Y., Evans, A. S., et al. 2019, ApJ, 881, 70, doi: 10.3847/1538-4357/ab2872
- Lu et al. (2021) Lu, K.-X., Wang, J.-G., Zhang, Z.-X., et al. 2021, ApJ, 918, 50, doi: 10.3847/1538-4357/ac0c78
- Messa et al. (2021) Messa, M., Calzetti, D., Adamo, A., et al. 2021, ApJ, 909, 121, doi: 10.3847/1538-4357/abe0b5
- Miles et al. (1994) Miles, J. W., Houck, J. R., & Hayward, T. L. 1994, ApJ, 425, L37, doi: 10.1086/187305
- Müller-Sánchez et al. (2011) Müller-Sánchez, F., Prieto, M. A., Hicks, E. K. S., et al. 2011, ApJ, 739, 69, doi: 10.1088/0004-637X/739/2/69
- Norris et al. (2019) Norris, M. A., van de Ven, G., Kannappan, S. J., Schinnerer, E., & Leaman, R. 2019, MNRAS, 488, 5400, doi: 10.1093/mnras/stz2096
- Orienti & Prieto (2010) Orienti, M., & Prieto, M. A. 2010, MNRAS, 401, 2599, doi: 10.1111/j.1365-2966.2009.15837.x
- Peng et al. (2010) Peng, C. Y., Ho, L. C., Impey, C. D., & Rix, H.-W. 2010, AJ, 139, 2097, doi: 10.1088/0004-6256/139/6/2097
- Perrin et al. (2014) Perrin, M. D., Sivaramakrishnan, A., Lajoie, C.-P., et al. 2014, in Society of Photo-Optical Instrumentation Engineers (SPIE) Conference Series, Vol. 9143, Space Telescopes and Instrumentation 2014: Optical, Infrared, and Millimeter Wave, ed. J. Oschmann, Jacobus M., M. Clampin, G. G. Fazio, & H. A. MacEwen, 91433X, doi: 10.1117/12.2056689
- Peterson et al. (2014) Peterson, B. M., Grier, C. J., Horne, K., et al. 2014, ApJ, 795, 149, doi: 10.1088/0004-637X/795/2/149
- Ramos Almeida et al. (2011) Ramos Almeida, C., Levenson, N. A., Alonso-Herrero, A., et al. 2011, ApJ, 731, 92, doi: 10.1088/0004-637X/731/2/92
- Rieke et al. (2015) Rieke, G. H., Ressler, M. E., Morrison, J. E., et al. 2015, PASP, 127, 665, doi: 10.1086/682257
- Robleto-Orús et al. (2021) Robleto-Orús, A. C., Torres-Papaqui, J. P., Longinotti, A. L., et al. 2021, ApJ, 906, L6, doi: 10.3847/2041-8213/abd32f
- Soifer et al. (2003) Soifer, B. T., Bock, J. J., Marsh, K., et al. 2003, AJ, 126, 143, doi: 10.1086/375647
- Song et al. (2021) Song, Y., Linden, S. T., Evans, A. S., et al. 2021, ApJ, 916, 73, doi: 10.3847/1538-4357/ac05c2
- Stetson (1987) Stetson, P. B. 1987, PASP, 99, 191, doi: 10.1086/131977
- Stierwalt et al. (2013) Stierwalt, S., Armus, L., Surace, J. A., et al. 2013, ApJS, 206, 1, doi: 10.1088/0067-0049/206/1/1
- U et al. (2022) U, V., Lai, T., Bianchin, M., et al. 2022, arXiv e-prints, arXiv:2209.01210. https://arxiv.org/abs/2209.01210
- Xu & Wang (2022) Xu, X., & Wang, J. 2022, ApJ, 933, 110, doi: 10.3847/1538-4357/ac7222
- Zackrisson et al. (2011) Zackrisson, E., Rydberg, C.-E., Schaerer, D., Östlin, G., & Tuli, M. 2011, ApJ, 740, 13, doi: 10.1088/0004-637X/740/1/13