[para]default
22institutetext: Harvard-Smithsonian Center for Astrophysics, Cambridge, 02138, USA
22email: {pwilliams,agoodman}@cfa.harvard.edu
Figure and Figure Caption Extraction for Mixed Raster and Vector PDFs: Digitization of Astronomical Literature with OCR Features
Abstract
Scientific articles published prior to the “age of digitization” in the late 1990s contain figures which are “trapped” within their scanned pages. While progress to extract figures and their captions has been made, there is currently no robust method for this process. We present a YOLO-based method for use on scanned pages, post-Optical Character Recognition (OCR), which uses both grayscale and OCR-features. When applied to the astrophysics literature holdings of the Astrophysics Data System (ADS), we find F1 scores of 90.9% (92.2%) for figures (figure captions) with the intersection-over-union (IOU) cut-off of 0.9 which is a significant improvement over other state-of-the-art methods.
Keywords:
scholarly document processing document layout analysis astronomy.1 Introduction
With the rise of larger datasets and the ever increasing rate of scientific publication, scientists require the use of automated methods to parse these growing data products, including the academic literature itself. In addition to being a vital component of open science [36, 41], easily accessed and well curated data products are strongly encouraged as part of the submission process to most major scientific journals [28]. However, data products in the form of figures, tables and formulas which are stored in the academic literature, especially from the “pre-digital” era, published prior to 1997, are not accessible for curation unless methods are developed to extract this important information.
The extraction of different layout elements of articles is an important component of scientific data curation, with the accuracy of extraction of the elements such as tables, figures and their captions increasing significantly over the past several years [15, 51, 4, 25]. A large field of study within document layout analysis is the “mining” of PDFs as newer PDFs are generally in “vector” format – the document is rendered from a set of instructions instead of pixel-by-pixel as in a raster format, and, in theory, the set of instructions can be parsed to determine the locations of figures, captions and tables [23, 3, 9].
However, this parsing is non-trivial and many methods have been developed to complete this task. If the PDF’s vector format is well structured, then text and images can be extracted by parsing this known PDF format. Several packages exist which output text and/or images from such PDF files [1]. Historically, some of the most popular include heuristic methods where blocks of text are classified as figure or table captions based on keywords (like “Fig.” or “Figure”) [8, 11].
Deep learning methods have become popular recently for vector and raster documents [5, 38], including those that use methods of semantic segmentation [46] and object detection [35]. While these methods are vital to the extraction of data products from recent academic literature, pre-digital literature is often included in digital platforms with older articles scanned at varying resolutions and deep learning methods developed with newer article training sets often perform poorly on this pre-digital literature [47]. Additionally, layouts, fonts, and article styles are typically different for historical documents when compared to “born-digital” scientific literature [47]. In these cases, text extraction must be performed with optical character recognition (OCR), and figures and tables are extracted from the raw OCR results. When applied to raster-PDF’s with text generated from OCR, deep learning document layout analysis methods trained with newer or vector-based PDFs are often not as robust [46, 47]. While progress has been made in augmenting these methods for OCR’d pages, especially for electronic theses and dissertations (ETDs) [47], much work can still be done to extract layout elements from these older, raster-based documents.
In what follows, we outline a new methodology for extracting figures and figure captions from a data set that includes both vector and raster based PDF’s from the pre-digital scientific literature holdings of the Astrophysics Data System (ADS)111https://ui.adsabs.harvard.edu/. Our model applies deep learning object detection methods in combination with heuristic techniques to scans of article pages as well as the text features generated from processing scans through the Tesseract OCR engine [40] and combines the results from mining any vector based PDF’s for their captions with pdffigures2 [11] in a post-processing step.
While the focus of our model is the digitization of astronomical literature – one of the original “big data” sciences [42, 39] – because our method relies heavily on features generated with OCR, our methodology is extendable to other scientific literature. Additionally, the design of our pipeline is heavily motivated by both the data (astronomical literature) and the expected users of our model (scientists and digital librarians). Thus, we rely on open-source software (e.g. Tesseract) and programming languages used by both communities (e.g. Python). All code is available on GitHub222https://github.com/ReadingTimeMachine/figure_and_caption_extraction.
2 The Data
The dataset used in this work is a subset of the English-language literature archived on ADS including pre-digital articles published between 1850-1997. Chosen for this work are scanned article pages that are thought to contain images of the sky derived from heuristic determinations based on color distributions [31].
We begin by defining the classes of figure and figure caption as there is often disagreement in the literature and occasionally between annotators of the same dataset [15, 49]. In this work, we define a figure as the collection of one or more panels on a single page which would be referred to as a single figure in a scientific article (i.e. “Figure 3”). This is different than other works which often treat each “sub-figure” as a separate figure [49]. Additionally, figures are defined to include all axis labels and titles as well as the area above their associated captions (or are extended on the side facing the caption if the caption is not below the figure). Finally, if a figure caption extends horizontally further than its associated figure, the figure is extended horizontally to the edges of the figure caption (see magenta lines in Figure 3). These definitions retain the uniformity of other definitions (e.g. [52]) while defining figure and caption regions by non-overlapping boxes.
Using these definitions, we hand-annotate images to create ground-truth boxes using the MakeSense.ai333makesense.ai annotation tool for a total of 5515 pages which contain 5010 figures and 4925 figure captions.
There are 553 pages without figures or captions. Details about the annotation processing is the subject of an upcoming paper [29].
Each annotated page is also processed with Tesseract’s OCR engine and outputs are stored in the hOCR format. Additionally, we process the PDF version of the article associated with each scanned page through the PDF-mining software pdffigures2 [11] and store any found figures and figure captions for combination with our model’s results in a post-processing step (see Step 3 in Section 3.3).
In what follows, we develop a pipeline that relies heavily on features derived from the OCR results of raster-PDF’s to make use of the preponderance of these types of PDFs in our dataset.
3 Model Pipeline development
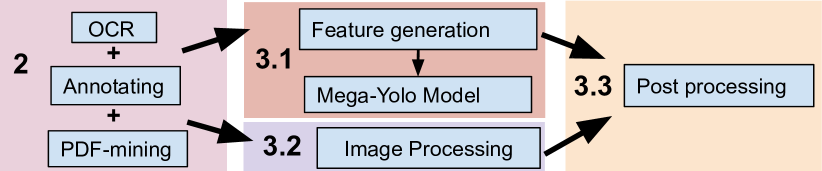
Our final goal for this dataset is the hosting of figure-caption pairs on the Astronomy Image Explorer (AIE) database444http://www.astroexplorer.org/. Currently, a subset of the born-digital ADS holdings (articles housed in under the American Astronomical Society Journals (AAS)) automatically populate AIE with their figure-caption pairs. The Python-based pipeline developed working toward this goal is shown in Figure 1.
3.1 Deep learning model and Feature Selection
Typical modern methods rely on deep learning techniques to detect layout elements on pages [5], often in combination with heuristics [38]. Methods span the range of object detection using models like YOLO [32, 38, 47] to, more recently, Faster R-CNN [34, 37, 43, 49, 16] and Mask-CNN [18, 26, 2]. Additionally, several pixel-by-pixel segmentation models have been proposed using semantic segmentation [46] and fully convolutional networks [24, 22], including “fully convolutional instance segmentation” [13, 14, 27].
Often these models employ a variety of features derived from article pages as inputs along side or in place of the unprocessed page. Some of the more popular recent methods leverage image processing and computer vision techniques [49] including connected component analysis [17, 10, 12, 7] and the distance transform [16] or some combinations thereof [50].
While the aim of many methods is to detect page objects before any OCR process, here we implement methods that can be applied after.
In what follows, we use a Tensorflow implementation of YOLO-v5555https://github.com/jahongir7174/YOLOv5-tf
https://github.com/jmpap/YOLOV2-Tensorflow-2.0 [33, 20] and focus our efforts on feature exploration by utilizing a set of features derived from the OCR outputs themselves with the goal to choose the smallest number of the “best” features on which to build our model.
In addition to the raw grayscale page, there are several possible features derived primarily from the hOCR outputs of Tesseract.
To minimize storage, each feature is scaled as an unsigned-integer, 8-bit “color” channel in a 512x512 (pixels), multi-layer image which is fed into a “mega-YOLO” model capable of processing more than three color channels.
Features explored which are output from Tesseract in hOCR format include:
-
•
fontsize (fs): the fontsize for each word bounding box is normalized by subtraction of the median page fontsize and division by the standard deviation. Bounding boxes with fonts outside five standard deviations are ignored.
-
•
carea (): the “content area” from automatic page segmentation includes large blocks of text and sometimes encapsulates figures into separate “content areas”, but not consistently.
-
•
paragraphs (): automatically segmented groups of words as likely paragraphs. Often overlaps with “carea”.
-
•
ascenders (asc): from typography definitions – the amount of letters in the word that are above the letter “caps” (e.g. the top of the letter “h”). Ascenders are normalized by subtracting the median value for each page.
-
•
decenders (dec): a typographical element – the amount of letters in the word that are below the letter “bottoms” (e.g. the bottom curl of the letter “g”). Decenders are normalized by subtracting the median value for each page.
-
•
word confidences (wc): the percent confidence of each word
-
•
word rotation (tang): rotation of word in steps of 0∘, 180∘, and 270∘.
Other features derived from the page scan and OCR-generated text are:
-
•
grayscale (gs): the image is collapsed into grayscale using the page’s luminance. The majority of images are already in grayscale and those few that are in color are transformed to grayscale.
-
•
fraction of letters in a word (%l): the percentage of characters in a word that are letters (scaled 125-255 in order to preserve a “true zero” for spaces in the scanned page that contain no words).
-
•
fraction of numbers in a word (%n): the percentage of numbers in a word that are letters (scaled 125-255).
-
•
punctuation (p): punctuation marks are tagged as 250, non-punctuation characters are tagged as 125 (saving 0 for empty, non-word space).
-
•
spaCy POS (SP): spaCy’s [19] 19 entries for “part of speech” (noun, verb, etc) in the English language
-
•
spaCy TAG (ST): more detailed part of speech tag with 57 values
-
•
spaCy DEP (SD): the 51 “syntactic dependency” tags which specify how different words are related to each other
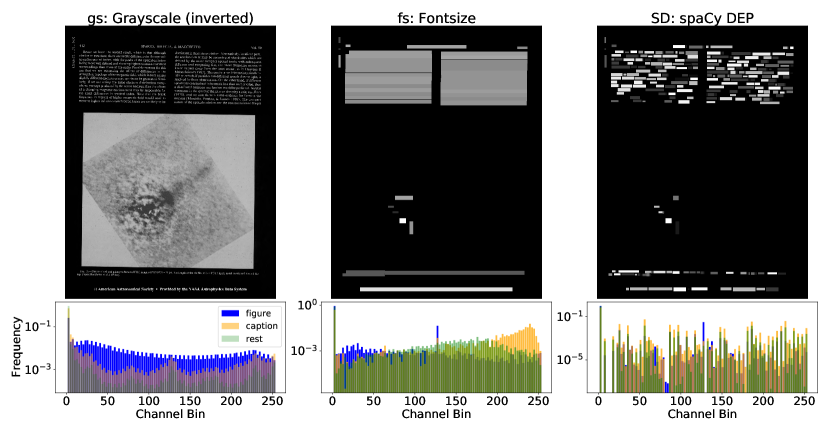
Figure 2 shows an example of a selection of these features (grayscale (gs), fontsize (fs), and spaCy DEP (SD)) for a single page and their distributions across all pages in our annotated dataset. The example features of grayscale and fontsize show differences in distributions in the three categories of figure, figure caption and the “rest” of the page – grayscale distributions are more uniform inside figures (left plot of Figure 2) and figure captions show a peak in the fontsize distributions toward higher values when compared to the fontsize distributions of figures (middle plot of Figure 2). Trends in other features are harder to determine, as illustrated in the bottom right panel of Figure 2 which shows a less clear distinction between figures, figure captions, and the rest of the page for the feature of spaCy DEP.
In Section 4 we discuss our best model which includes (grayscale, ascenders, decenders, word confidences, fraction of numbers in a word, fraction of letters in a word, punctuation, word rotation and spaCy POS) as the set of input features.
3.2 Image Processing
In addition to the deep learning model described in Section 3.1, we use image processing techniques to heuristically find potential figure boxes to combine with those found with the mega-YOLO model. The locations of the OCR’d words (see Section 2) are used to mask out text and the modified pages are processed through a basic shape finder built with OpenCV, tuned to look for rectangles (four corners and sides comprised of approximately parallel lines). This “rectangle finder” is applied to several filtered versions of the page (histogram of oriented gradients, dilation, and color-reversal, and various levels of thresholding). The list of rectangles is culled with K-Means clustering on the locations of square corners, checking for artifact-rectangles which are small in size, and rectangles that are likely colorbars and not figures due to their aspect ratio.
OCR’ing a page and shape-finding with OpenCV takes approximately 20-25 seconds per page (tested on six cores of an Apple M1 Max with 64 Gb of RAM).
3.3 Post-Processing Pipeline
After features are selected and the model is trained we modify the final found boxes by merging them with OCR word and paragraph boxes and any heuristically found captions and figures at the fractional-pixel level (results are rounded to nearest pixel for intersection-over-union (IOU) calculations to match precision of ground truth boxes). Post-processing is a common practice in document layout analysis [50, 48], however it often differs between implementations and is occasionally not incorporated into a final pipeline [45].
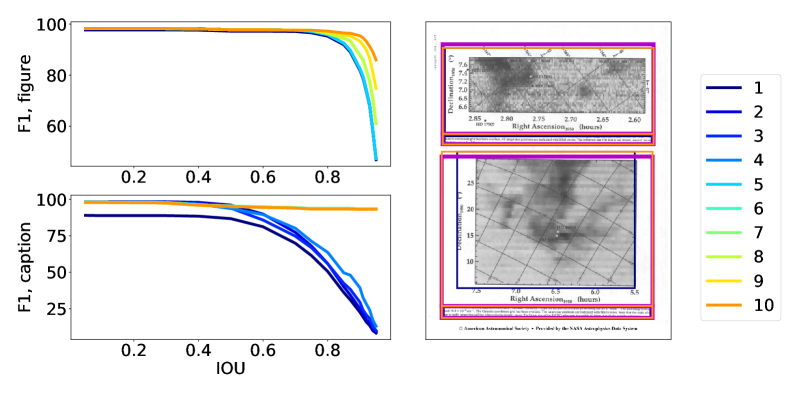
Figure 3 depicts how found boxes and F1 score changes with each post-processing step in our pipeline when we compare ground-truth (true) boxes to model-found boxes at various post-processing steps:
-
•
Step 1: “raw” found boxes are those culled with non-maximum suppression
-
•
Step 2: if two found boxes overlap with an IOU 0.25 the box with the lowest score is removed, decreasing false positives (FP)
-
•
Step 3: pdffigures2-found figure caption boxes replace those found with the deep learning model when they overlap which increases caption true positive (TP) rate and decreases FP and false negative (FN) at large IOU thresholds.
-
•
Step 4: Caption boxes are found heuristically by first applying a gaussian blur filter on an image of drawn OCR text boxes. Contours of this image that overlap with text boxes that match with a fuzzy-search of words such as “Fig.”, “Figure” and “Plate” are labeled as heuristically-found. If a heuristically-found caption box overlaps with a mega-YOLO-found box, we take the top of the heuristic box (which tends to be more accurate) and the minimum (maximum) of the left (right, bottom) of the two boxes. This results in an overall increase in TP while FN and FP drop.
-
•
Step 5: found captions are expanded by their overlap with OCR word and paragraph boxes, allowing for multiple “grow” iterations in the horizontal direction. Found boxes are only expanded by paragraph and word boxes if the centers of paragraph and word boxes overlap with the found box.
-
•
Step 6: if found figure boxes overlap with rectangles that are found through image processing (as described in Section 3.2), the found box is expanded to include the image processing rectangle. This increases the TP rate at larger IOU thresholds for figures.
-
•
Step 7: any found captions that have areas larger than 75% of the page area are discarded leading to a slight drop in FP for captions.
-
•
Step 8: Captions are paired to figures by minimizing the distance between caption center and bottom of a specific figure. Rotational information from the page and overall rotation of the OCR words is used to determine the “bottom” of the figure. Any captions without an associated figure on a page are dropped, leading to a drop in FP.
-
•
Step 9: found figure boxes are extended down to the tops of their associated captions increasing TP for figures and captions at high IOU thresholds.
-
•
Step 10: if a figure caption extends horizontally further than its associated figure, the figure is extended horizontally to the edges of the figure caption. This leads to an increase in TP rates for figures at high IOU thresholds.
3.4 Feature Selection Ablation Experiments
To determine the set of features which produce the most accurate model while minimizing the feature memory footprint, we conduct a series of ablation experiments, summarized in Table 1 and Section 3.4. In all feature selection runs we use 75% of our data in the training set, 15% in validation, and 10% in the test dataset. Results in Section 3.4 are shown for this feature selection test dataset.
| model | Description |
|---|---|
| m1 | gs |
| m2 | gs + fs |
| m3 | gs + fs + asc + dec |
| m4 | gs + fs + asc + dec + wc |
| m5 | gs + fs + asc + dec + wc + %n + %l + p |
| m6 | gs + fs + asc + dec + wc + %n + %l + p + |
| m7 | gs + fs + asc + dec + wc + %n + %l + p + + SP |
| m8 | gs + fs + asc + dec + wc + %n + %l + p + + SP + ST + SD |
| m9 | gs + fs + asc + dec + wc + %n + %l + p + + SP + ST + SD + |
| m10 | gs + fs + asc + dec + wc + %n + %l + p + + SP + ST + SD + + |
| m11 | gs + fs + wc + %n + %l + p + + SP |
| m12 | gs + asc + dec + wc + %n + %l + p + + SP |
| m13 | gs + asc + dec + wc + %n + p + + SP |
| m14 | gs + asc + dec + wc + %n + %l + + SP |
| m15 | gs + asc + dec + wc + %n + %l + p + |
As it is computationally prohibitive to test all combination of all fourteen different features, we first adopt the strategy of including sets of one or two groups of features at a time until we have a model containing all fourteen features, as shown above the thick horizontal line in Table 1. From these ten models, we select the most accurate, defined here as having a high F1 score for both figures and their captions, while maintaining a low false positive score (FP). Model 7 is the “best” model out of these first ten models in Section 3.4. We then subtract one or two features from this model in combinations shown below the thick horizontal line in Table 1. Using the same selection criteria leads us to choose Model 12 as our overall “best” model which includes the features of (grayscale, ascenders, decenders, word confidences, fraction of numbers in a word, fraction of letters in a word, punctuation, word rotation and spaCy POS) as highlighted in Section 3.4.
The implemented optimizer is Adam with a . Learning rate is scheduled using a cosine scheduler which depends on initial learning rate, number of epochs and batch size. Practically, when applied to our model this results in a linear increase in learning rate by a factor of 1.6 in the initial epoch (flat after). Our optimal initial learning rate of 0.004 was chosen from a small set of learning rates (0.008, 0.004, 0.0004, 0.0002). All experiments are run for 150 epochs and converge within this time (tracked by validation losses). No data augmentation is applied. Training is performed on a Tesla V100-SXM2 GPU with an average time of 6.5 minutes per epoch.
| TP | FP | FN | Prec | Rec | F1 | |||||||
| fig | cap | fig | cap | fig | cap | fig | cap | fig | cap | fig | cap | |
| m1 | ||||||||||||
& 88.3 11.3 10.0 1.8 4.3 88.9 89.8 98.0 95.4 93.3 92.5
m2 89.5 86.9 10.9 8.6 2.6 6.4 89.2 91.0 97.2 93.2 93.0 92.1
m3 85.9 86.9 17.9 12.5 1.8 5.1 82.8 87.4 97.9 94.4 89.7 90.8
m4 90.5 88.7 10.1 8.8 2.0 3.7 90.0 91.0 97.8 96.0 93.7 93.4
m5 84.5 87.3 15.7 7.2 2.2 7.0 84.3 92.4 97.4 92.6 90.4 92.5
m6 89.5 89.1 11.9 9.0 2.0 4.3 88.3 90.8 97.8 95.4 92.8 93.0
m7 92.8 88.1 8.0 9.0 1.4 4.1 92.0 90.7 98.5 95.6 95.1 93.1
m8 90.5 90.0 9.1 7.2 2.0 3.9 90.9 92.6 97.8 95.9 94.2 94.2
m9 84.3 84.2 13.5 7.4 4.0 9.4 86.2 91.9 95.4 89.9 90.6 90.9
m10 88.7 87.5 11.5 9.6 1.8 4.3 88.6 90.1 98.0 95.3 93.0 92.6 m11 90.5 92.4 10.5 6.8 0.8 1.8 89.6 93.2 99.1 98.0 94.1 95.6 m12 92.2 89.1 6.4 6.6 2.4 4.9 93.5 93.1 97.4 94.8 95.4 94.0 m13 92.8 88.7 7.8 8.4 2.0 4.3 92.2 91.4 97.9 95.4 95.0 93.3
m14 87.3 88.7 15.9 8.4 1.2 6.4 84.6 91.4 98.6 93.3 91.1 92.3
m15 89.9 89.5 8.7 5.9 2.4 5.1 91.2 93.8 97.4 94.6 94.2 94.2
4 Results
To quantify the results of our “best” model (Model 12) on un-seen data we annotate an additional 600 pages as a “final test dataset” of 500 figure and figure caption ground-truths (490 and 487, respectively). We find F1 scores of 90.9% (92.2%) for figure (caption) detections at an intersection-over-union cut off (IOU) of 0.9 as shown in the last row and column of Section 4.1. Including post-processing, evaluation takes on average 1.8 seconds per page on a single core of an Apple M1 Max with 64 Gb of RAM.
4.1 Benchmarks at high levels of localization (IOU=0.9)
As the ultimate goal of our method is the extraction of figures and their captions from scanned pages, we quantify how well our model performs on our dataset for a high degree of localization with an IOU cut-off of 0.9.
Section 4.1 shows how other deep learning models fair on our final test dataset. Here, we use ScanBank [21, 47] (based on DeepFigures [38] and trained on a corpus of pre-digital electronic thesis and dissertations (ETDs)) and a version of detectron2 [45] trained on the PubLayNet dataset [52]. ScanBank and detectron2 are used for comparison as they are applied to raster-formatted articles (as opposed to vector-based methods like pdffigures2 [11] which, applied to our data, results in F1 scores of 15% in feature and final test splits). Both ScanBank and detectron2 do not share our definitions of figures and figure captions exactly, thus to facilitate comparison we make some approximations and assumptions.
As discussed in [21], ScanBank’s figure’s are defined as encompassing the figure caption, while our figure definitions exclude the caption. In order to compare with our results, we initially performed metric calculations by re-defining our true figure boxes as the combination of figure and figure caption boxes when figure captions are associated with a figure. However, we found that if we instead use our definitions of figures and captions, metrics from detections made with ScanBank are optimized, thus we use our definitions of figures and captions for all comparisons with this model. As detectron2 does not find caption boxes specifically, but rather localizes generic “text” boxes, we define detectron2-detected figure captions as those boxes with centers which are closest to a found figure’s center. To test the effects of our post-processing methods alone, we apply a subset of our post-processing steps to the results generated from both ScanBank and detectron2 which we show for comparison to our method with and without post-processing in Section 4.1. When applying post-processing to these other models’ results, we use only up to the “Step 5” described in Section 3.3 as we found this optimized the metrics for ScanBank and detectron2 reported in Section 4.1.
As shown in Section 4.1, ScanBank does not perform well on our final test dataset with or without post-processing. In particular, ScanBank does not detect captions reliably as the false negative rate (FN) is high. Additionally, there is a large portion of both figures and figure captions which are either erroneously detected, or not well localized as shown by the high false positive (FP) rate. This is somewhat expected as the the ETD format is visually distinct from the articles in our dataset, including different fonts and caption placements. When post-processing is applied the metrics for figure captions improve significantly with an increase of 30% in true positive (TP) rate and decrease of 20% in FP.
For the detectron2 model without post-processing, TP rates are slightly higher than ScanBank’s, however FP rates remain comparable to ScanBank’s. FN rates are lower than our model (both with and without post-processing) by a few percentage points, likely due in part to the known differences in error profiles between YOLO-based (ours) and Mask-RCNN-based (detectron2) object detection models [33]. Post-processing makes a large improvement on the TP rate for captions, increasing it by 35% and decreasing FP by 40%. There is a modest increase in TP of 10% for figures as well when post-processing is applied.
Post-processing (using all steps) has the largest effect on our model’s results – increasing TP rates of figures and captions by 25% and 60%, respectively. This is not surprising as our post-processing method was developed using our scanned page training data. Additionally, we employ a YOLO-based model which is used for detecting bounding boxes, not a segmentation method that would tend to produce larger TP rates at higher IOU thresholds – the post-processing pipeline “mimics” segmentation by changing box sizes to closer fit precise locations of caption words and figures, increasing overlap IOU.
Taken together, the results of Section 4.1 suggest that other models generalize to our dataset at best moderately at high IOU, and only with application of our post-processing pipeline. Because our post-processing steps require not only grayscale scanned pages, but their OCR outputs, this additional overhead (of both producing the OCR and post-processing steps) greatly reduces the gains in page processing speeds achieved with these other methods.
& 29.0 69.3 52.8 72.0 46.4 81.0 80.9 58.2 23.2 85.7 86.7
FP 71.4 28.8 43.6 8.7 41.8 68.2 27.1 22.4 45.3 82.3 13.7 8.6
FN 1.7 42.8 2.5 40.7 0.6 1.6 1.2 4.9 3.1 5.1 3.5 6.0
Prec 49.5 50.2 61.4 85.9 63.3 40.5 74.9 78.3 56.2 22.0 86.2 90.9
Rec 97.6 40.4 96.5 56.5 99.2 96.6 98.5 94.3 95.0 81.9 96.1 93.6
F1 65.7 44.8 75.0 68.1 77.2 57.1 85.1 85.6 70.6 34.7 90.9 92.2
⋆ The tested version of detectron2 is trained on the PubLayNet dataset [45]. † Here, captions are the “text” classified box closest to the center of a figure.
This lack of generalizability is a known problem in the field of document layout analysis [5] and our model is no exception. For example, when our model is applied to a selection of PubLayNet’s non-commercial article pages [52]666Non-commercial articles are necessary to access the high resolution scans and perform the OCR needed for our method. we find F1 scores lower than those produced by detectron2 for figures – 65.7% (ours) vs. 85.8% (detectron2) for 207 figures. Using the definitions of captions from Section 4.1 for 201 captions the results are more promising with F1 scores of 65.6% (ours) to 65.5%(detectron2). Results for our (ScanBank’s) model applied to the ScanBank collection of “gold-standard” ETDs [21, 47] are lower overall with F1 scores of 25.5%(38.4%) for 197 figures and 16.3%(1.4%) for 140 captions. While these results suggest that our model may be more generalizable than other models for figure captions, tests on larger datasets are necessary for a firmer conclusion.
5 Discussion and Future Work
This paper has focused on the localization of figures and figure captions in astronomical scientific literature. We present results of a YOLO-based deep learning model trained on features extracted from the scanned page, hOCR outputs of the Tesseract OCR engine [40], and the text processing outputs from spaCy [19].
Through ablation experiments we find the combination of the page and hOCR properties of (grayscale, ascenders, decenders, word confidences, fraction of numbers in a word, fraction of letters in a word, punctuation, word rotation and spaCy POS) maximize our model’s performance. When compared to other deep learning models popular for document layout analysis (ScanBank [47, 21] and detectron2 [45]) we find our model performs better on our dataset, particularly at the high IOU thresholds (IOU=0.9) and especially for figure captions. In particular, in line with our extraction goals, our model has relatively low false positive rates, minimizing the extraction of erroneous page objects. For figures, our model does not perform well on other datasets (e.g. PubLayNet[52], ScanBank[47]), however is as accurate or more accurate than others for figure captions.
Our work relies on a relatively small set of scanned pages (6000). While the results here for figures and captions surpass the estimates of 2000 instances per class required for training YOLO-based models [6, 44] our data contains many edge cases of complex layouts and we expect more data to improve results for these pages. As our model relies on more than three feature channels, transfer learning on pre-trained YOLO-based models is less straight forward, but nonetheless could be a way to make use of our small dataset in future work.
Additionally, our current methodology does not make use of popular image processing features (e.g. connected components [49]) or loss functions/processing techniques that are “non-standard” for YOLO-based methods [30]. Future testing with the inclusion of these features may increase our model performance.
While all of our models converge within 150 training epochs, this is without the inclusion of any data augmentation. As our model uses not only grayscale but hOCR properties, typical data augmentation procedures (e.g. flipping, changes in saturation) are not appropriate for all feature layers. However, it is likely that correctly-applied data augmentation will increase our model’s performance. Our work would further benefit from a future large hyperparameter tuning study beyond the several values of learning rate tested in this paper.
Finally, given the difference in error profiles between the YOLO-based method presented here and other Mask-RCNN/Faster-RCNN based [33] document layout analysis models (e.g. detectron2), it is likely that an ensemble model using both methods would further increase model performance.
This work is supported by a Fiddler Fellowship and a NASA Astrophysics Data Analysis Program Grant (20-ADAP20-0225). The authors thank the referees for their insightful input on this paper.
References
- [1] Grobid. https://github.com/kermitt2/grobid (2008–2021)
- [2] Agarwal, M., Mondal, A., Jawahar, C.V.: CDeC-Net: Composite Deformable Cascade Network for Table Detection in Document Images. arXiv e-prints arXiv:2008.10831 (Aug 2020)
- [3] Bai, K., Mitra, P., Giles, C.L., Liu, Y.: Automatic extraction of table metadata from digital documents. In: Proceedings of the 6th ACM/IEEE-CS Joint Conference on Digital Libraries (JCDL’06). pp. 339–340. IEEE (2006)
- [4] Bhatt, J., Hashmi, K.A., Afzal, M.Z., Stricker, D.: A survey of graphical page object detection with deep neural networks. Applied Sciences 11(12) (2021). https://doi.org/10.3390/app11125344, https://www.mdpi.com/2076-3417/11/12/5344
- [5] Bhatt, J., Hashmi, K.A., Afzal, M.Z., Stricker, D.: A survey of graphical page object detection with deep neural networks. Applied Sciences 11(12) (2021). https://doi.org/10.3390/app11125344, https://www.mdpi.com/2076-3417/11/12/5344
- [6] Bochkovskiy, A., Wang, C.Y., Liao, H.Y.M.: Yolov4: Optimal speed and accuracy of object detection (2020)
- [7] Bukhari, S.S., Al Azawi, M.I.A., Shafait, F., Breuel, T.M.: Document image segmentation using discriminative learning over connected components. In: Proceedings of the 9th IAPR International Workshop on Document Analysis Systems. p. 183–190. DAS ’10, Association for Computing Machinery, New York, NY, USA (2010). https://doi.org/10.1145/1815330.1815354, https://doi.org/10.1145/1815330.1815354
- [8] Choudhury, S.R., Mitra, P., Kirk, A., Szep, S., Pellegrino, D., Jones, S., Giles, C.L.: Figure metadata extraction from digital documents. In: 2013 12th International Conference on Document Analysis and Recognition. pp. 135–139 (2013). https://doi.org/10.1109/ICDAR.2013.34
- [9] Choudhury, S.R., Tuarob, S., Mitra, P., Rokach, L., Kirk, A., Szep, S., Pellegrino, D., Jones, S., Giles, C.L.: A figure search engine architecture for a chemistry digital library. In: Proceedings of the 13th ACM/IEEE-CS joint conference on Digital libraries. pp. 369–370 (2013)
- [10] Chowdhury, S., Mandal, S., Das, A., Chanda, B.: Automated segmentation of math-zones from document images. In: Seventh International Conference on Document Analysis and Recognition, 2003. Proceedings. pp. 755–759 (2003). https://doi.org/10.1109/ICDAR.2003.1227763
- [11] Clark, C., Divvala, S.: Pdffigures 2.0: Mining figures from research papers. In: 2016 IEEE/ACM Joint Conference on Digital Libraries (JCDL). pp. 143–152 (2016)
- [12] Cronje, J.: Figure detection and part label extraction from patent drawing images. In: 23rd Annual Symposium of the Pattern Recognition Association of South Africa. PRASA (2012)
- [13] Dai, J., He, K., Li, Y., Ren, S., Sun, J.: Instance-sensitive Fully Convolutional Networks. arXiv e-prints arXiv:1603.08678 (Mar 2016)
- [14] Dai, J., Li, Y., He, K., Sun, J.: R-FCN: Object Detection via Region-based Fully Convolutional Networks. arXiv e-prints arXiv:1605.06409 (May 2016)
- [15] Gao, L., Yi, X., Jiang, Z., Hao, L., Tang, Z.: Icdar2017 competition on page object detection. In: 2017 14th IAPR International Conference on Document Analysis and Recognition (ICDAR). vol. 01, pp. 1417–1422 (2017). https://doi.org/10.1109/ICDAR.2017.231
- [16] Gilani, A., Qasim, S.R., Malik, I., Shafait, F.: Table detection using deep learning. In: 2017 14th IAPR International Conference on Document Analysis and Recognition (ICDAR). vol. 01, pp. 771–776 (2017). https://doi.org/10.1109/ICDAR.2017.131
- [17] Ha, J., Haralick, R., Phillips, I.: Recursive x-y cut using bounding boxes of connected components. In: Proceedings of 3rd International Conference on Document Analysis and Recognition. vol. 2, pp. 952–955 vol.2 (1995). https://doi.org/10.1109/ICDAR.1995.602059
- [18] He, K., Gkioxari, G., Dollár, P., Girshick, R.: Mask R-CNN. arXiv e-prints arXiv:1703.06870 (Mar 2017)
- [19] Honnibal, M., Montani, I.: spaCy 2: Natural language understanding with Bloom embeddings, convolutional neural networks and incremental parsing (2017), to appear
- [20] Jocher, G., Stoken, A., Borovec, J., NanoCode012, ChristopherSTAN, Changyu, L., Laughing, tkianai, Hogan, A., lorenzomammana, yxNONG, AlexWang1900, Diaconu, L., Marc, wanghaoyang0106, ml5ah, Doug, Ingham, F., Frederik, Guilhen, Hatovix, Poznanski, J., Fang, J., Yu, L., changyu98, Wang, M., Gupta, N., Akhtar, O., PetrDvoracek, Rai, P.: ultralytics/yolov5: v3.1 - Bug Fixes and Performance Improvements (Oct 2020). https://doi.org/10.5281/zenodo.4154370, https://doi.org/10.5281/zenodo.4154370
- [21] Kahu, S.Y.: Figure Extraction from Scanned Electronic Theses and Dissertations. Master’s thesis, Virginia Tech (2020)
- [22] Kavasidis, I., Palazzo, S., Spampinato, C., Pino, C., Giordano, D., Giuffrida, D., Messina, P.: A Saliency-based Convolutional Neural Network for Table and Chart Detection in Digitized Documents. arXiv e-prints arXiv:1804.06236 (Apr 2018)
- [23] Klampfl, S., Kern, R.: An unsupervised machine learning approach to body text and table of contents extraction from digital scientific articles. In: International Conference on Theory and Practice of Digital Libraries. pp. 144–155. Springer (2013)
- [24] Krähenbühl, P., Koltun, V.: Efficient Inference in Fully Connected CRFs with Gaussian Edge Potentials. arXiv e-prints arXiv:1210.5644 (Oct 2012)
- [25] Lehenmeier, C., Burghardt, M., Mischka, B.: Layout detection and table recognition–recent challenges in digitizing historical documents and handwritten tabular data. In: International Conference on Theory and Practice of Digital Libraries. pp. 229–242. Springer (2020)
- [26] Li, M., Xu, Y., Cui, L., Huang, S., Wei, F., Li, Z., Zhou, M.: DocBank: A Benchmark Dataset for Document Layout Analysis. arXiv e-prints arXiv:2006.01038 (Jun 2020)
- [27] Li, Y., Qi, H., Dai, J., Ji, X., Wei, Y.: Fully Convolutional Instance-aware Semantic Segmentation. arXiv e-prints arXiv:1611.07709 (Nov 2016)
- [28] Mayernik, M.S., Hart, D.L., Maull, K.E., Weber, N.M.: Assessing and tracing the outcomes and impact of research infrastructures. Journal of the Association for Information Science and Technology 68(6), 1341–1359 (2017). https://doi.org/https://doi.org/10.1002/asi.23721, https://asistdl.onlinelibrary.wiley.com/doi/abs/10.1002/asi.23721
- [29] Naiman, J.P., G., W.P.K., Goodman, A.: The reading time machine figure localization dataset (2022), unpublished paper
- [30] Neubeck, A., Van Gool, L.: Efficient non-maximum suppression. In: 18th International Conference on Pattern Recognition (ICPR’06). vol. 3, pp. 850–855 (2006). https://doi.org/10.1109/ICPR.2006.479
- [31] Pepe, A., Goodman, A., Muench, A.: The ADS All-Sky Survey. In: Ballester, P., Egret, D., Lorente, N.P.F. (eds.) Astronomical Data Analysis Software and Systems XXI. Astronomical Society of the Pacific Conference Series, vol. 461, p. 275 (Sep 2012)
- [32] Redmon, J., Divvala, S., Girshick, R., Farhadi, A.: You Only Look Once: Unified, Real-Time Object Detection. arXiv e-prints arXiv:1506.02640 (Jun 2015)
- [33] Redmon, J., Divvala, S., Girshick, R., Farhadi, A.: You Only Look Once: Unified, Real-Time Object Detection. arXiv e-prints arXiv:1506.02640 (Jun 2015)
- [34] Ren, S., He, K., Girshick, R., Sun, J.: Faster R-CNN: Towards Real-Time Object Detection with Region Proposal Networks. arXiv e-prints arXiv:1506.01497 (Jun 2015)
- [35] Saha, R., Mondal, A., Jawahar, C.V.: Graphical object detection in document images. In: 2019 International Conference on Document Analysis and Recognition (ICDAR). pp. 51–58 (2019). https://doi.org/10.1109/ICDAR.2019.00018
- [36] Sandy, H.M., Mitchell, E., Corrado, E.M., Budd, J., West, J.D., Bossaller, J., VanScoy, A.: Making a case for open research: Implications for reproducibility and transparency. Proceedings of the Association for Information Science and Technology 54(1), 583–586 (2017). https://doi.org/https://doi.org/10.1002/pra2.2017.14505401079, https://asistdl.onlinelibrary.wiley.com/doi/abs/10.1002/pra2.2017.14505401079
- [37] Schreiber, S., Agne, S., Wolf, I., Dengel, A., Ahmed, S.: Deepdesrt: Deep learning for detection and structure recognition of tables in document images. In: 2017 14th IAPR International Conference on Document Analysis and Recognition (ICDAR). vol. 01, pp. 1162–1167 (2017). https://doi.org/10.1109/ICDAR.2017.192
- [38] Siegel, N., Lourie, N., Power, R., Ammar, W.: Extracting Scientific Figures with Distantly Supervised Neural Networks. arXiv e-prints arXiv:1804.02445 (Apr 2018)
- [39] Smith, L., Arcand, K., Smith, R., Bookbinder, J., Smith, J.: Capturing the many faces of an exploded star: communicating complex and evolving astronomical data. JCOM Journal of Science Communication 16, 16050202 (Nov 2017). https://doi.org/10.22323/2.16050202
- [40] Smith, R.: An overview of the tesseract ocr engine. In: Proceedings of the Ninth International Conference on Document Analysis and Recognition - Volume 02. p. 629–633. ICDAR ’07, IEEE Computer Society, USA (2007)
- [41] Sohmen, L., Charbonnier, J., Blümel, I., Wartena, C., Heller, L.: Figures in scientific open access publications. In: International Conference on Theory and Practice of Digital Libraries. pp. 220–226. Springer (2018)
- [42] Stephens, Z.D., Lee, S.Y., Faghri, F., Campbell, R.H., Zhai, C., Efron, M.J., Iyer, R., Schatz, M.C., Sinha, S., Robinson, G.E.: Big data: Astronomical or genomical? PLOS Biology 13(7), 1–11 (07 2015). https://doi.org/10.1371/journal.pbio.1002195, https://doi.org/10.1371/journal.pbio.1002195
- [43] Vo, N.D., Nguyen, K., Nguyen, T.V., Nguyen, K.: Ensemble of deep object detectors for page object detection. In: Proceedings of the 12th International Conference on Ubiquitous Information Management and Communication. IMCOM ’18, Association for Computing Machinery, New York, NY, USA (2018). https://doi.org/10.1145/3164541.3164644, https://doi.org/10.1145/3164541.3164644
- [44] Wang, C.Y., Bochkovskiy, A., Liao, H.Y.M.: Scaled-YOLOv4: Scaling cross stage partial network. In: Proceedings of the IEEE/CVF Conference on Computer Vision and Pattern Recognition (CVPR). pp. 13029–13038 (June 2021)
- [45] Wu, Y., Kirillov, A., Massa, F., Lo, W.Y., Girshick, R.: Detectron2. https://github.com/facebookresearch/detectron2 (2019)
- [46] Yang, X., Yumer, E., Asente, P., Kraley, M., Kifer, D., Giles, C.L.: Learning to extract semantic structure from documents using multimodal fully convolutional neural networks. In: 2017 IEEE Conference on Computer Vision and Pattern Recognition (CVPR). pp. 4342–4351 (2017). https://doi.org/10.1109/CVPR.2017.462
- [47] Yashwant Kahu, S., Ingram, W.A., Fox, E.A., Wu, J.: ScanBank: A Benchmark Dataset for Figure Extraction from Scanned Electronic Theses and Dissertations. arXiv e-prints arXiv:2106.15320 (Jun 2021)
- [48] Yi, X., Gao, L., Liao, Y., Zhang, X., Liu, R., Jiang, Z.: Cnn based page object detection in document images. In: 2017 14th IAPR International Conference on Document Analysis and Recognition (ICDAR). vol. 01, pp. 230–235 (2017). https://doi.org/10.1109/ICDAR.2017.46
- [49] Younas, J., Rizvi, S.T.R., Malik, M.I., Shafait, F., Lukowicz, P., Ahmed, S.: Ffd: Figure and formula detection from document images. In: 2019 Digital Image Computing: Techniques and Applications (DICTA). pp. 1–7 (2019). https://doi.org/10.1109/DICTA47822.2019.8945972
- [50] Younas, J., Siddiqui, S.A., Munir, M., Malik, M.I., Shafait, F., Lukowicz, P., Ahmed, S.: Fi-fo detector: Figure and formula detection using deformable networks. Applied Sciences 10(18) (2020). https://doi.org/10.3390/app10186460, https://www.mdpi.com/2076-3417/10/18/6460
- [51] Zhong, X., Tang, J., Jimeno Yepes, A.: PubLayNet: largest dataset ever for document layout analysis. arXiv e-prints arXiv:1908.07836 (Aug 2019)
- [52] Zhong, X., Tang, J., Jimeno Yepes, A.: PubLayNet: largest dataset ever for document layout analysis. arXiv e-prints arXiv:1908.07836 (Aug 2019)