Estimating Racial Disparities in Emergency General Surgery††thanks: The Pennsylvania Health Cost Containment Council (PHC4) is an independent state agency responsible for addressing the problems of escalating health costs, ensuring the quality of health care, and increasing access to health care for all citizens. While PHC4 has provided data for this study, PHC4 specifically disclaims responsibility for any analyses, interpretations or conclusions. Some of the data used to produce this publication was purchased from or provided by the New York State Department of Health (NYSDOH) Statewide Planning and Research Cooperative System (SPARCS). However, the conclusions derived, and views expressed herein are those of the author(s) and do not reflect the conclusions or views of NYSDOH. NYSDOH, its employees, officers, and agents make no representation, warranty or guarantee as to the accuracy, completeness, currency, or suitability of the information provided here. This publication was derived, in part, from a limited data set supplied by the Florida Agency for Health Care Administration (AHCA) which specifically disclaims responsibility for any analysis, interpretations, or conclusions that may be created as a result of the limited data set. The authors declare no conflicts. Rachel Kelz is funded by a grant from the National Institute on Aging, R01AG060612.
Abstract
Research documents that Black patients experience worse general surgery outcomes than white patients in the United States. In this paper, we focus on an important but less-examined category: the surgical treatment of emergency general surgery (EGS) conditions, which refers to medical emergencies where the injury is internal, such as a burst appendix. Our goal is to assess racial disparities for common outcomes after EGS treatment using an administrative database of hospital claims in New York, Florida, and Pennsylvania, and to understand the extent to which differences are attributable to patient-level risk factors versus hospital-level factors, as well as to the decision to operate on EGS patients. To do so, we use a class of linear weighting estimators that re-weight white patients to have a similar distribution of baseline characteristics to Black patients. This framework nests many common approaches, including matching and linear regression, but offers important advantages over these methods in terms of controlling imbalance between groups, minimizing extrapolation, and reducing computation time. Applying this approach to the claims data, we find that disparities estimates that adjust for the admitting hospital are substantially smaller than estimates that adjust for patient baseline characteristics only, suggesting that hospital-specific factors are important drivers of racial disparities in EGS outcomes. We also find little evidence that the decision to operate exacerbates racial disparities.
Keywords: Risk Adjustment, Weighting, Racial Disparities
1 Introduction: Racial Disparities in Health Care
A substantial research literature documents that Black patients experience worse general surgery outcomes than white patients in the United States (Alavi et al., 2012; Esnaola et al., 2008; Cooper et al., 1996; Silber et al., 2015). In this paper, we focus on racial disparities for a related but less-examined category: the surgical treatment of emergency general surgery (EGS) conditions. EGS refers to medical emergencies where (unlike for trauma) the injury is likely “endogenous,” such as a burst appendix (Shafi et al., 2013). More than 800,000 emergency operations in the United States each year are for EGS conditions, and such conditions account for more hospital admissions than that of a new diagnosis of diabetes, cancer, coronary heart disease, heart failure, stroke, or HIV (Gale et al., 2014). Unlike general surgery procedures, which are scheduled and often done in an out-patient setting, EGS operations are typically in-patient procedures that occur after a chronic condition becomes acute. As such, treatment for EGS conditions is a critical component of emergency health care that differs from general surgery.
In our study, we seek to assess the extent of racial disparities in adverse events following EGS treatment. To do so, we analyze a large administrative dataset based on all-payer hospital discharge claims from New York, Florida, and Pennsylvania in 2012-2013. We compare Black patients to white patients who are admitted for an EGS condition across 432 hospitals. In our analysis, we seek to to carefully adjust for baseline differences in the Black and white populations to understand the extent to which differences are: (1) attributable to patient-level risk factors versus hospital-specific factors, and (2) attributable to the decision to operate.
Using statistical methods to assess disparities after adjusting for baseline differences between groups has a long history in health research and the social sciences (Fortin et al., 2011). Linear regression is by far the most common adjustment approach; a specific implementation known as the Kitagawa-Oaxaca-Blinder (KOB) decomposition is the workhorse method (Kitagawa, 1955; Blinder, 1973; Oaxaca, 1973); see Sen (2014) and Basu et al. (2015) for examples of this approach in health research. Linear regression can perform poorly in practice, however, often relying on substantial extrapolation to adjust outcomes between groups (Słoczyński, 2020). Alternative methods like matching can avoid extrapolation (Silber et al., 2013), but at the cost of poor balance in large administrative data sets. The choice of what to adjust for is also critical. Standard approaches like the KOB decomposition often adjust for all available baseline covariates. Changing the adjustment set, however, can also lead to large changes in estimated disparities (Jackson and VanderWeele, 2018).
Our methodological contribution is to develop statistical tools for estimating racial disparities using linear weighting estimators, which include both regression and matching as special cases. Building on a growing literature in causal inference and econometrics (see Ben-Michael et al., 2021, for a review), we first characterize the error of a linear weighting estimator for the average surgery outcome for one group, adjusted for a selected set of baseline covariates to follow a particular target distribution. For example, we consider the average outcome for white patients adjusted to have the same baseline characteristics as Black patients. We then show that a regularized form of the Oaxaca-Blinder estimator controls this error, and extend the decomposition to include hospital differences. Next, we show how to estimate the weights via a constrained optimization problem, which includes both matching and (penalized) regression as special cases. Importantly, we can constrain the weights to be non-negative, thus avoiding extrapolation. We can also directly control the bias-variance trade-off with a single tuning parameter in the optimization problem. We then show how to use our framework for estimands that decompose overall disparities based on the treatment decision, following recent proposals from Jackson and VanderWeele (2018) and Yu and Elwert (2023). For instance, we consider a counterfactual scenario in which Black patients have the same odds of undergoing surgery as white patients, conditional on a subset of covariates. This allows us to further decompose observed disparities in order to assess the role of the decision to perform surgery on patients admitted for an EGS condition.
We find that before adjustment, Black patients appear to have better outcomes than white patients. However, once we adjust for baseline covariates, we see significant disparities in the rate of adverse events and the length of stay for both the full patient population and the subset that receives operative care. Further, we find that adjusting for admitting hospital largely eliminates these estimated disparities, though Black patients still have longer lengths of stay in the hospital than re-weighted white patients. This provides additional evidence that variation across hospitals is an important driver of health disparities and that interventions targeted at hospital quality may be critical for further reducing racial disparities in surgical outcomes. Finally, we find that differences in the decision to treat EGS patients have little bearing on overall disparities.
Complementing our substantive results, we argue that three key features make the methodology we develop particularly suited to clinical applications such as the one we consider here. First, many clinical applications use claims databases with large sample sizes. We show that our method is fast computationally, especially relative to matching, making it feasible with the large samples. Second, accounting for differences within clusters, such as hospitals, is a critical element of the research design for studying racial disparities in a range of applications. Our proposed approach naturally generates weights to balance comparisons within such clusters. Finally, with large numbers of patient covariates, there may be some subset of the covariates that interact. However, selecting relevant interactions is a high-dimensional variable selection problem that is separate to the estimation of the weights. We outline how to use sample splitting and a random forest to discover key interactions for adjustment.
Our article proceeds as follows. In Section 1.1, we outline the details of our dataset and study. In Section 2 we set up the statistical framework and review existing approaches. In Section 3 we develop regularized linear estimators for adjusting covariate differences between a focal group and comparison group, and apply this to estimate racial disparities in our setting. In this section, we also discuss accounting for hospital-level interactions, expanding basis functions with interactions, and hyper-parameter selection. In Section 4, we analyze the data on racial disparities in EGS care. In Section 5, we conclude.
1.1 Racial Disparities in Emergency General Surgery in PA, NY, FL
Our study uses a dataset based on all-payer hospital discharge claims from New York, Florida and Pennsylvania in 2012-2013. We restricted the study population to all patients admitted for inpatient care emergently, urgently, or through the emergency department with a diagnosis of an acute general surgical condition. We classified acute general surgical condition types using a modified list of 124 International Classification of Diseases, Ninth Revision, Clinical Modification (ICD-9-CM) codes that represent the scope of emergency general surgery (Shafi et al., 2013). Importantly, patients with EGS conditions may or may not be treated with an operation. Our data set includes all patients with an EGS condition, and some subset of these patients had surgery.
All patients were classified into one of nine possible surgical conditions (resuscitation, general abdominal, upper gastrointestinal, colorectal, hernia, intestinal obstruction, hepatobiliary, skin and soft tissue, and vascular) and then further classified into 51 specific acute EGS conditions; the indicators for these 51 conditions are important variables for adjustment. Patient demographic and clinical characteristics were also abstracted from the claims datasets. First, we used Elixhauser indices to define 31 comorbidities (Elixhauser et al., 1998). Next, we developed a measure of patient frailty using a set of specific ICD-9-CM codes which represent clinical manifestations of frail patients in administrative data (Kim and Schneeweiss, 2014). We also defined an indicator for severe sepsis using the Angus implementation for severe sepsis algorithm (Angus et al., 2001). Table LABEL:tab:covs in the appendix contains a full list of the baseline covariates. Our primary outcome is the presence of an adverse event within 30 days after admission. We define an adverse event as the presence of either death, a complication, or a prolonged length-of-stay. As a secondary outcome, we use hospital length-of-stay; we top-code this at 30 days, which affects 2.8% percent of the sample.
In our data, race and Hispanic ethnicity is determined from self-reported records. We restrict the sample to patients who self-report as either white or Black/African American and exclude patients that self-report as Hispanic. After these exclusion criteria, in our data, there are 133,174 Black patients and 556,331 white patients across 432 hospitals. In the data, almost 60% of the patients undergo surgery as treatment for an EGS condition. Unadjusted, the risk of an adverse event following surgery for an EGS condition is 7% lower for Black patients than for white patients (Risk ratio: 0.93, 95% CI: 0.92, 0.94). In the unadjusted analysis, Black patients show no meaningful difference in terms of length of stay when compared to white patients.
These unadjusted differences in outcomes, however, might be driven in part by baseline differences in the health status of Black and white patients. There are critical differences across the two patient populations in our data. Black patients tend to be younger, are more likely to be enrolled in Medicaid, and have notably higher rates of diabetes and hypertension (see Table LABEL:tab:bal in the appendix for these balance statistics). Moreover, the unadjusted differences in outcomes compare patients who received care at different hospitals. Thus, these unadjusted differences likely also capture differences in quality of care across hospitals, as well as possible unobserved differences in the surrounding areas, such as the availability of other services. For instance, Silber et al. (2015) found no racial disparities in outcomes when using within-hospital comparisons for general surgery procedures. The goal of our analysis is therefore to estimate differences in outcomes between Black and white patients after adjusting for observable baseline characteristics as well as the hospital in which the surgery was performed. In addition, there may be racial disparities in which patients are selected for treatment via surgery. As such, we consider three main analyses. First, we find weights that control the imbalance in patient-level baseline characteristics, co-morbidities, and surgery type between re-weighted white patients and Black patients within each state. Second, we find weights that also control this imbalance within each hospital. Third, we also perform a decomposition analysis that assesses whether disparities in outcomes are exacerbated by racial disparities in the decision to operate on EGS patients.
2 Framework, Notation, and Assumptions
There is a long history across health and the social sciences of quantifying group level disparities, and in trying to understand the extent to which observable characteristics explain these differences (Yu and Elwert, 2023). For overview discussions, see, among others: Fortin et al. (2011) in economics, Jackson (2021) in health, and Lundberg (2021) in sociology. In this section, we review this approach as applied to racial disparities in EGS outcomes. Next, we outline notation and review a series of different estimands that can describe disparities.
2.1 A General estimand
We begin by formalizing a general estimand and reviewing the key assumptions required to measure racial disparities that adjust for background characteristics. In our study, the patient population is indexed by , and we denote patient race using a binary variable where indicates that the patient is Black and that the patient is white. In addition to race, we observe a set of baseline covariates and an outcome . There are two particularly important variables in our analysis: (i) whether patient undergoes surgery, which we denote as ,111While we have a well-defined set of EGS conditions and a set of patients that have all been diagnosed with one of these conditions, 40% of patients that are diagnosed with these conditions do not receive surgery. and (ii) which hospital treats patient , which we denote as . We assume that the tuples of patient information are sampled i.i.d. from some distribution , and we drop the patient subscript when convenient for notation. We let denote the number of patients in our sample with race , and denote the sample average outcomes and covariates for patients of race as and , respectively. Similarly, we denote the matrix of sample covariate values for group as .
Informally, our analysis is focused on measuring disparities in outcomes between patients across groups, while “adjusting” for different sets of covariates. To formalize this, let be a subset of the covariates. The primary mathematical object in our analysis is the expected outcome, conditional on race and selected covariates , . Our estimand is then the expected value of this conditional expectation when the chosen covariates are drawn from some distribution and race is set to :
| (1) |
This estimand follows the nonparametric framing proposed by Barsky et al. (2002) to decompose racial disparities in wealth, generalizing it to account for arbitrary target distributions ; see also Jackson et al. (2022). This quantity measures what we would expect for patients of race , restricted to the population where other patient-level information is distributed according to . Importantly, this target quantity is a statistical estimand rather than a causal estimand, since it does not necessarily reflect a possible intervention.
There are two key components in defining the estimand . First and foremost, we must select the covariates in the adjustment set. This is the most important choice in the analysis. As we will show in our data below, disparities that appear when adjusting for one set of variables may not appear when adjusting for a different set of variables. Second, we must select the target distribution of the covariates to average over, , as this defines which distributions we are comparing. Most clinical studies of racial disparities focus on estimands of this form, and our analysis in Section 4 uses several special cases of this general estimand. We describe these special cases and their potential limitations next.
2.1.1 Standardizing white patients’ covariates to the distribution of Black patients’ covariates
First, we consider an estimand commonly used in clinical studies (e.g., Silber et al., 2013, 2014, 2015; Rosenbaum and Silber, 2013), that seeks to estimate the expected outcome for white patients as-if other selected patient-level covariates followed the distribution for Black patients. We let be shorthand notation for setting to the conditional distribution of the selected covariates given , and then denote the target quantity as . We compare this to , the mean observed outcome for Black patients, which we estimate via the sample average. For continuous outcomes such as the length of stay, we make this comparison through the adjusted difference between Black and white patients . With binary outcome measures, we additionally consider the adjusted risk ratio .
The key assumption underlying this estimand and our ability to estimate non-parametrically is a notion of overlap:
Assumption 1 (Overlap).
for all .
This overlap assumption rules out the possibility that there is some combination of patient-level information that can deterministically predict whether the patient is Black. This assumption ensures that for any Black patient in the population we can find a white patient with similar selected characteristics , given a large enough sample.
There are many potential choices for the covariate set to adjust for, and we consider several in our analysis. First, we use all of the patient-level covariates in our adjustment set using the full EGS patient population. Next, we use all the patient covariates in the subset that was selected for operative care (). Comparing the magnitude of the estimated disparities in the full study population and the subset that receives surgery gives a sense of the relationship between the surgery decision and disparities. Second, we add hospital-level information in our adjustment set. One way to do so would be to include hospital-level covariates. This approach, however, does not account for any unmeasured (or unmeasurable) factors, such as features of the surrounding community or other local supports. Instead, we directly adjust for the hospital that treats patient , , and only compare patients within the same hospital. This accounts for all observable and unobservable differences across hospitals by restricting comparisons between racial groups to be within the same hospital and then marginalizing over the hospitals.
Finally, we consider a more nuanced analysis that takes into account equity concerns, reflecting recent proposals from Jackson and VanderWeele (2018), Jackson (2021), and Jackson et al. (2022).222This is closely related to the literature on “good” and “bad” controls; see, for example, Cinelli et al. (2020). In their framework, allowable covariates are those for which adjusting for differences between groups is justified by clinical and ethical considerations; examples include age and sex. By contrast, factors that reflect socioeconomic status, such as insurance type, are non-allowable for adjustment, in the sense that these factors contribute to health disparities. For example, differences in surgery decisions based on income would be considered unethical, and adjusting for these differences between groups would therefore mask important inequities.
Specifically, Jackson (2021) proposes partitioning covariates into four different sets . The first two covariate sets are , the non-allowable covariates, and , the surgery decision. The allowable covariates are split into and , the sets of “outcome-allowable” and “treatment-allowable” covariates, respectively. Outcome-allowable covariates are typically demographic measures — in our analysis age and sex — while treatment-allowable covariates are typically clinical measures related to health history, such as the presence of comorbidities, that inform the surgery decision. Slightly abusing notation, we denote as the conditional distribution of the outcome-allowable covariates given that race . Then the estimand , corresponds to the average observed outcome for white patients, standardizing the distribution of outcome-allowable covariates to be equal to that for Black patients.
2.1.2 Decomposing disparities
Thus far, we have considered estimating an health disparity by standardizing white patients’ covariates to the distribution of Black patients. For this approach, we can either adjust for the full covariate vector or partition the covariates into different sets to account for equity concerns. One drawback to this approach is that it does not formally account for how the treatment decision may contribute to disparities. In our application, for example, clinicians may be interested in understanding how the decision to treat EGS patients via surgery affects disparities. Next, we consider two different methods that integrate the decision to treat into the disparity estimation process. Both of these methods decompose the estimated disparity into components that are based on the treatment decision. These decompositions involve estimands that are based on frameworks with assumptions that allow for causal interpretations. Here, we consider them to be important and relevant statistical estimands.
Stochastic intervention decomposition.
First, Jackson and VanderWeele (2018); Jackson (2021); Jackson et al. (2022) propose a decomposition based on a counterfactual scenario where Black patients have the same odds of undergoing treatment as white patients, conditional on outcome- and treatment-allowable covariates.333Jackson (2021) embeds these concepts into a potential outcomes framework, where there are two potential outcomes for each patient depending on whether or not they undergo surgery, and formalizes this estimand as the expected outcome under a stochastic intervention. Here we focus on the resulting statistical estimand that is equivalent to the causal estimand under several identifying assumptions (Jackson, 2021). Using our notation, the resulting target distribution can be written as:
for , where is the probability that a white patient with allowable covariates and receives treatment. This distribution breaks the observed relationship among Black patients between the surgery decision and the covariates. Instead, this estimand sets the distribution of the surgery decision to follow the observed relationship among white patients, with the other covariates based on the Black patient population.
With these quantities, we follow Jackson (2021) and define the following decomposition based on three different estimands:
| (2) |
On the left-hand side is the group disparity after adjusting for outcome-allowable covariates only, . In the context of our analysis, this is the disparity in adverse outcomes for the entire EGS population after adjusting for age and sex only. This disparity is then decomposed into two terms.
The second term, , compares the observed average outcome for Black patients with the average outcome if the odds of performing surgery are equalized across Black and white patients. This term is the disparity reduction for Black patients, which measures how adverse outcomes for Black patients would change after equalizing the odds of treatment via surgery. The third term in the decomposition, , compares outcomes for Black patients after equalizing the odds of surgery to outcomes for white patients after adjusting for outcome-allowable covariates. This term is referred to as the residual disparity, the amount of observed disparity that would remain after equalizing the odds of the surgery. If the outcome-allowable-covariate-adjusted disparity and residual disparity are close to each other this suggests that the decision to perform surgery is not a meaningful driver of observed disparities.
Unconditional decomposition.
Yu and Elwert (2023) propose an alternative approach that decomposes the unadjusted disparity into four components based on: (i) the baseline disparity among Black and white patients if no one receives treatment; (ii) the difference in treatment prevalence; (iii) the effect of treatment between the two groups; and (iv) differential selection into treatment based on its effects. Following their identifying assumptions, we can write the resulting statistical estimand in terms of the estimand in Equation (1). Using the full vector of covariates, , the target distribution is:
Using as a shorthand for , and denoting the rate that group receives surgery as , we can then decompose the unadjusted disparity into the four components:
| (3) |
where represents the patient-level effect of surgery on the adverse event outcome, and is the covariance between the decision to operate and the treatment effect of surgery for group . These covariance terms will be positive if those patients that are more likely to benefit from surgery are more likely to receive surgery.
In this decomposition, the “baseline” term refers to the average difference in adverse events if no patients in either group are treated via surgery. The “prevalence” term captures how much of the disparity in adverse events is due to any differential prevalence of surgery by race. The “effect” term reflects the possibility that the average effect of surgery differs by race. Finally, the “selection” term captures whether differential selection into the decision to operate contributes to the total disparity. This decomposition fully captures all aspects of how the disparity in outcomes might arise. In order to estimate each of these terms via weighting, we rearrange terms as follows:
2.2 Review: adjustment via linear estimators
We now use this setup to describe existing approaches to measure and isolate racial disparities, placing them in a common estimation framework. In this section, we will focus on estimating , the expected outcome for white patients if the selected patient-level characteristics were drawn from the distribution of Black patients; in Section 3 we extend to a generic target population . To begin, note that the average outcome among white patients will in general be a biased estimator for this quantity:
This bias is due to the selected patient-level information varying systematically between white and Black patients, and is precisely the difference we are attempting to account for.
One classical approach to account for this difference is based on regression. The Kitagawa-Oaxaca-Blinder decomposition (Kitagawa, 1955; Blinder, 1973; Oaxaca, 1973) separately regresses the outcomes on the selected covariates for Black and white patients via ordinary least squares, yielding coefficients and . It then estimates by taking the average prediction for Black patients, if we were to set the race variable to be white in the regression:
| (4) |
where is the average of the selected covariates for Black patients.
This regression approach is an imputation estimator: it uses the predictions from the regression to impute expected patient outcomes for Black patients if the race indicator changed but the selected covariates remained fixed. Variants of this approach are common in health disparities research (Alavi et al., 2012; Esnaola et al., 2008; Cooper et al., 1996). As Kline (2011) discusses, this regression approach can also be viewed as a linear combination of outcomes for the white patient population,
where is the matrix of selected covariates for white patients. Typically, KOB-style analyses are also concerned with decomposing observed disparities; here we focus on estimating the adjusted difference component of this decomposition, while retaining the terminology as in Kline (2011).
Other common estimators of adjusted racial differences are similarly linear in outcomes, using specific types of regression modeling, inverse propensity weighting, or matching to estimate . For some of the many examples of related literature, see: Barsky et al. (2002); DiNardo et al. (1995); Silber et al. (2014, 2013); Rosenbaum and Silber (2013); Silber et al. (2015); Chernozhukov et al. (2013); Firpo et al. (2018); Machado and Mata (2005); Melly (2005); Jackson (2021).
3 Regularized linear estimators for adjustment
In this section we extend the KOB approach for a general comparison distribution . Specifically, we define the KOB estimate as , where and are the solutions to the ordinary least squares problem
This builds on a long literature generalizing linear regression estimators in similar contexts; see Strittmatter and Wunsch (2021) for a related discussion applied to the gender pay gap in Switzerland. While we focus here on adjusting for the set , this estimator accommodates many types of analyses, as we describe in Section 2.2
We first consider the statistical performance of this KOB estimator in non-parametric settings where the linear model might not be correct. We then propose a ridge-regularized version that accounts for interactions and non-linearities in the outcome model. The most important interaction is that between hospitals and the covariates; we incorporate this by fitting separate models for each hospital and partially pooling.444The interaction between the surgery decision and the covariates is also important. The estimates we report in our analysis in Section 4 use the surgery decision in different ways, where appropriate we run separate analyses for the population that do and do not receive surgery to account for this interaction. Then we connect this ridge regularized approach to a general linear weighting estimator.
3.1 A regularized Kitagawa-Oaxaca-Blinder approach
3.1.1 Statistical performance of KOB
One limitation of the Kitagawa-Oaxaca-Blinder approach outlined in Section 2.2 is that it only accounts for covariates linearly, and so does not take into account potential non-linearities and interactions between the covariates . These interaction terms may be important predictors of patient outcomes, and failing to account for these may lead to irreducible error in our estimates. Formally, we can characterize the design-conditional mean square error of the KOB estimator in general nonparametric settings with comparison distribution .
Proposition 3.1 (MSE for Kitagawa-Oaxaca-Blinder).
Assume that the covariates are centered so that , and that for all . Then the design-conditional mean square error is
where , , , and .
Proposition 3.1 shows that the MSE for the Kitagawa-Oaxaca-Blinder estimator consists of two terms.555In heteroskedastic settings where the residual variance changes with , Proposition 3.1 can be written as an upper bound with the maximum residual variance taking the role of . First, because the intercept and coefficients are unbiased estimates of the best linear approximation to the true conditional expectation , the estimation error corresponds to the variance of with a correctly specified outcome model. As we expect, this variance decreases with the number of patients of race , but there is an additional design effect factor that depends on the distribution of the covariates both in the sample and under . If is far from the empirical distribution of patients of race — as measured by the mean of — the resulting KOB adjustment will be large, leading to a larger estimation error. Conversely, if the distributions are close, there will be less need for adjustment and the estimation error will be closer to ordinary regression error.
While the estimation error decreases with the sample size, the second component of the MSE — the approximation error — does not. This term depends on the quality of the linear approximation to the true conditional expectation. If there are important non-linearities or interactions between covariates then this approximation error can be large. We turn next to accounting for these terms in order to reduce the approximation error and improve the credibility of the KOB estimate.
3.1.2 Accounting for hospital components and non-linearity
As we discuss in Section 2.1 above, a key element in studies of racial disparities in health is accounting for the admitting hospital. To do so, we restrict comparisons between racial groups to be within the same hospital, which accounts for both observable and unobservable differences across hospitals.
To formalize this estimator, we modify the KOB regression above in the case where the hospital is included as a selected covariate. First, we decompose the selected covariates into , where is the hospital that treats patient , and encodes the other selected patient-level characteristics. We then consider an approximation to the conditional expectation with two key components: (1) separate hospital-level fixed effects and coefficients; and (2) further non-linearity and interactions in the other patient characteristics:
| (5) |
where encodes transformations of the patient characteristics. In Section 4.1 we discuss how we choose this transformation in a data-driven way for our analysis.
The model in Equation (5) is more flexible than the typical linear model: it allows for separate hospital-specific models, where the relationship between the patient-level characteristics and the outcome can differ by hospital. Furthermore, by using an appropriate transformation function we can reduce the approximation error in Proposition 3.1. At the same time, this model can be much more difficult to estimate due to the hospital-level coefficients. For example, in our data there are 406 separate hospitals, leading to 45,066 coefficients in Equation (5) when we use the full set of patient characteristics, even when is the identity transformation. This can lead to a high estimation error when estimating the model with OLS.
Instead, we choose to take a regularized approach. First, we find coefficients via regularized regression, choosing and to solve
| (6) |
Then we compute a regularized KOB estimate,
| (7) |
where is the marginal probability that hospital treats a patient under distribution .
To estimate the coefficients via Equation (6), we regularize the hospital-specific coefficients towards a global model . This allows us to share information across hospitals, potentially improving estimation. The level of pooling is an important hyperparameter that controls the bias-variance tradeoff. As decreases, less pooling occurs; when no information is shared across hospitals. This will have the lowest bias, as there is no regularization at all, but can increase variance. Conversely, as increases, the hospital-specific coefficients become more and more similar; the extreme case where constrains the covariate-outcome relationship to be the same across hospitals, and only allows for baseline levels to differ. This substantially reduces the variance, as it removes the need to estimate separate models for each hospital, but can lead to high bias by ignoring possibly important interactions. We discuss choosing based on an alternative characterization of the estimator in the next section. We inspect the impact of the level of pooling in our simulation study in Section LABEL:sec:sim and in our analysis in the supplementary materials.
3.2 An equivalent penalized linear estimator
Following our discussion in Section 2.2, we now relate the regularized KOB approach above to a general linear estimator for . These take a linear combination of outcomes in group ,
| (8) |
where is the weight in the linear combination placed on patient ; these weights may be positive or negative.666We restrict our attention to linear combination weights that are independent of the outcomes. Next, we inspect the statistical properties of linear estimators and then find the MSE-optimal linear combination via convex optimization. We then show that the regularized KOB estimator in the previous section is a special case.
Estimation error of linear estimators.
We begin by inspecting the statistical properties of the linear estimator in Equation (8), following the development in, e.g. Hirshberg et al. (2019); Hirshberg and Wager (2021). We can decompose the design-conditional mean square error of into a bias term and a variance term:
| (9) |
The bias term comes from imbalance in the conditional expectation . The variance term is the sum of squared weights, weighted by the residual variance for each patient.
Focusing on the flexible model with hospital-level interactions in Equation (5), we can show that the bias depends on the difference between the target average of the (transformed) covariates (i) within each hospital and (ii) across hospitals, as well as the difference in hospital counts:
| bias | (10) | |||
This expression shows the importance of within-hospital comparisons. Only by controlling the differences in patient-level characteristics within hospitals can we adjust for hospital-level differences in how these characteristics correlate with outcomes. From this, we see that we can evaluate the potential for bias in a linear estimator by inspecting these three differences, while we can evaluate the variance via the sum of the squared weights. We will now use this as a guide to construct weights that control the bias and the variance.
Penalized optimization problem.
Following proposals from e.g. Zubizarreta (2015); Hirshberg et al. (2019), we find linear combination weights by solving the following convex optimization problem:
| (11) | ||||
| subject to | ||||
This optimization problem adapts that of Ben-Michael et al. (2021b), developed for estimating subgroup effects in observational studies, to our racial disparities setting. It has several components relating to the bias and variance terms described above. First, the objective includes the mean square within-hospital difference in the transformed covariates ; this corresponds to the within-hospital component of the bias. The other term in the objective is the sum of the squared weights, a proxy for the variance of the linear estimator. The constraints in the optimization problem ensure that the overall difference between the covariates across hospitals is zero, and that the overall amount of weight placed on each hospital is equal to the probability that a patient is treated in the hospital in the target distribution. These terms control the other two components of the bias.
In this optimization problem, the weights are regularized in two ways: (i) the variance penalty in the objective with hyper-parameter and (ii) the constraint that weights are bounded between and . To understand the relative contribution of these two terms, first consider the case where and , which we refer to as “unrestricted” balancing weights. In Appendix LABEL:sec:proofs we show that the solution to optimization problem (11) in this case is equivalent to the linear weights implied by the regularized KOB estimator (7), with serving the same role of negotiating the bias-variance tradeoff in both optimization problems.
Alternatively, we can constrain the weights to be non-negative (i.e. ), which we refer to as “restricted” balancing weights. With this constraint, the weighted average of the covariates for white patients is restricted to be in the convex hull of all the observed covariates for white patients. Most prominently, this ensures that the final estimate is “sample bounded” between the minimum and maximum possible outcome value. Viewed in this light, we see that unrestricted balancing weights (i.e., outcome modeling) can extrapolate from the data. This allows for potentially decreased MSE at the cost of increased model dependence (King and Zeng, 2006). We consider the impact of these constraints in Section LABEL:sec:sim via simulations. See Ben-Michael et al. (2021a); Chattopadhyay and Zubizarreta (2021) for more discussion on weighting representations of regression methods.
The MSE decomposition in Equation (9) also gives a guide for choosing the hyper-parameter . Since penalizes the sum of the squared weights, it corresponds to the variance term in the MSE. In the special case of homoskedastic errors — i.e., when — the variance term simplifies to times the sum of the squared weights. Therefore, we choose by first regressing the outcome on the selected covariates for racial group , then setting to be the residual variance. This heuristic choice of places our estimates on one spot of the bias-variance tradeoff, in Appendix LABEL:sec:hyperparameter we discuss tracing out this tradeoff in our data.
Finally, we can view this optimization problem as a continuous relaxation of matching patients of different races, with an exact match on hospitals and a fine balance constraint marginally on each covariate (Yiu and Su, 2018). This further highlights the approach’s computational efficiency, especially relative to matching. In particular, optimization problem (11) is a Quadratic Program (QP) that is strongly convex for . Traditionally, QPs have been solved with interior point methods, but recent first-order methods using the Alternating Direction Method of Multipliers (ADMM; Boyd et al., 2010) have been particularly successful at efficiently solving large QPs. In particular, Stellato et al. (2020) develop OSQP, an efficient ADMM procedure for QPs. The OSQP procedure is particularly efficient in our setting because the within-hospital difference measures induce sparsity that OSQP can leverage via efficient sparse numerical linear algebra libraries (see Kim et al., 2022, for extensive numerical results showing efficiency in big data problems). Compared with matching approaches that solve mixed integer programs, this convex formulation allows us to quickly find the linear combination weights even with the large administrative data sets often found in health-services research. In our analysis in Section 4, we compare the computational performance of matching versus this QP approach to balancing weights.
3.3 Estimation
Point estimation.
We now focus our discussion on how to estimate the EGS racial disparities quantities in Section 2.1, which are based on three main estimands. First, all of the disparity measures involve the expected outcome for Black patients, . We estimate this simply via the sample average outcome among Black patients: . Second, we are interested in estimating , the expected outcome for white patients as-if the selected covariates followed the distribution of Black patients. In our analysis in Section 4 we consider several different covariate sets: all patient-level covariates, all patient-level covariates and the hospital indicator, and outcome-allowable covariates only. We estimate this using the regularized KOB approach, using the empirical distribution of the Black patient population in place of the population distribution.
Finally, we want to estimate the components of the disparity decompositions discussed in Section 2.1.2. For the stochastic intervention decomposition of Jackson (2021), we want to estimate , the expected outcome for Black patients if, given outcome- and treatment-allowable covariates, Black patients had the same odds of receiving treatment as white patients. To estimate this via the regularized KOB approach, we again use the empirical distribution of the covariates among Black patients in place of the population distribution . We then estimate , the probability of receiving surgery for white patients given the allowable covariates, by fitting a logistic regression on a set of flexible features using the observed data for white patients. Combined, this gives us an estimate of the target distribution. We note that, unlike for the other targets estimands, we rely on parametric modeling to estimate key components of intervention-style estimands like this.
For the unconditional decomposition of Yu and Elwert (2023), we want to estimate , the expected outcome for group if everyone were to receive surgery decision . Here we use the regularized KOB approach, re-weighting the observed patients of group with surgery decision towards the empirical distribution of the observed covariates for all patients of group . We also estimate , the proportion of patients in group receiving surgery, with the empirical average.
Variance estimation.
Next we estimate the variance of these estimates. For , this is a simple average of observed outcomes, so we estimate the variance as To estimate the variance of the other estimates, note that the variance term in Equation (9) involves the conditional variance of the outcome given the appropriate set of covariates. For each estimate we begin by fitting a model for the conditional expected outcome given the selected covariates and race , and get the predicted value for each unit . We then estimate the variance as
where we have used the constraint in Equation (11) that . We term this the residualized variance estimator (RVE). In our main results below, we fit the model via ridge regression, fully interacting the hospital indicators and the surgery decision , when appropriate, with the transformed covariates and weighting according to . Hirshberg et al. (2019) and Ben-Michael et al. (2021) provide technical conditions for to be asymptotically normally distributed around , and for to be consistent for the true variance. Notably, the bias term due to any remaining differences in the distributions between the adjusted population and the target distribution must be small. We explore the impact of this bias on coverage of confidence intervals in Section LABEL:sec:sim below.
Finally, note that when we fit the conditional expectation with a constant model, is equivalent to the HC2 standard error estimate for the coefficient on race , in a weighted least squares regression of the outcome on an intercept and race. This form of variance estimate is common for propensity score estimators (Ramsey et al., 2019; Pirracchio et al., 2016), though Reifeis and Hudgens (2022) suggest that the resulting variance estimator can perform poorly in practice. We assess this via simulation in Appendix LABEL:sec:coverage_sim and find that the HC2 standard error is conservative in our simulation settings.
With these variance estimates in hand, we can construct approximate confidence intervals for our racial disparity measures. For example, for the adjusted risk difference when standardizing covariates to the Black patient distribution, we estimate the squared standard error as and create an approximate confidence interval via , where is the quantile of a standard normal variable. We also create a confidence interval for the log adjusted risk ratio via the delta method, estimating an overall squared standard via and computing the confidence interval as . Finally, the disparity decompositions are linear combinations of the various estimates, so we can compute their standard errors analogously.777To compute the standard error for the components of the unconditional decomposition, we treat , the proportion of patients in group , as known given our large sample sizes. See Yu and Elwert (2023) for a form of the standard error that incorporates uncertainty in .
4 Racial Disparities in Emergency General Surgery
We now turn to our analysis of racial disparities in EGS.888In the supplementary materials, we conduct two different simulation studies to evaluate our proposed methods and better explore their properties. First, we discuss various data processing steps, including expanding the basis to account for non-linearity and interactions. We estimate two different sets of weights: (1) adjusting for age and sex only, and (2) adjusting for the full set of available patient-level covariates. In addition, we estimate one set of weights that ignores hospital information and one that stratifies by hospitals. This allows us to account for the role of hospital quality, which has been shown in past research to be an important factor in racial disparities in surgery. We then review how well the weights reduce imbalances between the comparison groups and explore how constraining the weights to be non-negative prevents extrapolation. After these diagnostic checks, we estimate outcome disparities across the different adjustment sets, finding that disparities are largely explained by differences between hospitals. Here, we provide a direct comparison to widely used methods based on matching (Silber et al., 2013, 2014, 2015; Rosenbaum and Silber, 2013). Finally, we implement an analysis for both of the disparity decompositions outlined in Section 2.1.2. In this analysis, we implement both the stochastic intervention decomposition and the unconditional decomposition to understand whether the decision to operate by race also contributes to the observed disparity.
4.1 Data Processing
We start our analysis by focusing on the full set of available covariates and hospital indicators. In Section 4.4 below, we partition variables into allowable and non-allowable sets, following the setup in Section 2.1.
Selecting the features to balance.
Under the regularized KOB approach, we can account for possible nonlinearity or key interactions between covariates by expanding the set of features as encoded by . To account for possible nonlinearities, a spline basis can be applied to each continuous covariate. In our study, age is the most important continuous covariate, and we include a spline basis for age in . For binary covariates, the primary concern is identifying which relevant interactions between covariates to consider (see Ben-Michael et al., 2021, for more discussion on the role of interactions). In principle, expanding the basis to include interactions can be based on substantive expertise. In practice, however, substantive expertise may be silent when a large number of interactions are possible: in our data set, there are 4,186 potential two-way interactions alone.
As such, we use a random forest-based approach for selecting interactions using a method outlined in Inglis et al. (2022). See Wang et al. (2021) for a more general discussion of learning appropriate bases. Among machine learning methods, random forests are especially well suited for selecting interactions (Wright et al., 2016). As such, we use an “honest” implementation of random forests based on sample splitting. We first split the data into a training and analysis sample. For this step, we randomly sample 2.5% of the patients as the training sample. Using the training sample, we train a random forest to predict the outcome, select the set of interactions with the largest variable importance metrics, and then include these interactions in our transformation function . We then discard the training sample from further analysis. We used separate random forest fits for the different covariate sets; we first focus on the full set of covariates, and then consider outcome-allowable and treatment-allowable sets in Section 4.4.
Hyperparameter Selection.
Finally, we select the hyperparameter , which controls the bias-variance tradeoff using the method outlined in Section 3.2. We choose separate hyperparameters by surgery status using the full set of covariates and for age and sex alone; the hyperparameter values range from 0.13 to 0.19. Notably these hyperparameter values are non-zero but still relatively small, so these values largely prioritize bias reduction over increasing the effective sample size. In the supplemental materials, we include an additional analysis where we compute the imbalance reduction and the effective sample sizes for a range of hyperparameter values. In that analysis, we demonstrate the clear bias-variance trade off controlled by the hyperparameter value.
4.2 Diagnostics
Balance.
One important diagnostic for a weighting analysis is understanding how well the weights account for imbalances across the comparison groups. Here, we report on balance diagnostics to understand how well restricted weights (i.e. ) balance the baseline differences between the white and Black patient populations. In the supplementary materials, we report balance results for the weights that do not include hospitals. For these analyses, we find that we can nearly exactly balance patient-level covariates. Here, we focus on the analysis that includes the full set of covariates and the hospital indicators .
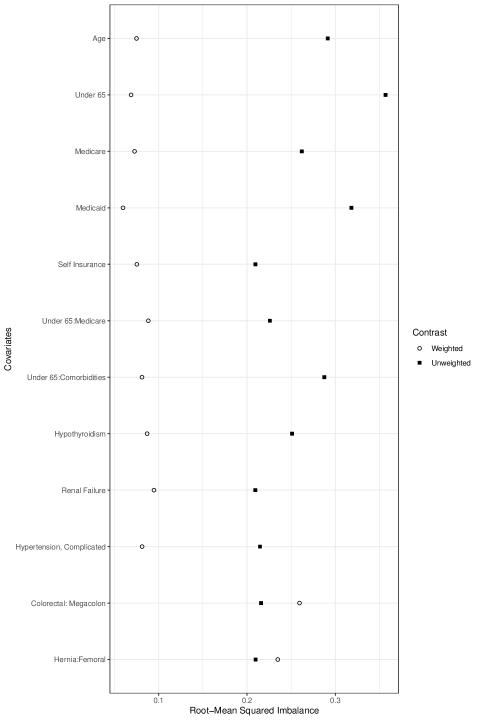
To measure balance within hospitals, we calculate two vectors of standardized differences within each hospital before and after weighting, which we denote, respectively, as and . For covariates with hospitals, the dimension of these vectors of standardized differences is now . We then calculate a measure we call the root-mean squared imbalance (RMSI) . Importantly, RMSI avoids “averaging away” imbalances across hospitals. In Figure 1, we plot the RMSI for the 15 covariates with the largest imbalances at baseline. We observe, as anticipated, that the weighting estimator reduces these imbalances, often substantially, though some interactions remain difficult to balance.
Extrapolation.
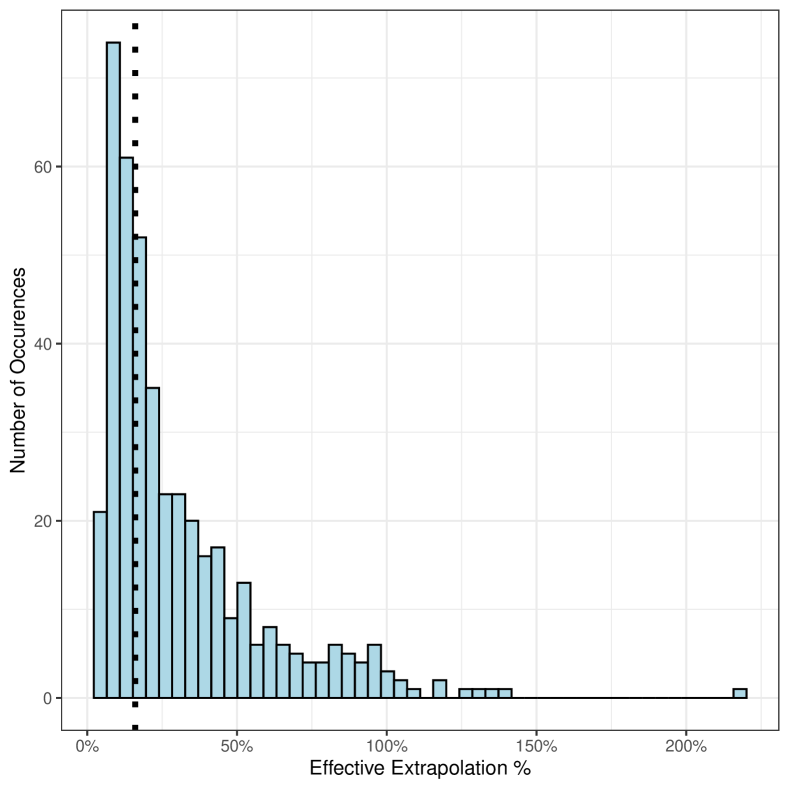
We also investigate how constraining the weights to be non-negative prevents extrapolation. To that end, we estimated an additional set of weights using an unrestricted model where and for the within-hospital analysis using the full set of covariates; this is equivalent to estimating a ridge regression outcome model alone. The unrestricted weights are allowed to be negative, which extrapolates beyond the support of the data. To measure the amount of “effective extrapolation,” we sum over absolute values of the negative weights and divide that sum by the number of Black patients. By this measure, 15.2% of weights are negative overall. We also calculated this measure of effective extrapolation for each hospital. Figure 2(a) contains a histogram of the effective extrapolation measure separately by hospital. The mass of the distribution is to the left of 50%, which indicates that for most hospitals, the effective extrapolation is less than half. However, there is a substantial fraction of hospitals with more substantial extrapolation. In fact, there are several hospitals where the extrapolation percentage is greater than 100%. Overall, we find that, for many hospitals, considerable extrapolation is necessary for balancing covariates with unrestricted weights — and an extreme amount of extrapolation is necessary for a few.

To help understand the source of the extrapolation, Figure 2(b) plots the hospital-specific extrapolation percentage against the number of Black patients in each hospital. In this figure, we observe that high levels of extrapolation occur in hospitals with few Black patients. This is not surprising: when there are few Black patients the weights tend to extrapolate to balance the covariate distributions. As such, the restricted version of the weights is useful to prevent extrapolation beyond the support of the data, at the cost of reduced balance.
4.3 Disparity estimates with the full adjustment set
We now present the disparity estimates. We first focus on the full EGS patient population. Table 4.3 contains disparity estimates for four different scenarios. Without any adjustment, the observed adverse event rate for Black patients is 27%, and the estimated adverse event rate for white patients is 29.1%, for a risk difference of -2.1 percentage points and a risk ratio that is 7% lower. In addition, there is no difference in terms of length of stay.
| Unadjusted | Age- & sex-adjusted | Fully-adjusted | Fully-adjusted disparity | |
|---|---|---|---|---|
| disparity∗ | disparity | within hospital | ||
| Adverse Event | -0.021 | 0.017 | 0.011 | 0.004 |
| [ -0.024 , -0.018 ] | [ 0.011 , 0.023 ] | [ 0.007 , 0.015 ] | [ -0.003 , 0.011 ] | |
| Adverse Event (Risk Ratio) | 0.93 | 1.07 | 1.04 | 1.01 |
| [ 0.92 , 0.94 ] | [ 1.05 , 1.09 ] | [ 1.03 , 1.05 ] | [ 1 , 1.03 ] | |
| Length of Stay | -0.0005 | 0.58 | 0.47 | 0.2 |
| [ -0.04 , 0.04 ] | [ 0.47 , 0.68 ] | [ 0.43 , 0.51 ] | [ 0.09 , 0.31 ] |
-
Note: Numbers in brackets are 95% confidence intervals. ∗ the outcome-allowable covariates .
Following the setup in Section 2.1, we first consider adjusting for the outcome-allowable covariates — age and sex — alone. We now find that the re-weighted adverse event rate for white patients is 25% for a risk difference of 1.7 percentage points. We also find that Black patients have an average length of stay that is more than half a day longer than white patients. As such, once we compare patients with similar age and sex profiles, we find a clear racial disparity for the EGS population.
Next, we present results when we include the full set of patient-level covariates. Conditioning on these additional covariates shrinks the estimated disparity by a small amount, but the estimated disparity is similar. We then account for hospitals using the within-hospital weights. In the within-hospital analysis, the estimated adverse event rate for the re-weighted white population is now 26.6% for a risk difference of 0.4 percentage points; the risk ratio is now 1% higher. The average length of stay for the re-weighted white population is 5.9 days for a difference of 0.20 days. Overall, accounting for differences across hospitals nearly eliminates the estimated disparities in adverse events and length of stay. These results are consistent with those in Silber et al. (2014) and demonstrate both the need to ensure that Black and white patients are comparable before estimating disparities, and how the results depend on which covariates are considered allowable.
Table 4.3 contains analogous results for the subset of the EGS population that received surgical care. The pattern of results is roughly the same as in the full EGS population. In the unadjusted analysis, we find that Black patients either have very similar or lower rates of adverse events. However, once we adjust for the full set of observed covariates, Black patients have worse outcomes: the risk of an adverse event is 6% higher for Black patients, and the average length of stay is 0.62 days longer. As before, the disparity shrinks in the within-hospital analysis: the risk of an adverse event is 1% higher for Black patients, and the average length of stay is 0.25 days longer for Black patients.
| Unadjusted | |||
|---|---|---|---|
| disparity | within hospital | ||
| Adverse Event | -0.002 | 0.02 | 0.01 |
| [ -0.01 , 0.001 ] | [ 0.01 , 0.02 ] | [ 0.–1 , 0.02 ] | |
| Adverse Event (Risk Ratio) | 0.99 | 1.06 | 1.02 |
| [ 0.98 , 1.01 ] | [ 1.04 , 1.07 ] | [ 1 , 1.05 ] | |
| Length of Stay | 0.84 | 0.62 | 0.25 |
| [ 0.75 , 0.94 ] | [ 0.56 , 0.68 ] | [ 0.13 , 0.37 ] |
-
Note: Numbers in brackets are 95% confidence intervals.
These results highlight the critical role of the choice of the covariate adjustment set. Without adjustment, we find Black patients have better or comparable outcomes, but this comparison does not reflect important differences in baseline demographics and other attributes. If we adjust for age and sex, we find clear evidence of racial disparities in EGS. Under the more standard KOB approach that re-weights all available covariates, the estimated disparity remains larger than the unadjusted estimates. Finally, adjustment for hospitals eliminates or substantially reduces the disparity.
In short, Black EGS patients experience worse health outcomes than comparable white EGS patients across hospitals. Compared to white patients within the same hospital that are comparable on observable features, however, health outcomes for Black patients are not substantially worse. Below, we further consider possible disparities in the surgery decision, which also varies across hospitals.
4.3.1 Comparison to Matching
Matching methods are widely used to estimate racial disparities (Silber et al., 2013, 2014, 2015; Rosenbaum and Silber, 2013). To better understand differences and similarities between matching and our approach, we re-analyzed the same data set using matching. In particular, we implemented an optimal match with refined-covariate (RC) balance constraints and a propensity score caliper, while exactly matching on hospitals and stratifying the match by surgical status (Pimentel et al., 2015). We then calculated disparities using the matched data set. We find that the estimated risk difference for adverse events is 2.5 percentage points, and the average difference in length of stay is 0.51 days. That is, for the matched analysis, we find that the estimated disparities are close to the balancing weight estimates that do not control for hospitals.
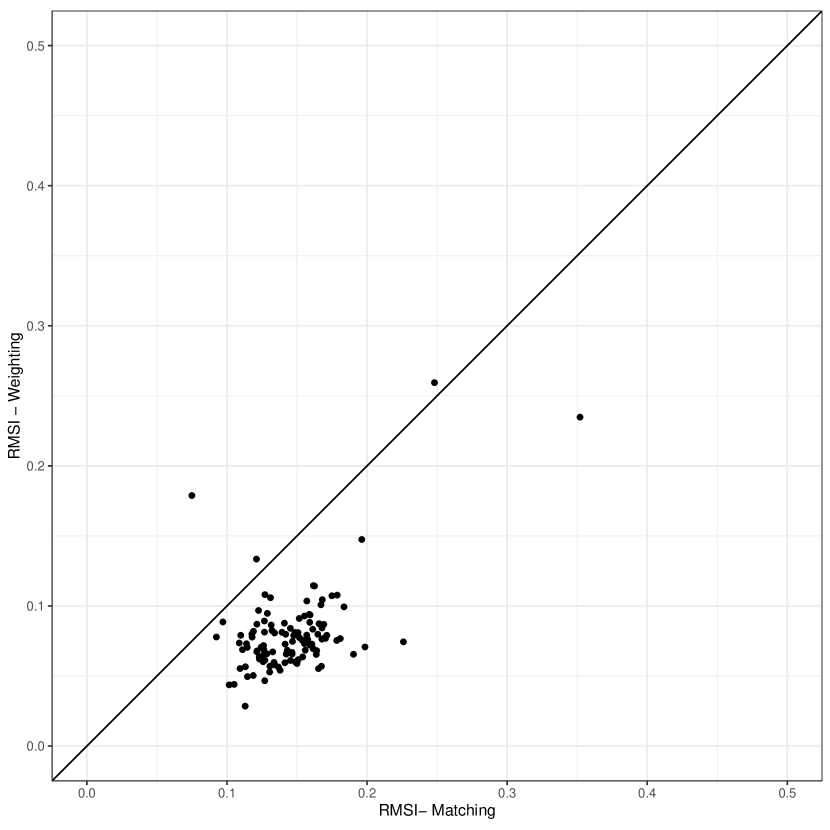
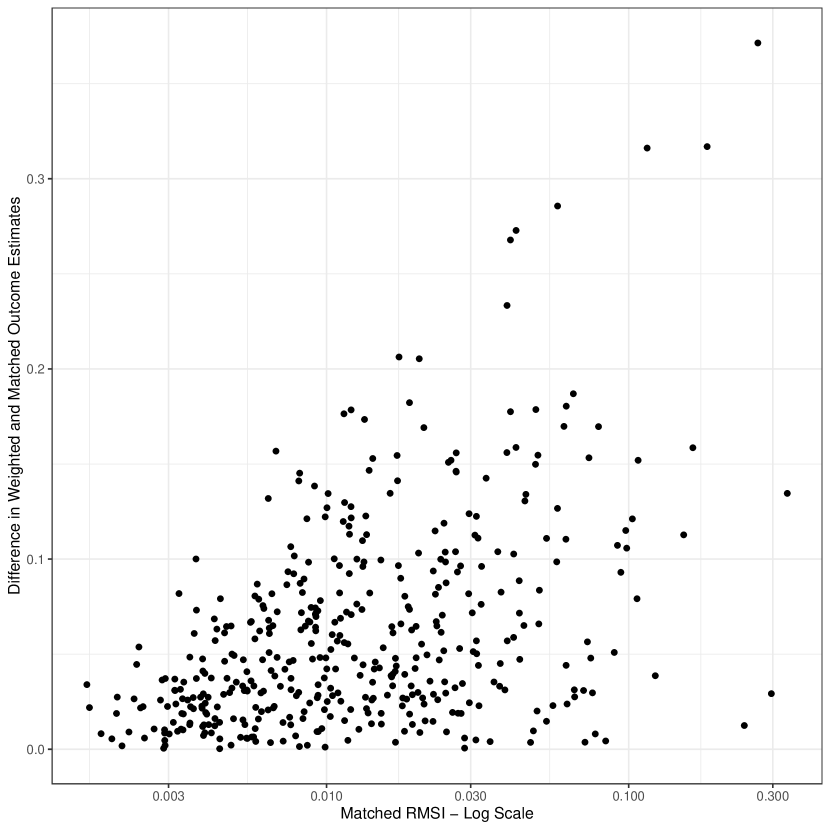
One possible explanation for the differences is that while the exact match on hospitals accounts for across-hospital differences, matching leaves large imbalances in other covariates. To that end, we computed the percentage of imbalance reduction across the full set of covariates within each hospital compared to the baseline level of imbalance for matching and weighting. Here, we find that weighting substantially outperforms matching. For matching, the percentage of bias reduction is 19.7%; for weighting, the reduction is 60.2%. We also calculated the RMSI for matching and plotted it against the RMSI for the restricted weights. The results are in Figure 2(c). We find that the RSMSI for matching is systematically higher than for weighting, which implies that the balance under matching is generally worse. Figure 2(d) plots the difference between the estimated difference in adverse events for weighting and matching at the hospital level against the RMSI for matching. Here, we find a strong correlation between larger differences in outcomes and larger imbalances after matching. That is, the results based on matching appear to be driven by the fact that matching is unable to balance covariates within hospitals.
Finally, we compared the methods in terms of computation time, using a Macintosh desktop with 64 GB of RAM. Here, we only compared the times for the within-hospital analysis. The RC balance match required 190 minutes. Estimation of the weights for the within hospital analysis required 7 minutes. We also attempted to include a match with exact matching on states. However, we found these matches took longer than 24 hours and thus did not let them run to completion. Thus, balancing weights require much lower computation times than extant matching methods.
4.4 Disparity Decompositions
Finally, we decompose the estimated disparities into terms that are a function of the decision to treat via surgery, as outlined in Section 2.1.2. We begin the analysis by simply estimating whether Black patients are more or less likely to receive operative care for an EGS condition. A logistic regression of the surgery indicator on the indicator for race and the full set of patient-level covariates shows that the odds that a Black patient receives surgery relative to a white patient with the same covariates are notably lower (0.83, 95% CI: 0.81, 0.84 ).
First, we follow the rubric in Jackson (2021). For this decomposition, we need to partition the covariates into the appropriate sets. We designate the outcome-allowable covariates, , as age and sex; and designate the treatment-allowable covariates, , as: the number of comorbidities, sepsis, disability, the 31 comorbidities, and the 51 EGS categories. Finally, we designate indicators for health insurance status and the hospital identifier as the non-allowable covariates, . Next, we decompose the -adjusted disparity into the disparity reduction component and the residual disparity component. As discussed in Section 3.3, we estimate a logistic regression model of the indicator for surgery on the outcome- and treatment-allowable covariates, and , in the white patient population. We then use these estimates to generate an estimated target distribution to weight the Black patient population towards to equalize the odds of being treated via surgery. Table 3 contains the results, re-reporting the estimated disparity after adjusting for outcome-allowable covariates (age and sex) only.
For both outcomes, the estimated disparity reduction from equalizing the odds of surgery between Black and white patients is close to zero, which means that the estimated residual disparity is essentially identical to the observed disparity. This suggests that the disparities we observe are neither exacerbated nor ameliorated by the decision to operate. The source of the disparity does not appear to be a function of racial bias in the decision to operate on EGS patients.
| disparity | Disparity reduction | Residual disparity | |
|---|---|---|---|
| Adverse Event | 0.017 | -0.0014 | 0.0187 |
| [ 0.011 , 0.023 ] | [ -0.006 , 0.003 ] | [ 0.013 , 0.024 ] | |
| Length of Stay | 0.58 | -0.008 | 0.58 |
| [ 0.47 , 0.68 ] | [ -0.08 , 0.06 ] | [ 0.52 , 0.64 ] |
-
Note: Numbers in brackets are 95% confidence intervals. Estimates in the Table are risk differences.
Next, we follow the unconditional decomposition of Yu and Elwert (2023). As we outlined above, we decompose the total disparity into four different terms: base, prevalence, effect, and selection. Notably, this decomposition is unconditional in that we do not adjust for the patient level covariates; they are only used to equalize the odds of surgery within groups and hospitals.999For this analysis, we had to restrict the study sample to hospitals with at least 15 Black patients; in some small hospitals, all Black patients received surgery. As such, there are slight differences between the unadjusted results presented here and those presented above. Table 4 contains the results. For both outcomes, we find that the total and base effects are nearly identical, since the estimated prevalence, effect, and selection effects are all small in magnitude. As such, these results mirror the conclusions from the prior decomposition: the decision to operate and the effects of surgical care do not appear to contribute to racial disparities in EGS outcomes.
| Total | Base | Prevalence | Effect | Selection | |
|---|---|---|---|---|---|
| Adverse Event | -0.022 | -0.029 | 0.00019 | 0.006 | 0.00071 |
| [ -0.023 , -0.021 ] | [ -0.035 , -0.023 ] | [ 0 , 0.00037 ] | [ 0.002 , 0.01 ] | [ -0.003 , 0.004 ] | |
| Length of Stay | -0.009 | -0.007 | 0.001 | 0.013 | -0.016 |
| [ -0.025 , 0.006 ] | [ -0.086 , 0.071 ] | [ -0.001 , 0.003 ] | [ -0.039 , 0.066 ] | [ -0.0321 , 0.0001 ] |
-
Note: Numbers in brackets are 95% confidence intervals. Estimates in the Table are risk differences.
5 Conclusion
In the United States, racial disparities are widespread across a broad range of health outcomes. In this paper, we focus on disparities in outcomes for emergency general surgery patients. Analyzing a database of medical claims in three large US states, we find that in the unadjusted data, Black patients do not exhibit worse outcomes than white patients. However, when we adjusted for either age and sex alone or the full set of patient covariates, we find clear evidence of race-related disparities. Additionally adjusting for admitting hospital largely eliminates disparities in adverse events, though Black patients still have longer post-treatment hospital stays than re-weighted white patients. Using a decomposition analysis, we find that the disparity does not appear to be driven by differences in the decision to operate on Black or white EGS patients.
Consistent with prior studies, we find that patient characteristics explain a large portion of the observed disparities in surgical outcomes between Black and white patients (Silber et al., 2015; Tsai et al., 2014). Further, our results suggest that variation across hospitals, including quality of care, is an independent, important driver of disparities in these health outcomes. The finding that hospital quality is a driver of surgical disparities is not new, but further emphasizes that interventions targeted at hospital quality may be critical for further reducing racial disparities in surgical outcomes, and points to larger systemic factors that may be driving disparities. Historically few interventions have addressed variation in hospital quality especially among “minority-serving” institutions (Khera et al., 2015; Tsai et al., 2014; Dimick et al., 2013). Several barriers to addressing the role of hospitals in surgical disparities exist including structural issues related to insurance coverage and resource allocation.
Methodologically, we offer a unifying framework for linear estimators that adjust for observable differences between groups with the goal of understanding outcome disparities through decompositions (Strittmatter and Wunsch, 2021; Jackson et al., 2022; Yu and Elwert, 2023). In our application, we find that two special cases of linear estimators, regression and matching, perform poorly: regression allows for extreme extrapolation for many hospitals and matching fails to adequately balance patient-level characteristics. The restricted weighting approach, by contrast, gives researchers direct control over the bias-variance trade-off and over extrapolation.
There are several avenues for future developments. First, how best to balance high-dimensional features remains an open question. Here we use sample splitting and random forests to learn a basis to balance. While reasonable in this setting, several recent papers offer flexible alternatives, including via other machine learning methods (Wang et al., 2021). Second, we have focused exclusively on linear weighting estimators. A natural extension is to instead consider so-called augmented weighting estimators, which combine outcome modeling and weighting (see Ben-Michael et al., 2021). These approaches can adjust for imbalances that remain after weighting or matching alone, albeit at the cost of additional modeling assumptions and possible extrapolation. Finally, our analysis is in the spirit of Kitagawa-Oaxaca-Blinder decompositions and other adjustment methods that adjust for observable baseline differences between groups. Even setting aside fundamental questions about defining racial disparities (Jackson et al., 2022), these estimated disparities might reflect important differences in which patients are admitted to different hospitals (Hull, 2018). While patients will have less choice in admitting hospital for emergency general surgery than for non-emergency general surgery, properly accounting for (observed or unobserved) differences in what types of patients are admitted to different hospitals is an important next step in further understanding health disparities.
References
- Alavi et al. (2012) Alavi, K., J. Cervera-Servin, P. R. Sturrock, W. Sweeney, and J. A. Maykel (2012). Racial differences in short-term surgical outcomes following surgery for diverticulitis. Journal of Gastrointestinal Surgery 16(3), 613–621.
- Angus et al. (2001) Angus, D. C., W. T. Linde-Zwirble, J. Lidicker, G. Clermont, J. Carcillo, and M. R. Pinsky (2001). Epidemiology of severe sepsis in the united states: analysis of incidence, outcome, and associated costs of care. Critical care medicine 29(7), 1303–1310.
- Barsky et al. (2002) Barsky, R., J. Bound, K. K. Charles, and J. P. Lupton (2002). Accounting for the black-white wealth gap: A nonparametric approach. Journal of the American Statistical Association 97(459), 663–673.
- Basu et al. (2015) Basu, S., A. Hong, and A. Siddiqi (2015). Using decomposition analysis to identify modifiable racial disparities in the distribution of blood pressure in the united states. American journal of epidemiology 182(4), 345–353.
- Ben-Michael et al. (2021) Ben-Michael, E., A. Feller, and E. Hartman (2021). Multilevel calibration weighting for survey data.
- Ben-Michael et al. (2021) Ben-Michael, E., A. Feller, D. A. Hirshberg, and J. R. Zubizarreta (2021). The Balancing Act in Causal Inference.
- Ben-Michael et al. (2021a) Ben-Michael, E., A. Feller, and J. Rothstein (2021a). The Augmented Synthetic Control Method. Journal of the American Statistical Association 116(536), 1789–1803.
- Ben-Michael et al. (2021b) Ben-Michael, E., A. Feller, and J. Rothstein (2021b). Varying impacts of letters of recommendation on college admissions: Approximate balancing weights for subgroup effects in observational studies.
- Blinder (1973) Blinder, A. S. (1973). Wage Discrimination : Reduced Form and Structural Estimates. The Journal of Human Resources 8(4), 436–455.
- Boyd et al. (2010) Boyd, S., N. Parikh, E. Chu, B. Peleato, and J. Eckstein (2010). Distributed optimization and statistical learning via the alternating direction method of multipliers. Foundations and Trends in Machine Learning 3(1), 1–122.
- Chattopadhyay and Zubizarreta (2021) Chattopadhyay, A. and J. R. Zubizarreta (2021). On the implied weights of linear regression for causal inference.
- Chernozhukov et al. (2013) Chernozhukov, V., I. Fernández-Val, and B. Melly (2013). Inference on counterfactual distributions. Econometrica 81(6), 2205–2268.
- Cinelli et al. (2020) Cinelli, C., A. Forney, and J. Pearl (2020). A crash course in good and bad controls. Sociological Methods & Research, 00491241221099552.
- Cooper et al. (1996) Cooper, G. S., Z. Yuan, C. S. Landefeld, and A. A. Rimm (1996). Surgery for colorectal cancer: Race-related differences in rates and survival among medicare beneficiaries. American Journal of Public Health 86(4), 582–586.
- Dimick et al. (2013) Dimick, J., J. Ruhter, M. V. Sarrazin, and J. D. Birkmeyer (2013). Black patients more likely than whites to undergo surgery at low-quality hospitals in segregated regions. Health Affairs 32(6), 1046–1053.
- DiNardo et al. (1995) DiNardo, J., N. Fortin, and T. Lemieux (1995). Labor market institutions and the distribution of wages, 1973-1992: A semiparametric approach. Econometrica 64(5), 1001–1044.
- Elixhauser et al. (1998) Elixhauser, A., C. Steiner, D. R. Harris, and R. M. Coffey (1998). Comorbidity measures for use with administrative data. Medical care 36(1), 8–27.
- Esnaola et al. (2008) Esnaola, N. F., B. L. Hall, P. W. Hosokawa, J. Z. Ayanian, W. G. Henderson, S. F. Khuri, M. J. Zinner, and S. O. Rogers Jr (2008). Race and surgical outcomes: it is not all black and white. Annals of surgery 248(4), 647–655.
- Firpo et al. (2018) Firpo, S. P., N. M. Fortin, and T. Lemieux (2018). Decomposing wage distributions using recentered influence function regressions. Econometrics 6(2), 28.
- Fortin et al. (2011) Fortin, N., T. Lemieux, and S. Firpo (2011). Decomposition methods in economics. In Handbook of labor economics, Volume 4, pp. 1–102. Elsevier.
- Gale et al. (2014) Gale, S. C., S. Shafi, V. Y. Dombrovskiy, D. Arumugam, and J. S. Crystal (2014). The public health burden of emergency general surgery in the united states: a 10-year analysis of the nationwide inpatient sample—2001 to 2010. Journal of Trauma and Acute Care Surgery 77(2), 202–208.
- Hirshberg and Wager (2021) Hirshberg, D. and S. Wager (2021). Augmented Minimax Linear Estimation. The Annals of Statistics 49, 3206–3227.
- Hirshberg et al. (2019) Hirshberg, D. A., A. Maleki, and J. Zubizarreta (2019). Minimax linear estimation of the retargeted mean. arXiv preprint arXiv:1901.10296.
- Hull (2018) Hull, P. (2018). Estimating hospital quality with quasi-experimental data. SSRN 3118358.
- Inglis et al. (2022) Inglis, A., A. Parnell, and C. B. Hurley (2022). Visualizing variable importance and variable interaction effects in machine learning models. Journal of Computational and Graphical Statistics, 1–13.
- Jackson (2021) Jackson, J. W. (2021). Meaningful causal decompositions in health equity research: definition, identification, and estimation through a weighting framework. Epidemiology 32(2), 282–290.
- Jackson et al. (2022) Jackson, J. W., Y.-J. Hsu, R. C. Greer, R. T. Boonyasai, and C. J. Howe (2022). The observational target trial: A conceptual model for measuring disparity. arXiv preprint arXiv:2207.00530.
- Jackson and VanderWeele (2018) Jackson, J. W. and T. J. VanderWeele (2018). Decomposition analysis to identify intervention targets for reducing disparities. Epidemiology 29(6), 825.
- Khera et al. (2015) Khera, R., M. Vaughan-Sarrazin, G. E. Rosenthal, and S. Girotra (2015). Racial disparities in outcomes after cardiac surgery: the role of hospital quality. Current cardiology reports 17(5), 1–8.
- Kim and Schneeweiss (2014) Kim, D. H. and S. Schneeweiss (2014). Measuring frailty using claims data for pharmacoepidemiologic studies of mortality in older adults: evidence and recommendations. Pharmacoepidemiology and drug safety 23(9), 891–901.
- Kim et al. (2022) Kim, K., B. A. Niknam, and J. R. Zubizarreta (2022). Small weights for big data: Computational aspects and empirical performance.
- King and Zeng (2006) King, G. and L. Zeng (2006). The dangers of extreme counterfactuals. Political Analysis 14(2), 131–159.
- Kitagawa (1955) Kitagawa, E. M. (1955). Components of a difference between two rates. Journal of the american statistical association 50(272), 1168–1194.
- Kline (2011) Kline, P. (2011). Oaxaca-Blinder as a reweighting estimator. American Economic Review: Papers & Proceedings 101(3), 532–537.
- Lundberg (2021) Lundberg, I. (2021). The gap-closing estimand: A causal approach to study interventions that close disparities across social categories. Sociological Methods & Research, 00491241211055769.
- Machado and Mata (2005) Machado, J. A. and J. Mata (2005). Counterfactual decomposition of changes in wage distributions using quantile regression. Journal of applied Econometrics 20(4), 445–465.
- Melly (2005) Melly, B. (2005). Decomposition of differences in distribution using quantile regression. Labour economics 12(4), 577–590.
- Oaxaca (1973) Oaxaca, R. (1973). Male-Female Wage Differentials in Urban Labor Markets. International Economic Review 14(3), 693.
- Pimentel et al. (2015) Pimentel, S. D., R. R. Kelz, J. H. Silber, and P. R. Rosenbaum (2015). Large, sparse optimal matching with refined covariate balance in an observational study of the health outcomes produced by new surgeons. Journal of the American Statistical Association 110(510), 515–527.
- Pirracchio et al. (2016) Pirracchio, R., M. Carone, M. R. Rigon, E. Caruana, A. Mebazaa, and S. Chevret (2016). Propensity score estimators for the average treatment effect and the average treatment effect on the treated may yield very different estimates. Statistical methods in medical research 25(5), 1938–1954.
- Ramsey et al. (2019) Ramsey, D. S., D. M. Forsyth, E. Wright, M. McKay, and I. Westbrooke (2019). Using propensity scores for causal inference in ecology: Options, considerations, and a case study. Methods in Ecology and Evolution 10(3), 320–331.
- Reifeis and Hudgens (2022) Reifeis, S. A. and M. G. Hudgens (2022). On variance of the treatment effect in the treated when estimated by inverse probability weighting. American Journal of Epidemiology.
- Rosenbaum and Silber (2013) Rosenbaum, P. R. and J. H. Silber (2013). Using the exterior match to compare two entwined matched control groups. The American Statistician 67(2), 67–75.
- Sen (2014) Sen, B. (2014). Using the oaxaca–blinder decomposition as an empirical tool to analyze racial disparities in obesity. Obesity 22(7), 1750–1755.
- Shafi et al. (2013) Shafi, S., M. B. Aboutanos, S. Agarwal Jr, C. V. Brown, M. Crandall, D. V. Feliciano, O. Guillamondegui, A. Haider, K. Inaba, T. M. Osler, et al. (2013). Emergency general surgery: definition and estimated burden of disease. Journal of Trauma and Acute Care Surgery 74(4), 1092–1097.
- Silber et al. (2013) Silber, J. H., P. R. Rosenbaum, A. S. Clark, B. J. Giantonio, R. N. Ross, Y. Teng, M. Wang, B. A. Niknam, J. M. Ludwig, W. Wang, et al. (2013). Characteristics associated with differences in survival among black and white women with breast cancer. Jama 310(4), 389–397.
- Silber et al. (2015) Silber, J. H., P. R. Rosenbaum, R. R. Kelz, D. J. Gaskin, J. M. Ludwig, R. N. Ross, B. A. Niknam, A. Hill, M. Wang, O. Even-Shoshan, et al. (2015). Examining causes of racial disparities in general surgical mortality: Hospital quality versus patient risk. Medical care 53(7), 619.
- Silber et al. (2014) Silber, J. H., P. R. Rosenbaum, R. N. Ross, B. A. Niknam, J. M. Ludwig, W. Wang, A. S. Clark, K. R. Fox, M. Wang, O. Even-Shoshan, et al. (2014). Racial disparities in colon cancer survival: a matched cohort study. Annals of internal medicine 161(12), 845–854.
- Słoczyński (2020) Słoczyński, T. (2020). Average gaps and oaxaca–blinder decompositions: A cautionary tale about regression estimates of racial differences in labor market outcomes. ILR Review 73(3), 705–729.
- Stellato et al. (2020) Stellato, B., G. Banjac, P. Goulart, A. Bemporad, and S. Boyd (2020). OSQP: An operator splitting solver for quadratic programs. Mathematical Programming Computation 12(4), 637–672.
- Strittmatter and Wunsch (2021) Strittmatter, A. and C. Wunsch (2021). The gender pay gap revisited with big data: Do methodological choices matter? arXiv preprint arXiv:2102.09207.
- Tsai et al. (2014) Tsai, T. C., E. J. Orav, and K. E. Joynt (2014). Disparities in surgical 30-day readmission rates for medicare beneficiaries by race and site of care. Annals of surgery 259(6), 1086.
- Wang et al. (2021) Wang, T., M. Morucci, M. U. Awan, Y. Liu, S. Roy, C. Rudin, and A. Volfovsky (2021). Flame: A fast large-scale almost matching exactly approach to causal inference. Journal of Machine Learning Research 22(31), 1–41.
- Wright et al. (2016) Wright, M. N., A. Ziegler, and I. R. König (2016). Do little interactions get lost in dark random forests? BMC bioinformatics 17(1), 1–10.
- Yiu and Su (2018) Yiu, S. and L. Su (2018). Covariate association eliminating weights: A unified weighting framework for causal effect estimation. Biometrika 105(3), 709–722.
- Yu and Elwert (2023) Yu, A. and F. Elwert (2023). Causal Decomposition of Group Disparities.
- Zubizarreta (2015) Zubizarreta, J. R. (2015). Stable weights that balance covariates for estimation with incomplete outcome data. Journal of the American Statistical Association 110(511), 910–922.