3pt
Automatic Readability Assessment of German Sentences with Transformer Ensembles
Abstract
Reliable methods for automatic readability assessment have the potential to impact a variety of fields, ranging from machine translation to self-informed learning. Recently, large language models for the German language (such as GBERT and GPT-2-Wechsel) have become available, allowing to develop Deep Learning based approaches that promise to further improve automatic readability assessment. In this contribution, we studied the ability of ensembles of fine-tuned GBERT and GPT-2-Wechsel models to reliably predict the readability of German sentences. We combined these models with linguistic features and investigated the dependence of prediction performance on ensemble size and composition. Mixed ensembles of GBERT and GPT-2-Wechsel performed better than ensembles of the same size consisting of only GBERT or GPT-2-Wechsel models. Our models were evaluated in the GermEval 2022 Shared Task on Text Complexity Assessment on data of German sentences. On out-of-sample data, our best ensemble achieved a root mean squared error of .
17cm[-0.1,0](0cm,27.4cm)
This work was published as part of the conference proceedings of the GermEval 2022
Workshop on Text Complexity Assessment of German Text, available online at https://aclanthology.org/volumes/2022.germeval-1/.
Please cite as: Patrick Gustav Blaneck, Tobias Bornheim, Niklas Grieger, and Stephan Bialonski. Automatic Readability Assessment of German Sentences with Transformer Ensembles. In Proc. GermEval 2022 Workshop on Text Complexity Assessment of German Text: 18th KONVENS 2022, pages 57–62, Online (2022).
1 Introduction
Automatic Readability Assessment (ARA) is a well-known challenge in natural language processing (NLP) research Martinc et al. (2021); Vajjala (2021); Collins-Thompson (2014). Systems for reliable readability assessment have the potential to support readers with learning disabilities, inform self-directed learning, or help control the reading level of automatically generated text translations Vajjala (2021).
The development of methods for text readability assessment may be described in three phases. (i) Traditional text readability formulas were based on statistical measures of lexical and syntactic features (such as word difficulty and length). Techniques from NLP further improved upon traditional formulas by incorporating high-level textual features such as semantic and discursive text characteristics Martinc et al. (2021). (ii) In the early 21st century, engineered linguistic features were used to train shallow classifiers and regressors from machine learning (such as support vector machines and decision trees) which further improved prediction accuracy Collins-Thompson (2014). (iii) The latest phase has been characterized by the advent of large language models (LLMs) developed in the Deep Learning community. Such neural networks learn features (vector representations of text) automatically from large text corpora during self-supervised pretraining. Successful network architectures such as BERT Devlin et al. (2019); Rogers et al. (2020) or GPT Radford and Narasimhan (2018); Radford et al. (2019); Brown et al. (2020) closely follow the influential transformer model Vaswani et al. (2017) that allows for efficient modeling of long-range correlations in texts. By combining representations derived from BERT with linguistic features, recent studies observed increased accuracy in assessing the readability of English texts Lee et al. (2021); Imperial (2021).
Training large language models requires large text corpora, a prerequisite that is difficult to meet in languages with fewer resources (compared to English) such as German. Thus, most approaches to assess the readability of German texts have been based on linguistic features and traditional models from statistical learning such as polynomial regression, support vector machines, or random forests Hancke et al. (2012); Weiß and Meurers (2018); Naderi et al. (2019b); Weiß et al. (2021). Only recently, large language models have become available for German, most notably GBERT Chan et al. (2020), which is based on BERT, and GPT-2-Wechsel Minixhofer et al. (2021) which was derived from the English GPT-2 model Radford et al. (2019). It is largely unknown to which extent these German language models can improve the automatic readability assessment of German texts.
In this contribution, we investigate the ability of ensembles of GBERT and GPT-2-Wechsel models to assess the readability of German sentences. We combine these models with traditional linguistic features and evaluate our approach on a recently published dataset of German sentences Naderi et al. (2019a). Inspired by previous work on ensembling large language models Risch and Krestel (2020); Bornheim et al. (2021), we studied the dependence of model accuracy on the number of ensemble members and ensemble composition. Finally, we describe the models that were evaluated in the GermEval 2022 Shared Task on Text Complexity Assessment Mohtaj et al. (2022). The implementation details of our experiments (Team “AComplexity”) are available online111https://github.com/dslaborg/tcc2022.
2 Data and tasks
The dataset consisted of 1000 labeled sentences Naderi et al. (2019a) and was provided by the organizers of the GermEval 2022 Shared Task on Text Complexity Assessment Mohtaj et al. (2022). The sentences were drawn from 23 Wikipedia articles. 250 of these sentences were manually simplified by native German speakers Naderi et al. (2019a).
The scores (labels) were obtained via an online survey system. Participants were asked to rate the complexity, understandability, and lexical difficulty of the sentences on a 7-point Likert scale. On this scale, 1 denotes the lowest and 7 the highest possible value Naderi et al. (2019a). In total, 10650 valid sentence ratings were collected, distributed among the 1000 sentences.
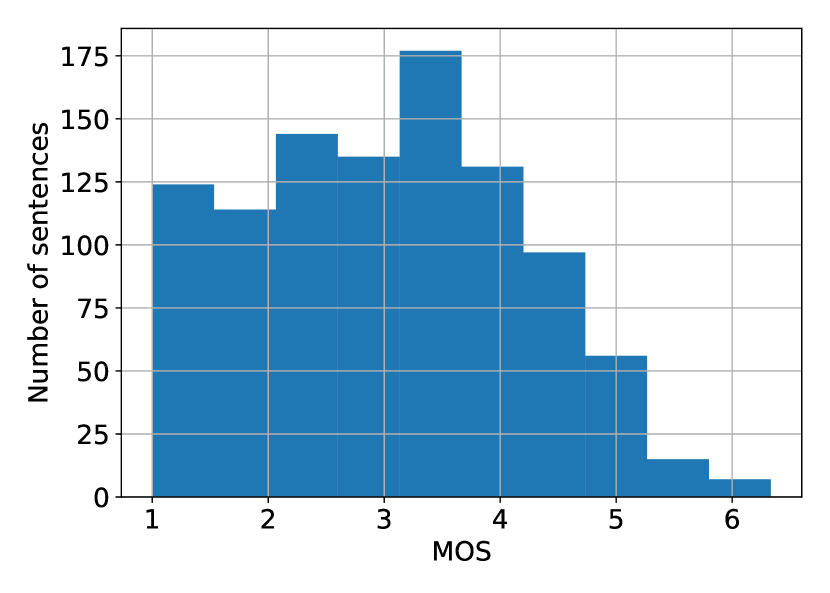
Following a data screening procedure, 5 to 18 ratings per sentence were deemed valid and then used to calculate the arithmetic mean, called the Mean Opinion Score (MOS), of each metric Naderi et al. (2019a).
Für die Union resultiert daraus sowohl ein Akzeptanzproblem bei den EU-Bürgern, denen “Brüssel” immer undurchsichtiger erscheint, als auch die mit dem Mitgliederwachstum verbundene Schwierigkeit, im bestehenden Institutionengefüge die Arbeits- und Handlungsfähigkeit der einzelnen Organe zu gewährleisten. (MOS: 6.33)
The shared task was to predict the MOS of the text complexity of German sentences. Since the MOS was defined as a decimal value (see figure 2), we approached this task as a regression problem. The distribution of complexity scores (see figure 1) suggests that complex sentences are much less common within the dataset than simpler ones. Following previous work, we considered text complexity as a proxy of text readability Wray and Janan (2013).
3 Methods
3.1 Preprocessing and data splits
Preprocessing. All datasets (training, validation, and test data) were preprocessed in the same way. First, we cleaned up all sentences by removing the leading and trailing quotation marks that were added by the CSV format to mask sentences containing comma separators. In the next step, all sentences were tokenized with model-specific tokenizers and padded to a uniform length of 128 tokens.
Data splits. During the model exploration phase, models were evaluated with a 5-fold cross validation scheme (each of the five folds contained 20% of the randomly shuffled training data). Additionally, we randomly selected 10% of the data in the training folds (i.e., 8% of the whole training data) as an early stopping set (see section 3.4). Thus, all models in the model exploration phase were trained on 72% of the training data.
To optimize model fitting, the final models that were submitted to the GermEval 2022 Shared Task on Text Complexity Assessment were retrained on all available training data, aside from a small dataset that was used for early stopping. The early stopping set consisted of 7.5% of the training data and consequently, all final models were trained on 92.5% of the training data.
3.2 Readability Features
We incorporated various traditional features in the training of our models that are commonly used in text readability and complexity assessment tasks. The features were generated using two publicly available libraries van Cranenburgh (2019); Proisl (2022) and include simple sentence-based measures such as sentence length and punctuation as well as more complex measures such as word rarity. Furthermore, we included some customized features based on the number of words in a sentence that exceed a given amount of characters. To increase the amount and variety of the available features, we translated all sentences to English and calculated the features for the original German sentences as well as the English translations. In total, 154 features were created for each sentence.
3.3 Models
We studied two German language models. The GBERT model Chan et al. (2020) is based on the BERT architecture Devlin et al. (2019). We used model weights of the pretrained gbert-large222https://huggingface.co/deepset/gbert-large variant, which includes a tokenizer with a vocabulary size of 31000 case-sensitive tokens, has approximately 336 million parameters and a hidden state size of 1024. Each tokenized sentence was prepended with a classification token that was used for the next sentence prediction task during pretraining Devlin et al. (2019).
The second model is a German GPT-2-Wechsel model Minixhofer et al. (2021) based on the GPT-2 architecture Radford et al. (2019). We used model weights of a pretrained gpt2-xl-wechsel-german333https://huggingface.co/malteos/gpt2-xl-wechsel-german variant that was derived from the GPT-2-XL444https://huggingface.co/gpt2-xl model Radford et al. (2019) using the WECHSEL method Minixhofer et al. (2021). The tokenizer has a vocabulary size of 50000 case-sensitive tokens, while the model has roughly 1.5 billion parameters and a hidden state size of 1600. Since GPT-like models are usually not used for regression tasks, we needed to adjust the tokenizer as follows. First, we introduced a padding token that was used to pad all sentences to a uniform length of 128 tokens (see section 3.1). Second, we put a beginning of sequence token in front and added an end of sequence token to the end of every tokenized sentence.
For each transformer model, we employed two different multi-layer perceptron models (MLP) as regression heads. The first MLP was used to finetune the transformer models on the given training data and did not use the manually created readability features (see section 3.2). The second MLP was used after finetuning to incorporate the readability features and consisted of a fully connected layer, followed by ReLu activations and an output layer with one neuron and a linear activation for regression. The input vector for the second MLP consisted of the output of the last hidden state of the respective transformer model and 154 readability features calculated for each sentence.
3.4 Training
Evaluation score. To assess the prediction performance of each model, we calculated the root mean squared error (RMSE),
where denotes the true readability score, the predicted readability scores, and the number of samples in the dataset. During model exploration, the RMSE was determined for each validation fold of the 5-fold cross validation scheme. We considered the average of these RMSE values as an indicator of model performance.
Training scheme. The training was carried out in two phases. In the first phase, we added a regression head to each model, used an AdamW optimizer Loshchilov and Hutter (2019) with a batch size of 16 and a learning rate of with a linear warmup on the first 30% of the training steps from to . About every half training epoch (every 23 gradient updates during model exploration or every 28 gradient updates when training the submitted models), the models were evaluated on the early stopping set. If the training lasted for 100 epochs or the RMSE did not decrease for five consecutive evaluations, the training was stopped and the model with the lowest RMSE on the early stopping set was returned. This stopping mechanism was not used during the first 300 gradient updates of the training to prevent underfitting.
In the second phase of the training, the regression heads were discarded and the output of the last hidden state for each sentence of the dataset was extracted as follows. For GBERT, we used the output of the classification token. For GPT-2-Wechsel, we extracted the output of the end of sequence token. To create a feature vector for each sentence, we combined the output of the respective transformer model with the readability features calculated for each sentence. We trained a multi-layer perceptron (MLP) with two layers (see 3.3) with the RMSprop optimizer, a batch size of 16, and a constant learning rate of . The MLPs were evaluated on the early stopping set after each training epoch. After 5000 epochs or if the RMSE did not decrease for 100 consecutive epochs, the training was stopped and the model with the lowest RMSE on the early stopping set was returned.
During inference, to predict a score for a given sentence, a feature vector was created by combining readability features with the output of the finetuned transformer model. The feature vector served as an input to the trained MLP which calculated the readability score.
Loss functions. We used the mean squared error loss for training all transformer models and MLPs.
3.5 Ensembling
To counteract the effects of overfitting that often occur when training large models on small datasets, we combined our trained models in ensembles Risch and Krestel (2020); Bornheim et al. (2021). Ensemble members differed in the initial model weights of the regression heads and the randomly selected early stopping set. We determined the predictions of an ensemble by averaging the predicted scores of the ensemble members.
3.6 Postprocessing
When evaluating our ensembles on the provided test set during the final phase of the competition, we found that some trained models predicted readability scores smaller than 1.0 for a few sentences in the test set. Since the 7-point Likert scale used by the human annotators to score text readability started at a value of 1.0 (see section 2), we deemed all predicted values smaller than 1.0 as invalid and removed them in the ensembling process. Thus, the predictions of an ensemble were created by averaging only the predicted scores larger than 1.0. We hypothesize that the scores smaller than 1.0 on the test data were caused by a distribution shift in the generated readability features.
4 Results
Model exploration. During model exploration we investigated the performance (measured by the average RMSE) of ensembles with different ensemble sizes and compositions. The ensembles consisted of 1 to 60 models in three different compositions: (i) GBERT models only, (ii) GPT-2-Wechsel models only, (iii) a combination of GBERT and GPT-2-Wechsel models. In (iii), we combined both model types equally, so that an ensemble of 60 models consisted of 30 GBERT and 30 GPT-2-Wechsel models.
To investigate the dependence of prediction performance on ensemble size, we applied a bootstrapping scheme following Risch and Krestel (2020); Bornheim et al. (2021). In total, we trained 100 models each of GBERT and GPT-2-Wechsel on each cross-validation split. Given a specific ensemble size, we then randomly sampled with replacement 1000 ensembles from the set of trained models and measured the RMSE of each ensemble on each validation fold. The attained RMSE scores were then averaged over the 5 validation folds, so that we obtained 1000 averaged RMSE scores for each ensemble size.
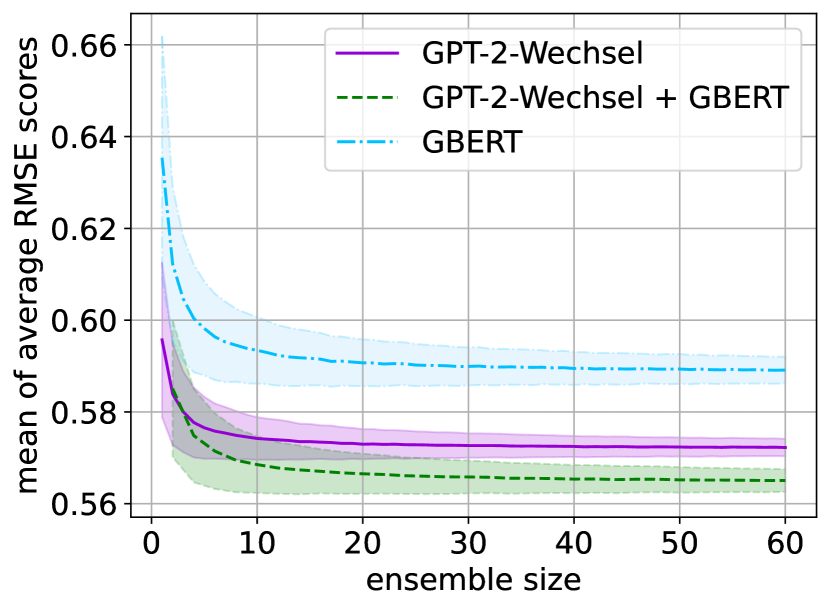
Figure 3 shows the mean and standard deviation of the averaged RMSE scores for different ensemble sizes and compositions. Each ensemble composition benefited from increasing ensemble size, as the mean RMSE decreased considerably up to an ensemble size of 20 models, beyond which the RMSE decreased only slowly. Increasing the ensemble size also affected the stability of the ensembles’ predictions, as can be observed from the decreasing standard deviation of all three ensemble compositions. Our findings are consistent with previous work Risch and Krestel (2020); Bornheim et al. (2021) which reported improvements in predictive performance when increasing ensemble sizes.
Furthermore, figure 3 shows large differences in the performance of the three ensemble compositions. The ensemble that consisted of only GBERT models performed the worst with a mean RMSE of 0.589 at ensemble size 60. Using GPT-2-Wechsel models instead of GBERT models reduced the mean RMSE to 0.572, and combining both model types in a mixed ensemble of 30 GPT-2-Wechsel and 30 GBERT models further improved the scores to 0.565.
Submitted models. Based on our results in the model exploration phase, we decided to submit two different ensembles in the final phase of the competition: (i) an ensemble of 340 GPT-2-Wechsel models and (ii) an ensemble of 100 GPT-2-Wechsel and 100 GBERT models. We chose not to submit an ensemble of only GBERT models due to the subpar performance observed during model exploration. All models were fine-tuned using all available training data, aside from a small dataset (7.5% of the training data) used for early stopping (see section 3).
On the test data of the shared task, ensembles (i) and (ii) achieved RMSE values of (mapped RMSE: 555A linear mapping function was used by the competition organizers; see section 7.3 of the recommendation ITU-T P.1401.) and (mapped RMSE: 55footnotemark: 5), respectively Mohtaj et al. (2022). Ensemble (ii) ranked 2nd in the competition.
5 Conclusion
We studied the ability of ensembles of fine-tuned German language models to reliably predict the readability of German sentences. All proposed models also used traditional linguistic features that slightly increased prediction performance (data not shown), consistent with previous reports on text readability assessment of English texts Imperial (2021); Lee et al. (2021). We observed mixed ensembles of GBERT and GPT-2-Wechsel to better predict readability scores than ensembles of the same size consisting of only GBERT or GPT-2-Wechsel models. Furthermore, prediction accuracy as quantified by the root mean squared error decreased with increasing ensemble size, which resembled findings for hate speech classification reported previously Risch and Krestel (2020); Bornheim et al. (2021).
References
- Bornheim et al. (2021) Tobias Bornheim, Niklas Grieger, and Stephan Bialonski. 2021. FHAC at GermEval 2021: Identifying german toxic, engaging, and fact-claiming comments with ensemble learning. CoRR, abs/2109.03094.
- Brown et al. (2020) Tom B. Brown, Benjamin Mann, Nick Ryder, Melanie Subbiah, Jared Kaplan, Prafulla Dhariwal, Arvind Neelakantan, Pranav Shyam, Girish Sastry, Amanda Askell, Sandhini Agarwal, Ariel Herbert-Voss, Gretchen Krueger, Tom Henighan, Rewon Child, Aditya Ramesh, Daniel M. Ziegler, Jeffrey Wu, Clemens Winter, Christopher Hesse, Mark Chen, Eric Sigler, Mateusz Litwin, Scott Gray, Benjamin Chess, Jack Clark, Christopher Berner, Sam McCandlish, Alec Radford, Ilya Sutskever, and Dario Amodei. 2020. Language models are few-shot learners. In Advances in Neural Information Processing Systems 33: Annu. Conf. on Neural Information Processing Systems 2020, NeurIPS 2020, Virtual.
- Chan et al. (2020) Branden Chan, Stefan Schweter, and Timo Möller. 2020. German’s next language model. In Proc. 28th Int. Conf. on Computational Linguistics, COLING 2020, pages 6788–6796, Barcelona, Spain (Online). International Committee on Computational Linguistics.
- Collins-Thompson (2014) Kevyn Collins-Thompson. 2014. Computational assessment of text readability: A survey of current and future research. Int. J. Appl. Linguistics, 165(2):97–135.
- van Cranenburgh (2019) Andreas van Cranenburgh. 2019. Readability. https://github.com/andreasvc/readability/releases/tag/v0.3.1.
- Devlin et al. (2019) Jacob Devlin, Ming-Wei Chang, Kenton Lee, and Kristina Toutanova. 2019. BERT: Pre-training of deep bidirectional transformers for language understanding. In Proc. 2019 Conf. North American Chapter of the Association for Computational Linguistics: Human Language Technologies, NAACL-HLT 2019, volume 1, pages 4171–4186, Minneapolis, MN, USA. Association for Computational Linguistics.
- Hancke et al. (2012) Julia Hancke, Sowmya Vajjala, and Detmar Meurers. 2012. Readability classification for German using lexical, syntactic, and morphological features. In COLING 2012, 24th Int. Conf. on Computational Linguistics, Proc. Conf.: Technical Papers, pages 1063–1080, Mumbai, India. Indian Institute of Technology Bombay.
- Imperial (2021) Joseph Marvin Imperial. 2021. BERT embeddings for automatic readability assessment. In Proceedings of the International Conference on Recent Advances in Natural Language Processing (RANLP 2021), Held Online, 1-3September, 2021, pages 611–618. INCOMA Ltd.
- Lee et al. (2021) Bruce W. Lee, Yoo Sung Jang, and Jason Hyung-Jong Lee. 2021. Pushing on text readability assessment: A transformer meets handcrafted linguistic features. In Proc. 2021 Conf. on Empirical Methods in Natural Language Processing, EMNLP 2021, pages 10669–10686, Punta Cana, Dominican Republic (Virtual). Association for Computational Linguistics.
- Loshchilov and Hutter (2019) Ilya Loshchilov and Frank Hutter. 2019. Decoupled weight decay regularization. In 7th Int. Conf. on Learning Representations, ICLR 2019, New Orleans, LA, USA.
- Martinc et al. (2021) Matej Martinc, Senja Pollak, and Marko Robnik-Šikonja. 2021. Supervised and unsupervised neural approaches to text readability. Comput. Linguist., 47(1):141–179.
- Minixhofer et al. (2021) Benjamin Minixhofer, Fabian Paischer, and Navid Rekabsaz. 2021. WECHSEL: Effective initialization of subword embeddings for cross-lingual transfer of monolingual language models. CoRR, abs/2112.06598.
- Mohtaj et al. (2022) Salar Mohtaj, Babak Naderi, and Sebastian Möller. 2022. Overview of the GermEval 2022 shared task on text complexity assessment of German text. In Proceedings of the GermEval 2022 Shared Task on Text Complexity Assessment of German Text, Potsdam, Germany. Association for Computational Linguistics.
- Naderi et al. (2019a) Babak Naderi, Salar Mohtaj, Kaspar Ensikat, and Sebastian Möller. 2019a. Subjective assessment of text complexity: A dataset for German language. CoRR, abs/1904.07733.
- Naderi et al. (2019b) Babak Naderi, Salar Mohtaj, Karan Karan, and Sebastian Möller. 2019b. Automated text readability assessment for German language: A quality of experience approach. In 11th Int. Conf. on Quality of Multimedia Experience QoMEX 2019, pages 1–3, Berlin, Germany. IEEE.
- Proisl (2022) Thomas Proisl. 2022. Linguistic and stylistic complexity. https://github.com/tsproisl/textcomplexity/releases/tag/v0.11.0.
- Radford and Narasimhan (2018) Alec Radford and Karthik Narasimhan. 2018. Improving language understanding by generative pre-training.
- Radford et al. (2019) Alec Radford, Jeff Wu, Rewon Child, David Luan, Dario Amodei, and Ilya Sutskever. 2019. Language models are unsupervised multitask learners.
- Risch and Krestel (2020) Julian Risch and Ralf Krestel. 2020. Bagging BERT models for robust aggression identification. In Proc. 2nd Workshop on Trolling, Aggression and Cyberbullying, TRAC@LREC 2020, pages 55–61, Marseille, France. European Language Resources Association (ELRA).
- Rogers et al. (2020) Anna Rogers, Olga Kovaleva, and Anna Rumshisky. 2020. A primer in BERTology: What we know about how BERT works. Trans. Assoc. Comput. Linguistics, 8:842–866.
- Vajjala (2021) Sowmya Vajjala. 2021. Trends, limitations and open challenges in automatic readability assessment research. CoRR, abs/2105.00973.
- Vaswani et al. (2017) Ashish Vaswani, Noam Shazeer, Niki Parmar, Jakob Uszkoreit, Llion Jones, Aidan N Gomez, Łukasz Kaiser, and Illia Polosukhin. 2017. Attention is all you need. In Annual Conf. Neural Information Processing Systems 2017, pages 5998–6008, Long Beach, CA, USA.
- Weiß et al. (2021) Zarah Weiß, Xiaobin Chen, and Detmar Meurers. 2021. Using broad linguistic complexity modeling for cross-lingual readability assessment. In Proc. 10th Workshop on Natural Language Processing for Computer Assisted Language Learning (NLP4CALL 2021), Linköping Electronic Conference Proceedings 177, pages 38–54.
- Weiß and Meurers (2018) Zarah Weiß and Detmar Meurers. 2018. Modeling the readability of german targeting adults and children: An empirically broad analysis and its cross-corpus validation. In Proc. 27th Int. Conf on Computational Linguistics, COLING 2018, pages 303–317, Santa Fe, New Mexico, USA. Association for Computational Linguistics.
- Wray and Janan (2013) David Wray and Dahlia Janan. 2013. Readability revisited? The implications of text complexity. The Curriculum Journal, 24:553 – 562.