Combining time-dependent density functional theory and the SCF approach for accurate core-electron spectra
Abstract
Spectroscopies that probe electronic excitations from core levels into unoccupied orbitals, such as X-ray absorption spectroscopy and electron energy loss spectroscopy, are widely used to gain insight into the electronic and chemical structure of materials. To support the interpretation of experimental spectra, we assess the performance of a first-principles approach that combines linear-response time-dependent density (TDDFT) functional theory with the self-consistent field (SCF) approach. In particular, we first use TDDFT to calculate the core-level spectrum and then shift the spectrum such that the lowest excitation energy from TDDFT agrees with that from SCF. We apply this method to several small molecules and find encouraging agreement between calculated and measured spectra.
I Introduction
X-ray absorption spectroscopy (XAS) and electron energy loss spectroscopy (EELS) are powerful and widely used characterization techniques that can provide information about the elements present in a sample as well as their chemical environments. For example, these techniques have been used for studying the electronic structure of functional materials doi:10.1063/1.4984072 ; Abbehausen2018a , probing the chemical bonding in systems such as water and ice Zhovtobriukh2019a ; Cavalleri2002a or analyzing the properties of pollution particles Datta2012a ; Chen2005b .
Both XAS and EELS measure energies of electronic excitations from core levels into unoccupied states. The onset of the spectrum corresponding to transitions from 1s core states into the lowest unoccupied orbitals is called the K-edge, while the L-edge indicates the onset of transitions from core states with a principal quantum number of . While it is usually straightforward to use XAS and EELS for elemental analysis of samples, the identification of specific chemical environments can be more challenging. In principle, assignment of chemical environments should be possible by comparing the measured spectrum to a set of experimental reference spectra. In practice, however, obtaining reliable reference spectra for a broad range of chemical environments is often not straightforward.
Alternatively, it is possible to obtain reference spectra from first principles calculations. For example, linear response time-dependent density functional theory (TDDFT) casida1995time has been widely used to predict core-excitation energies and intensities of XAS spectra besley2010time ; oosterbaan2018non ; besley2007time ; norman2018simulating . Core spectra from TDDFT often reproduce accurately the qualitative shape of measured spectra, but absolute core-level excitation energies are not quantitatively reproduced with errors of several electron volts wenzel2014calculating ; attar2017femtosecond ; bhattacherjee2018photoinduced (unless one employs short-ranged corrected functionals trained on core excitations besley2009time ). Often good quantitative agreement with experiment can be obtained by subtracting a constant energy shift from all excitation energies with the value of the shift being determined empirically by comparison to experiment debeer2010calibration .
Accurate absolute core-level excitation energies have recently been obtained using the Self-Consistent-Field (SCF) approach gilbert2008self ; kowalczyk2011assessment ; ziegler1977calculation in which the excitation energy is determined as a total energy difference. For transitions from core orbitals to the vacuum level which are probed in X-ray photoemission experiments, some of us recently demonstrated that highly accurate excitation energies (also known as core-level binding energies) can be obtained for molecules, solids and surfaces when the SCAN exchange-correlation functional is used in conjunction with an accurate treatment of relativistic effects Kahk2018a ; Kahk2019b . The SCF approach has also been used to calculate K-edge energies and energies of higher-lying excited states Ambroise2019a ; Zhekova2014a . For the latter, convergence difficulties associated with a variational collapse are often encountered Zhekova2014a . To overcome this problem, Hait and Head-Gordon used a square gradient minimization approach and obtained good agreement with experiment for a set of molecular compounds Hait2019b ; Hait2020a . However, the determination of spectra with this approach is less straightforward as a separate calculation is required for each excited state (in contrast to linear-response TDDFT which yields all excitation states in a single shot).
Other approaches for simulating core-electron spectra are based on Kohn-Sham eigenvalues Tait2016a ; morris2014optados , the coupled cluster approach Coriani2012 and the GW/BSE approach kehry2020 ; Gilmore2015a . Finally, machine learning techniques have been developed to predict spectra of complex materials, but these techniques also need accurate reference spectra to construct the training data set Zheng2018a ; Torrisi2020a ; Aarva2019a ; Rankine2020 .
A simple alternative approach to obtain core-level spectra is to combine SCF approach with linear response TDDFT leetmaa2006recent : instead of using experimental data to determine the energy shift that is applied to the TDDFT spectrum, one determines this shift from first principles using a SCF calculation of the lowest excited state. In this paper, we apply this approach to a set of molecules and assess its accuracy by comparing the calculated spectra to experimental results. For most systems, we find good quantitative agreement when appropriate exchange-correlation functionals are used. It is straightforward to apply this method to more complex systems, such as surfaces or clusters.
II Methods
The core-level spectra are obtained from
| (1) |
with denoting the light frequency, is the oscillator strength of the -th excited state and denotes a Lorentzian with a full width ad half maximum (FWHM) of . Also, is the energy of the -th excited state and obtained via
| (2) |
where are the excitation energies obtained from TDDFT and denotes a constant energy shift that is applied to all excitation energies. The shift is given by
| (3) |
with referring to the lowest excitation and denotes the corresponding excitation energy obtained from SCF.
For example, Table 1 shows the lowest neutral excitation energy of NH3 calculated with TDDFT using different exchange-correlation functionals (BHLYP, BLYP, PBE0 and Hartree-Fock (HF)). The calculated results differ from the experimental value at least by several eV. In contrast, the SCF results for all exchange-correlation functionals are in very good agreement with experiment.
| BHLYP (eV) | BLYP (eV) | PBE0 (eV) | HF (eV) | exp. (eV) | |
|---|---|---|---|---|---|
| TDDFT | 398.7 | 379.9 | 389.1 | 416.0 | 400.4 |
| SCF | 400.4 | 400.5 | 400.6 | 400.5 | 400.4 |
In the following we describe in more detail how the SCF calculations and the linear-response TDDFT calculations are carried out. For all molecules, calculations were carried out for the relaxed structure obtained using the SCAN functional with the default tight basis sets in the FHI-AIMS computer programme Blum2009 ; Ren2012 .
II.1 SCF approach
In the SCF approach, excitation energies are obtained as total energy differences between the relevant excited states and the ground state. For example, core-electron binding energies can be obtained by subtracting the ground state energy of the neutral system from the total energy of the system with a core hole which is obtained by minimizing the total energy under the constraint that a given core orbital remains unoccupied. Similarly, the lowest neutral core-electron excitation energy can be obtained by calculating the total energy of the system with a core hole and an extra electron in the lowest unoccupied orbital and subtracting this from the ground state energy (without a core hole).
The SCF calculations were performed using the FHI-AIMS computer programme Blum2009 ; Ren2012 , an all-electron code that uses localized basis sets defined on a grid of points in real space. We include relativistic effects using the scaled Zeroth Order Regular Approximation (ZORA) doi:10.1063/1.467943 ; FAAS1995632 ; doi:10.1063/1.479395 ; doi:10.1063/1.1323266 ; Blum2009 . All molecules in this study are closed-shell, but spin polarization is included in the calculations with a core hole. It has been pointed out that the SCF approach cannot properly model singlet excitations as those cannot be described by a single Slater determinant Hait2019b . Despite this shortcoming, we find below that the SCF approach produces accurate K-edge energies - likely because the coupling between the core hole and the excited electron is weak.
The basis sets used are those described in Refs. Kahk2018a ; Kahk2019b , which are modifications of the default tight FHI-AIMS basis sets with additional basis functions for the core states. These additional functions allow us to describe the contraction of the occupied 1s state in the presence of a core hole. The following five different exchange-correlations functionals were tested: SCAN, BHLYP, BLYP, PBE0, PBE, and B3LYP. We stress that the same computational parameters (such as basis set and exchange-correlation functional) must be used in both the ground state and the excited state calculation to obtain accurate excitation energies. Particular care must be taken when the molecules contain atoms in equivalent sites. In this case, additional strategies for localizing the core holes on a desired atom must be employed as explained in Kahk2019b .
II.2 Time-dependent density-functional theory
We also carry out linear-response TDDFT calculations of excited states involving transitions from core orbitals to unoccupied states using the NWChem programme package doi:10.1063/5.0004997 . For this, we ignore (or ”freeze”) transitions from all occupied states with energies exceeding that of the core orbital under consideration. We have verified that inclusion of these states only leads to very small changes in the excitation energies.
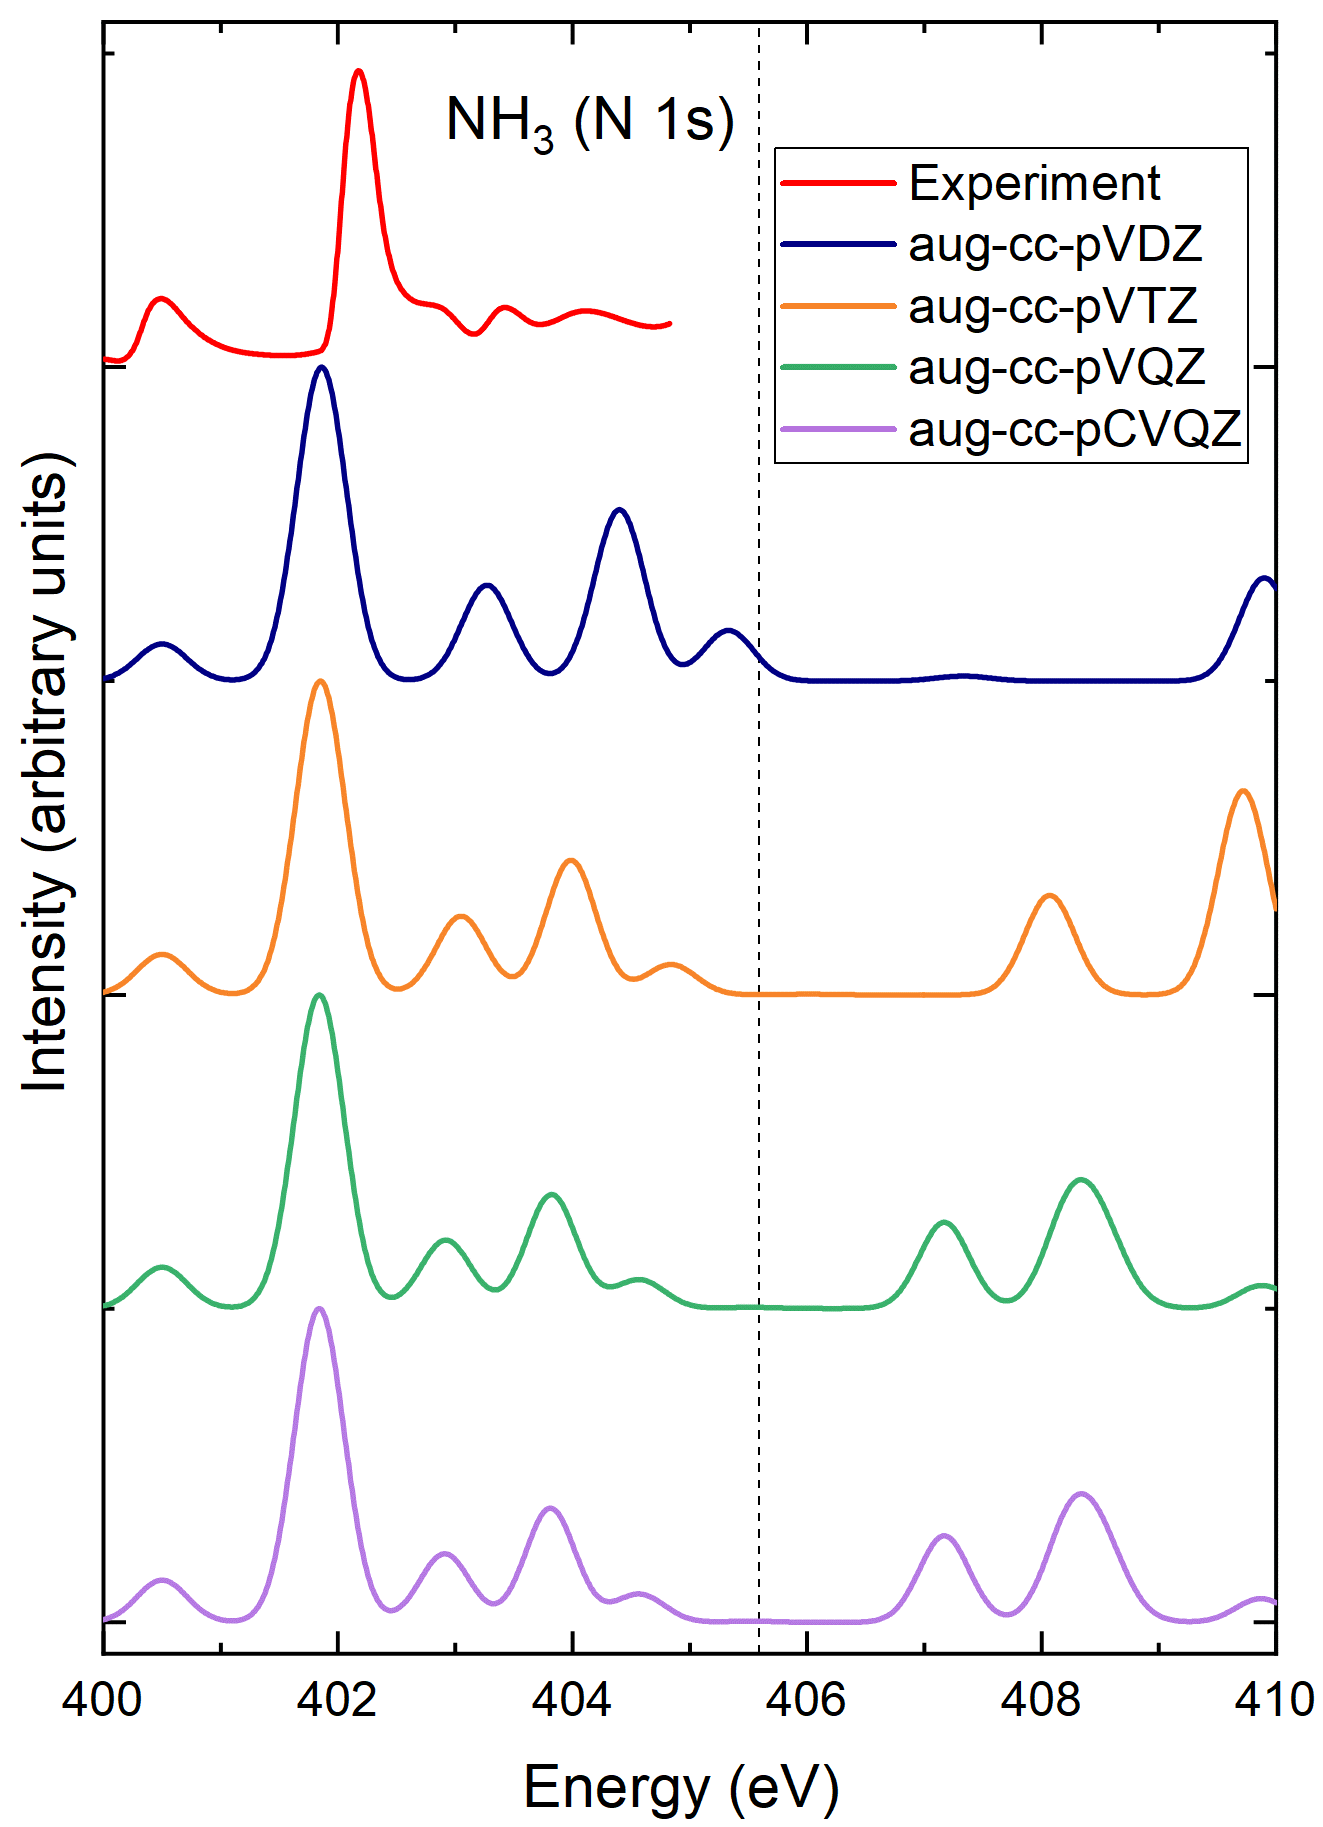
We have also studied the dependence of the TDDFT spectra on the basis set and the exchange-correlation functional. Fig. 1 compares the calculated spectra of the NH3 molecule obtained using the BHLYP functional for different basis sets ranging from double zeta to quadruple zeta of the augmented correlation-consistent polarized, valence aug-cc-pVXZ Dunning family with X=D, T or Q dunning1989a ; kendall1992a taken from the basis set exchange pritchard2019a ; feller1996a ; schuchardt2007a . In addition, we tested the aug-cc-pCVQZ basis which contains additional core basis functions. For the energy range in which experimental data is available, all basis sets give similar results. Clear differences can be observed at higher excitation energies. Finally, we also compare spectra with and without the Tamm-Dancoff approximation and found almost no difference. For all TDDFT calculations in this paper we use the aug-cc-pVQZ basis and the Tamm-Dancoff approximation.
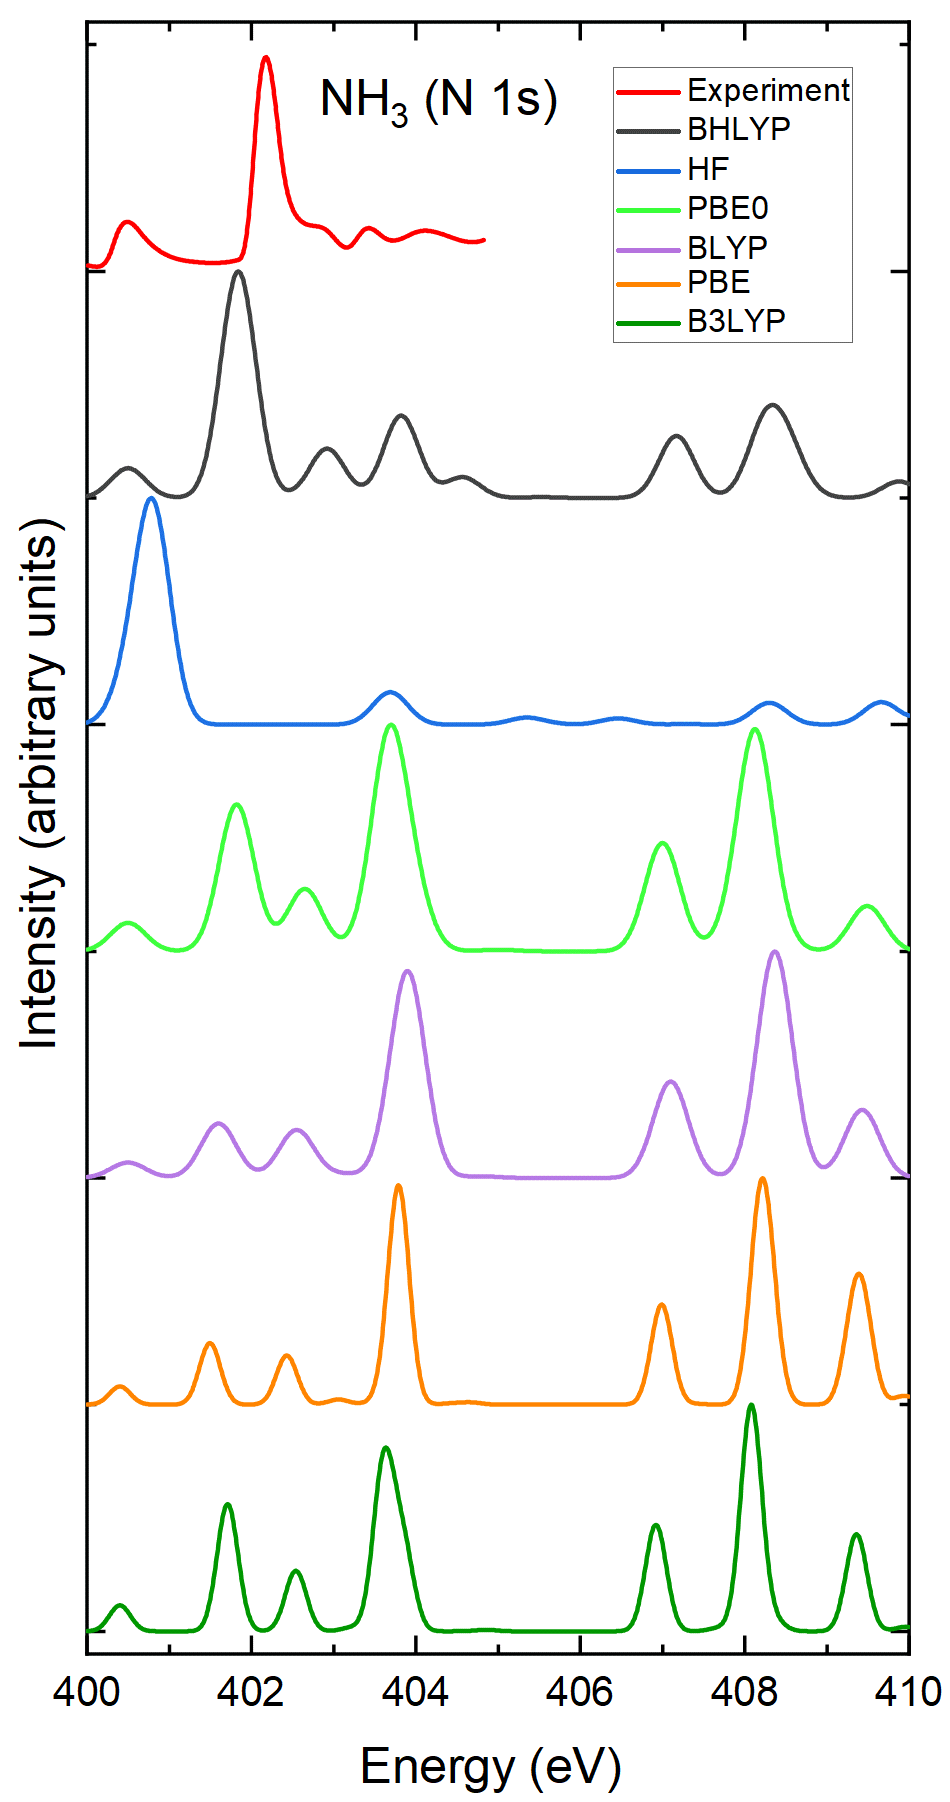
Figure 2 compares the experimental spectrum of NH3 to calculated spectra obtained from different exchange-correlation functionals. Good agreement is found between the BHLYP result and experiment, while significant qualitative differences can be observed for the other functionals. All TDDFT calculations in the paper are therefore performed with the BHLYP functional.
III Results and Discussion
III.1 K-edge energies of molecular compounds
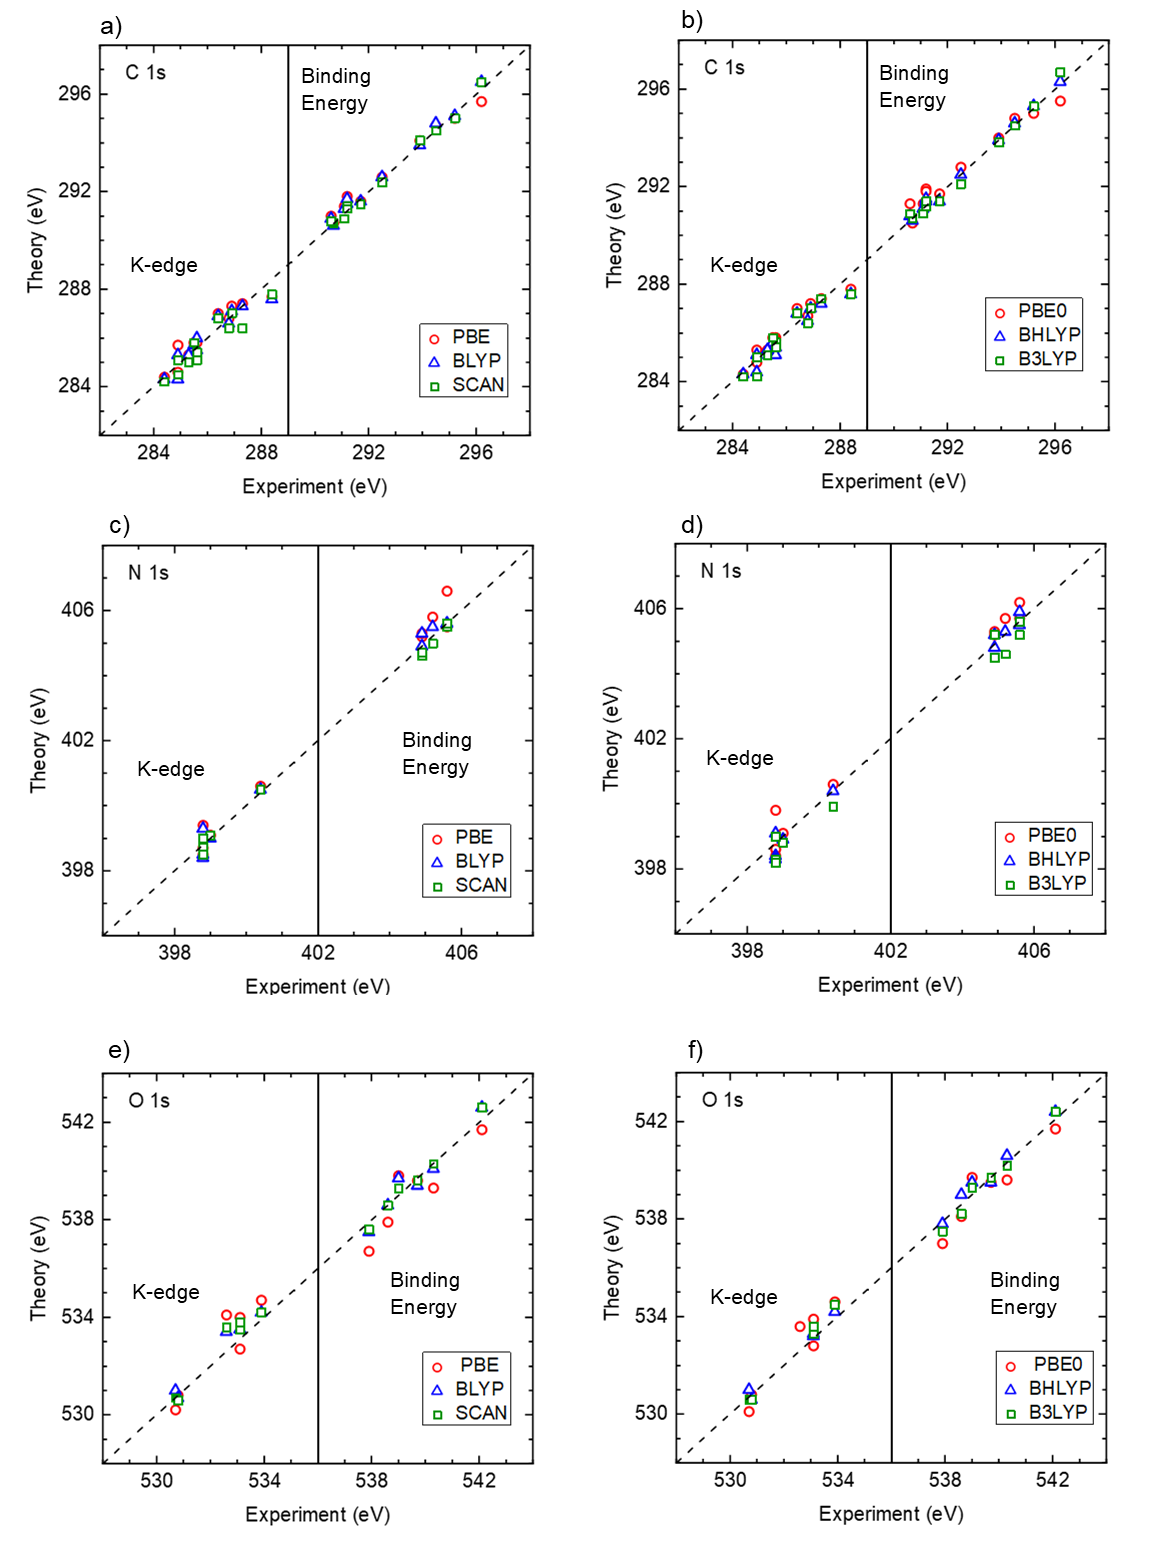
We have calculated the lowest core-electron excitations energies corresponding to transitions from atomic 1s orbitals to molecular LUMO states (also known as the K-edge energy) as well as the core-electron binding energies of a set of small molecules containing the elements H, C, N, O and F using the SCF approach. In particular, we carry out calculations for , , , HF, ethanol, acetone, CO, OCS, formaldehyde, , and azabenzenes. All results are shown in Figure 3 and summarized in Table 2. All relevant data used to generate these graphs as well as the experimental references is also provided in the Supplementary Materials.
Figures 3(a) and (b) compare the K-edge energies and core-electron binding energies of carbon atoms in the molecular compounds obtained with different exchange-correlation functionals. Table 2 shows that the BHLYP functional performs best for the core-electron binding energies with a mean absolute error (MAE) of 0.11 eV, while the other hybrid functionals perform somewhat worse. Regarding the semi-local functionals, SCAN performs best with a MAE of 0.15 eV, while PBE and BLYP have MAEs of 0.22 eV and 0.29 eV, respectively. For the K-edge energies, PBE0 performs best with a MAE of 0.24 eV. B3LYP and BLYP (both with a MAE of 0.29 eV) as well as BHLYP (0.29 eV) and PBE (0.30 eV) perform similarly with SCAN showing the highest MAE of 0.38 eV. The origin of this large MAE for SCAN can be traced to its performance for carbon monoxide with an absolute error of 0.9 eV, while other functionals have errors of only 0.1 eV for this system. Overall, we find that the MAEs for the lowest neutral excitations tend to be somewhat higher than for the core-electron binding energies.
Figures 3(c) and (d) show the corresponding results for oxygen atoms. Table 2 shows that among the semi-local functionals, SCAN performs best for the core-electron binding energies with a MAE of 0.21 eV. For the K-edge energies, the accuracy of SCAN is somewhat worse with a MAE of 0.32 eV which is similar to BLYP with an MAE of 0.30 eV. Somewhat better results for the K-edge energies can be obtained with hybrid functionals. In particular, BHLYP yields a MAE of only 0.23 eV, while the MAEs of B3LYP and PBE0 are 0.32 eV and 0.48 eV, respectively.
Finally, Figs. 3(e) and (f) show the corresponding results for nitrogen atoms. For the core-electron binding energies, BLYP (MAE of 0.14 eV), SCAN (MAE of 0.16 eV), and BHLYP (MAE of 0.18 eV) perform best. For the K-edge energies, SCAN performs best with a MAE of 0.16 eV. BLYP, PBE and BHLYP all show MAEs of 0.26 eV. B3LYP and PBE0 perform worst with MAEs of 0.4 eV and 0.38 eV, respectively.
| Element | B3LYP | BHLYP | BLYP | PBE0 | PBE | SCAN | ||||||
|---|---|---|---|---|---|---|---|---|---|---|---|---|
| BE | K-edge | BE | K-edge | BE | K-edge | BE | K-edge | BE | K-edge | BE | K-edge | |
| C | 0.18 | 0.29 | 0.11 | 0.28 | 0.22 | 0.29 | 0.40 | 0.24 | 0.29 | 0.30 | 0.15 | 0.38 |
| O | 0.23 | 0.32 | 0.25 | 0.23 | 0.31 | 0.30 | 0.50 | 0.48 | 0.62 | 0.52 | 0.21 | 0.32 |
| N | 0.25 | 0.40 | 0.18 | 0.26 | 0.14 | 0.26 | 0.38 | 0.38 | 0.48 | 0.26 | 0.16 | 0.16 |
| F | 0.10 | 0.10 | 0.30 | 0.10 | 0.10 | 0.30 | 0.40 | 0.40 | 0.00 | 0.40 | 0.00 | 0.10 |
| average | 0.24 | 0.31 | 0.19 | 0.25 | 0.23 | 0.31 | 0.42 | 0.36 | 0.42 | 0.39 | 0.16 | 0.33 |
III.2 Core-electron spectra of molecules
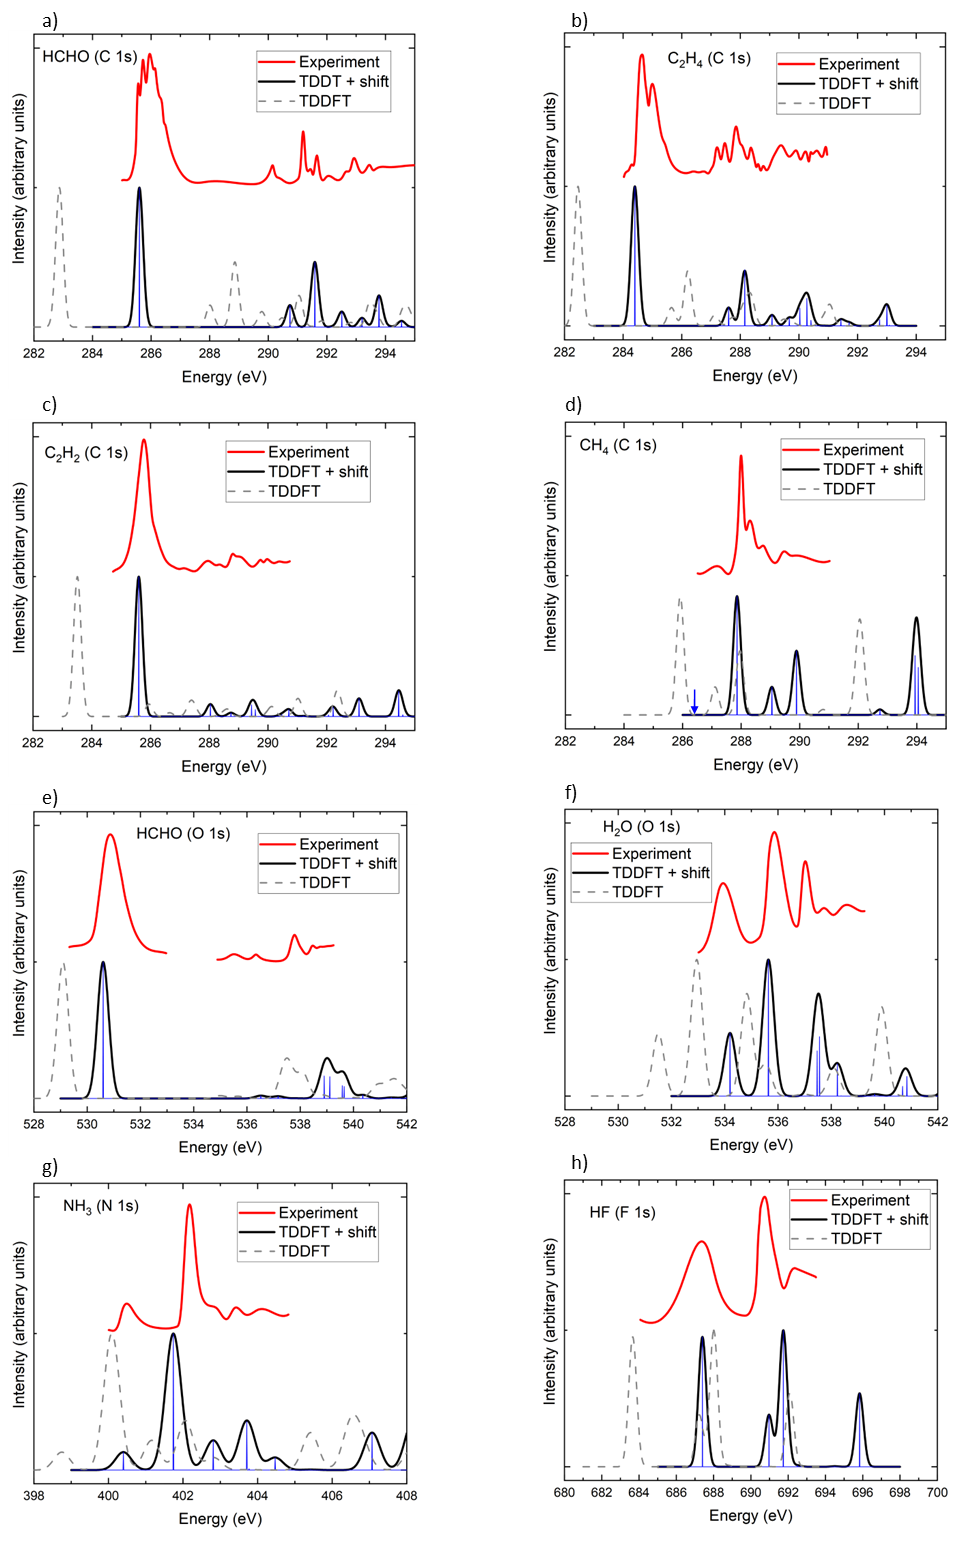
Figure 4 shows the calculated core-level spectra for a set of small molecules (HCHO, C2H2, C2H4, CH4, NH3, H2O, HF) and compares them to experimental results. The experimental data has been fitted to a spline and smoothed for easier visual comparison. As described in the methods section, each excitation is represented by a Lorentzian with a full width at half maximum . In Fig. 4, we have used eV for carbon spectra and eV for oxygen, nitrogen and fluorine spectra.
Figure 4(a) compares the calculated carbon 1s XAS spectrum of formaldehyde (HCHO) with experimental data taken from reference Remmers1992a . Both the experimental and the calculated spectrum show a large peak near 285.5 eV. In the measured spectrum, this peak appears very broad and is split into a set of smaller subpeaks. This peak splitting has been interpreted as a vibrational effect Remmers1992a with a single electronic excitation (associated with the transition of an electron from the C 1s core level to an unoccupied orbital) coupled to various vibrations associated with H-C bending and stretching as well as C-O stretching. Since the atomic nuclei are fixed in our calculations, we do not capture these vibrational effects. Following this main peak, there is an energy gap in both the experimental and the calculated spectrum. At higher energies (starting at approximately 290 eV), a set of smaller peaks can be observed which arise from transitions from the C 1s state to Rydberg states of the molecule. Overall, there is good agreement both for the positions and intensities of the peaks between the calculated and the measured spectrum.
The experimental core-electron spectrum of C2H4 (shown in Fig. 4(b)) is qualitatively similar to that of formaldehyde. In particular, a large peak is found at 284.7 eV which is split into two peaks because of the coupling to the symmetric C-H stretching mode. This peak arises from transitions from the carbon 1s orbital to the molecular LUMO. At energies higher than 287.7 eV, a series of smaller transitions is observed which are attributed to transitions into Rydberg states. The calculated spectrum also exhibits a large peak whose energy is in good agreement with the experimental one as well as a series of smaller peaks at higher energies. Similarly good agreement between theory and experiment is found for C2H2, see Fig. 4(c).
Figure 4(d) compares the XAS spectrum Nilsson2010b of CH4 to the calculated result. In this case the agreement between theory and experiment is clearly worse. It is important to note, however, that the first low-intensity peak in the experimental spectrum at 287.05 eV arises from a transition from the carbon 1s orbital to 3s a1 Rydberg orbital. This transition is electric-dipole forbidden and only observable because of vibrational coupling. The largest peak at 288.0 eV arises from a transition into the 3p t2 Rydberg state and is followed by smaller peaks arising from vibrational effects. At higher energies additional peaks arising from transitions into higher Rydberg states are observed. In the calculated spectrum, the energy of the largest peak is underestimated, but better agreement is found for the higher-lying Rydberg state transitions.
Figures 4(e) and (f) show the measured Nilsson2010b ; Remmers1992a and calculated oxygen spectra of H2O and CH2O. For H2O, very good agreement between theory and experiment is found both for the peak positions and their intensities. The first two peaks arise from transitions from oxygen 1s to the 4a1 LUMO and 2b2 LUMO+1 orbitals, respectively, while the final state of the third peak is a Rydberg state. Vibrational effects are responsible for the large width of the peaks. For CH2O, the measured spectrum consists of a large peaks at about 530.8 eV which is well reproduced by theory and a series of smaller peaks arising from transitions into Rydberg states which are captured by the calculations. In particular, the calculated spectrum also exhibits two small peaks near 537 eV which arise from transitions into 3s and 3p Rydberg states followed by two somewhat larger peaks near 539 eV corresponding to transitions into 4p and 5p Rydberg states. However, the energies of these smaller peaks are approximately 1 eV higher in the calculated spectrum compared to experiment.
Finally, Fig. 4(g) and (h) show the nitrogen spectrum of NH3 and the fluorine spectrum of HF, respectively, and compares them to experimental XAS results Nilsson2010b . Good agreement between theory and experiment is found for NH3. In particular, the position and intensity of the first peak is well reproduced, but the energy of the large second peak near 402 eV is somewhat underestimated by the calculation. Similarly, the first peak at 687 eV in the HF spectrum is captured accurately by the calculation. At higher energies, near 692 eV, the theoretical spectra exhibits two peaks. In contrast to experiment, however, the intensity of the first peak is higher than that of the second peak.
IV Conclusions
We have assessed the performance of a first-principles approach for calculating core-electron spectra which are measured in X-ray absorption spectroscopy and energetic electron loss spectroscopy. In this approach, spectra from linear response TDDFT are shifted such that the energy of the lowest excitation agrees with the value obtained from SCF. This procedure overcomes TDDFT’s failure to yield accurate absolute core-electron excitation energies, while producing the entire spectrum in one shot (as opposed to having a separate calculation for each excited state). We apply this method to set of small molecules and find mostly good agreement between experimental and calculated spectra when the BHLYP exchange-correlation functional is used for the TDDFT. This method can now be applied to more complex systems, including solids and surfaces.
V Acknowledgements
JL acknowledges funding from the Royal Society through a Royal Society University Research Fellowship. This project has received funding from the European Union’s Horizon 2020 research and innovation programme under grant agreement No 892943.
VI References
References
- [1] Katharina Diller, Reinhard J. Maurer, Moritz Müller, and Karsten Reuter. Interpretation of x-ray absorption spectroscopy in the presence of surface hybridization. The Journal of Chemical Physics, 146(21):214701, 2017.
- [2] Camilla Abbehausen, Raphael Enoque Ferraz De Paiva, Ragnar Bjornsson, Saulo Quintana Gomes, Zhifeng Du, Pedro Paulo Corbi, Frederico Alves Lima, and Nicholas Farrell. X-ray Absorption Spectroscopy Combined with Time-Dependent Density Functional Theory Elucidates Differential Substitution Pathways of Au(I) and Au(III) with Zinc Fingers. Inorganic Chemistry, 57(1):218–230, 2018.
- [3] Iurii Zhovtobriukh, Patrick Norman, and Lars G.M. Pettersson. X-ray absorption spectrum simulations of hexagonal ice. Journal of Chemical Physics, 150(3), 2019.
- [4] M. Cavalleri, H. Ogasawara, L. G.M. Pettersson, and A. Nilsson. The interpretation of X-ray absorption spectra of water and ice. Chemical Physics Letters, 364(3-4):363–370, 2002.
- [5] Saugata Datta, Ana M. Rule, Jana N. Mihalic, Steve N. Chillrud, Benjamin C. Bostick, Juan P. Ramos-Bonilla, Inkyu Han, Lisa M. Polyak, Alison S. Geyh, and Patrick N. Breysse. Use of X-ray absorption spectroscopy to speciate manganese in airborne particulate matter from five counties across the United States. Environmental Science and Technology, 46(6):3101–3109, 2012.
- [6] Yuanzhi Chen, Naresh Shah, Artur Braun, Frank E. Huggins, and Gerald P. Huffman. Electron microscopy investigation of carbonaceous particulate matter generated by combustion of fossil fuels. Energy and Fuels, 19(4):1644–1651, 2005.
- [7] Mark E Casida. Time-dependent density functional response theory for molecules. In Recent Advances In Density Functional Methods: (Part I), pages 155–192. World Scientific, 1995.
- [8] Nicholas A Besley and Frans A Asmuruf. Time-dependent density functional theory calculations of the spectroscopy of core electrons. Physical Chemistry Chemical Physics, 12(38):12024–12039, 2010.
- [9] Katherine J Oosterbaan, Alec F White, and Martin Head-Gordon. Non-orthogonal configuration interaction with single substitutions for the calculation of core-excited states. The Journal of chemical physics, 149(4):044116, 2018.
- [10] Nicholas A Besley and Adam Noble. Time-dependent density functional theory study of the x-ray absorption spectroscopy of acetylene, ethylene, and benzene on si (100). The Journal of Physical Chemistry C, 111(8):3333–3340, 2007.
- [11] Patrick Norman and Andreas Dreuw. Simulating x-ray spectroscopies and calculating core-excited states of molecules. Chemical reviews, 118(15):7208–7248, 2018.
- [12] Jan Wenzel, Michael Wormit, and Andreas Dreuw. Calculating core-level excitations and x-ray absorption spectra of medium-sized closed-shell molecules with the algebraic-diagrammatic construction scheme for the polarization propagator. Journal of Computational Chemistry, 35(26):1900–1915, 2014.
- [13] Andrew R Attar, Aditi Bhattacherjee, CD Pemmaraju, Kirsten Schnorr, Kristina D Closser, David Prendergast, and Stephen R Leone. Femtosecond x-ray spectroscopy of an electrocyclic ring-opening reaction. Science, 356(6333):54–59, 2017.
- [14] Aditi Bhattacherjee, Kirsten Schnorr, Sven Oesterling, Zheyue Yang, Tian Xue, Regina de Vivie-Riedle, and Stephen R Leone. Photoinduced heterocyclic ring opening of furfural: Distinct open-chain product identification by ultrafast x-ray transient absorption spectroscopy. Journal of the American Chemical Society, 140(39):12538–12544, 2018.
- [15] Nicholas A Besley, Michael JG Peach, and David J Tozer. Time-dependent density functional theory calculations of near-edge x-ray absorption fine structure with short-range corrected functionals. Physical Chemistry Chemical Physics, 11(44):10350–10358, 2009.
- [16] Serena DeBeer George and Frank Neese. Calibration of scalar relativistic density functional theory for the calculation of sulfur k-edge x-ray absorption spectra. Inorganic chemistry, 49(4):1849–1853, 2010.
- [17] Andrew TB Gilbert, Nicholas A Besley, and Peter MW Gill. Self-consistent field calculations of excited states using the maximum overlap method (mom). The Journal of Physical Chemistry A, 112(50):13164–13171, 2008.
- [18] Tim Kowalczyk, Shane R Yost, and Troy Van Voorhis. Assessment of the scf density functional theory approach for electronic excitations in organic dyes. The Journal of chemical physics, 134(5):054128, 2011.
- [19] Tom Ziegler, Arvi Rauk, and Evert J Baerends. On the calculation of multiplet energies by the hartree-fock-slater method. Theoretica chimica acta, 43(3):261–271, 1977.
- [20] J. Matthias Kahk and Johannes Lischner. Core electron binding energies of adsorbates on Cu(111) from first-principles calculations. Physical Chemistry Chemical Physics, 20(48):30403–30411, 2018.
- [21] J. Matthias Kahk and Johannes Lischner. Accurate absolute core-electron binding energies of molecules, solids, and surfaces from first-principles calculations. Physical Review Materials, 3(10):1–7, 2019.
- [22] Maximilien A. Ambroise and Frank Jensen. Probing Basis Set Requirements for Calculating Core Ionization and Core Excitation Spectroscopy by the Self-Consistent-Field Approach. Journal of Chemical Theory and Computation, 15(1):325–337, 2019.
- [23] Hristina R. Zhekova, Michael Seth, and Tom Ziegler. A perspective on the relative merits of time-dependent and time-independent density functional theory in studies of the electron spectra due to transition metal complexes. An illustration through applications to copper tetrachloride and plastocyanin. International Journal of Quantum Chemistry, 114(15):1019–1029, 2014.
- [24] Diptarka Hait and Martin Head-Gordon. Excited state orbital optimization via minimizing the square of the gradient: General approach and application to singly and doubly excited states via density functional theory. Journal of Chemical Theory and Computation, 16(3):1–35, 2019.
- [25] Diptarka Hait and Martin Head-Gordon. Highly Accurate Prediction of Core Spectra of Molecules at Density Functional Theory Cost: Attaining Sub-electronvolt Error from a Restricted Open-Shell Kohn–Sham Approach. The Journal of Physical Chemistry Letters, 11:775–786, 2020.
- [26] E. W. Tait, L. E. Ratcliff, M. C. Payne, P. D. Haynes, and N. D.M. Hine. Simulation of electron energy loss spectra of nanomaterials with linear-scaling density functional theory. Journal of Physics Condensed Matter, 28(19), 2016.
- [27] Andrew J Morris, Rebecca J Nicholls, Chris J Pickard, and Jonathan R Yates. Optados: A tool for obtaining density of states, core-level and optical spectra from electronic structure codes. Computer Physics Communications, 185(5):1477–1485, 2014.
- [28] Sonia Coriani, Ove Christiansen, Thomas Fransson, and Patrick Norman. Coupled-cluster response theory for near-edge x-ray-absorption fine structure of atoms and molecules. Physical Review A - Atomic, Molecular, and Optical Physics, 85(2):1–8, 2012.
- [29] Max Kehry, Yannick J. Franzke, Christof Holzer, and Wim Klopper. Quasirelativistic two-component core excitations and polarisabilities from a damped-response formulation of the bethe–salpeter equation. Molecular Physics, 118(21-22):e1755064, 2020.
- [30] K. Gilmore, John Vinson, E. L. Shirley, D. Prendergast, C. D. Pemmaraju, J. J. Kas, F. D. Vila, and J. J. Rehr. Efficient implementation of core-excitation Bethe-Salpeter equation calculations. Computer Physics Communications, 197:109–117, 2015.
- [31] Chen Zheng, Kiran Mathew, Chi Chen, Yiming Chen, Hanmei Tang, Alan Dozier, Joshua J. Kas, Fernando D. Vila, John J. Rehr, Louis F.J. Piper, Kristin A. Persson, and Shyue Ping Ong. Automated generation and ensemble-learned matching of X-ray absorption spectra. npj Computational Materials, 4(1):1–9, 2018.
- [32] Steven B. Torrisi, Matthew R. Carbone, Brian A. Rohr, Joseph H. Montoya, Yang Ha, Junko Yano, Santosh K. Suram, and Linda Hung. Random forest machine learning models for interpretable X-ray absorption near-edge structure spectrum-property relationships. npj Computational Materials, 6(1), 2020.
- [33] Anja Aarva, Volker L. Deringer, Sami Sainio, Tomi Laurila, and Miguel A. Caro. Understanding X-ray Spectroscopy of Carbonaceous Materials by Combining Experiments, Density Functional Theory, and Machine Learning. Part I: Fingerprint Spectra. Chemistry of Materials, 31(22):9243–9255, 2019.
- [34] C. D. Rankine, M. M.M. Madkhali, M. M.M. Madkhali, and T. J. Penfold. A Deep Neural Network for the Rapid Prediction of X-ray Absorption Spectra. Journal of Physical Chemistry A, 124(21):4263–4270, 2020.
- [35] Mikael Leetmaa, Mathias Ljungberg, Hirohito Ogasawara, Michael Odelius, Lars-Åke Näslund, Anders Nilsson, and Lars GM Pettersson. Are recent water models obtained by fitting diffraction data consistent with infrared/raman and x-ray absorption spectra? The Journal of chemical physics, 125(24):244510, 2006.
- [36] A. Nilsson, D. Nordlund, I. Waluyo, N. Huang, H. Ogasawara, S. Kaya, U. Bergmann, L. Å Näslund, H. Öström, Ph Wernet, K. J. Andersson, T. Schiros, and L. G.M. Pettersson. X-ray absorption spectroscopy and X-ray Raman scattering of water and ice; an experimental view. Journal of Electron Spectroscopy and Related Phenomena, 177(2-3):99–129, 2010.
- [37] Volker Blum, Ralf Gehrke, Felix Hanke, Paula Havu, Ville Havu, Xinguo Ren, Karsten Reuter, and Matthias Scheffler. Ab initio molecular simulations with numeric atom-centered orbitals. Computer Physics Communications, 180(11):2175–2196, 2009.
- [38] Xinguo Ren, Patrick Rinke, Volker Blum, Jürgen Wieferink, Alexandre Tkatchenko, Andrea Sanfilippo, Karsten Reuter, and Matthias Scheffler. Resolution-of-identity approach to Hartree-Fock, hybrid density functionals, RPA, MP2 and GW with numeric atom-centered orbital basis functions. New Journal of Physics, 14, 2012.
- [39] E van Lenthe, E J Baerends, and J G Snijders. Relativistic total energy using regular approximations. The Journal of Chemical Physics, 101(11):9783–9792, 1994.
- [40] S Faas, J G Snijders, J H van Lenthe, E van Lenthe, and E J Baerends. The ZORA formalism applied to the Dirac-Fock equation. Chemical Physics Letters, 246(6):632–640, 1995.
- [41] Kenneth G Dyall and Erik van Lenthe. Relativistic regular approximations revisited: An infinite-order relativistic approximation. The Journal of Chemical Physics, 111(4):1366–1372, 1999.
- [42] Wim Klopper, Joop H van Lenthe, and Alf C Hennum. An improved ab initio relativistic zeroth-order regular approximation correct to order 1/c2. The Journal of Chemical Physics, 113(22):9957–9965, 2000.
- [43] E Aprà, E J Bylaska, W A de Jong, N Govind, K Kowalski, T P Straatsma, M Valiev, H J J van Dam, Y Alexeev, J Anchell, V Anisimov, F W Aquino, R Atta-Fynn, J Autschbach, N P Bauman, J C Becca, D E Bernholdt, K Bhaskaran-Nair, S Bogatko, P Borowski, J Boschen, J Brabec, A Bruner, E Cauët, Y Chen, G N Chuev, C J Cramer, J Daily, M J O Deegan, T H Dunning, M Dupuis, K G Dyall, G I Fann, S A Fischer, A Fonari, H Früchtl, L Gagliardi, J Garza, N Gawande, S Ghosh, K Glaesemann, A W Götz, J Hammond, V Helms, E D Hermes, K Hirao, S Hirata, M Jacquelin, L Jensen, B G Johnson, H Jónsson, R A Kendall, M Klemm, R Kobayashi, V Konkov, S Krishnamoorthy, M Krishnan, Z Lin, R D Lins, R J Littlefield, A J Logsdail, K Lopata, W Ma, A V Marenich, J del Campo, D Mejia-Rodriguez, J E Moore, J M Mullin, T Nakajima, D R Nascimento, J A Nichols, P J Nichols, J Nieplocha, A Otero-de-la Roza, B Palmer, A Panyala, T Pirojsirikul, B Peng, R Peverati, J Pittner, L Pollack, R M Richard, P Sadayappan, G C Schatz, W A Shelton, D W Silverstein, D M A Smith, T A Soares, D Song, M Swart, H L Taylor, G S Thomas, V Tipparaju, D G Truhlar, K Tsemekhman, T Van Voorhis, Á Vázquez-Mayagoitia, P Verma, O Villa, A Vishnu, K D Vogiatzis, D Wang, J H Weare, M J Williamson, T L Windus, K Woliński, A T Wong, Q Wu, C Yang, Q Yu, M Zacharias, Z Zhang, Y Zhao, and R J Harrison. NWChem: Past, present, and future. The Journal of Chemical Physics, 152(18):184102, 2020.
- [44] Thom H. Dunning. Gaussian basis sets for use in correlated molecular calculations. i. the atoms boron through neon and hydrogen. J. Chem. Phys., 90:1007–1023, 1989.
- [45] Rick A. Kendall, Thom H. Dunning, and Robert J. Harrison. Electron affinities of the first-row atoms revisited. systematic basis sets and wave functions. J. Chem. Phys., 96:6796–6806, 1992.
- [46] Benjamin P. Pritchard, Doaa Altarawy, Brett Didier, Tara D. Gibsom, and Theresa L. Windus. A new basis set exchange: An open, up-to-date resource for the molecular sciences community. J. Chem. Inf. Model., 59:4814–4820, 2019.
- [47] David Feller. The role of databases in support of computational chemistry calculations. J. Comput. Chem., 17:1571–1586, 1996.
- [48] Karen L. Schuchardt, Brett T. Didier, Todd Elsethagen, Lisong Sun, Vidhya Gurumoorthi, Jared Chase, Jun Li, and Theresa L. Windus. Basis set exchange: A community database for computational sciences. J. Chem. Inf. Model., 47:1045–1052, 2007.
- [49] G. Remmers, M. Domke, A. Puschmann, T. Mandel, C. Xue, G. Kaindl, E. Hudson, and D. A. Shirley. High-resolution K-shell photoabsorption in formaldehyde. Physical Review A, 46(7):3935–3944, 1992.
- [50] T. K. Sham, B. X. Yang, J. Kirz, and J. S. Tse. K-edge near-edge x-ray-absorption fine structure of oxygen- and carbon-containing molecules in the gas phase. Physical Review A, 40(2):652–669, 1989.
- [51] M. Tronc, G. C. King, and F. H. Read. Carbon K-shell excitation in small molecules by high-resolution electron impact. Journal of Physics B: Atomic and Molecular Physics, 12(1):137–157, 1979.
- [52] G. Vall-Llosera, B. Gao, A. Kivimäki, M. Coreno, J. Álvarez Ruiz, M. De Simone, H. Ågren, and E. Rachlew. The C 1s and N 1s near edge x-ray absorption fine structure spectra of five azabenzenes in the gas phase. Journal of Chemical Physics, 128(4), 2008.
VII appendix
Table 3 shows SCF results for the binding energies for all molecules investigated in this study and Table 4 shows the K-edge energies. Experimental values are taken from: Ref. [36] for , , , HF; Ref. [50] for ethanol, acetone, CO, OCS; Ref. [49] for formaldehyde; Ref. [51] for and ; Ref. [52] for pyridine, pyridazine, pyrimidine and pyrazine.
| Molecule | Atom | Exp. | B3LYP | BHLYP | BLYP | PBE0 | PBE | SCAN |
| CH3 | C | 290.7 | 290.7 | 290.6 | 290.6 | 290.5 | 290.7 | 290.7 |
| NH3 | N | 405.6 | 405.6 | 405.9 | 405.6 | 405.7 | 405.5 | 405.5 |
| H2O | O | 539.7 | 539.7 | 539.5 | 539.4 | 539.5 | 539.6 | 539.6 |
| HF | F | 694.1 | 694.2 | 694.4 | 694.2 | 694.5 | 694.1 | 694.1 |
| OCS | C | 295.2 | 295.3 | 295.3 | 295.1 | 295.0 | 295.0 | 295.0 |
| O | 540.3 | 540.2 | 540.6 | 540.1 | 539.6 | 539.3 | 540.3 | |
| CO | C | 296.2 | 296.7 | 296.3 | 296.5 | 295.5 | 295.7 | 296.5 |
| O | 542.1 | 542.4 | 542.4 | 542.6 | 541.7 | 541.7 | 542.6 | |
| Acetone | C(H3) | 291.2 | 291.2 | 291.4 | 291.5 | 291.9 | 291.8 | 291.4 |
| C(O) | 293.9 | 293.8 | 293.9 | 293.9 | 294.0 | 294.1 | 294.1 | |
| O | 537.9 | 537.5 | 537.8 | 537.5 | 537.0 | 536.7 | 537.6 | |
| C2H4 | C | 290.6 | 290.9 | 290.8 | 290.9 | 291.3 | 291.0 | 290.8 |
| C2H2 | C | 291.2 | 291.4 | 291.5 | 291.7 | 291.8 | 291.6 | 291.3 |
| Formaldehyde | C | 294.5 | 294.5 | 294.6 | 294.8 | 294.8 | 294.7 | 294.5 |
| 539.0 | 539.3 | 539.5 | 539.7 | 539.7 | 539.8 | 539.3 | ||
| Ethanol | C(H2OH) | 291.1 | 290.9 | 291.1 | 291.3 | 291.3 | 291.4 | 290.9 |
| C(H3) | 292.5 | 292.1 | 292.5 | 292.6 | 292.8 | 292.6 | 292.4 | |
| O | 538.6 | 538.2 | 539.0 | 538.6 | 538.1 | 537.9 | 538.6 | |
| Pyridine | N | 404.9 | 404.5 | 404.8 | 404.9 | 405.2 | 405.2 | 404.6 |
| Pyridazine | N | 404.9 | 405.2 | 405.2 | 405.3 | 405.3 | 405.3 | 404.7 |
| Pyrimidine | N | 405.2 | 404.6 | 405.3 | 405.5 | 405.7 | 405.8 | 405.0 |
| Pyrazine | C | 291.7 | 291.4 | 291.4 | 291.6 | 291.7 | 291.6 | 291.5 |
| N | 405.6 | 405.2 | 405.5 | 405.6 | 406.2 | 406.6 | 405.6 | |
| MAE | 0.2 | 0.2 | 0.2 | 0.4 | 0.4 | 0.2 |
| Molecule | Atom | Experiment | B3LYP | BHLYP | BLYP | PBE0 | PBE | SCAN |
| CH3 | C | 286.8 | 286.4 | 286.5 | 286.6 | 286.7 | 286.8 | 286.4 |
| NH3 | N | 400.4 | 399.9 | 400.4 | 400.5 | 400.6 | 400.6 | 400.5 |
| H2O | O | 533.9 | 534.5 | 534.2 | 534.2 | 534.6 | 534.7 | 534.2 |
| HF | F | 687.3 | 687.4 | 687.4 | 687.6 | 687.7 | 687.7 | 687.4 |
| OCS | C | 288.4 | 287.6 | 287.6 | 287.6 | 287.8 | 287.7 | 287.8 |
| O | 533.1 | 533.3 | 533.2 | 533.5 | 532.8 | 532.7 | 533.5 | |
| CO | C | 287.3 | 287.4 | 287.2 | 287.3 | 287.4 | 287.4 | 286.4 |
| O | 533.1 | 533.6 | 533.3 | 533.5 | 533.9 | 534.0 | 533.8 | |
| Acetone | C(H3) | 286.4 | 286.8 | 286.8 | 286.9 | 287.0 | 287.0 | 286.8 |
| O | 530.7 | 530.6 | 531.0 | 531.0 | 530.1 | 530.2 | 530.7 | |
| C2H4 | C | 284.4 | 284.2 | 284.3 | 284.3 | 284.3 | 284.4 | 284.2 |
| C2H2 | C | 285.6 | 285.6 | 285.1 | 286.0 | 285.8 | 285.4 | 285.1 |
| Formaldehyde | C | 285.6 | 285.4 | 285.4 | 285.5 | 285.7 | 285.8 | 285.4 |
| O | 530.8 | 530.6 | 530.6 | 530.7 | 530.8 | 530.8 | 530.6 | |
| Ethanol | C(H2OH) | 286.9 | 287.0 | 287.0 | 287.1 | 287.2 | 287.3 | 287.0 |
| O | 532.6 | *** | *** | 533.4 | 533.6 | 534.1 | 533.6 | |
| Pyridine | C | 284.9 | 284.2 | 284.4 | 284.3 | 284.8 | 284.6 | 284.5 |
| N | 398.8 | 398.3 | 398.4 | 398.5 | 398.6 | 398.7 | 398.7 | |
| Pyridazine | C | 285.5 | 285.8 | 285.6 | 285.7 | 285.8 | 285.8 | 285.8 |
| N | 399.0 | 398.8 | 398.9 | 399.0 | 399.1 | 399.1 | 399.1 | |
| Pyrimidine | C | 284.9 | 285.0 | 285.1 | 285.3 | 285.3 | 285.7 | 285.1 |
| N | 398.8 | 398.2 | 398.3 | 398.4 | 398.4 | 398.5 | 398.5 | |
| Pyrazine | C | 285.3 | 285.1 | 285.3 | 285.3 | 285.3 | 285.3 | 285.0 |
| N | 398.8 | 399.0 | 399.1 | 399.3 | 399.8 | 399.4 | 399.0 | |
| MAE | 0.3 | 0.3 | 0.3 | 0.4 | 0.4 | 0.3 |