Directly tracing cool filamentary accretion over kpc into the interstellar medium of a quasar host at
Abstract
We report the discovery of giant (50100 kpc) [O II] emitting nebulae with the Multi-Unit Spectroscopic Explorer (MUSE) in the field of TXS 0206048, a luminous quasar at . Down-the-barrel UV spectra of the quasar show absorption at velocities coincident with those of the extended nebulae, enabling new insights into inflows and outflows around the quasar host. One nebula exhibits a filamentary morphology extending over 120 kpc from the halo toward the quasar and intersecting with another nebula surrounding the quasar host with a radius of 50 kpc. This is the longest cool filament observed to-date and arises at higher redshift and in a less massive system than those in cool-core clusters. The filamentary nebula has line-of-sight velocities from nearby galaxies but matches that of the nebula surrounding the quasar host where they intersect, consistent with accretion of cool inter- or circum-galactic medium or cooling hot halo gas. The kinematics of the nebulae surrounding the quasar host are unusual and complex, with redshifted and blueshifted spiral-like structures. The emission velocities at 510 kpc from the quasar match those of inflowing absorbing gas observed in UV spectra of the quasar. Together, the extended nebulae and associated redshifted absorption represent a compelling case of cool, filamentary gas accretion from halo scales into the extended interstellar medium and toward the nucleus of a massive quasar host. The inflow rate implied by the combined emission and absorption constraints is well below levels required to sustain the quasar’s radiative luminosity, suggesting anisotropic or variable accretion.
1 Introduction
Observed scaling relations between the interstellar medium (ISM) and star formation in massive star-forming galaxies imply ISM depletion times of a few Gyr at low- (for a review, see Kennicutt & Evans 2012; cf. Leitner & Kravtsov 2011) and under 1 Gyr at (e.g. Tacconi et al., 2013). These ISM depletion timescales are smaller than the age of the Universe, indicating that galaxies must accrete gas from external reservoirs to enable future star formation and black hole growth. This fresh material can be supplied via mergers (e.g. Moreno et al., 2021), accretion of cool ( K) inter-/circum-galactic medium (IGM/CGM; e.g., Dekel et al., 2009), or cooling of hot ( K) gaseous halos (e.g., Correa et al., 2018). Despite the importance of gas accretion in galaxy evolution, direct and unambiguous observations of accretion are rare (for a review, see Putman, 2017).
The Milky Way represents a unique case where we can study gas accretion onto a galaxy over many phases and angles. The kinematics of the Milky Way’s extraplanar gas exhibit clear signs of accretion in both neutral and ionized phases (for a review, see Putman et al., 2012), with total inferred mass inflow rates consistent with the Galaxy’s star formation rate (e.g. Lehner & Howk, 2011).
Beyond the Milky Way, most studies of inflows rely on absorption features in galaxy spectra that are redshifted relative to the galaxy systemic velocity (for a review, see Rubin, 2017). Despite the difficulty in detecting redshifted gas in “down-the-barrel” spectra, surveys at have revealed likely inflows for galaxies (e.g. Sato et al., 2009; Krug et al., 2010; Coil et al., 2011; Rubin et al., 2012; Martin et al., 2012). However, the locations of the inflowing gas relative to the galaxy are not directly constrained, leaving their origins and fate unknown.
In contrast, the background absorption spectroscopy often used to characterize the CGM (for reviews, see Chen et al., 2017; Tumlinson et al., 2017) informs the spatial distribution of the CGM and IGM around galaxies but carries little direct information on the radial direction of gas flows for individual systems. In rare cases, absorption spectroscopy can help differentiate inflows from outflows through modeling of velocity shear in multi-sightline data (e.g., Chen et al., 2014; Lopez et al., 2018), detailed metallicity gradients (e.g. Fu et al., 2021), or correspondence with galactic rotation (e.g. Ho et al., 2017; Zabl et al., 2019), but all of these cases require model assumptions. Observations that carry direct information on both the morphology and radial direction of gas flows in the same systems have the potential to significantly improve our understanding of accretion onto galaxies.
Wide-field integral field spectrographs (IFS) such as MUSE (Bacon et al., 2010) and KCWI (Martin et al., 2010) enable unprecedented morphological and kinematic maps of giant IGM/CGM nebulae through H I Ly emission at (e.g. Cantalupo et al., 2014; Borisova et al., 2016; Cai et al., 2019; O’Sullivan et al., 2020; Chen et al., 2021; Fossati et al., 2021) and rest-frame NUVoptical emission features at lower redshift (Epinat et al., 2018; Johnson et al., 2018; Boselli et al., 2019; Rupke et al., 2019; Chen et al., 2019; Burchett et al., 2021; Helton et al., 2021; Zabl et al., 2021; Leclercq et al., 2022). At , IFS provide highly complete galaxy redshift surveys and access to non-resonant emission lines to directly trace ionized gas morphology and kinematics. To date, IFS data enabled the discovery of halo-scale nebulae arising from large-scale outflows, cool intragroup medium, and stripping of ISM during galaxy interactions including two nebulae with additional insights from nearby intervening absorption spectroscopy (Chen et al., 2019; Zabl et al., 2021). Moreover, wide-field IFS enable measurements of the velocity structure function which provide unique insights into turbulence in diffuse gas (e.g., Li et al., 2020; Chen et al., 2022). However, observations of gas accretion with wide-field IFS remain ambiguous with the exception of a giant Ly nebulae at with evidence of infall coming from morphology (Rauch et al., 2011, 2016) and the Ly emission profile (Vanzella et al., 2017).
Here, we report the emission detection of an accreting gas filament extending over proper kpc (pkpc) from the halo into the ISM around TXS 0206048, a luminous quasar at . An archival down-the-barrel UV spectrum of the quasar breaks the inflow/outflow degeneracy that limits intervening absorption studies and reveals inflowing absorption at velocities similar to the nearby nebular emission. The Letter proceeds as follows. In Section 2, we describe the MUSE, Hubble Space Telescope (HST), and Magellan observations and data reduction. In Section 3, we characterize the properties of TXS 0206048 and its host group. In Section 4, we describe the giant nebulae in the quasar environment and the coincidence with inflowing gas seen in down-the-barrel absorption. In Section 5, we summarize our findings and discuss their implications. All magnitudes are given in the AB system. Throughout, we adopt a cosmology with , , and .
2 Observations, data reduction, and galaxy measurements
Investigators studying the IGM and CGM (e.g., Tejos et al., 2014; Finn et al., 2016) obtained high quality UV absorption spectra of TXS 0206048 with the Cosmic Origins Spectrograph (COS; Green et al., 2012) due to its UV brightness, long redshift pathlength, and availability of archival data from the Gemini Deep Deep Survey (GDDS; Abraham et al., 2004). We obtained the COS G130M and G160M spectra of TXS 0206048 (PI: Morris; PID: 12264) from MAST and reduced them following procedures described in Johnson et al. (2013) and Chen et al. (2018) to improve the wavelength calibration.
The field near TXS 0206048 was observed with the Advanced Camera for Surveys (ACS) aboard HST with the F814W filter by the GDDS survey for a total of 32 ksec (PI: Abraham; PID: 9760) and for 7.2 ksec by a Sagittarius Stream program (PI: van der Marel; PID 12564), but the quasar falls just arcsec from the edge of the field-of-view (FoV). To identify and measure the morphologies of faint galaxies near the quasar sightline, we obtained an additional 2.1 ksec of exposure with ACSF814W (PI: L. Straka; PID: 14660). We reduced and coadded the ACS imaging for the field using DrizzlePac (Hoffmann et al., 2021) including Tweakreg for alignment and Astrodrizzle to combine them. The effective wavelength of ACSF814W corresponds to a rest-frame wavelength Å at .
To provide deep galaxy redshift survey data, we acquired a total of 8 hours of exposure under arcsec seeing conditions on the field of TXS 0206048 with MUSE as part of the MUSE-QuBES survey (PI: J. Schaye, PID: 094.A-0131, 094.A-0131). We reduced the data using the GTO pipeline (Weilbacher et al., 2014) and sky subtraction tools (Soto et al., 2016) as described in Johnson et al. (2018). To ensure robustness, we also reduced the MUSE data using CubEx (Borisova et al., 2016; Cantalupo et al., 2019) and the ESO pipeline (Weilbacher et al., 2020) and found consistent conclusions. We scaled the variance array reported by the GTO pipeline by a factor of to better reflect empirical variance (see Herenz et al., 2017).
To detect faint emission near the quasar, we performed quasar light subtraction as described in Helton et al. (2021). We then identified galaxies in the MUSE FoV by running source extractor (Bertin & Arnouts, 1996) on both the ACS image of the field and a median image formed from the MUSE datacube. Finally, we extracted spectra using MPDAF (Piqueras et al., 2017).
While the MUSE FoV is wide for an IFS, its FoV radius corresponds to a projected distance of pkpc from the quasar at . We supplemented the MUSE data with a wider-field galaxy redshift survey using the LDSS3 spectrograph on Magellan following procedures outlined in Johnson et al. (2019). The LDSS3 FoV extends to proper Mpc at the .
For both the MUSE and LDSS3 spectra, we measured redshifts by fitting the observed spectra with linear combinations of the first four galaxy eigenspectra from Bolton et al. (2012) as described in Johnson et al. (2018) and Helton et al. (2021). To prevent spatially coincident extended nebular emission from biasing galaxy redshifts, we measured galaxy redshifts based purely on stellar absorption when possible by masking strong emission lines. For galaxies without sufficient continuum signal-to-noise, we measured redshifts with the [O II] doublet. Finally, for galaxies with secure spectroscopic redshifts, we measured absolute magnitudes in the rest-frame -band and 4000 Å break strength (; Balogh et al., 1999).
3 Quasar Properties & environment
TXS 0206048 is a luminous, core-dominated radio-loud quasar (Becker et al., 2001) at a redshift of based on a measurement of the [O II] emission-line centroid in its MUSE spectrum and adopting the rest-frame effective [O II] doublet centroid and systemic uncertainty from Hewett & Wild (2010). To estimate the quasar’s luminosity and black hole mass, we fit the MUSE quasar spectrum near the Mg II emission line with a power-law continuum, Fe II template, and 3 Gaussian emission-line components using PyQSOFit (Guo et al., 2019). The measured monochromatic continuum luminosity at rest-frame 3000 Å implies a bolometric luminosity of using bolometric corrections from Richards et al. (2006). The Mg II line width and luminosity result in an inferred black hole mass of using the single epoch virial theorem estimator from Shen et al. (2011).
| ID | R.A. | Decl. | redshift | redshift | aaWe adopt an absolute magnitude of for an galaxy based on the luminosity function measurement from Faber et al. (2007). This corresponds to a luminosity of . | ||||||
|---|---|---|---|---|---|---|---|---|---|---|---|
| (J2000) | (J2000) | (AB) | type | (′′) | (pkpc) | () | (AB) | ||||
| quasar | 02:09:30.77 | 04:38:26.1 | [O II] | – | – | – | |||||
| G1 | 02:09:30.42 | 04:38:29.8 | stellar | ||||||||
| G2 | 02:09:30.92 | 04:38:18.6 | stellar | ||||||||
| G3 | 02:09:30.59 | 04:38:18.4 | stellar | ||||||||
| G4 | 02:09:31.35 | 04:38:27.7 | [O II] | ||||||||
| G5 | 02:09:30.14 | 04:38:27.1 | [O II] | ||||||||
| G6 | 02:09:30.90 | 04:38:15.5 | stellar | ||||||||
| G7 | 02:09:31.49 | 04:38:21.1 | stellar | ||||||||
| G8 | 02:09:30.27 | 04:38:16.6 | [O II] | ||||||||
| G9 | 02:09:30.95 | 04:38:14.4 | stellar | ||||||||
| G10 | 02:09:31.01 | 04:38:13.1 | stellar | ||||||||
| G11 | 02:09:31.48 | 04:38:15.8 | [O II] | ||||||||
| G12 | 02:09:29.99 | 04:38:15.7 | [O II] | ||||||||
| G13 | 02:09:31.80 | 04:38:21.0 | [O II] | ||||||||
| G14 | 02:09:29.66 | 04:38:25.1 | stellar | ||||||||
| G15 | 02:09:29.66 | 04:38:26.0 | [O II] | ||||||||
| G16 | 02:09:31.82 | 04:38:34.0 | [O II] | ||||||||
| G17 | 02:09:30.39 | 04:38:45.0 | [O II] | ||||||||
| G18 | 02:09:30.71 | 04:38:47.6 | [O II] | ||||||||
| G19 | 02:09:29.44 | 04:38:41.5 | [O II] | ||||||||
| G20 | 02:09:31.10 | 04:38:00.5 | stellar | ||||||||
| G21 | 02:09:29.15 | 04:38:43.5 | stellar | ||||||||
| G22 | 02:09:31.59 | 04:38:54.4 | stellar | ||||||||
| G23 | 02:09:28.85 | 04:38:41.1 | stellar | ||||||||
| G24 | 02:09:28.80 | 04:38:40.6 | [O II] | ||||||||
| G25 | 02:09:31.16 | 04:39:02.8 | stellar | ||||||||
| G26 | 02:09:28.29 | 04:38:18.9 | stellar | ||||||||
| G27 | 02:09:30.95 | 04:37:29.7 | [O II] |
To characterize the group environment of TXS 0206048, we identified 27 galaxies in our spectroscopic survey with secure redshifts and velocities within of the quasar systemic redshift. Table 1 summarizes the properties of these galaxies including their right ascension (R.A.), declination (decl.), apparent magnitude in the F814W filter (), redshift, redshift measurement type ([O II] emission or stellar absorption), projected angular () and physical distance () from the quasar sightline, line-of-sight velocity relative to the quasar (), strength of the 4000 Å break (), rest-frame B-band absolute magnitude (), and -band luminosity relative to based on the luminosity function from Faber et al. (2007).
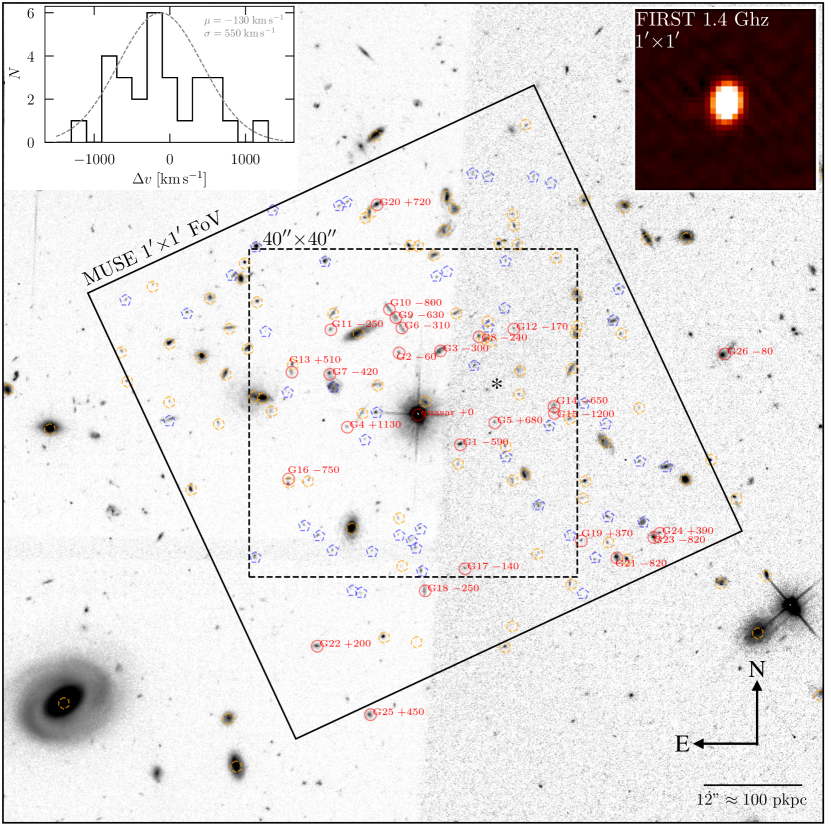
To estimate the mass of the quasar host group, we measured the velocity dispersion of the group members including the quasar. We found a mean group velocity of relative to the quasar and a velocity dispersion of . Assuming that the group is relaxed, this line-of-sight velocity dispersion implies a dynamical mass of using the cluster dispersion-to-mass relation from Munari et al. (2013). This is consistent with halo mass expectations based on the black hole mass of TXS 0206048 and the black hole masshalo mass relation inferred by Gaspari et al. (2019). The luminosity weighted group center is pkpc West and pkpc North of the quasar assuming the quasar host has a luminosity of which is typical of luminous AGN (e.g. Zakamska et al., 2006). The location of the luminosity weighted group center is driven away from that of the quasar primarily by one luminous galaxy, G26, which falls outside of the MUSE field-of-view. The MUSE galaxy redshift survey is deeper than the LDSS3 survey, so the group center may be biased toward the center of the MUSE field-of-view. A full image of the group is included in the Appendix.
4 Giant nebulae around TXS 0206048
| name | length-scale | area | [O II] surface brightnessaaThe total fluxes and luminosities are integrated within isophotal areas with surface brightness greater than . For the Host nebula, we masked a circular region with radius when measuring the total [O II] flux and luminosity to avoid large residuals from the quasar subtraction. If this region is not masked, the measured flux and luminosity increase by a factor of two. | [O II] fluxaaThe total fluxes and luminosities are integrated within isophotal areas with surface brightness greater than . For the Host nebula, we masked a circular region with radius when measuring the total [O II] flux and luminosity to avoid large residuals from the quasar subtraction. If this region is not masked, the measured flux and luminosity increase by a factor of two. | [O II] luminosityaaThe total fluxes and luminosities are integrated within isophotal areas with surface brightness greater than . For the Host nebula, we masked a circular region with radius when measuring the total [O II] flux and luminosity to avoid large residuals from the quasar subtraction. If this region is not masked, the measured flux and luminosity increase by a factor of two. | ||||
|---|---|---|---|---|---|---|---|---|---|
| (pkpc) | () | () | (pkpc) | (pkpc2) | () | () | |||
| N.E. nebula | to | ||||||||
| S. nebula | to | to | |||||||
| N. filament | to | to | to | to | to | ||||
| Host nebula | to | to | to | to | to | aaThe total fluxes and luminosities are integrated within isophotal areas with surface brightness greater than . For the Host nebula, we masked a circular region with radius when measuring the total [O II] flux and luminosity to avoid large residuals from the quasar subtraction. If this region is not masked, the measured flux and luminosity increase by a factor of two. |
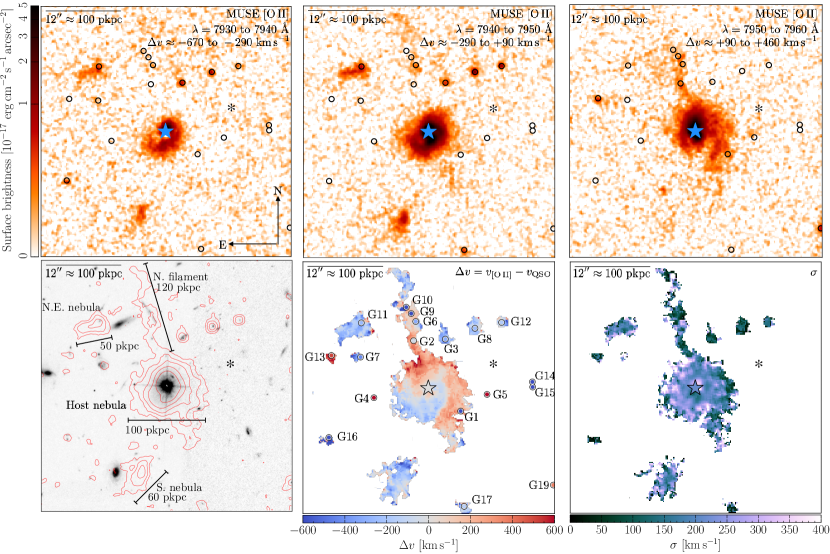
At the redshift of TXS 0206048, the [O II] 3727, 3729 doublet, which traces cool ( K) ionized gas, is observed at Å. To identify [O II] emitting nebulae around the quasar, we performed continuum subtraction on the quasar-light subtracted MUSE datacube by fitting low-order polynomials to each spaxel over a wavelength interval of 7800 to 8100 Å after masking the 50 Å region around [O II]. We then subtracted the continuum fit from each spaxel to produce a emission-line datacube with a typical 3- detection limit of for a line with a width averaged over an aperture.
The continuum subtracted datacube reveals the presence of four distinct, pkpc scale ionized nebulae emitting in [O II] in the quasar host group and several smaller-scale nebulae closely associated with group members. To visualize these nebulae, the top three panels of Figure 1 display continuum subtracted [O II] surface brightness maps integrated over three 10 Å intervals which correspond to line-of-sight velocities of to , to , and to relative to the quasar systemic velocity. We note that the [O II] doublet separation corresponds to so this velocity correspondence is approximate. Throughout the paper, we refer to these nebulae by their morphology and location relative to the quasar as the Northeast (N.E.) nebula, the South (S.) nebula, the North (N.) filament, and the Host nebula (see Figure 1). In addition to these, there is a possible second filamentary feature extending south of the Host nebula seen in Figure 1. However it is less prominent than the N. filament and may be an extension of the Host nebula’s arm-like feature.
To visualize the morphologies of the nebulae relative to galaxies in the group, the bottom left panel of Figure 1 displays the HST image of the field overlaid with [O II] surface brightness contours computed from the sum of the three images shown in the top three panels. The nebulae are labeled by their name and approximate length scale in the bottom-left panel. To better quantify the kinematics of these nebulae, we also performed [O II] doublet fitting to the datacube as described in Johnson et al. (2018) and Helton et al. (2021). The bottom middle and bottom-right panels of Figure 1 display the line-of-sight velocity relative to the quasar and line-of-sight velocity dispersion (corrected for the MUSE line spread function (Bacon et al., 2017)), respectively. In most cases, the emission is too broad or too low in S/N to measure the [O II] 3729-to-3727 doublet ratio, which can vary between 0.35 and 1.5. Uncertainty in the doublet ratio introduces a systematic uncertainty of in the [O II] velocity centroid. Table 2 summarizes the properties of the nebulae, and we discuss each in turn in the following.
4.1 Northeast nebula
The N.E. nebula is located or pkpc from TXS 0206048, has a length scale of pkpc and [O II] surface brightness ranging from to . The N.E. nebula exhibits a head-tail morphology oriented approximately East-West with a surface brightness peak that is spatially coincident with a group member galaxy, G11. Together, the morphology and spatial coincidence with G11 suggest that the N.E. nebula arises from ram pressure stripping of the ISM of G11 as it moves through the hot halo of the quasar host group. Such “jelly-fish” galaxies are often observed in galaxy clusters and groups (e.g. Fumagalli et al., 2014; Poggianti et al., 2017; Chen et al., 2019; Boselli et al., 2019) and around quasar hosts at (e.g. Johnson et al., 2018; Helton et al., 2021) where tidal stripping also plays a role (see also Decarli et al., 2019, for a case of likely tidal stripping around a quasar at ). We caution that the continuum S/N of G11 is too low to measure a stellar-absorption-based redshift.
4.2 South nebula
The S. nebula is located or pkpc South of TXS 0206048, extends over a length-scale pkpc, and exhibits [O II] surface brightness of to . While the surface brightness contours of the S. nebula are somewhat elongated, its surface brightness peak is not coincident with any continuum sources in the HST image. At the location of S. nebula, the HST image is sensitive to galaxies of at . The morphology and lack of associated galaxies suggest that the S. nebula is a collection of cool intragroup medium clouds in the massive halo (e.g. Nelson et al., 2020), similar to others observed around quasars (e.g. Johnson et al., 2018; Helton et al., 2021) at . However, we note that the S. nebula could also represent ram pressure debris stripped from the ISM of a dwarf galaxy fainter than . The brightest galaxy without a robust redshift near the S. nebula falls along the Northern edge of faintest [O II] surface brightness contour shown in the bottom left panel of Figure 1. This galaxy has an apparent magnitude of which would correspond to an absolute magnitude of at , but it lacks the strong nebular emission expected from a galaxy experiencing on-going ram pressure stripping.
4.3 North filament
The N. filament extends from or pkpc North of the quasar toward it and intersects with the Host nebula or pkpc from the quasar. Despite its length, the N. filament is narrow with a width that ranges from to or to pkpc. The N. filament is fainter than the other nebulae in the field with a peak [O II] surface brightness of . The kinematics of the N. filament are complex, and vary from at its northern-most points to where it intersects with the Host nebula. The N. filament is spatially coincident with nearby galaxies, extending pkpc to the North of G10 and connecting G9, G6, and G2 before intersecting with the Host nebula. Kinematically, the velocity of the N. filament appears distinct from G2, G6, G9, and G10 but matches that of the Host nebula where they intersect, as seen in Figure 1.
Optically emitting outflows from radio-loud AGN are commonly observed with orientations aligned with radio lobes (e.g. Nesvadba et al., 2017) which could explain the morphology of the N. filament. However, these outflows typically exhibit broad line widths of while the N. filament exhibits a median width of FWHM . Furthermore, radio observations from FIRST (Becker et al., 2001), VLASS (Lacy et al., 2020), and the XXL Survey GMRT 610 Mhz continuum observations (Smolčić et al., 2018) reveal no evidence of a jet or lobe aligned with the N. filament despite detection limits of 450, 210, and 140 Jy per beam respectively. Starburst driven outflows and radio-quiet AGN driven outflows typically exhibit wide opening angles (e.g. Liu et al., 2013; Rupke et al., 2019; Burchett et al., 2021; Zabl et al., 2021) inconsistent with the morphology of the N. filament. Together, the kinematics, morphology, and lack of detected jets disfavor an outflow origins for the N. filament.
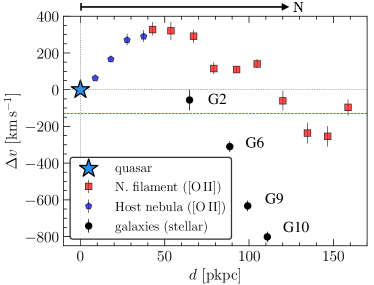
The morphology of the N. filament can be explained if it arises from overlapping nebulae resulting from on-going ram-pressure stripping of group members or cool, filamentary accretion. The on-going ram pressure stripping scenario can explain the spatial coincidence with galaxies but would require a somewhat contrived chance alignment. Further, the significant differences between the [O II] emission velocities of the nebulae vs. stellar absorption velocities of galaxies G2, G6, G9, and G10 disfavors ongoing stripping of ISM. To quantify the velocity differences, Figure 2 displays the [O II]-based velocities for the N. filament and the stellar absorption-based velocities of G2, G6, G9, and G10 versus projected distance from the quasar. The galaxy and nebular line-of-sight velocities differ by more than , even at the locations of the galaxies. This mis-match is inconsistent with previous observations of nebulae arising from ongoing ram pressure stripping of ISM (Johnson et al., 2018; Boselli et al., 2019; Chen et al., 2019; Helton et al., 2021).
The long, narrow morphology, lack of kinematic correspondence with galaxies, and matching velocity to the northern edge of the Host nebula all suggest the N. filament arises from cool, filamentary accretion. Such cool accretion could result from several mechanisms including (1) a cooling flow from the hot halo of the quasar host group, (2) cool, filamentary gas accreting from the IGM, or (3) accreting cool CGM and intragroup medium from a less massive galaxy group as it falls into the quasar host system. Filamentary cooling flows in cool core clusters are observed in optical emission lines including [O II] (e.g. McDonald et al., 2010, 2012). In this case, the N. filament would be the longest and highest redshift known such flow despite arising in a less massive system with a velocity dispersion lower than that of the current record holder, the Phoenix Cluster (McDonald et al., 2012). Spatial coincidence with group members is not typical for cooling flows in cool-core clusters. Instead, the filament could represent chaotic cold accretion from the hot halo (e.g. Gaspari et al., 2018) if interactions between G2, G6, G9, G10, and the quasar host induce turbulenct cooling. In this case, the complex velocity shear would reflect bulk motion of the hot halo.
Alternatively, the N. filament’s morphology and coincidence with galaxies can be explained by cool accretion of an intergalactic medium filament connecting galaxies G2, G6, G9, and G10 or CGM from a galaxy group containing G2, G6, G9, and G10 as the group is accreted by the quasar host system. In both cases, the velocity difference between the nebulae and nearby galaxies can be explained if the gas experienced ram pressure deceleration over sufficiently long timescales. Bulk motion of hot halos can include rotation (e.g. Hodges-Kluck et al., 2016; Oppenheimer et al., 2018) or other complex patterns which could explain the velocity shear of the N. filament. The accreting CGM scenario would require tidal forces to explain the elongated morphology.
An IGM filament would explain the morphology and potentially connect galaxies. The ratio of the stream minor axis radius to the estimated host halo virial radius ( pkpc) is , consistent with predictions for cool inflowing IGM streams from Mandelker et al. (2020). The N. filaments properties can also be explained by CGM or intragroup medium in the presence of interactions. In particular, if the filament originated as CGM or intragroup medium around G2, G6, G9, and G10, the elongated morphology could be the result of tidal and ram pressure forces experienced as the group members and surrounding gas fell toward the quasar host. In summary, the morphology and kinematics of the N. filament are consistent with cool filamentary accretion from the IGM, from the CGM/intragroup medium around a group of galaxies being accreted by the quasar host system, or interaction-induced cooling of hot gas.
4.4 Host nebula
The Host nebula is approximately centered on the quasar and extends to a radius of or pkpc from the quasar with [O II] surface brightness levels ranging from to . The kinematics of the Host nebula are complex with line-of-sight velocities ranging from to and distinct spiral-like structure seen in Figure 1.
The radial extent, morphological correspondence with the quasar, and high peak surface brightness, suggest that the Host nebula represents extended, ionized ISM and diffuse gas around the quasar host. However, the Host nebula’s kinematics are more complex than the canonical “spider” diagram expected for rotating disks. Quantitative analysis of the velocity structure function of the Host nebula demonstrates that it follows expectations for Kolmogorov turbulence with isotropic, homogeneous, and incompressible gas (see Chen et al., 2022).
The unusual spiral structure visible in the surface brightness panels (top) and velocity map (bottom middle) in Figure 1 may be a signature of tidal arms from a past interaction, possibly one that helped fuel the quasar. However, the bright quasar limits our ability to search for interaction signatures that would confirm this scenario.
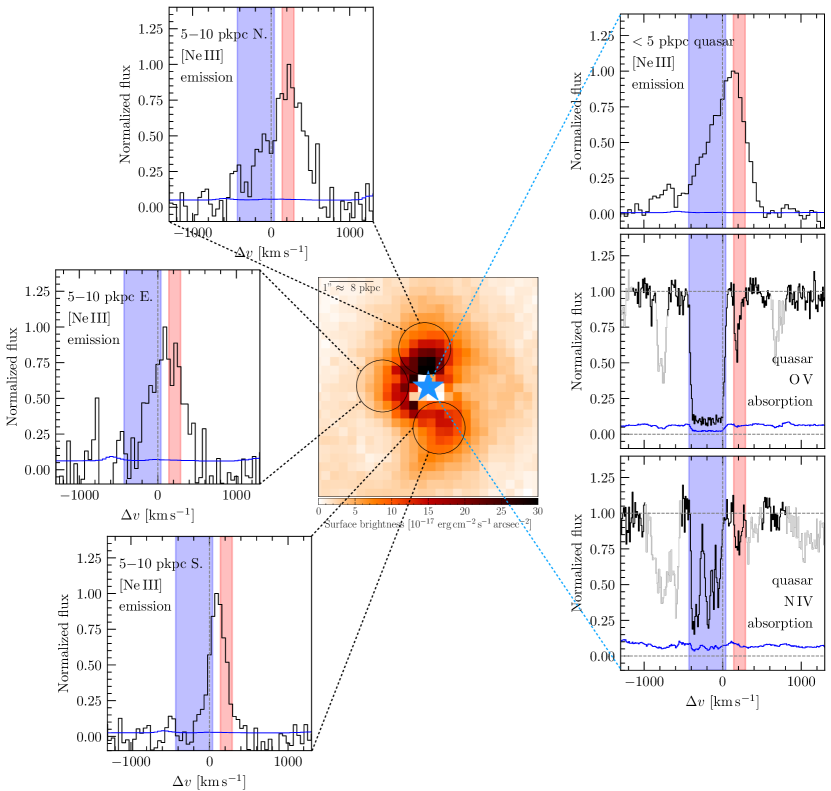
To investigate whether there is a significant, large-scale inflow or outflow associated with the Host nebula, we take advantage of the archival COS spectrum of the quasar, which enables clean differentiation of outflowing (blueshifted) and inflowing (redshifted) gas along the quasar sightline. The COS spectrum reveals narrow associated absorption, including both outflowing and inflowing components detected in an array of ions. The middle and bottom panels on the right of Figure 3 show O V and N IV absorption as a function of line-of-sight velocity relative to the quasar. Finn et al. (2014) conducted ionization analysis of these absorbers and found that the absorbing clouds likely arise at distances of pkpc from the nucleus. This is only slightly smaller than the angular resolution of the seeing limited MUSE data ( corresponds to pkpc at ), providing a unique opportunity to jointly study the emitting and absorbing gas near the quasar.
The regions of the Host nebula near the quasar are bright enough to be observed in [Ne III] emission, which enables more precise velocity measurements. To search for kinematic correspondence between the emitting gas and associated absorbers, Figure 3 displays peak-normalized [Ne III] emission as a function of line-of-sight velocity for a central ( pkpc) extraction centered on the quasar in the top right panel and extractions at pkpc immediately to the N. (left/top panel), E. (left/middle panel), and S. (left/bottom panel).
The [Ne III] emission at pkpc from the quasar sightline peaks between the quasar systemic velocity and that of the inflowing component seen in associated absorption in O V, N IV, and other ions. The circum-nuclear [Ne III] emission also exhibits a prominent blue wing extending from to , similar to the outflowing absorbers. The similarity in velocity range observed between the associated inflow/outflow observed in absorption and the circumnuclear [Ne III] suggests that the emissions may trace different phases and locations of the the same gas flows traced in absorption.
Further from the nucleus, the [Ne III] emission at pkpc shows decreased prominence of the blue wing, suggesting that the faster outflow component at may be confined to central regions of the host. On the other hand, the redshifted emission component is more prominent and peaks near the associated inflow velocity, particularly in the N. extraction. The more extended nature of the redshifted emission and kinematic coincidence with the associated inflow suggest a common origin and a relation to Host nebulae. In this case, the emitting gas near the nucleus would have to be in front of the quasar and oriented towards us within the quasar ionizing radiation cone to be illuminated and for the line-of-sight velocity to approximately match the radial velocity of the down-the-barrel inflow.
5 Discussion and Conclusions
Based on a combination of deep MUSE observations and archival HST data, we discovered four distinct and giant ionized nebulae in the environment of TXS 0206048, a luminous quasar at . Some of these nebulae are likely related to an inflow detected in UV absorption. Two of the nebulae are well separated from the quasar host galaxy and likely arise from on-going ram pressure stripping of a group member (N.E. nebula) and cool clouds in the intragroup medium (S. nebula), extending observations of large-scale streams observed in groups and around quasar hosts to higher redshift (e.g. Hess et al., 2017; Johnson et al., 2018; Helton et al., 2021).
The two other giant nebulae include a pkpc filament extending to the N. of the quasar (N. filament), which intersects–both spatially and kinematically–with a pkpc diameter nebula (Host nebula) surrounding the quasar host itself. Immediately around the quasar, the Host nebula exhibits velocities similar to inflowing absorbing gas observed in UV spectra of the quasar. The morphology and kinematics of the N. filament and Host nebula and coincidental inflowing gas constitute strong evidence of large-scale, cool filamentary accretion from halo scales into the quasar host and toward the nucleus.
If the [O II] emitting gas is in pressure equilibrium with a hot halo, we can gain insights into its physical conditions. Hydrodynamical simulations predict global pressure equilibrium, although small-scale fluctuations from subsonic turbulence can occur (e.g. van de Voort & Schaye, 2012; Gaspari et al., 2014), though observational results are mixed (see Werk et al., 2014; Stern et al., 2016; Zahedy et al., 2019; Butsky et al., 2020; Qu et al., 2022). Adopting the group mass from Section 3 and the generalized NFW pressure profile from Arnaud et al. (2010), we estimate hot halo pressure of at pkpc for the N. filament. Based on Cloudy v17.03 (Ferland et al., 2017) photoionization equilibrium models for gas illuminated by the quasar which dominates over the expected UV background at these distances (e.g. Faucher-Giguere & -A., 2019), we expect a temperature of and a density of .
Estimating the surface brightness of [O II] given a density and total ionized column, , is complicated by the unknown ionization state and metallicity of the gas. However, we expect a line ratio of [O II]/H over a fairly wide range of conditions for AGN photoionized gas (e.g. Groves et al., 2004), enabling us to roughly estimate the ionized gas column because H surface brightness can be approximated as where is the clumping factor, . Assuming and , the surface brightnesses of the N. filament corresponds to approximate ionized gas columns of . With the same assumptions, we estimate total ionized gas masses of and for the N. filament and Host nebula, respectively based on the total line luminosity following Greene et al. (2011). These are significantly lower than the estimates of ionized gas mass assuming the same density and near unity volume filling factor which results in for the N. filament assuming a cylinder with length of pkpc and radius of pkpc and for the Host nebula assuming a uniform sphere with radius pkpc. These volume-based estimates significantly exceed not only the previous luminosity-based estimates but also the expected baryon budget for the group, requiring lower mean density and higher clumping factor (e.g., Cantalupo et al., 2019). With a clumping factor of , the discrepancy between the two mass estimates can be resolved. Insights into the density structure of the gas require new emission observations.
Given its low surface brightness and possible column density, the N. filament may arise in gas analogous to Lyman limit systems and damped Ly absorbers but in a more overdense, higher pressure environment and subjected to intense ionizing radiation from the quasar. The higher peak surface brightness of the inner regions of the Host nebula suggests significantly higher density or ionized gas column, consistent with ISM. The inflowing absorption detected in the spectrum of TXS 0206048 combined with the morphology of the extended, emitting gas of the Host nebula provides an opportunity to estimate the accretion rate in a quasar host assuming that the absorbing gas and extended emission are tracing different phases and locations along a coherent gas flow. Following Weiner et al. (2009), we assume a thin, spherical shell which results in an inflow rate of where is the total hydrogen column density of the inflow, is the radius of the shell, and is the inflow velocity. While it is an oversimplification, we chose the thin-shell for ease of comparison with previous results (e.g. Arav et al., 2013) and to place a conservative upper limit on the inflow rate. Adopting a uniform, spherical flow of radius would reduce the inflow rate by a factor of three. With a total column of based on the ionization analysis of Finn et al. (2014), a radius of pkpc based on the maximum observed extent of the Host nebula, and the observed inflow velocity of , we infer an upper limit on the inflow rate of . The inflowing absorbing gas column inferred by Finn et al. (2014) is several orders-of-magnitude below our initial surface-brightness based estimate for the ionized column. This can be resolved if the emitting gas traces denser, higher column density gas phase with lower covering factor than the absorbing gas or equivalently, by a clumping factor of as previously suggested. The H I column for the inflow inferred by Finn et al. (2014) is based on metal absorption only and assumes approximately solar metallicity due to unavailability of an H I column measurement.
If the absorbing gas arises closer to the nucleus at pkpc (see Finn et al., 2014), then the inflow rate estimate decreases to . An inflow rate of corresponds to a luminosity of or a radiative luminosity of assuming a radiative efficiency of 10%. This is several order-of-magnitude below the observed radiative luminosity of the quasar indicating a significant difference in accretion rate at pkpc compared to nearer the accretion disk. This large difference suggests highly anisotropic or highly time variable accretion. Time variable accretion will be reflected in luminosity variability of the quasar, though we note that TXS 0206048 exhibits 5% level variability in the UV on month timescales (e.g. Punsly et al., 2016). Accretion mechanisms such as chaotic cold accretion (e.g. Gaspari et al., 2018) and interaction induced quasar activity (e.g. Goulding et al., 2018) are expected to produce significant accretion rate variability on timescales comparable to the dynamical time at a few pkpc. Alternatively, the observations of accretion rate at pkpc than is orders-of-magnitude lower than that inferred for the quasar engine itself on much smaller scales could be a signature of effective AGN feedback heating the CGM to slow accretion.
The discovery and morphokinematic analysis of multiple large nebulae including a pkpc long filament and connected kpc diameter nebulae around a luminous quasar with an inflowing associated absorber demonstrate the unique insights enabled by observations of non-resonant emission lines with wide-field IFS when coupled with down-the-barrel absorption spectroscopy. Developing a better understanding of the origins, fate, and physical conditions of these gas flows requires observations of emission lines from a wider variety of ions which will become possible with upcoming near-IR IFS such as MIRMOS on Magellan (Konidaris et al., 2020) and HARMONI (Thatte et al., 2021) on the E-ELT.
Acknowledgements
The authors are grateful for the efforts of the anonymous referee whose thorough feedback strengthened the paper. SDJ gratefully acknowledges partial support from HST-GO-15280.009-A, HST-GO-15298.007-A, HST-GO-15655.018-A, and HST-GO-15935.021-A. MG acknowledges partial support by HST GO-15890.020/023-A, the BlackHoleWeather program, and NASA HEC Pleiades (SMD-2359).. SC gratefully acknowledges support from the European Research Council (ERC) under the European Union’s Horizon 2020 research and innovation programme grant agreement No 864361. GLW acknowledges partial support from HST-GO-15655.006-A and HST-GO-16016.002
Based on observations from the European Organization for Astronomical Research in the Southern Hemisphere under ESO (PI: Schaye, PID: 094.A-0131) and the NASA/ESA Hubble Space Telescope (PI: Abraham, PID: 9760; PI: Morris, 12264; PI: van der Marel, PID: 12564; PI: L. Straka; PID: 14660). The COS spectra and ACS images analyzed in this paper can be accessed via https://doi.org/10.17909/4dnz-y880 (catalog COS DOI) and https://doi.org/10.17909/tekk-dx10 (catalog ACS DOI), respectively.
The This paper includes data gathered with the 6.5 meter Magellan Telescopes located at Las Campanas Observatory, Chile. The paper made use of the NASA/IPAC Extragalactic Database, the NASA Astrophysics Data System, Astropy (Astropy Collaboration et al., 2018), and Aplpy (Robitaille & Bressert, 2012).
Appendix A Supplemental information on the group hosting TXS 0206048
To provide additional context on the galaxy group hosting TXS 0206048, Figure 4 displays a wider FoV version of the HST ACSF814W image with galaxies labelled by group membership based on spectroscopic redshifts as described in Section 3. The figure also highlights the velocity dispersion of the group and best-fit Gaussian and the core-dominated nature of the radio component of TXS 0206048 in inset panel on the top left and top right, respectively.
References
- Abraham et al. (2004) Abraham, R. G., Glazebrook, K., McCarthy, P. J., et al. 2004, AJ, 127, 2455, doi: 10.1086/383557
- Arav et al. (2013) Arav, N., Borguet, B., Chamberlain, C., Edmonds, D., & Danforth, C. 2013, MNRAS, 436, 3286, doi: 10.1093/mnras/stt1812
- Arnaud et al. (2010) Arnaud, M., Pratt, G. W., Piffaretti, R., et al. 2010, A&A, 517, A92, doi: 10.1051/0004-6361/200913416
- Astropy Collaboration et al. (2018) Astropy Collaboration, Price-Whelan, A. M., Sipőcz, B. M., et al. 2018, AJ, 156, 123, doi: 10.3847/1538-3881/aabc4f
- Bacon et al. (2010) Bacon, R., Accardo, M., Adjali, L., et al. 2010, in Proc. SPIE, Vol. 7735, Ground-based and Airborne Instrumentation for Astronomy III, 773508
- Bacon et al. (2017) Bacon, R., Conseil, S., Mary, D., et al. 2017, A&A, 608, A1, doi: 10.1051/0004-6361/201730833
- Balogh et al. (1999) Balogh, M. L., Morris, S. L., Yee, H. K. C., Carlberg, R. G., & Ellingson, E. 1999, ApJ, 527, 54, doi: 10.1086/308056
- Becker et al. (2001) Becker, R. H., White, R. L., Gregg, M. D., et al. 2001, ApJS, 135, 227, doi: 10.1086/321798
- Bertin & Arnouts (1996) Bertin, E., & Arnouts, S. 1996, A&AS, 117, 393, doi: 10.1051/aas:1996164
- Bolton et al. (2012) Bolton, A. S., Schlegel, D. J., Aubourg, É., et al. 2012, AJ, 144, 144, doi: 10.1088/0004-6256/144/5/144
- Borisova et al. (2016) Borisova, E., Cantalupo, S., Lilly, S. J., et al. 2016, ApJ, 831, 39, doi: 10.3847/0004-637X/831/1/39
- Boselli et al. (2019) Boselli, A., Epinat, B., Contini, T., et al. 2019, A&A, 631, A114, doi: 10.1051/0004-6361/201936133
- Burchett et al. (2021) Burchett, J. N., Rubin, K. H. R., Prochaska, J. X., et al. 2021, ApJ, 909, 151, doi: 10.3847/1538-4357/abd4e0
- Butsky et al. (2020) Butsky, I. S., Fielding, D. B., Hayward, C. C., et al. 2020, ApJ, 903, 77, doi: 10.3847/1538-4357/abbad2
- Cai et al. (2019) Cai, Z., Cantalupo, S., Prochaska, J. X., et al. 2019, ApJS, 245, 23, doi: 10.3847/1538-4365/ab4796
- Cantalupo et al. (2014) Cantalupo, S., Arrigoni-Battaia, F., Prochaska, J. X., Hennawi, J. F., & Madau, P. 2014, Nature, 506, 63, doi: 10.1038/nature12898
- Cantalupo et al. (2019) Cantalupo, S., Pezzulli, G., Lilly, S. J., et al. 2019, MNRAS, 483, 5188, doi: 10.1093/mnras/sty3481
- Chen et al. (2019) Chen, H.-W., Boettcher, E., Johnson, S. D., et al. 2019, ApJ, 878, L33, doi: 10.3847/2041-8213/ab25ec
- Chen et al. (2014) Chen, H.-W., Gauthier, J.-R., Sharon, K., et al. 2014, MNRAS, 438, 1435, doi: 10.1093/mnras/stt2288
- Chen et al. (2018) Chen, H.-W., Zahedy, F. S., Johnson, S. D., et al. 2018, MNRAS, 479, 2547, doi: 10.1093/mnras/sty1541
- Chen et al. (2022) Chen, M. C., Chen, H.-W., Rauch, M., et al. 2022, arXiv e-prints, arXiv:2209.04344. https://arxiv.org/abs/2209.04344
- Chen et al. (2017) Chen, S.-F. S., Simcoe, R. A., Torrey, P., et al. 2017, ApJ, 850, 188, doi: 10.3847/1538-4357/aa9707
- Chen et al. (2021) Chen, Y., Steidel, C. C., Erb, D. K., et al. 2021, MNRAS, doi: 10.1093/mnras/stab2383
- Coil et al. (2011) Coil, A. L., Weiner, B. J., Holz, D. E., et al. 2011, ApJ, 743, 46, doi: 10.1088/0004-637X/743/1/46
- Correa et al. (2018) Correa, C. A., Schaye, J., Wyithe, J. S. B., et al. 2018, MNRAS, 473, 538, doi: 10.1093/mnras/stx2332
- Decarli et al. (2019) Decarli, R., Dotti, M., Bañados, E., et al. 2019, ApJ, 880, 157, doi: 10.3847/1538-4357/ab297f
- Dekel et al. (2009) Dekel, A., Birnboim, Y., Engel, G., et al. 2009, Nature, 457, 451, doi: 10.1038/nature07648
- Epinat et al. (2018) Epinat, B., Contini, T., Finley, H., et al. 2018, A&A, 609, A40, doi: 10.1051/0004-6361/201731877
- Faber et al. (2007) Faber, S. M., Willmer, C. N. A., Wolf, C., et al. 2007, ApJ, 665, 265, doi: 10.1086/519294
- Faucher-Giguere & -A. (2019) Faucher-Giguere, & -A., C. 2019, arXiv e-prints. https://arxiv.org/abs/1903.08657
- Ferland et al. (2017) Ferland, G. J., Chatzikos, M., Guzmán, F., et al. 2017, Rev. Mexicana Astron. Astrofis., 53, 385. https://arxiv.org/abs/1705.10877
- Finn et al. (2014) Finn, C. W., Morris, S. L., Crighton, N. H. M., et al. 2014, MNRAS, 440, 3317, doi: 10.1093/mnras/stu518
- Finn et al. (2016) Finn, C. W., Morris, S. L., Tejos, N., et al. 2016, MNRAS, 460, 590, doi: 10.1093/mnras/stw918
- Fossati et al. (2021) Fossati, M., Fumagalli, M., Lofthouse, E. K., et al. 2021, MNRAS, 503, 3044, doi: 10.1093/mnras/stab660
- Fu et al. (2021) Fu, H., Xue, R., Prochaska, J. X., et al. 2021, ApJ, 908, 188, doi: 10.3847/1538-4357/abdb32
- Fumagalli et al. (2014) Fumagalli, M., Fossati, M., Hau, G. K. T., et al. 2014, MNRAS, 445, 4335, doi: 10.1093/mnras/stu2092
- Gaspari et al. (2014) Gaspari, M., Churazov, E., Nagai, D., Lau, E. T., & Zhuravleva, I. 2014, A&A, 569, A67, doi: 10.1051/0004-6361/201424043
- Gaspari et al. (2018) Gaspari, M., McDonald, M., Hamer, S. L., et al. 2018, ApJ, 854, 167, doi: 10.3847/1538-4357/aaaa1b
- Gaspari et al. (2019) Gaspari, M., Eckert, D., Ettori, S., et al. 2019, ApJ, 884, 169, doi: 10.3847/1538-4357/ab3c5d
- Goulding et al. (2018) Goulding, A. D., Greene, J. E., Bezanson, R., et al. 2018, PASJ, 70, S37, doi: 10.1093/pasj/psx135
- Green et al. (2012) Green, J. C., Froning, C. S., Osterman, S., et al. 2012, ApJ, 744, 60, doi: 10.1088/0004-637X/744/1/60
- Greene et al. (2011) Greene, J. E., Zakamska, N. L., Ho, L. C., & Barth, A. J. 2011, ApJ, 732, 9, doi: 10.1088/0004-637X/732/1/9
- Groves et al. (2004) Groves, B. A., Dopita, M. A., & Sutherland, R. S. 2004, ApJS, 153, 75, doi: 10.1086/421114
- Guo et al. (2019) Guo, H., Liu, X., Shen, Y., et al. 2019, MNRAS, 482, 3288, doi: 10.1093/mnras/sty2920
- Helton et al. (2021) Helton, J. M., Johnson, S. D., Greene, J. E., & Chen, H.-W. 2021, MNRAS, 505, 5497, doi: 10.1093/mnras/stab1647
- Herenz et al. (2017) Herenz, E. C., Urrutia, T., Wisotzki, L., et al. 2017, A&A, 606, A12, doi: 10.1051/0004-6361/201731055
- Hess et al. (2017) Hess, K. M., Cluver, M. E., Yahya, S., et al. 2017, MNRAS, 464, 957, doi: 10.1093/mnras/stw2338
- Hewett & Wild (2010) Hewett, P. C., & Wild, V. 2010, MNRAS, 405, 2302, doi: 10.1111/j.1365-2966.2010.16648.x
- Ho et al. (2017) Ho, S. H., Martin, C. L., Kacprzak, G. G., & Churchill, C. W. 2017, ApJ, 835, 267, doi: 10.3847/1538-4357/835/2/267
- Hodges-Kluck et al. (2016) Hodges-Kluck, E. J., Miller, M. J., & Bregman, J. N. 2016, ApJ, 822, 21, doi: 10.3847/0004-637X/822/1/21
- Hoffmann et al. (2021) Hoffmann, S. L., Mack, J., Avila, R., et al. 2021, in American Astronomical Society Meeting Abstracts, Vol. 53, American Astronomical Society Meeting Abstracts, 216.02
- Johnson et al. (2013) Johnson, S. D., Chen, H.-W., & Mulchaey, J. S. 2013, MNRAS, 434, 1765, doi: 10.1093/mnras/stt1137
- Johnson et al. (2018) Johnson, S. D., Chen, H.-W., Straka, L. A., et al. 2018, ApJ, 869, L1, doi: 10.3847/2041-8213/aaf1cf
- Johnson et al. (2019) Johnson, S. D., Mulchaey, J. S., Chen, H.-W., et al. 2019, ApJ, 884, L31, doi: 10.3847/2041-8213/ab479a
- Kennicutt & Evans (2012) Kennicutt, R. C., & Evans, N. J. 2012, ARA&A, 50, 531, doi: 10.1146/annurev-astro-081811-125610
- Konidaris et al. (2020) Konidaris, N. P., Rudie, G. C., Newman, A. B., et al. 2020, in Society of Photo-Optical Instrumentation Engineers (SPIE) Conference Series, Vol. 11447, Society of Photo-Optical Instrumentation Engineers (SPIE) Conference Series, 114471E
- Krug et al. (2010) Krug, H. B., Rupke, D. S. N., & Veilleux, S. 2010, ApJ, 708, 1145, doi: 10.1088/0004-637X/708/2/1145
- Lacy et al. (2020) Lacy, M., Baum, S. A., Chandler, C. J., et al. 2020, PASP, 132, 035001, doi: 10.1088/1538-3873/ab63eb
- Leclercq et al. (2022) Leclercq, F., Verhamme, A., Epinat, B., et al. 2022, arXiv e-prints, arXiv:2203.05614. https://arxiv.org/abs/2203.05614
- Lehner & Howk (2011) Lehner, N., & Howk, J. C. 2011, Science, 334, 955, doi: 10.1126/science.1209069
- Leitner & Kravtsov (2011) Leitner, S. N., & Kravtsov, A. V. 2011, ApJ, 734, 48, doi: 10.1088/0004-637X/734/1/48
- Li et al. (2020) Li, Y., Gendron-Marsolais, M.-L., Zhuravleva, I., et al. 2020, ApJ, 889, L1, doi: 10.3847/2041-8213/ab65c7
- Liu et al. (2013) Liu, G., Zakamska, N. L., Greene, J. E., Nesvadba, N. P. H., & Liu, X. 2013, MNRAS, 430, 2327, doi: 10.1093/mnras/stt051
- Lopez et al. (2018) Lopez, S., Tejos, N., Ledoux, C., et al. 2018, ArXiv e-prints. https://arxiv.org/abs/1801.10175
- Mandelker et al. (2020) Mandelker, N., van den Bosch, F. C., Nagai, D., et al. 2020, MNRAS, 498, 2415, doi: 10.1093/mnras/staa2421
- Martin et al. (2010) Martin, C., Moore, A., Morrissey, P., et al. 2010, in Proc. SPIE, Vol. 7735, Ground-based and Airborne Instrumentation for Astronomy III, 77350M
- Martin et al. (2012) Martin, C. L., Shapley, A. E., Coil, A. L., et al. 2012, ApJ, 760, 127, doi: 10.1088/0004-637X/760/2/127
- McDonald et al. (2010) McDonald, M., Veilleux, S., Rupke, D. S. N., & Mushotzky, R. 2010, ApJ, 721, 1262, doi: 10.1088/0004-637X/721/2/1262
- McDonald et al. (2012) McDonald, M., Bayliss, M., Benson, B. A., et al. 2012, Nature, 488, 349, doi: 10.1038/nature11379
- Moreno et al. (2021) Moreno, J., Torrey, P., Ellison, S. L., et al. 2021, MNRAS, 503, 3113, doi: 10.1093/mnras/staa2952
- Munari et al. (2013) Munari, E., Biviano, A., Borgani, S., Murante, G., & Fabjan, D. 2013, MNRAS, 430, 2638, doi: 10.1093/mnras/stt049
- Nelson et al. (2020) Nelson, D., Sharma, P., Pillepich, A., et al. 2020, MNRAS, 498, 2391, doi: 10.1093/mnras/staa2419
- Nesvadba et al. (2017) Nesvadba, N. P. H., Drouart, G., De Breuck, C., et al. 2017, A&A, 600, A121, doi: 10.1051/0004-6361/201629357
- Oppenheimer et al. (2018) Oppenheimer, B. D., Segers, M., Schaye, J., Richings, A. J., & Crain, R. A. 2018, MNRAS, 474, 4740, doi: 10.1093/mnras/stx2967
- O’Sullivan et al. (2020) O’Sullivan, D. B., Martin, C., Matuszewski, M., et al. 2020, ApJ, 894, 3, doi: 10.3847/1538-4357/ab838c
- Piqueras et al. (2017) Piqueras, L., Conseil, S., Shepherd, M., et al. 2017, ArXiv e-prints. https://arxiv.org/abs/1710.03554
- Poggianti et al. (2017) Poggianti, B. M., Jaffé, Y. L., Moretti, A., et al. 2017, Nature, 548, 304, doi: 10.1038/nature23462
- Punsly et al. (2016) Punsly, B., Marziani, P., Zhang, S., Muzahid, S., & O’Dea, C. P. 2016, ApJ, 830, 104, doi: 10.3847/0004-637X/830/2/104
- Putman (2017) Putman, M. E. 2017, An Introduction to Gas Accretion onto Galaxies, ed. A. Fox & R. Davé, Vol. 430, 1
- Putman et al. (2012) Putman, M. E., Peek, J. E. G., & Joung, M. R. 2012, ARA&A, 50, 491, doi: 10.1146/annurev-astro-081811-125612
- Qu et al. (2022) Qu, Z., Chen, H.-W., Rudie, G. C., et al. 2022, MNRAS, 516, 4882, doi: 10.1093/mnras/stac2528
- Rauch et al. (2016) Rauch, M., Becker, G. D., & Haehnelt, M. G. 2016, MNRAS, 455, 3991, doi: 10.1093/mnras/stv2555
- Rauch et al. (2011) Rauch, M., Becker, G. D., Haehnelt, M. G., et al. 2011, MNRAS, 418, 1115, doi: 10.1111/j.1365-2966.2011.19556.x
- Richards et al. (2006) Richards, G. T., Lacy, M., Storrie-Lombardi, L. J., et al. 2006, ApJS, 166, 470, doi: 10.1086/506525
- Robitaille & Bressert (2012) Robitaille, T., & Bressert, E. 2012, APLpy: Astronomical Plotting Library in Python, Astrophysics Source Code Library. http://ascl.net/1208.017
- Rubin (2017) Rubin, K. H. R. 2017, Gas Accretion Traced in Absorption in Galaxy Spectroscopy, ed. A. Fox & R. Davé, Vol. 430, 95
- Rubin et al. (2012) Rubin, K. H. R., Prochaska, J. X., Koo, D. C., & Phillips, A. C. 2012, ApJ, 747, L26, doi: 10.1088/2041-8205/747/2/L26
- Rupke et al. (2019) Rupke, D. S. N., Coil, A., Geach, J. E., et al. 2019, Nature, 574, 643, doi: 10.1038/s41586-019-1686-1
- Sato et al. (2009) Sato, T., Martin, C. L., Noeske, K. G., Koo, D. C., & Lotz, J. M. 2009, ApJ, 696, 214, doi: 10.1088/0004-637X/696/1/214
- Shen et al. (2011) Shen, Y., Richards, G. T., Strauss, M. A., et al. 2011, ApJS, 194, 45, doi: 10.1088/0067-0049/194/2/45
- Smolčić et al. (2018) Smolčić, V., Intema, H., Šlaus, B., et al. 2018, A&A, 620, A14, doi: 10.1051/0004-6361/201732336
- Soto et al. (2016) Soto, K. T., Lilly, S. J., Bacon, R., Richard, J., & Conseil, S. 2016, ZAP: Zurich Atmosphere Purge, Astrophysics Source Code Library. http://ascl.net/1602.003
- Stern et al. (2016) Stern, J., Faucher-Giguère, C.-A., Zakamska, N. L., & Hennawi, J. F. 2016, ApJ, 819, 130, doi: 10.3847/0004-637X/819/2/130
- Tacconi et al. (2013) Tacconi, L. J., Neri, R., Genzel, R., et al. 2013, ApJ, 768, 74, doi: 10.1088/0004-637X/768/1/74
- Tejos et al. (2014) Tejos, N., Morris, S. L., Finn, C. W., et al. 2014, MNRAS, 437, 2017, doi: 10.1093/mnras/stt1844
- Thatte et al. (2021) Thatte, N., Tecza, M., Schnetler, H., et al. 2021, The Messenger, 182, 7, doi: 10.18727/0722-6691/5215
- Tumlinson et al. (2017) Tumlinson, J., Peeples, M. S., & Werk, J. K. 2017, ARA&A, 55, 389, doi: 10.1146/annurev-astro-091916-055240
- van de Voort & Schaye (2012) van de Voort, F., & Schaye, J. 2012, MNRAS, 423, 2991, doi: 10.1111/j.1365-2966.2012.20949.x
- Vanzella et al. (2017) Vanzella, E., Balestra, I., Gronke, M., et al. 2017, MNRAS, 465, 3803, doi: 10.1093/mnras/stw2442
- Weilbacher et al. (2014) Weilbacher, P. M., Streicher, O., Urrutia, T., et al. 2014, in Astronomical Society of the Pacific Conference Series, Vol. 485, Astronomical Data Analysis Software and Systems XXIII, ed. N. Manset & P. Forshay, 451
- Weilbacher et al. (2020) Weilbacher, P. M., Palsa, R., Streicher, O., et al. 2020, A&A, 641, A28, doi: 10.1051/0004-6361/202037855
- Weiner et al. (2009) Weiner, B. J., Coil, A. L., Prochaska, J. X., et al. 2009, ApJ, 692, 187, doi: 10.1088/0004-637X/692/1/187
- Werk et al. (2014) Werk, J. K., Prochaska, J. X., Tumlinson, J., et al. 2014, ApJ, 792, 8, doi: 10.1088/0004-637X/792/1/8
- Zabl et al. (2019) Zabl, J., Bouché, N. F., Schroetter, I., et al. 2019, MNRAS, 485, 1961, doi: 10.1093/mnras/stz392
- Zabl et al. (2021) Zabl, J., Bouché, N. F., Wisotzki, L., et al. 2021, MNRAS, 507, 4294, doi: 10.1093/mnras/stab2165
- Zahedy et al. (2019) Zahedy, F. S., Chen, H.-W., Johnson, S. D., et al. 2019, MNRAS, 484, 2257. https://arxiv.org/abs/1809.05115
- Zakamska et al. (2006) Zakamska, N. L., Strauss, M. A., Krolik, J. H., et al. 2006, AJ, 132, 1496, doi: 10.1086/506986