\PHyear2022 \PHnumber174 \PHdate12 August
\ShortTitle production as a function of charged-particle multiplicity
\CollaborationALICE Collaboration \ShortAuthorALICE Collaboration
The measurement of (1S), (2S), and (3S) yields as a function of the charged-particle multiplicity density , using the ALICE experiment at the LHC, is reported in pp collisions at 13 TeV. The meson yields are measured at forward rapidity () in the dimuon decay channel, whereas the charged-particle multiplicity is defined at central rapidity (). Both quantities are normalized to their average value in minimum bias events. The increase of the self-normalized (1S), (2S), and (3S) yields is found to be compatible with a linear scaling with the self-normalized , within the uncertainties. The measured excited-to-ground state self-normalized yield ratios are compatible with unity within uncertainties. Similarly, the measured double ratio of the self-normalized (1S) to the self-normalized J/ yields, both measured at forward rapidity, is compatible with unity for self-normalized charged-particle multiplicity beyond one. The measurements are compared with theoretical predictions incorporating initial or final state effects.
1 Introduction
At the Large Hadron Collider (LHC) energies, our understanding of hadronic collisions has been challenged by the observation that a large class of phenomena, traditionally associated to the presence of a deconfined medium, shows indeed a smooth evolution from small colliding systems such as proton–proton (pp) and proton–lead (p–Pb) to large systems like lead–lead (Pb–Pb) [1, 2]. It is still actively debated whether these phenomena could be ascribed to the formation of a hot and dense medium in small systems (i.e. the quark–gluon plasma, QGP), or to other collective effects or specific QCD processes at play in high charged-particle multiplicity events, possibly associated to a peculiar initial state of the collision. Therefore it is important to characterize the initial state of the hadronic collisions (description of the colliding particles) and especially the mechanisms that can contribute to the production of high charged-particle multiplicity density events111 Here and in the rest of this Letter, “charged-particle multiplicity density” is defined as the number of charged particles produced per unit of pseudorapidity , where the pseudorapidity is defined as , being the polar angle of a particle momentum with respect to the beam axis.. One such mechanism is the multiparton interaction (MPI) which allows for the simultaneous occurrence of several incoherent binary partonic interactions in a single pp collision [3]. MPIs play a significant role in describing the soft component of the hadronic interactions, as confirmed by the measured charged-particle multiplicity distributions in pp collisions at the center-of-mass energies –8 TeV [4]. Based on this, event generators such as PYTHIA 8 [5, 6] and EPOS [7] currently highlight the importance of MPIs in building the charged-particle multiplicity distributions in hadronic interactions [8].
MPIs also affect the hard component in hadronic interactions. In this context, inclusive production processes are customarily described in a factorization approach, where the perturbative treatment of the early-stage hard-parton scattering processes, described by perturbative QCD (pQCD), is followed by the subsequent, soft-scale, hadronization of the scattered partons resulting in their binding into color-neutral states. Particularly for the production of quarkonium states, where several descriptions are available for the hadronization stage (e.g. the color singlet and color octet ones) [9, 10], it is interesting to study how MPIs could possibly affect the initial heavy-quark production especially at high charged-particle multiplicity densities [11].
Understanding the correlation between soft and hard components of high-multiplicity events in small collision systems like pp is, thus, fundamental to disentangle initial and final state effects affecting particle production, and to achieve a better understanding of MPIs or other possible underlying mechanisms [11]. The ALICE collaboration has already contributed to these studies by measuring quarkonium and open heavy-flavor self-normalized yields as a function of the self-normalized charged-particle multiplicity density222 The self-normalization is defined as the ratio of a given quantity over its average value., , in two different rapidity regions, with and without a rapidity gap between the hard probe and the charged particles, for center-of-mass energies of 5.02, 7 and 13 TeV [12, 13, 14, 15, 16]. Measurements with and without a rapidity gap between the hard probes and the charged particles can help to disentangle initial from final state effects as well as potential biases from the hard-scattering products in the charged-particle multiplicity.
In the charm sector, in particular, two different regimes, corresponding to central and forward rapidity regions, are observed in the existing ALICE measurements. When the hard process is measured in the central rapidity region, a faster than linear increase with respect to the charged-particle multiplicity density is observed for D mesons [13] and [14, 15], independently of the rapidity range of the multiplicity measurement. More specifically, the probability to produce a J/ is observed to increase by a factor in events reaching times the mean charged-particle multiplicity. A qualitatively similar, faster than linear increase is also reported by the STAR collaboration in events reaching up to times the mean charged-particle multiplicity, in pp collisions at a lower energy ( GeV), in the same rapidity region [17]. This departure from linearity is qualitatively (but in most cases not quantitatively) described by models through the implementation of mechanisms able to reduce soft particle production at the highest charged-particle multiplicity densities, without affecting the hard process production. This is achieved, in terms of final state effects, through the string percolation mechanism in the percolation model [18], and through small-system hydrodynamics within the EPOS event generator [7]. Alternative interpretations of the observed non-linearity have also been proposed in terms of initial state effects rather than final state effects. In this case, the main proposed mechanisms are the gluon saturation and the gluon field fluctuations. The gluon saturation is implemented within the Color-Glass Condensate (CGC) framework [19, 20] or as a component of the MPI formalism in the EPOS 3 event generator [21].The gluon field fluctuations are due either to higher Fock states increasing the number of gluons [22] or to a possible impact parameter dependence of the parton distribution functions [23, 24]. On the contrary, an almost linear correlation between the hard process yield and the charged-particle multiplicity density has been reported by ALICE in J/ and (2S) measurements at forward rapidity in pp collisions at , 7 and 13 TeV, with the multiplicity measurement defined at central rapidity [14, 12, 16]. PYTHIA 8 and EPOS event generators fail to describe the behavior of J/ and D-meson production in high-multiplicity events, both at central and forward rapidity, while a better description is provided by the percolation model and by models including gluon field fluctuations or saturation in the initial state. Moreover, most of the available models do not provide a simultaneous description of the different behaviors observed in the two rapidity regions [15, 12], with the exception of the aforementioned percolation model, and the approach involving gluon field fluctuations with higher Fock states.
Hard probe measurements as a function of charged-particle multiplicity in pp collisions are also available in the beauty sector, in particular for the bottomonium states (1S), (2S), and (3S). Studying the production of these states in a high charged-particle multiplicity environment, in the more general context of hadronic collisions, is of particular interest since excited states are characterized by lower binding energies than the ground state [10, 25, 26]. Hence, they are more sensitive to any possible dissociation mechanism at play in the final state, should these mechanisms be associated to the formation of a hot and dense medium (QGP) [27] or to final state interactions such as those implemented in comover models [28, 29]. As already discussed for charmonium measurements, bottomonium studies can also help to understand the peculiar regime of high charged-particle multiplicity density in small collision systems like pp. The CMS collaboration investigated the event-activity dependence of (nS) self-normalized production at central rapidity in pp collisions at [30] and 7 TeV [31]. A significant reduction of excited-to-ground-state ratios with increasing charged-particle multiplicity, and no dependence on the azimuthal angle separation between the charged particles and the momentum direction, were reported. The effect is found to be stronger in p–Pb collisions. At forward rapidity, the ALICE collaboration observed a suppression of the (1S) yields in p–Pb collisions at TeV with respect to the ones measured in pp collisions at the same center-of-mass energy [32]. Models based on coherent parton energy loss or interactions with comoving particles, including nuclear shadowing, fairly describe the data at forward (p-going) rapidity, while they tend to overestimate the nuclear modification factor at backward (Pb-going) rapidity. The (2S) nuclear modification factor has also been measured, showing a strong suppression, similar to the one measured for the (1S), both at backward and forward rapidities. Measurements of bottomonium production at both central and forward rapidities in various collision systems is essential to better characterize the initial and final state effects affecting particle production and their potential dependence on the charged-particle multiplicity density.
In this Letter, the measurements performed with the ALICE detector of the (1S), (2S), and (3S) yields, and excited-to-ground-state ratios, are reported as a function of charged-particle multiplicity density in pp collisions at 13 TeV. (nS) states are reconstructed in the dimuon decay channel at forward rapidity, whereas the charged-particle multiplicity density is estimated at central rapidity. This configuration enables a rapidity gap between the measurements of yield and charged-particle multiplicity density. Section 2 outlines the experimental apparatus and the data sample used in the analysis. Section 3 is devoted to the analysis. Section 4 presents and discusses the results in the current experimental and theoretical contexts. Finally, a summary and an outlook are given in Section 5.
2 Experimental apparatus and data sample
The ALICE apparatus is described in details in Refs. [33, 34]. The current analysis exploits three detectors: the V0 for triggering and event selection; the Silicon Pixel Detector (SPD) for the measurement of the primary vertex position and the charged-particle multiplicity at central rapidity; the Muon Spectrometer (MS) for the measurement of the signal in the decay channel at forward rapidity.
The V0 detector consists of two scintillator hodoscopes located on each side of the interaction point ( and ). It provides the minimum-bias (MB) trigger, requiring a signal in both hodoscopes. The SPD consists of two cylindrical layers, installed at a radius cm and cm from the beam axis, and covering the pseudorapidity ranges and , respectively. The number of SPD tracklets () is used for the estimation of the charged-particle multiplicity at central rapidity. Tracklets are defined as reconstructed line segments combining hits in the two SPD layers and pointing to the primary vertex.
The muons originating from decays are detected in the MS, covering the pseudorapidity range . Starting from the interaction point, the MS is made of five tracking stations composed of two planes of cathode pad chambers, the third one installed within the gap of a dipole magnet providing a 3 Tm integrated magnetic field, and two trigger stations composed of two planes of resistive plate chambers. A front absorber of interaction lengths () is placed between the interaction point and the first tracking station of the MS, to reduce the high rate of hadrons, which are further filtered by a 7.2 thick iron wall installed between the tracking and trigger stations. A low-angle conical absorber shields the MS from the secondary particles produced by the interaction of primary particles in the beam pipe along the entire length of the MS.
The results reported in this Letter are obtained using the data collected in pp collisions at TeV, recorded by ALICE during the LHC Run 2. The charged-particle multiplicity is measured for events in the INEL event class, defined by the presence of at least one charged-particle track in . The data used for the signal extraction were collected using a dimuon trigger, defined as the coincidence of a MB trigger and at least a pair of opposite-sign charge track segments reconstructed in the muon trigger system. The muon trigger system is configured333 Because of the design of the muon trigger system, the selection on the muon transverse momentum does not correspond to a sharp threshold value. The reported value is the one for which the trigger efficiency is %. to select muon tracks with a transverse momentum GeV/. The number of MB- and dimuon-triggered events used for this analysis are about 125 millions and 367 millions, respectively. These correspond to an integrated luminosity of about 2 nb-1 and 16 pb-1, respectively. The maximum interaction rate was such that the probability of more than one pp collision occurring in the same bunch crossing was about .
3 Analysis
The production of at forward rapidity is studied as a function of the charged-particle multiplicity measured at central rapidity. The yield (d/d) and the pseudorapidity charged-particle multiplicity density (d/d) are both measured for INEL events.
Beam–gas events are rejected using timing cuts on the signals of the two V0 hodoscopes and the correlation between the number of clusters and track segments reconstructed in the SPD. Only events satisfying specific quality criteria for the primary vertex determination were further selected for the analysis. In particular, the precision of the SPD vertex is required to be better than cm along the axis; the longitudinal interaction point position is required to be within cm in order to ensure a uniform acceptance of the SPD when counting the tracklets in the region . Pileup in the SPD integration time ( 300 ns) is reduced to a negligible contamination by removing events with multiple SPD vertices [35, 12].
The charged-particle multiplicity, d/d, is estimated by counting the number of SPD tracklets in . To take into account the SPD acceptance variation with time and with the vertex position in the data sample considered, a data-driven event-by-event correction method is applied, similar to the one described in Ref. [14]. This method consists in equalizing the measured profile to its maximum value (, where the correction term is smeared with a Poissonian distribution to mimic the event-by-event fluctuations. In the following, the tracklet multiplicity after the equalization procedure is referred to as the “corrected” tracklet multiplicity, .
The production of secondary particles, either coming from the decay of primary particles or their interaction with the detector volumes, leads to a difference between the number of reconstructed tracklets and the number of primary charged particles [15]. Using Monte Carlo (MC) simulations based on the PYTHIA 8.2 [36] and EPOS-LHC [7] event generators, the correlation between the corrected tracklet multiplicity , and the number of generated primary charged particles is determined [15]. The propagation of the simulated particles in the detector apparatus is done with GEANT 3 [37], followed by the same reconstruction procedure as for real data. An ad-hoc polynomial function , described in appendix A, is used to parametrize the correlation between and in the full range. Finally, the self-normalized multiplicity is defined as the ratio of the average charged-particle multiplicity density in the analysis multiplicity interval , /, to the average one:
| (1) |
where is the full pseudorapidity coverage considered for the measurement of the charged-particle multiplicity. The value of , averaged over all events with , is measured as (syst.) for pp collisions at TeV [38]. In the analysis discussed in this Letter, the events are grouped in classes: the resulting values of the self-normalized multiplicity for the considered event classes are summarized in Table 1.
The systematic uncertainty on the self-normalized charged-particle multiplicity contains four contributions, detailed in Table 2: the calculation of in every multiplicity interval; the fitting functions used to parametrize the correlation between the tracklets and the charged-particle multiplicities, referred to as “ vs. non-linearity”; the charged-particle multiplicity averaged over all events () and a correction to account for the vertex quality selection, affecting only the first multiplicity bin, .
The systematic uncertainties for the calculation of the come from the residual dependence of on , the dependence on the specific MC simulations, and the data-driven correction to the input profiles. The systematic uncertainty on the correlation encoded in the function , introduced in Eq. 1, is estimated by varying the range for the considered MC events ([, ], [, 0], [0, 5], [5, 10], and [, 10] cm) and the event generators (PYTHIA 8.2 (Monash 2013) and EPOS-LHC). The reference profile of the number of tracklets as a function of is also varied in the equalization procedure, considering both the profile obtained from the data and the one from the MC (PYTHIA 8.2 or EPOS-LHC). The multiplicity is calculated as the average, and its systematic uncertainty as the standard deviation, of the distribution of the values obtained by considering the combined options described above. The resulting systematic uncertainty on ranges within 0.4–2, depending on the multiplicity class.
The correlation between the tracklets and the charged-particle multiplicities is also studied with a linear fit function (), on top of the polynomial approach described above, both globally (for the whole multiplicity range) and in the considered multiplicity intervals. The factors and their uncertainties are computed by applying the same procedure as for the polynomial fit. In each multiplicity class, the difference originating by the usage of either the global or the bin-by-bin factor is considered as an additional systematic uncertainty on the self-normalized multiplicity, “ vs non-linearity” in Table 2, amounting to %, depending on the multiplicity class.
represents the charged-particle multiplicity averaged over all events. The value and its systematic uncertainty, of 1.6, are taken from an independent analysis [38].
In addition, the lowest multiplicity class is affected by the vertex quality selection, which removes very-low-multiplicity events. This effect is accounted for by dividing the value extracted for the first multiplicity interval by a correction factor (1.039), introducing an associated systematic uncertainty of 0.3. The efficiency of the event selection, for any multiplicity class other than the lowest one is close to unity, and has negligible uncertainty. All the aforementioned systematic uncertainties are added in quadrature and summarized in Table 2. Whenever the source has a dependence on multiplicity, the minimum and maximum uncertainties are indicated.
| Source | |
|---|---|
| vs. non-linearity | |
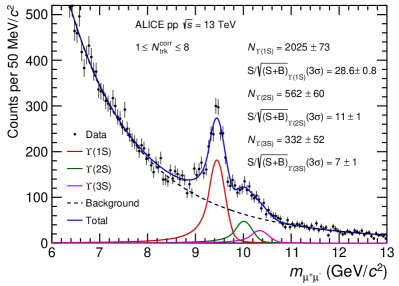
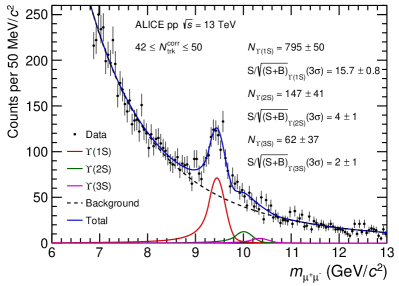
The mesons are reconstructed in their dimuon decay channel. The muon track selection is identical to that used in Ref. [39]. The reconstructed dimuons are selected within the rapidity range . The number of mesons is extracted from a log-likelihood fit to the invariant mass () distribution. The fit is performed modeling the 2-body decay peaks of the three (1S), (2S), and (3S) states with three Double Crystal Ball (DCB) functions [40], and three alternative parametrizations of the underlying continuum background, namely a variable-width Gaussian (VWG) [40], the product of two exponentials, or the product of an exponential and a power law function. The (1S) mass peak position and width are left free when fitting the multiplicity-integrated sample, while the DCB tail parameters are fixed to the values obtained from MC simulations. Due to the limited size of the available sample, in the individual multiplicity classes the (1S) mass peak position and width are fixed to the values obtained in the multiplicity-integrated fit. The peak position and the width of the (2S) and (3S) signals are both linked to the (1S) ones, through the ratio of the corresponding masses taken from the Particle Data Group [41]. Considering the significance condition () for each state in the selected multiplicity class, the highest intervals in which the measurement is significant are for (1S) and (2S) and for (3S), corresponding to a self-normalized multiplicity of (syst.) and (syst.), respectively, as reported in Table 1.
The self-normalized yield of , i.e. the yield in a given multiplicity interval normalized to the multiplicity-integrated value, is evaluated as
| (2) |
where and are the number of reconstructed candidates and the equivalent number of MB events for the dimuon-triggered sample analyzed, respectively. The ratio is the fraction of the MB cross section corresponding to multiplicity class , and is calculated from the MB-triggered sample, as . The correction for is independent of multiplicity in the measured intervals, therefore, this factor cancels out for the self-normalized yield measurement. The and factors are meant to account for the possible event and signal losses due to the event selections. These corrections include contributions from the efficiency of the MB trigger for events satisfying the selection, vertex quality selection (), and pileup rejection (), same as in Ref. [12]. Finally, it is worth noticing that the integrated number of MB events includes events with zero tracklets ( events): to remove this contamination, a specific correction factor () is applied, as estimated from MC simulations. The values of all efficiency correction factors for the integrated case over multiplicity, as well as for the lowest multiplicity interval, are summarized in Table 3.
| Efficiency | Value |
|---|---|
The systematic uncertainty on the self-normalized yield results from four contributions, shown in Table 4. The systematic uncertainty on the signal extraction is evaluated by considering three alternative background shapes — a VWG, the product of two exponentials, and the product of an exponential and a power law function — and three alternative invariant mass fit ranges — [6, 13], [5, 14], and [7, 12] GeV/. In addition, when extracting the signal in multiplicity classes, the (1S) mean mass and width, extracted from the multiplicity-integrated fit, are varied within their uncertainties. The raw yield ratio of / for each multiplicity class , and the corresponding systematic uncertainty, are calculated as the average and the standard deviation of the results corresponding to the various options considered for the signal extraction. The MB trigger efficiency () affects the yields of the lowest and the integrated multiplicity classes with an associated systematic uncertainty of 1 () and 0.5 (), respectively. The contamination efficiency factor , mentioned before, is characterized by an associated systematic uncertainty of 2%, while the systematic uncertainty for the vertex quality correction () and the pileup rejection () are both found to be negligible. As a further test, the ratio was evaluated using the number of dimuon triggers and the trigger rejection factors in each multiplicity class, as detailed in Ref. [12], resulting in a negligible difference (0.02%) with respect to the approach considered in the present analysis.
All the aforementioned systematic uncertainties are added in quadrature and are reported in the bottom part of Table 4 as the total systematic uncertainty for each upsilon state; whenever the source implies a dependence on multiplicity, the minimum and maximum uncertainties are indicated.
| Source | |
|---|---|
| (1S) signal extraction | |
| (2S) signal extraction | |
| (3S) signal extraction | |
4 Results and discussion
The self-normalized yields, , as a function of the self-normalized charged-particle multiplicity density, , for the three (1S), (2S), and (3S) states, measured for , and obtained for the first time in pp collisions at TeV, are shown in Fig. 2. The bottom panel of Fig. 2 shows the double ratio of the self-normalized yields to the self-normalized multiplicity: the almost linear scaling observed in the top panel of the figure results in a flat trend of the double ratios for the three states, within the current uncertainties. The measurements are compared with the available theoretical models as shown in Fig. 3. At multiplicities up to 4 times the mean multiplicity, no relevant difference is observed between the PYTHIA 8.2 configurations, including feed-down, with or without color reconnection (CR) which fairly describe the observed linear scaling. The implementation of the MPI mechanism corresponds to the simple scaling . The PYTHIA color reconnection scenario is a final state effect at play with MPI where strings are merged based on a QCD full color flow calculation with a loose modeling of dynamical effect via a global saturation [42]. CR might have an impact both on the charged particle multiplicity and the correlation to the produced hard probe. At larger multiplicities, PYTHIA computations for the (1S) deviate from the linear scaling, suggesting a weakening of the dependence of the self-normalized bottomonium yield on the charged-particle multiplicity for increasing values of the latter. Computations from coherent particle production (CPP) [43] are also displayed: in this framework, high-multiplicity hadronic collisions are parameterized on equal footing regardless of the specific pp, p–A, or A–A system, allowing one to take into account features associated to nuclear effects. This is done by a phenomenological parametrization for mean multiplicities of light hadrons and quarkonia, assuming a linear dependence with the number of binary nucleon–nucleon interactions in p–A collisions. This model also takes into account the possible mutual boosting of the gluon densities and saturation scales in the colliding protons, induced by MPIs in a high-multiplicity environment, affecting the hard process production mechanisms (prompt production) [44]. The model is defined for , corresponding to at least one nucleon–nucleon collision, therefore the model predictions and curves start at . Its uncertainties are inherited from the experimental uncertainties of the p–A measurements used to extract the model parameters. The CPP computations qualitatively describe the observed behavior within the current large theoretical and experimental uncertainties. In the computation with the CGC approach of Ref. [20], the probability to produce charmonia and bottomonia increases via a sizeable contribution of the multipomeron mechanism and especially the 3-pomeron term. It is enhanced, at high energy, thanks to additional t-channel gluons due to the increased gluon densities. The 3-pomeron CGC computation overestimates the measured dependence of (1S) for the highest multiplicities reached, while no firm conclusion can be established for the excited states due to the large experimental uncertainties. It has to be noted that, despite the recent progress in the simultaneous computation or modelization of the soft and the hard components of hadronic interactions, there is a general lack of predictions available for bottomonium studies, except the PYTHIA 8.2, CPP and CGC in the 3-pomeron approach computations considered in this Letter. In particular, at the time of writing, predictions concerning bottomonium production are neither available in EPOS [7], nor in the already cited percolation model [18]. Computations from CPP are not available for the (3S) due to a lack of experimental measurements needed to extract the model parameters.
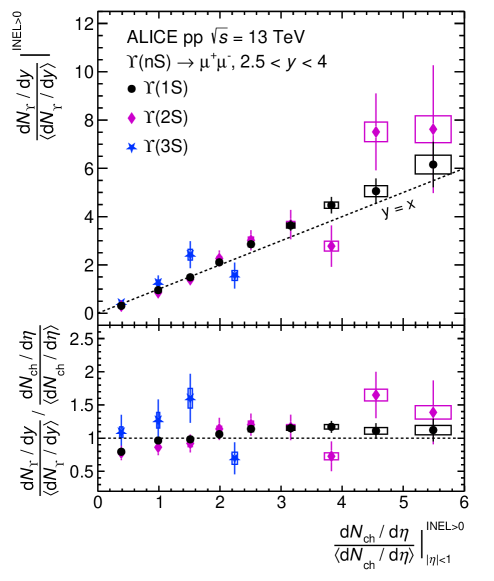
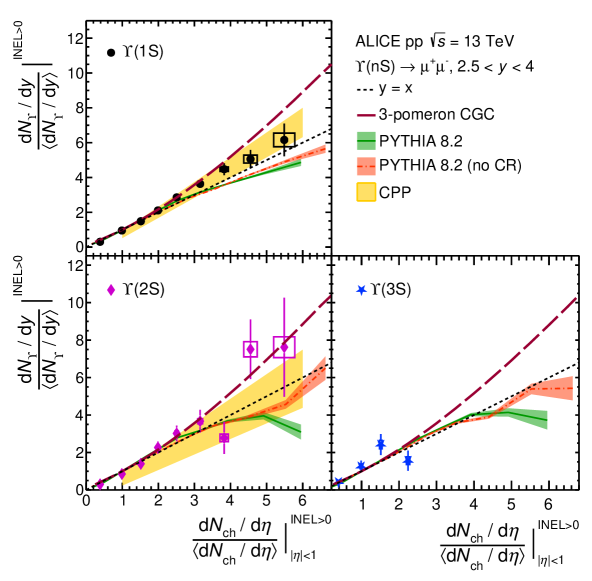
Figure 4 presents the excited-to-ground state self-normalized yield ratios as a function of the self-normalized charged-particle multiplicity. A large fraction of the systematic uncertainties affecting the self-normalized yield of (nS) states as a function of the self-normalized charged-particle multiplicity, dominated by signal extraction, cancels in the excited-to-ground state ratios. The excited-to-ground state ratio of (2S) to (1S), shown in Fig. 4 (top panel), is compatible with unity within the current uncertainties up to six times the mean charged-particle multiplicity. The measurement is compared with computations from PYTHIA 8.2, predicting a ratio close to unity at high multiplicity, independently of the considered color reconnection scenario. Calculations from CPP and 3-pomeron CGC are also compatible with a ratio close to unity, within large uncertainties. The measurement is also compared with computations from the comover scenario [28, 29] in which quarkonia are dissociated in the final state by interactions with surrounding comoving particles. Dissociation only arises in the final state of the interactions, and its rate is linked to the binding energy of the considered quarkonium state, and to the comover density. This last parameter also determines the uncertainties of the model. Feed-down contributions are taken into account in the computation. In the comover approach only excited-to-ground state ratios can be computed. A decrease of 20 to 40 over the covered multiplicity range is predicted by this approach for the (2S)-to-(1S) ratio. It is worth noting that the CMS experiment reports a decrease of the direct (2S)-to-(1S) ratio as a function of the number of tracks when both quantities are measured in the central rapidity region in pp collisions at TeV [30] and 7 TeV [31]. On the contrary, when the measurement is performed with a rapidity gap between the (nS) states () and the transverse energy measurement as an estimator of event activity (), a much less pronounced decrease is observed in the ratio between the production yields of the two states [30]. Figure 4 (bottom panel) shows the excited-to-ground state ratio of (3S) to (1S). The measurement is compatible with unity within the large uncertainties and with the almost flat trend predicted by PYTHIA 8.2, regardless of the considered color reconnection scenario, and by 3-pomeron CGC computations. It is interesting to note that, on the contrary, the comover scenario predicts a dissociation of (3S) states leading to a large suppression at high charged-particle multiplicity ( times the mean multiplicity). For the (2S) and (3S) states, the discrepancy between data and the predictions of the comover model amounts to 1.8 and 1.7 sigmas, at most. Firm conclusions on the presence or absence of a final state dissociation due to comoving particles would require further investigation based on larger data samples. The ALICE collaboration reported excited-to ground state ratio in the charm sector: -to-J/ ratio [16]. This ratio is found to be compatible with 1 with the current systematic and statistical uncertainties up to 6 times the mean multiplicity. The excited-to-ground state ratio in the charm and the beauty sector suggest no or low dependence of the measured correlation with the binding energy of the state.
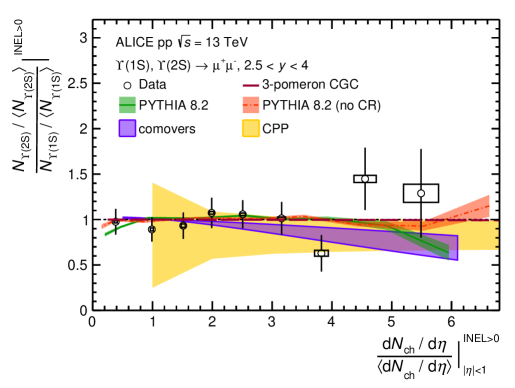
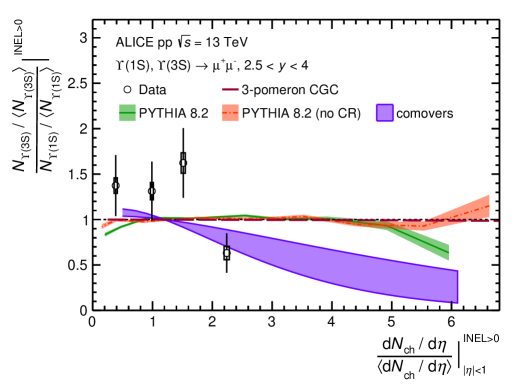
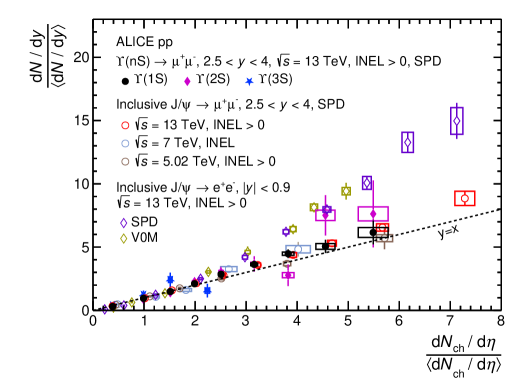
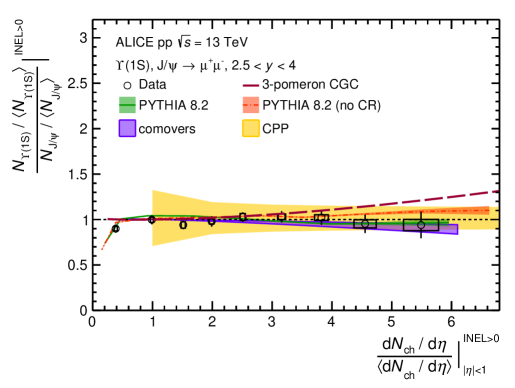
Figure 5 (top panel) presents the results discussed in this Letter for the (1S), (2S), and (3S), compared with other quarkonium measurements by ALICE, namely J/ measurements in the forward rapidity region at 5.02 TeV [12], 7 TeV [14], and 13 TeV [12], exploiting the same multiplicity estimator as in the present analysis (event classification based on the SPD tracklet multiplicity). A corresponding measurement is also available for the [16], showing a similar trend of the production yield with multiplicity as for the J/. The (1S) self-normalized production yield also presents a similar scaling with the self-normalized charged-particle multiplicity density as the J/, independently of the collision energy at which the J/ measurement is performed. This is further investigated, at TeV, in Fig. 5 (bottom panel), by presenting the double ratio of (1S) to J/ self-normalized yield as a function of the self-normalized charged-particle multiplicity. The double ratio is close to unity for , indicating no modification of the correlation with respect to mass and quark content up to six times the mean multiplicity. The ratio is also compared to the various available models, namely PYTHIA 8.2 with and without CR [5], the comovers model [28, 29], the model by CPP [43], and the computation of the 3-pomeron contribution in the CGC approach by [20]. The considered models, except for 3-pomeron CGC, provide predictions close to unity over the whole charged-particle multiplicity range considered, suggesting that both initial and final state effects act on (1S) and J/ in a similar way. The first data point in Fig. 5 (bottom panel) departs from the main trend discussed above by about two standard deviations, hinting that the double ratio is smaller than unity for . A possible mechanism explaining this behaviour invokes an event activity bias: events containing a (1S) are, on average, biased towards higher event activities than events containing a J/, this behavior being driven by the mass difference of the two particles. The same mechanism could be expected when going from (1S) to (2S), and (3S) states, currently not visible due to the relatively small mass difference between the three states, and the limited statistical significance of the higher-state measurements. In the 3-pomeron CGC computation, the increase of the (1S) yield as a function of charged-particle multiplicity is expected to be faster than for J/ due to mass dependent higher twist effects, expected to be small and mainly visible at high multiplicities. This accounts for the upward deviation from unity seen at large multiplicities in the 3-pomeron CGC computations. This interpretation is not favored by the measurement.
J/ measurements are also performed in ALICE in another kinematic range, with the J/ decaying into dielectrons at central rapidity (). In this case, the charged-particle multiplicity density is measured using two alternative estimators, defined respectively in the central rapidity region (SPD-based selection) or at forward rapidity (V0-based selection) [15]. The corresponding results are also shown in Fig. 5 (left panel). No difference is observed in the multiplicity dependence of the J/ production measured at central rapidity, corresponding to the two multiplicity estimators, up to five times the mean multiplicity. Conversely, a clear difference is observed between the central rapidity J/ measurement and the forward rapidity J/ as also expected from several models [15, 12]. At forward rapidity, the (1S) and J/ measurements show a similar linear behavior, whereas the (2S) is compatible with both faster than linear and linear behaviors within the current uncertainties, and a larger data sample is needed to draw firm conclusions.
5 Conclusions
The measurement of (1S), (2S), and (3S) production as a function of the charged-particle multiplicity density in pp collisions at TeV, performed with the ALICE apparatus, is presented in this Letter. The (nS) states are measured in the dimuon decay channel in the forward rapidity region , while the charged-particle multiplicity measurement is performed at central rapidity . In this rapidity configuration, the self-normalized hard process production yield and the self-normalized charged-particle multiplicity density is compatible with a linear correlation with a slope of unity within the current uncertainties. This behavior is qualitatively reproduced by PYTHIA 8.2 up to four times the mean multiplicity regardless of the considered color reconnection scenario, as well as by a computation from CPP, which includes nuclear-like effects and gluon saturation in the initial state, and by the 3-pomeron CGC approach. At higher multiplicities, the theoretical computations diverge — the 3-pomeron CGC tends to overestimate the observed trend, while PYTHIA 8.2 underestimates it.
The ratios of the self-normalized yields of (2S) and (3S) to (1S) are compatible with unity in the explored multiplicity range within the large statistical uncertainties, and in agreement with the predictions of PYTHIA 8.2, CPP and 3-pomeron CGC. However, due to the large uncertainties, the present measurement can neither confirm nor exclude a final state suppression of the (2S) and (3S) states at high multiplicity, as predicted by the comover scenario. The self-normalized yield ratio of (1S) over J/ as a function of self-normalized charged-particle multiplicity is close to unity for and described both by computations involving initial state effects (CPP, and PYTHIA 8.2 without color reconnection), and final state effects, such as the model by comovers and PYTHIA 8.2 with color reconnection. The 3-pomeron CGC approach is disfavored. An improved statistical precision of the measurements of excited states in the charmonium sector, with respect to the currently available ones [16], would also contribute in properly assessing the validity of the comover model.
As a final remark, it should be noted that the measurements reported in this Letter on bottomonium states have a limited statistical significance, preventing firm conclusions to be drawn on the origin of the measured correlation (initial vs. final state effects). A better understanding of quarkonium production in a dense hadronic environment is a challenge requiring higher-precision and more differential measurements, which will be reached with the upgraded ALICE apparatus [45, 46, 47, 48, 49] during the LHC Run 3.
References
- [1] Z. Citron et al., “Future physics opportunities for high-density QCD at the LHC with heavy-ion and proton beams”, CERN Yellow Rep. Monogr. 7 (2019) 1159–1410, arXiv:1812.06772 [hep-ph].
- [2] C. Loizides, “Experimental overview on small collision systems at the LHC”, Nucl. Phys. A 956 (2016) 200–207, arXiv:1602.09138 [nucl-ex].
- [3] T. Sjöstrand and M. van Zijl, “A Multiple Interaction Model for the Event Structure in Hadron Collisions”, Phys. Rev. D 36 (1987) 2019.
- [4] ALICE Collaboration, J. Adam et al., “Charged-particle multiplicities in proton–proton collisions at to 8 TeV”, Eur. Phys. J. C 77 no. 1, (2017) 33, arXiv:1509.07541 [nucl-ex].
- [5] T. Sjöstrand, S. Mrenna and P. Z. Skands, “A Brief Introduction to PYTHIA 8.1”, Comput. Phys. Commun. 178 (2008) 852–867, arXiv:0710.3820 [hep-ph].
- [6] S. G. Weber, A. Dubla, A. Andronic, and A. Morsch, “Elucidating the multiplicity dependence of production in proton–proton collisions with PYTHIA8”, Eur. Phys. J. C 79 no. 1, (2019) 36, arXiv:1811.07744 [nucl-th].
- [7] T. Pierog, I. Karpenko, J. M. Katzy, E. Yatsenko, and K. Werner, “EPOS LHC: Test of collective hadronization with data measured at the CERN Large Hadron Collider”, Phys. Rev. C 92 no. 3, (2015) 034906, arXiv:1306.0121 [hep-ph].
- [8] E. Cuautle, E. Dominguez, and I. Maldonado, “Extraction of multiple parton interactions and color reconnection from forward-backward multiplicity correlations”, Eur. Phys. J. C 79 no. 7, (2019) 626, arXiv:1907.08706 [hep-ph].
- [9] J.-P. Lansberg, “New Observables in Inclusive Production of Quarkonia”, Phys. Rept. 889 (2020) 1–106, arXiv:1903.09185 [hep-ph].
- [10] A. Andronic et al., “Heavy-flavour and quarkonium production in the LHC era: from proton–proton to heavy-ion collisions”, Eur. Phys. J. C 76 no. 3, (2016) 107, arXiv:1506.03981 [nucl-ex].
- [11] S. Porteboeuf and R. Granier de Cassagnac, “ yield vs. multiplicity in proton-proton collisions at the LHC”, Nucl. Phys. B Proc. Suppl. 214 (2011) 181–184, arXiv:1012.0719 [hep-ex].
- [12] ALICE Collaboration, S. Acharya et al., “Forward rapidity J/ production as a function of charged-particle multiplicity in pp collisions at 5.02 and 13 TeV”, arXiv:2112.09433 [nucl-ex].
- [13] ALICE Collaboration, J. Adam et al., “Measurement of charm and beauty production at central rapidity versus charged-particle multiplicity in proton-proton collisions at TeV”, JHEP 09 (2015) 148, arXiv:1505.00664 [nucl-ex].
- [14] ALICE Collaboration, B. Abelev et al., “J/ Production as a Function of Charged Particle Multiplicity in pp Collisions at TeV”, Phys. Lett. B 712 (2012) 165–175, arXiv:1202.2816 [hep-ex].
- [15] ALICE Collaboration, S. Acharya et al., “Multiplicity dependence of J/ production at midrapidity in pp collisions at = 13 TeV”, Phys. Lett. B 810 (2020) 135758, arXiv:2005.11123 [nucl-ex].
- [16] ALICE Collaboration, S. Acharya et al., “Measurement of (2S) production as a function of charged-particle pseudorapidity density in pp collisions at = 13 TeV and p-Pb collisions at = 8.16 TeV with ALICE at the LHC”, arXiv:2204.10253 [nucl-ex].
- [17] STAR Collaboration, J. Adam et al., “J production cross section and its dependence on charged-particle multiplicity in p + p collisions at = 200 GeV”, Phys. Lett. B 786 (2018) 87–93, arXiv:1805.03745 [hep-ex].
- [18] E. G. Ferreiro and C. Pajares, “High multiplicity pp events and J production at LHC”, Phys. Rev. C 86 (2012) 034903, arXiv:1203.5936 [hep-ph].
- [19] Y.-Q. Ma, P. Tribedy, R. Venugopalan, and K. Watanabe, “Event engineering studies for heavy flavor production and hadronization in high multiplicity hadron-hadron and hadron-nucleus collisions”, Phys. Rev. D 98 no. 7, (2018) 074025, arXiv:1803.11093 [hep-ph].
- [20] E. Levin, I. Schmidt, and M. Siddikov, “Multiplicity dependence of quarkonia production in the CGC approach”, Eur. Phys. J. C 80 no. 6, (2020) 560, arXiv:1910.13579 [hep-ph].
- [21] K. Werner, B. Guiot, I. Karpenko, and T. Pierog, “Analysing radial flow features in p-Pb and p-p collisions at several TeV by studying identified particle production in EPOS3”, Phys. Rev. C 89 no. 6, (2014) 064903, arXiv:1312.1233 [nucl-th].
- [22] B. Z. Kopeliovich, H. J. Pirner, I. K. Potashnikova, K. Reygers, and I. Schmidt, “J/ in high-multiplicity pp collisions: Lessons from pA collisions”, Phys. Rev. D 88 no. 11, (2013) 116002, arXiv:1308.3638 [hep-ph].
- [23] L. Frankfurt, M. Strikman, D. Treleani, and C. Weiss, “Evidence for color fluctuations in the nucleon in high-energy scattering”, Phys. Rev. Lett. 101 (2008) 202003, arXiv:0808.0182 [hep-ph].
- [24] M. Strikman, “Transverse structure of the nucleon and multiparton interactions”, Prog. Theor. Phys. Suppl. 187 (2011) 289–296.
- [25] S. Digal, P. Petreczky, and H. Satz, “Quarkonium feed down and sequential suppression”, Phys. Rev. D 64 (2001) 094015, arXiv:hep-ph/0106017.
- [26] B. Krouppa, R. Ryblewski, and M. Strickland, “Bottomonia suppression in 2.76 TeV Pb-Pb collisions”, Phys. Rev. C 92 no. 6, (2015) 061901, arXiv:1507.03951 [hep-ph].
- [27] ALICE Collaboration, S. Acharya et al., “ suppression at forward rapidity in Pb-Pb collisions at = 5.02 TeV”, Phys. Lett. B 790 (2019) 89–101, arXiv:1805.04387 [nucl-ex].
- [28] E. G. Ferreiro, “Excited charmonium suppression in proton–nucleus collisions as a consequence of comovers”, Phys. Lett. B 749 (2015) 98–103, arXiv:1411.0549 [hep-ph].
- [29] A. Esposito, E. G. Ferreiro, A. Pilloni, A. D. Polosa, and C. A. Salgado, “The nature of from high-multiplicity collisions”, arXiv:2006.15044 [hep-ph].
- [30] CMS Collaboration, S. Chatrchyan et al., “Event Activity Dependence of Y(nS) Production in =5.02 TeV pPb and =2.76 TeV pp Collisions”, JHEP 04 (2014) 103, arXiv:1312.6300 [nucl-ex].
- [31] CMS Collaboration, A. M. Sirunyan et al., “Investigation into the event-activity dependence of (nS) relative production in proton-proton collisions at = 7 TeV”, JHEP 11 (2020) 001, arXiv:2007.04277 [hep-ex].
- [32] ALICE Collaboration, S. Acharya et al., “ production in p–Pb collisions at =8.16 TeV”, Phys. Lett. B 806 (2020) 135486, arXiv:1910.14405 [nucl-ex].
- [33] ALICE Collaboration, K. Aamodt et al., “The ALICE experiment at the CERN LHC”, JINST 3 (2008) S08002.
- [34] ALICE Collaboration, B. Abelev et al., “Performance of the ALICE experiment at the CERN LHC”, Int. J. Mod. Phys. A 29 (2014) 1430044, arXiv:1402.4476 [nucl-ex].
- [35] ALICE Collaboration, J. Adam et al., “Charged-particle multiplicities in proton–proton collisions at to 8 TeV”, Eur. Phys. J. C 77 no. 1, (2017) 33, arXiv:1509.07541 [nucl-ex].
- [36] T. Sjöstrand, S. Ask, J. R. Christiansen, R. Corke, N. Desai, P. Ilten, S. Mrenna, S. Prestel, C. O. Rasmussen, and P. Z. Skands, “An introduction to PYTHIA 8.2”, Comput. Phys. Commun. 191 (2015) 159–177, arXiv:1410.3012 [hep-ph].
- [37] R. Brun, F. Bruyant, F. Carminati, S. Giani, M. Maire, A. McPherson, G. Patrick, and L. Urban, GEANT: Detector Description and Simulation Tool; Oct 1994. CERN Program Library. CERN, Geneva, 1993. https://cds.cern.ch/record/1082634.
- [38] ALICE Collaboration, S. Acharya et al., “Pseudorapidity distributions of charged particles as a function of mid- and forward rapidity multiplicities in pp collisions at = 5.02, 7 and 13 TeV”, Eur. Phys. J. C 81 no. 7, (2021) 630, arXiv:2009.09434 [nucl-ex].
- [39] ALICE Collaboration, S. Acharya et al., “Search for collectivity with azimuthal J/-hadron correlations in high multiplicity p-Pb collisions at = 5.02 and 8.16 TeV”, Phys. Lett. B 780 (2018) 7–20, arXiv:1709.06807 [nucl-ex].
- [40] ALICE Collaboration, S. Acharya et al., “Measurement of elliptic flow at forward rapidity in Pb-Pb collisions at TeV”, Phys. Rev. Lett. 123 no. 19, (2019) 192301, arXiv:1907.03169 [nucl-ex].
- [41] Particle Data Group Collaboration, P. Zyla et al., “Review of Particle Physics”, PTEP 2020 no. 8, (2020) 083C01.
- [42] J. R. Christiansen and P. Z. Skands, “String Formation Beyond Leading Colour”, JHEP 08 (2015) 003, arXiv:1505.01681 [hep-ph].
- [43] B. Z. Kopeliovich, H. J. Pirner, I. K. Potashnikova, K. Reygers, and I. Schmidt, “Heavy quarkonium in the saturated environment of high-multiplicity pp collisions”, Phys. Rev. D 101 no. 5, (2020) 054023, arXiv:1910.09682 [hep-ph].
- [44] B. Z. Kopeliovich, H. J. Pirner, I. K. Potashnikova, and I. Schmidt, “Mutual boosting of the saturation scales in colliding nuclei”, Phys. Lett. B 697 (2011) 333–338, arXiv:1007.1913 [hep-ph].
- [45] ALICE Collaboration, B. Abelev et al., “Technical Design Report for the Upgrade of the ALICE Inner Tracking System”, J. Phys. G 41 (2014) 087002.
- [46] ALICE Collaboration, G. Martinez-Garcia and W. Riegler, “Technical Design Report for the Muon Forward Tracker”, tech. rep., CERN-LHCC-2015-001, ALICE-TDR-018, 2015. https://cds.cern.ch/record/1981898.
- [47] ALICE Collaboration, R. Münzer, “Upgrade of the ALICE Time Projection Chamber”, Nucl. Instrum. Meth. A 958 (2020) 162058.
- [48] ALICE Collaboration, P. Antonioli, A. Kluge, and W. Riegler, “Upgrade of the ALICE Readout and Trigger System”, tech. rep., CERN-LHCC-2013-019, ALICE-TDR-015, 2013. https://cds.cern.ch/record/1603472.
- [49] ALICE Collaboration, P. Buncic, M. Krzewicki, and P. Vande Vyvre, “Technical Design Report for the Upgrade of the Online-Offline Computing System”, tech. rep., CERN-LHCC-2015-006, ALICE-TDR-019, 2015. https://cds.cern.ch/record/2011297.
Appendix A Polynomial function
An ad-hoc polynomial fitting function is used to describe the relation between the number of tracklets and charged-particle multiplicity, namely:
| (3) | |||
| (4) |
where,
,
| (5) |
where, is the number of events in each bin taken from data.