Priorities in gravitational waveforms for future space-borne detectors: vacuum accuracy or environment?
Abstract
In preparation for future space-borne gravitational-wave (GW) detectors, should the modelling effort focus on high-precision vacuum templates or on the astrophysical environment of the sources? We perform a systematic comparison of the phase contributions caused by 1) known environmental effects in both gaseous and stellar matter backgrounds, or 2) high-order post-Newtonian (PN) terms in the evolution of mHz GW sources during the inspiral stage of massive binaries. We use the accuracy of currently available analytical waveform models as a benchmark value, finding the following trends: the largest unmodelled phase contributions are likely environmental rather than PN for binaries lighter than M☉, where is the redshift. Binaries heavier than M☉ do not require more accurate inspiral waveforms due to low signal-to-noise ratios (SNRs). For high-SNR sources, environmental phase contributions are relevant at low redshift, while high-order vacuum templates are required at . Led by these findings, we argue that including environmental effects in waveform models should be prioritised in order to maximize the science yield of future mHz detectors.
keywords:
black hole physics – gravitational waves – methods: analytical.1 Challenges and opportunities in the millihertz band
From the early post-Newtonian (PN) results (see, e.g. Damour & Deruelle, 1985; Damour et al., 1991; Jaranowski & Schäfer, 1998, 1999), formalisms such as the effective-one-body (see, e.g. Buonanno & Damour, 1999; Damour, 2001; Barack et al., 2010; Akcay et al., 2012; Pan et al., 2014; Ossokine et al., 2020) and self-force perturbation theory (see, e.g. Teukolsky, 1973; Quinn & Wald, 1997; Burko, 2004; Gralla & Wald, 2011; Lackeos & Burko, 2012), combined with advances in numerical relativity (see, e.g. Pretorius, 2005; Ajith et al., 2011; Pürrer, 2014; Szilágyi et al., 2015), have pushed the validity of analytical waveform templates to higher and higher orders. In combination with Bayesian inference techniques, they have made it possible to extract an impressive amount of information from gravitational-wave (GW) events detected by the Laser Interferometer GW Observatory (LIGO; see, e.g. Abbott et al., 2019; Chatziioannou et al., 2019; Romero-Shaw et al., 2020; Islam et al., 2021). Now, the promise of space-borne mHz detectors in the early 2030s is breathing new life into the waveform modelling effort. Sources of GWs in the mHz band present ulterior challenges with respect to the ones routinely detected by ground-based observatories. Firstly, crucial parameters such as mass and mass ratio can vary by several orders of magnitude. Secondly, signal-to-noise ratios (SNRs) of several thousands are expected for appropriate sources (see, e.g. Amaro-Seoane et al., 2017). These effects combined greatly increase the accuracy and breadth demands of the required waveform templates, motivating several research programmes with the aim of developing more sophisticated analytical approximations as well as expanding the parameter space in which numerical relativity is viable (see, e.g. Lousto & Healy, 2022; Nagar et al., 2022, for some recent work). As an interesting recent example, template formalisms based on the PN and post-Minkowskian series have benefited from a recent influx of particle physics techniques (see, e.g. Bern et al., 2019; Mogull et al., 2021; Buonanno et al., 2022), which are rapidly succeeding in computing high-order terms.
A further, crucial difference between Hz and mHz binary sources is that the latter are more likely to be affected by their astrophysical environment. The presence of gas and massive third bodies can influence the source’s evolution within the mHz band, confounding expectations based on vacuum templates, limiting the effectiveness of parameter estimation (and thus tests of general relativity), and introducing spurious biases (see, e.g. Barausse & Rezzolla 2008; Gair et al. 2013; Barausse et al. 2014; Chen et al. 2020; Caputo et al. 2020). Conversely, detecting these deviations represents a unique opportunity to measure properties of the source’s environment (from constraining accretion disc physics to detecting dark matter and exoplanets; see, e.g. Chakrabarti 1993; Inayoshi et al. 2017; Tamanini & Danielski 2019; Derdzinski et al. 2019; Cardoso & Maselli 2020a; Derdzinski et al. 2021; Zwick et al. 2022; Speri et al. 2022; Coogan et al. 2022). A question is often posed in the context of the scientific groundwork required for missions such as the Laser Interferometer Space Antenna (LISA; Barack et al. 2019; Thorpe et al. 2019; Amaro-Seoane et al. 2022) and TianQin (Luo et al., 2016; Mei et al., 2021): what is the relative importance of the environment with respect to the vacuum evolution of a GW source? In this work, we aim to to provide a simple but general framework to estimate the relative importance of environmental effects without needing to specify any particular waveform model. We apply this framework to analyse massive black hole (BH) binaries of varying mass and mass ratio, since they are often considered to be largely unaffected by their environments while radiating GWs in the mHz band.
2 Comparing the phase of gravitational waves
2.1 Vacuum waveforms
The ability of a waveform template to accurately match the phase of a real signal is a crucial benchmark with regards to its accuracy. Over the course of an observation, the total phase of a GW is determined by the source’s frequency evolution, . It reads (see, e.g. Cutler & Flanagan, 1994)
| (1) |
where is the observed GW frequency, is the rest frame frequency at a redshift , is the frequency at which the GW source enters a detector band, and is the maximum frequency reached within the observation window. Sophisticated waveform models expand upon the historical result derived in Peters & Mathews (1963) by including contributions from higher-order GW modes as well as PN corrections in the frequency evolution (see, e.g. Blanchet, 2014):
| (2) |
where is the binary’s total mass, its mass ratio, its characteristic orbital velocity, the speed of light in vacuum, and Newton’s constant, and we assume quasi-circular orbits. Corrections to the leading order expression proportional to powers of correspond to the -th relative PN order. For the purposes of our phenomenological analysis of environmental effects, we make the two following assumptions regarding vacuum waveforms:
-
•
The phase accuracy of a waveform template is a proxy for its capacity to recover source parameters without bias. We thus neglect the merger and ring-down contributions to the SNR of a GW signal.111Presumably, the additional SNR of the merger and ring-down signal might make it easier to distinguish environmental effects.
-
•
The phase accuracy of any waveform template can be translated into an equivalent accuracy in terms of PN orders, regardless of the original formalism used to construct the template.
Both of these assumptions are motivated throughout the inspiral phase of the binary source, where environmental effects are most likely to be significant (see, e.g. Blanchet, 2014). Therefore, we deem a waveform template to be accurate to the -th PN order if it can match the phase of a true signal up to an error smaller than the next PN contribution , as defined, e.g. by Eqs (2–3). In this language, current state-of-the-art waveform models range in their phasing accuracy depending on several simplifying assumptions such as spin alignment, mass ratio, or lack of eccentricity, going as high as 20-PN (see, e.g. Fujita, 2015; Munna, 2020). In the case of a generic LISA source with arbitrary spins, moderate mass ratios (), and small eccentricities, purely analytical methods have achieved 4-PN accuracy, while 5-PN accuracy has been achieved by calibrating against numerical relativity simulations. A general overview of recent literature leads us to set a reasonable benchmark of 5-PN phasing precision to be the current standard for waveform templates (based on several works; see, e.g. Messina et al. 2019; Accettulli Huber et al. 2021; Khalil 2021; Cho et al. 2021; Nagar et al. 2022; Cho et al. 2022; Blümlein et al. 2022; Chattaraj et al. 2022). While such a benchmark is arbitrary (and is bound to change in the following years), it will serve as a useful comparison tool to assess the current state of the field.
In order to mimic vacuum waveform templates of arbitrary precision, we model the phase evolution of a source using a phenomenological form for Eq. (2), based on the PN series as well as dimensional arguments (see also Zwick et al., 2021). It reads
| (3) |
where the exponent denotes the -th effective PN order and we arbitrarily set all dimensionless coefficients , thus only preserving the physical scaling information (see, e.g. Cardoso & Maselli, 2020b). Note that, while Eq. (3) is only a crude simplification, there are several fundamental uncertainties in the modelling of environmental effects which will overshadow any loss of precision due to setting . Note also that we are assuming that the phase evolution can be well described by orbit-averaged equations, losing information regarding the initial true anomaly of the source, an important parameter in many waveform models.
Even in the case of vacuum sources, the accuracy required to extract a maximal amount of information is bounded by the inherent SNR limitations of GW detectors. A simple approximation of the SNR of a GW event can be found by using the following formula (see, e.g. Klein et al., 2016):
| (4) |
where is the detector’s power spectral density and the source’s characteristic strain. For the former, we take the LISA specifications as reported in Robson et al. (2019). The latter reads
| (5) |
where is the source’s luminosity distance and is the number of cycles it completes at a given rest frame frequency. For an observation window of 4 yr, the latter reads
| (6) |
In order to define whether a small phase shift is distinguishable from noise, we consider the following criterion, commonly used in more qualitative treatments of environmental effects on GWs (see, e.g. Kocsis et al., 2011):
| (7) |
where SNR is a detectability threshold, customarily chosen to be equal to 8. With the aid of Eq. (4) and assuming a constant phase shift, Eq. (7) can be rearranged into a useful form,
| (8) |
which essentially states that the phase of a GW signal can be reconstructed with an accuracy of SNR (see also, e.g. Katz et al., 2021). Phenomenologically, waveform templates are therefore only required to achieve an accuracy comparable to the limit imposed by Eq. (8), since any smaller contribution to the phase of the real signal would be washed away by noise. Adopting a more accurate criterion would likely decrease the sensitivity to account for the phase’s accumulation rate along with degeneracies and other subtleties of more accurate GW data analysis. Note also, that Eqs (4–6) are technically only valid at Newtonian order (Mangiagli et al., 2019). However, they suffice for the purposes of this work as they only serve to produce a reference SNR value, which we apply as a detectability criterion equally for both PN and environmental phase shifts: a crude but fair comparison in line with the phenomenological form of Eq. (3) and the intrinsic uncertainties of astrophysical environmental effects.
2.2 A sample of environmental effects
Environmental influences can introduce additional terms that modify the frequency evolution of a source of GWs. In this work, we consider a minimal model for three types of environmental effects that are considered typical in the astrophysical setting of LISA sources, i.e. we only consider a simple phase contribution. Richer environmental signatures can also be produced (see, e.g. Zwick et al. 2022 and Cardoso et al. 2022 for gas-embedded binaries, or Torres-Orjuela et al. 2019, 2021 for sources with a peculiar velocity), but are beyond the scope of this work. The influence of additional environments such as dark matter or other baryonic fields has also been explored in the literature (see, e.g. Macedo et al. 2013; Eda
et al. 2013; Cardoso et al. 2016; Cole et al. 2022; Baumann et al. 2022).
Gas torques can act on a GW source by transferring energy and angular momentum between the binary and the surrounding gas. The presence of gas is likely in the case of supermassive BH (SMBH) LISA sources, since the galaxy mergers responsible for the binary itself can trigger large inflows of gas towards the central regions, because of both tidal torques (due to gravitational forces; see, e.g. Barnes & Hernquist 1996; Hopkins & Quataert 2010; Capelo et al. 2015) and hydrodynamical torques (e.g. large-scale ram-pressure shocks; Barnes 2002; Capelo & Dotti 2017; Blumenthal & Barnes 2018). Furthermore, gas is thought to be one of the key agents that can aid binary hardening below pc scales (see, e.g. Souza Lima et al., 2020). For sources embedded in a circumbinary disc, gas torques are well described as resulting from viscous forces (see, e.g. D’Orazio & Duffell, 2021):
| (9) |
where is the gas accretion rate onto the binary and is a dimensionless pre-factor that depends on disc properties. Following D’Orazio & Duffell (2021), we adopt a value of , which is appropriate for binaries with . We scale the mass accretion rate with the Eddington (1916) limit:
| (10) |
where is the Eddington ratio, the proton mass, the Thomson cross section, and the radiative efficiency (see, e.g. Marconi et al., 2004). Typical values for in active galactic nuclei at range from to , peaked around the commonly assumed value of (see, e.g. Suh et al., 2015). Larger Eddington ratios are thought to be common at higher redshifts (Willott
et al., 2010).
The gravitational influence of a third body can induce tidal fields and/or linear accelerations that affect the orbit of the inner binary and can produce subtle modifications to the source’s GW emission (see, e.g. Bonetti et al., 2017; Torres-Orjuela et al., 2019; Randall & Xianyu, 2019; Torres-Orjuela et al., 2021; Liu et al., 2022; Xuan et al., 2022). As in the rest of this work, we will limit our analysis to the lowest-order effect on the inner binary’s frequency evolution and also assume that the latter is the sole source of GWs. In a hierarchical triplet, the average effect of the third body is to induce a tidal term which modifies the inner binary’s binding energy (see, e.g. Will, 2021, for a recent PN treatment of the three-body problem). Dimensionally, the ratio between the energies reads
| (11) |
where is the inner binary’s separation, is the distance to the third body, its mass, and is a dimensionless pre-factor of order unity that depends on the configuration of the system, which we set equal to one. As shown in Zwick et al. (2021), the tidal term affects the inspiral rate of the inner binary by a factor proportional to , modifying its frequency evolution:
| (12) |
A third body of mass at a distance also induces an acceleration of the inner binary’s centre of mass, which can produce a time-dependent change in the peculiar velocity of the GW source. While a constant Doppler shift is degenerate with redshift, a peculiar acceleration along the line of sight can cause a time variation in the Doppler shift which, if integrated over an observation time, causes a non-degenerate shift in the source’s GW phase. We model this effect by Doppler shifting the frequency by an amount proportional to the time-dependent line-of-sight velocity which is solely caused by the third body:
| (13) |
where . We can then integrate the evolution equations as usual to obtain an accumulated, non-degenerate dephasing caused by the centre of mass acceleration. We parametrize this effect by considering the line-of-sight velocity, , reached after a time of acceleration:
| (14) |
In our calculations, therefore represents the maximum value of reached within an observation window. Typical values for are
| (15) |
Both unmodelled velocities of the order of km s-1 and tidal deformations of the order can be produced in an astrophysical context: the presence of a heavy star or stellar-mass BH in the innermost to pc of a nuclear cluster is a likely consequence of relaxation and mass segregation (see, e.g. Bahcall & Wolf, 1977; Alexander & Hopman, 2009; Linial & Sari, 2022) or the presence of a large-scale accretion disc (see, e.g. Goodman & Tan, 2004; Levin, 2007; Bellovary et al., 2016). Similar values can be produced by pc-scale SMBH triplets, another channel that can produce hard SMBH binaries despite possible angular momentum barriers or other delays (Bonetti et al., 2019).
2.3 Methodology
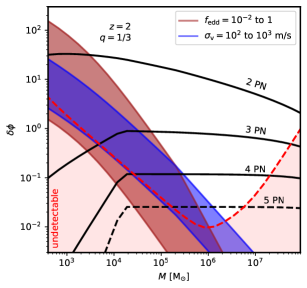
Having set up our models for both vacuum waveform templates and environmental effects, we devise a simple strategy to compare the importance of typical environmental perturbations to the accuracy of an arbitrarily precise vacuum template. We compare contributions to the total phase of the GW signal produced by additional PN orders and environmental effects by means of Eq. (1) and the various forms of Eq. (2) discussed in the previous section. Every GW source is integrated from the time it enters the LISA band for a 4-yr period or, if it occurs first, until it reaches a separation of . An example of our computations can be seen in Figure 1, in which we plot PN contributions to the GW phase for a range of possible sources, as well as the detectability criterion defined by Eq. (8).
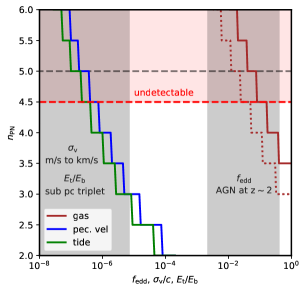
We term an environmental perturbation to be of ‘comparative -th PN order’ if it produces a phase shift comparable to the -th PN correction in Eq. (3). In Figure 2, we show the comparative PN order of selected environmental effects for two particular sources of GWs at with a binary’s total mass of M☉ and a mass ratio and 1/10, as a function of the dimensionless variables , , and . The comparative PN order of environmental effects strongly depends on the value of these parameters. For realistic values of and , it tends to be between the 4-th and the 6-th PN order, comparable to the benchmark 5-PN precision of available waveform templates. Note how very recent work on PN waveforms (Owen et al., 2023) has determined that the truncation of 5PN terms will lead to a systematic bias in the parameter estimation of generic vacuum sources. By analogy, mis-modelling environmental effects of comparative 5PN order is expected to lead to similar bias.
3 Vacuum or Environment?
3.1 Comparable-mass mergers
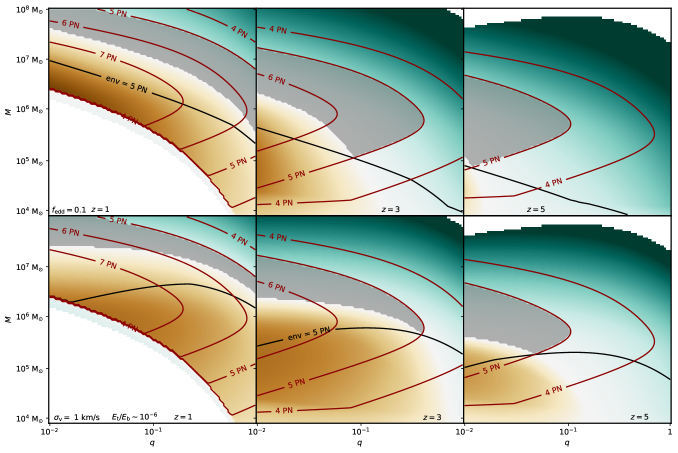
We apply our methodology on BH binaries with total masses between and M☉, mass ratios between and 1, and redshift between 0 and 5. Sources with an SNR < 8 according to Eq. (4) are automatically discarded. The results of our analysis are visualised in Figure 3, in which we assume representative values of , km s-1, and . With the aid of Eq. (7), we show the detectability regions of environmental effects, represented by the brown (detectable) and blue (undetectable) areas. The red contours denote the maximum detectable PN order consistent with SNR limitations, also according to Eq. (7). The regions highlighted in gray are defined by enforcing the following criteria: 1) environmental effects are not detectable; and 2) phase contributions due to PN orders higher than the 5 PN benchmark are detectable. The significant trends in the figure can be roughly summarised as follows:
-
•
In unequal-mass binaries with total masses of order M☉, environmental effects are likely to produce a larger phase contribution than the benchmark 5 PN precision.
-
•
The accumulated phase of heavy binaries ( M☉) can be adequately modelled with available waveforms due to their lower SNRs and total accumulated phase.
-
•
Sources with the highest SNRs land around a total mass of M☉ and mass ratio of . In this range, environmental phase contributions are relevant at low redshift (), while high-order vacuum phase contributions dominate at .
Varying the choice of , or strongly affects the results, as suggested by Figure 2. For example, a larger Eddington fraction implies detectable phase contributions even at higher redshift (see Garg et al., 2022, for a detailed analysis).
The results of Figure 3 must be interpreted in light of the expected merger rates of BH binaries. Several estimates suggest that lighter sources ( few M☉) at relatively low redshift () are expected to dominate event rates, although significant variation can be caused by changing seeding prescriptions (see, e.g. Rhook & Wyithe, 2005; Sesana et al., 2005; Sesana et al., 2007; Volonteri et al., 2020). If these estimates are accurate, they imply that a majority of LISA sources will likely fall in the brown regions of Figure 3, strongly suggesting that the study of environmental effects should also become priority when it comes to LISA SMBH binaries.
3.2 A comment on extreme mass-ratio inspirals
A second class of sources requiring complex waveforms are extreme mass-ratio inspirals (EMRIs). In the standard dynamical (dry) formation channel, stellar-mass BHs are scattered onto low peri-apsis orbits around SMBHs by relaxation processes (see, e.g. Alexander & Hopman, 2003; Amaro-Seoane et al., 2004; Merritt, 2013; Vázquez-Aceves et al., 2022) and are able to complete orbits only a few Schwarzschild radii above the event horizon of the primary BH. Because of their high initial eccentricity and rapid circularisation, EMRIs can “skip” over low-frequency GW emission: they enter the LISA band directly in a regime where environmental perturbations are completely negligible.
However, an alternative formation pathway can potentially produce similar expected EMRI rates. In the so-called active galactic nucleus (wet) channel, compact objects align or form within the central SMBH’s accretion disc (see, e.g. Rauch, 1995; Pan et al., 2021; Derdzinski & Mayer, 2022). They are dragged into the LISA band by means of gas torques, producing low-eccentricity EMRIs. They will likely enter the LISA band at lower frequencies, damping out high-order PN effects and reducing the overall SNR. While this might be a blow to precision general-relativity measurements, gas-embedded EMRIs could be powerful probes of accretion disc physics, enabling measurements inaccessible to electromagnetic instruments (see, e.g. Chakrabarti 1993; Ryan 1995; Levin 2007; Kocsis et al. 2011; Barausse & Rezzolla 2008; Barausse et al. 2014; Derdzinski et al. 2019, 2021; Zwick et al. 2022; Speri et al. 2022; Destounis et al. 2022; Polcar et al. 2022).
Because of the high uncertainties in the event rates, a choice between prioritising vacuum templates is premature. In any case, the detection of EMRIs is likely to provide a wealth of scientific observations, be it in fundamental physics (see, e.g. Babak et al., 2017; Arun et al., 2022) or astrophysics.
4 Setting the priorities
In short, our analysis suggests that the majority of massive binary mHz GW sources are likely to populate the regions of parameter space in which 1) currently available waveforms can already precisely match the phase of realistic signals if SNR limitations are considered, or 2) environmental phase contributions are likely dominant over vacuum corrections of order higher than the current benchmark value of 5 PN.
The aim of developing high PN order templates is to perform the precision measurements required to test fundamental physics, in particular modifications to general relativity. Unless the environment is properly modelled, these measurements will most likely require special sources (denoted by the gray areas in Figure 3) in which the SNR is sufficiently high and the environment is negligible. Additionally, most of the astrophysical information regarding the BH binary itself (mass, mass ratio, component spin, and orientation) can, in principle, be recovered with lower PN order phenomenological templates, since even complex dynamics such as spin-orbit and spin-spin couplings produce phase shifts at much less than th PN order. On the other hand, further development on the environmental side would 1) reduce the possibility of unknown biases and 2) allow to constrain the astrophysical surrounding of GW sources. The latter is especially promising if richer environmental signatures are also taken into account.
Led by these considerations, we argue that systematically including environmental effects in waveform templates should take priority with respect to further increasing the accuracy of inspiral vacuum templates. If the goal is to maximise the science yield of future missions, the community could be better served by shifting the focus from the source of GWs to its surroundings.
Acknowledgements
The authors acknowledge support from the Swiss National Science Foundation under the Grant 200020_192092.
Data availability
The data underlying this article will be shared on reasonable request to the authors.
References
- Abbott et al. (2019) Abbott B. P., et al., 2019, Phys. Rev. X, 9, 011001
- Accettulli Huber et al. (2021) Accettulli Huber M., Brandhuber A., De Angelis S., Travaglini G., 2021, Phys. Rev. D, 103, 045015
- Ajith et al. (2011) Ajith P., et al., 2011, Phys. Rev. Lett., 106, 241101
- Akcay et al. (2012) Akcay S., Barack L., Damour T., Sago N., 2012, Phys. Rev. D, 86, 104041
- Alexander & Hopman (2003) Alexander T., Hopman C., 2003, ApJ, 590, L29
- Alexander & Hopman (2009) Alexander T., Hopman C., 2009, ApJ, 697, 1861
- Amaro-Seoane et al. (2004) Amaro-Seoane P., Freitag M., Spurzem R., 2004, MNRAS, 352, 655
- Amaro-Seoane et al. (2017) Amaro-Seoane P., et al., 2017, arXiv e-prints, p. arXiv:1702.00786
- Amaro-Seoane et al. (2022) Amaro-Seoane P., et al., 2022, arXiv e-prints, p. arXiv:2203.06016
- Arun et al. (2022) Arun K. G., et al., 2022, Living Rev. Relat., 25, 4
- Babak et al. (2017) Babak S., et al., 2017, Phys. Rev. D, 95, 103012
- Bahcall & Wolf (1977) Bahcall J. N., Wolf R. A., 1977, ApJ, 216, 883
- Barack et al. (2010) Barack L., Damour T., Sago N., 2010, Phys. Rev. D, 82, 084036
- Barack et al. (2019) Barack L., et al., 2019, Class. Quantum Gravity, 36, 143001
- Barausse & Rezzolla (2008) Barausse E., Rezzolla L., 2008, Phys. Rev. D, 77, 104027
- Barausse et al. (2014) Barausse E., Cardoso V., Pani P., 2014, Phys. Rev. D, 89, 104059
- Barnes (2002) Barnes J. E., 2002, MNRAS, 333, 481
- Barnes & Hernquist (1996) Barnes J. E., Hernquist L., 1996, ApJ, 471, 115
- Baumann et al. (2022) Baumann D., Bertone G., Stout J., Tomaselli G. M., 2022, Phys. Rev. Lett., 128, 221102
- Bellovary et al. (2016) Bellovary J. M., Mac Low M.-M., McKernan B., Ford K. E. S., 2016, ApJ, 819, L17
- Bern et al. (2019) Bern Z., Cheung C., Roiban R., Shen C.-H., Solon M. P., Zeng M., 2019, Phys. Rev. Lett., 122, 201603
- Blanchet (2014) Blanchet L., 2014, Living Rev. Relat., 17, 2
- Blumenthal & Barnes (2018) Blumenthal K. A., Barnes J. E., 2018, MNRAS, 479, 3952
- Blümlein et al. (2022) Blümlein J., Maier A., Marquard P., Schäfer G., 2022, Nuclear Physics B, 983, 115900
- Bonetti et al. (2017) Bonetti M., Barausse E., Faye G., Haardt F., Sesana A., 2017, Classical and Quantum Gravity, 34, 215004
- Bonetti et al. (2019) Bonetti M., Sesana A., Haardt F., Barausse E., Colpi M., 2019, MNRAS, 486, 4044
- Buonanno & Damour (1999) Buonanno A., Damour T., 1999, Phys. Rev. D, 59, 084006
- Buonanno et al. (2022) Buonanno A., Khalil M., O’Connell D., Roiban R., Solon M. P., Zeng M., 2022, arXiv e-prints, p. arXiv:2204.05194
- Burko (2004) Burko L. M., 2004, Phys. Rev. D, 69, 044011
- Capelo & Dotti (2017) Capelo P. R., Dotti M., 2017, MNRAS, 465, 2643
- Capelo et al. (2015) Capelo P. R., Volonteri M., Dotti M., Bellovary J. M., Mayer L., Governato F., 2015, MNRAS, 447, 2123
- Caputo et al. (2020) Caputo A., Sberna L., Toubiana A., Babak S., Barausse E., Marsat S., Pani P., 2020, ApJ, 892, 90
- Cardoso & Maselli (2020a) Cardoso V., Maselli A., 2020a, A&A, 644, A147
- Cardoso & Maselli (2020b) Cardoso V., Maselli A., 2020b, A&A, 644, A147
- Cardoso et al. (2016) Cardoso V., Macedo C. F. B., Pani P., Ferrari V., 2016, J. Cosmology Astropart. Phys., 2016, 054
- Cardoso et al. (2022) Cardoso V., Destounis K., Duque F., Macedo R. P., Maselli A., 2022, Phys. Rev. Lett., 129, 241103
- Chakrabarti (1993) Chakrabarti S. K., 1993, ApJ, 411, 610
- Chattaraj et al. (2022) Chattaraj A., RoyChowdhury T., Divyajyoti Mishra C. K., Gupta A., 2022, Phys. Rev. D, 106, 124008
- Chatziioannou et al. (2019) Chatziioannou K., et al., 2019, Phys. Rev. D, 100, 104015
- Chen et al. (2020) Chen X., Xuan Z.-Y., Peng P., 2020, ApJ, 896, 171
- Cho et al. (2021) Cho G., Pardo B., Porto R. A., 2021, Phys. Rev. D, 104, 024037
- Cho et al. (2022) Cho G., Porto R. A., Yang Z., 2022, Phys. Rev. D, 106, L101501
- Cole et al. (2022) Cole P. S., Coogan A., Kavanagh B. J., Bertone G., 2022, arXiv e-prints, p. arXiv:2207.07576
- Coogan et al. (2022) Coogan A., Bertone G., Gaggero D., Kavanagh B. J., Nichols D. A., 2022, Phys. Rev. D, 105, 043009
- Cutler & Flanagan (1994) Cutler C., Flanagan É. E., 1994, Phys. Rev. D, 49, 2658
- D’Orazio & Duffell (2021) D’Orazio D. J., Duffell P. C., 2021, ApJ, 914, L21
- Damour (2001) Damour T., 2001, Phys. Rev. D, 64, 124013
- Damour & Deruelle (1985) Damour T., Deruelle N., 1985, Ann. Inst. Henri Poincaré Phys. Théor, 43, 107
- Damour et al. (1991) Damour T., Soffel M., Xu C., 1991, Phys. Rev. D, 43, 3273
- Derdzinski & Mayer (2022) Derdzinski A., Mayer L., 2022, arXiv e-prints, p. arXiv:2205.10382
- Derdzinski et al. (2019) Derdzinski A. M., D’Orazio D., Duffell P., Haiman Z., MacFadyen A., 2019, MNRAS, 486, 2754
- Derdzinski et al. (2021) Derdzinski A., D’Orazio D., Duffell P., Haiman Z., MacFadyen A., 2021, MNRAS, 501, 3540
- Destounis et al. (2022) Destounis K., Kulathingal A., Kokkotas K. D., Papadopoulos G. O., 2022, arXiv e-prints, p. arXiv:2210.09357
- Eda et al. (2013) Eda K., Itoh Y., Kuroyanagi S., Silk J., 2013, Phys. Rev. Lett., 110, 221101
- Eddington (1916) Eddington A. S., 1916, MNRAS, 77, 16
- Fujita (2015) Fujita R., 2015, Progr. Theor. Exp. Phys., 2015, 033E01
- Gair et al. (2013) Gair J. R., Vallisneri M., Larson S. L., Baker J. G., 2013, Living Rev. Relat., 16, 7
- Garg et al. (2022) Garg M., Derdzinski A., Zwick L., Capelo P. R., Mayer L., 2022, MNRAS, 517, 1339
- Goodman & Tan (2004) Goodman J., Tan J. C., 2004, ApJ, 608, 108
- Gralla & Wald (2011) Gralla S. E., Wald R. M., 2011, Class. Quantum Gravity, 28, 159501
- Hopkins & Quataert (2010) Hopkins P. F., Quataert E., 2010, MNRAS, 407, 1529
- Inayoshi et al. (2017) Inayoshi K., Tamanini N., Caprini C., Haiman Z., 2017, Phys. Rev. D, 96, 063014
- Islam et al. (2021) Islam T., Field S. E., Haster C.-J., Smith R., 2021, Phys. Rev. D, 103, 104027
- Jaranowski & Schäfer (1998) Jaranowski P., Schäfer G., 1998, Phys. Rev. D, 57, 7274
- Jaranowski & Schäfer (1999) Jaranowski P., Schäfer G., 1999, Phys. Rev. D, 60, 124003
- Katz et al. (2021) Katz M. L., Chua A. J. K., Speri L., Warburton N., Hughes S. A., 2021, Phys. Rev. D, 104, 064047
- Khalil (2021) Khalil M., 2021, Phys. Rev. D, 104, 124015
- Klein et al. (2016) Klein A., et al., 2016, Phys. Rev. D, 93, 024003
- Kocsis et al. (2011) Kocsis B., Yunes N., Loeb A., 2011, Phys. Rev. D, 84, 024032
- Lackeos & Burko (2012) Lackeos K. A., Burko L. M., 2012, Phys. Rev. D, 86, 084055
- Levin (2007) Levin Y., 2007, MNRAS, 374, 515
- Linial & Sari (2022) Linial I., Sari R., 2022, ApJ, 940, 101
- Liu et al. (2022) Liu B., D’Orazio D. J., Vigna-Gómez A., Samsing J., 2022, Phys. Rev. D, 106, 123010
- Lousto & Healy (2022) Lousto C. O., Healy J., 2022, arXiv e-prints, p. arXiv:2203.08831
- Luo et al. (2016) Luo J., et al., 2016, Class. Quantum Gravity, 33, 035010
- Macedo et al. (2013) Macedo C. F. B., Pani P., Cardoso V., Crispino L. C. B., 2013, ApJ, 774, 48
- Mangiagli et al. (2019) Mangiagli A., Klein A., Sesana A., Barausse E., Colpi M., 2019, Phys. Rev. D, 99, 064056
- Marconi et al. (2004) Marconi A., Risaliti G., Gilli R., Hunt L. K., Maiolino R., Salvati M., 2004, MNRAS, 351, 169
- Mei et al. (2021) Mei J., et al., 2021, Progr. Theor. Exp. Phys., 2021, 05A107
- Merritt (2013) Merritt D., 2013, Class. Quantum Gravity, 30, 244005
- Messina et al. (2019) Messina F., Dudi R., Nagar A., Bernuzzi S., 2019, Phys. Rev. D, 99, 124051
- Mogull et al. (2021) Mogull G., Plefka J., Steinhoff J., 2021, Journal of High Energy Physics, 2021, 48
- Munna (2020) Munna C., 2020, Phys. Rev. D, 102, 124001
- Nagar et al. (2022) Nagar A., Healy J., Lousto C. O., Bernuzzi S., Albertini A., 2022, Phys. Rev. D, 105, 124061
- Ossokine et al. (2020) Ossokine S., et al., 2020, Phys. Rev. D, 102, 044055
- Owen et al. (2023) Owen C. B., Haster C.-J., Perkins S., Cornish N. J., Yunes N., 2023, arXiv e-prints, p. arXiv:2301.11941
- Pan et al. (2014) Pan Y., Buonanno A., Taracchini A., Kidder L. E., Mroué A. H., Pfeiffer H. P., Scheel M. A., Szilágyi B., 2014, Phys. Rev. D, 89, 084006
- Pan et al. (2021) Pan Z., Lyu Z., Yang H., 2021, Phys. Rev. D, 104, 063007
- Peters & Mathews (1963) Peters P. C., Mathews J., 1963, Phys. Rev., 131, 435
- Polcar et al. (2022) Polcar L., Lukes-Gerakopoulos G., Witzany V., 2022, Phys. Rev. D, 106, 044069
- Pretorius (2005) Pretorius F., 2005, Phys. Rev. Lett., 95, 121101
- Pürrer (2014) Pürrer M., 2014, Classical and Quantum Gravity, 31, 195010
- Quinn & Wald (1997) Quinn T. C., Wald R. M., 1997, Phys. Rev. D, 56, 3381
- Randall & Xianyu (2019) Randall L., Xianyu Z.-Z., 2019, arXiv e-prints, p. arXiv:1902.08604
- Rauch (1995) Rauch K. P., 1995, MNRAS, 275, 628
- Rhook & Wyithe (2005) Rhook K. J., Wyithe J. S. B., 2005, MNRAS, 361, 1145
- Robson et al. (2019) Robson T., Cornish N. J., Liu C., 2019, Class. Quantum Gravity, 36, 105011
- Romero-Shaw et al. (2020) Romero-Shaw I., Lasky P. D., Thrane E., Calderón Bustillo J., 2020, ApJ, 903, L5
- Ryan (1995) Ryan F. D., 1995, Phys. Rev. D, 52, 5707
- Sesana et al. (2005) Sesana A., Haardt F., Madau P., Volonteri M., 2005, ApJ, 623, 23
- Sesana et al. (2007) Sesana A., Volonteri M., Haardt F., 2007, MNRAS, 377, 1711
- Souza Lima et al. (2020) Souza Lima R., Mayer L., Capelo P. R., Bortolas E., Quinn T. R., 2020, ApJ, 899, 126
- Speri et al. (2022) Speri L., Antonelli A., Sberna L., Babak S., Barausse E., Gair J. R., Katz M. L., 2022, arXiv e-prints, p. arXiv:2207.10086
- Suh et al. (2015) Suh H., Hasinger G., Steinhardt C., Silverman J. D., Schramm M., 2015, ApJ, 815, 129
- Szilágyi et al. (2015) Szilágyi B., et al., 2015, Phys. Rev. Lett., 115, 031102
- Tamanini & Danielski (2019) Tamanini N., Danielski C., 2019, Nature Astronomy, 3, 858
- Teukolsky (1973) Teukolsky S. A., 1973, ApJ, 185, 635
- Thorpe et al. (2019) Thorpe J. I., et al., 2019, in Bulletin of the American Astronomical Society. p. 77 (arXiv:1907.06482)
- Torres-Orjuela et al. (2019) Torres-Orjuela A., Chen X., Cao Z., Amaro-Seoane P., Peng P., 2019, Phys. Rev. D, 100, 063012
- Torres-Orjuela et al. (2021) Torres-Orjuela A., Chen X., Amaro Seoane P., 2021, Phys. Rev. D, 104, 123025
- Vázquez-Aceves et al. (2022) Vázquez-Aceves V., Zwick L., Bortolas E., Capelo P. R., Amaro Seoane P., Mayer L., Chen X., 2022, MNRAS, 510, 2379
- Volonteri et al. (2020) Volonteri M., et al., 2020, MNRAS, 498, 2219
- Will (2021) Will C. M., 2021, Phys. Rev. D, 103, 063003
- Willott et al. (2010) Willott C. J., et al., 2010, AJ, 140, 546
- Xuan et al. (2022) Xuan Z., Naoz S., Chen X., 2022, arXiv e-prints, p. arXiv:2210.03129
- Zwick et al. (2021) Zwick L., Capelo P. R., Bortolas E., Vázquez-Aceves V., Mayer L., Amaro-Seoane P., 2021, MNRAS, 506, 1007
- Zwick et al. (2022) Zwick L., Derdzinski A., Garg M., Capelo P. R., Mayer L., 2022, MNRAS, 511, 6143