Highlights from the Telescope Array Experiment
Hiroyuki Sagawa1
1 Institute for Cosmic Ray, the University of Tokyo
for the Telescope Array Collaboration
* hsagawa@icrr.u-tokyo.ac.jp
![[Uncaptioned image]](/html/2209.03591/assets/TIFR.png) 21st International Symposium on Very High Energy Cosmic Ray Interactions (ISVHE- CRI 2022)
21st International Symposium on Very High Energy Cosmic Ray Interactions (ISVHE- CRI 2022)
Online, 23-27 May 2022
10.21468/SciPostPhysProc.?
Abstract
The Telescope Array (TA) is the largest hybrid cosmic ray detector in the Northern Hemisphere, which observes primary particles in the energy range from 2 PeV to 100 EeV. The main TA detector consists of 507 plastic scintillation counters on a 1.2-km spacing square grid and fluorescence detectors at three stations overlooking the sky above the surface detector array. The TA Low energy Extension (TALE) detector, which consists of ten fluorescence telescopes, and 80 infill surface detectors with 400m and 600 m spacing, has continued to provide stable observations since its construction completion in 2018. The TAx4, a plan to quadruple the detection area of TA is also ongoing. About half of the planned surface detectors have been deployed, and the current TAx4 continues to operate stably as a hybrid detector. I review the present status of the TA experiment and the recent results on the cosmic-ray anisotropy, mass composition and energy spectrum.
1 Introduction
The Telescope Array (TA) is the largest ultra-high-energy cosmic-ray (UHECR) observatory in the northern hemisphere. The main goal is to explore the origin and nature of UHECRs by measuring the energy spectrum, arrival direction distribution and mass composition.
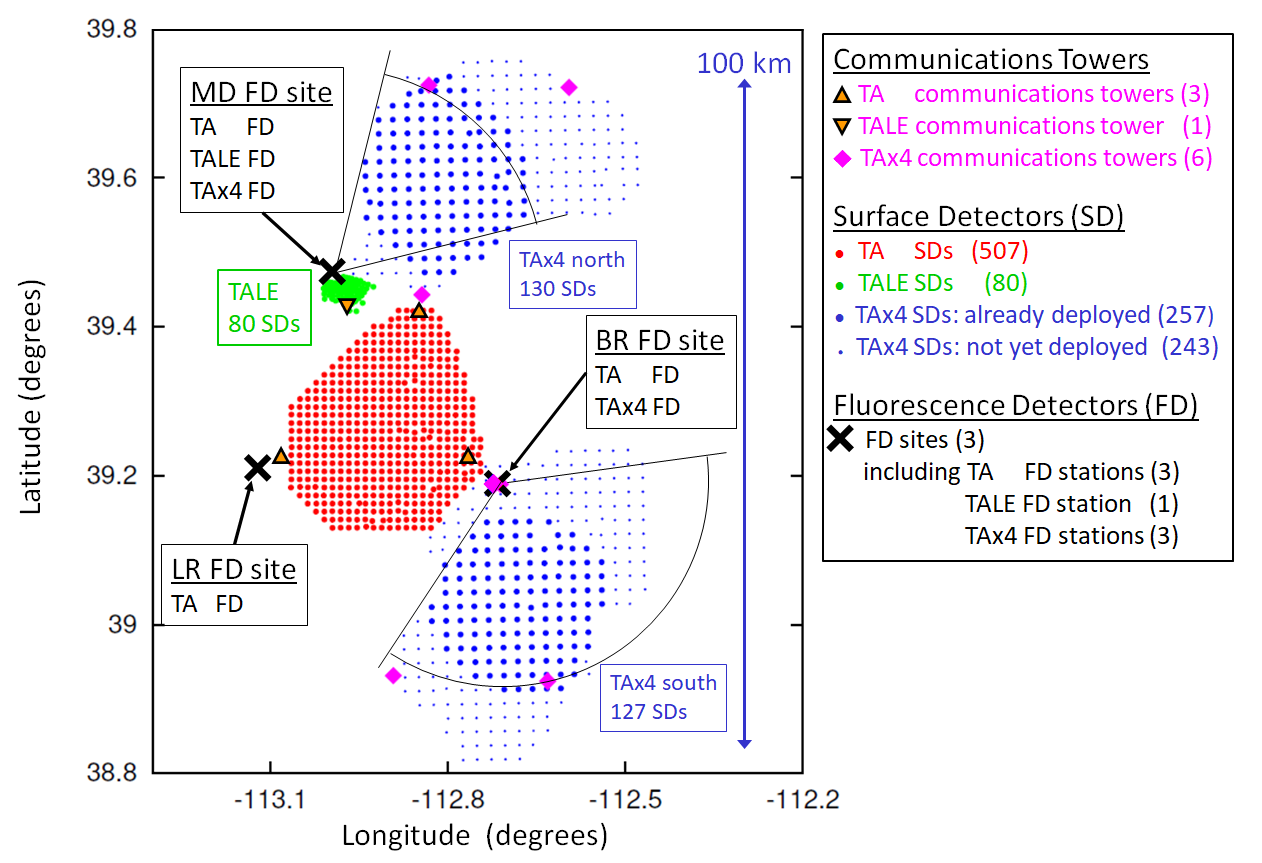
The TA detector is located in Utah in the U.S.A. and consists of a surface array of 507 plastic scintillator detectors (SD) [1], which is overlooked by three stations of fluorescence detectors (FD). The SDs are deployed on a square grid with 1.2-km spacing, and the SD array covers an area of approximately 700 km2. Each individual SD has two layers each of a 1.2-cm-thick scintillator with an area of 3 m2. The full operation of the SDs started in March 2008, and the duty cycle is greater than 95%. Two FD stations are located at the Black Rock Mesa (BR) and Long Ridge (LR) sites [2], respectively. At each station, 12 fluorescence telescopes, each with 256 photomultipliers (PMTs), cover a total field of view of 331∘ in elevation angle and 108∘ in azimuthal angle. The northern FD station situated at the Middle Drum (MD) site consists of 14 telescopes refurbished from the HiRes-1 telescopes [3], which were arranged to view 120∘ in azimuthal angle. All three FD stations started the observation in November 2007, and they have duty cycles of approximately 10%. Hybrid cosmic-ray events, which are detected simultaneously by FD and SD, are used to cross-check the SD energy by using the FD energy measurements and to improve mass composition identification from longitudinal shower profiles measured with the FD by the inclusion of SD information that better determines the directions of air-shower axes.
The TALE enables detailed studies of the energy spectrum and composition at energies over 1016 eV. The main goal of the TALE is to clarify the expected transition from galactic to extragalactic cosmic rays. The TALE FD station is located at the MD site and consists of 10 telescopes refurbished from HiRes-2 [4] and has a field of view of 3159∘ in elevation angle. A total of 80 TALE SDs are operating. The data acquisition is ongoing with the hybrid trigger from FD. Additionally, information on timing around the cores of cosmic-ray air showers measured by SDs is expected to improve the event reconstruction accuracy of the FD measurement. Consequently, mass composition measurements from the longitudinal shower profile with FD are expected to be improved. Further low energy extension with hybrid mode is planned with 45 SDs with 100-m spacing and 9 SDs with 200-m spacing. The target energy range is E 1015 eV. The counters were assembled in October 2021.They will be deployed in 2022.
With enhanced statistics, we expect to verify the hotspot [5] along with other anisotropy results. We intended to quadruple the TA aperture (TAx4), including the TA SD array by installing 500 SDs at 2.08-km spacing [6]. The construction started in 2015 by reviewing the TA scintillator detector components. A total of 257 SDs were deployed in February and March 2019 [7]. The array is 2.5 times larger than the TA SD array. The additional array started stable data acquisition in November 2019. The new array requires two FD stations overlooking the SD array to increase the number of detected hybrid events and to calibrate the energy measured by SD. These FDs are formed using refurbished HiRes telescopes. The first light was observed by the FDs at the northern site and southern site in February 2018 and October 2019, respectively. The layout of the TAx4 SD and FD including TA and TALE is shown in Fig. 1.
In this report, the TA results on spectrum, composition and anisotropy are described in Section 2, Section 3 and Section 4, respectively. Section 5 concludes this report [8].
2 Energy Spectrum
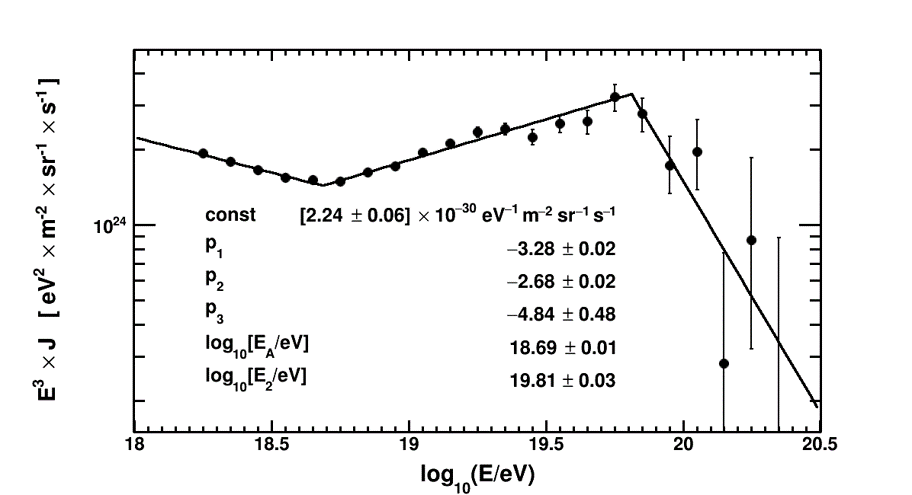
A preliminary result of the cosmic-ray spectrum for 11 years of TA SD data is shown above 1018.2 eV in Fig. 2 (left) [9]. The TA confirmed the ankle at 1018.69±0.01 eV and the flux suppression above 1019.81±0.03 eV, which is consistent with the Greisen-Zatsepin-Kuzmin cutoff prediction [10, 11]. The statistical significance of the difference between the observed cosmic-ray flux above the cutoff and the expected one from the extrapolation of the flux with the spectral index between the ankle and the cutoff (no suppression) is 8.4.
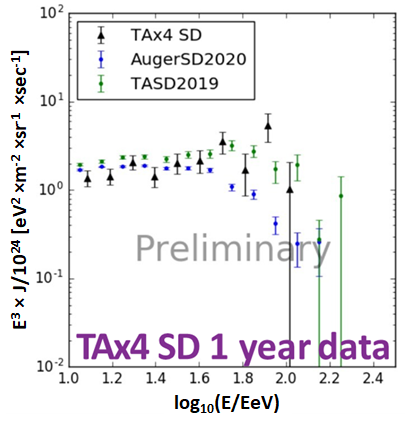
Fig. 2 (right) [12] shows the preliminary result of TAx4 SD spectrum, which is consistent with the TA SD spectrum. Hereafter, when referring to TAx4 results, it means results using only data from 257 SDs deployed for TAx4 in 2019. The monocular energy spectrum using the additional TAx4 FD [13] and the energy spectrum using the hybrid analysis with TAx4 [14] are also consistent with the TA SD spectrum.
The energy spectra measured by the Pierre Auger Observatory (hereafter Auger) [15] in the southern hemisphere and by the TA [9] in the northern hemisphere agree well for energies (0.12.5) 1019 eV after rescaling the energies by +4.5% for Auger and 4.5% for TA, whereas there is a significant discrepancy between the two results at the suppression [9]. When we compare the energy spectra in the common declination band (15∘ +24.8∘) after the 4.5% rescalings, the differences are smaller, but the persistent differences require an additional energy rescaling in an energy-dependent way (10%/decade for E 1019 eV) to get an agreement [16].
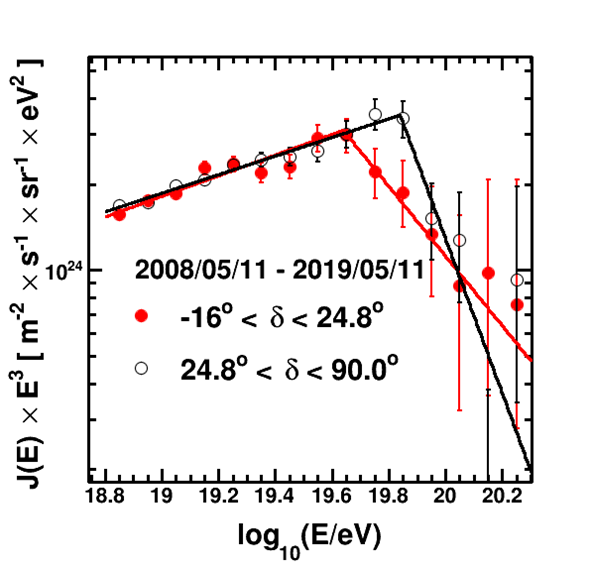
As shown in Fig 3, the TA SD data over 11 years yield the cutoffs at 1019.64±0.04 eV and 1019.84±0.02 eV for declinations of 16∘ 24.8∘ and 24.8∘ 90∘, respectively. The pretrial significance of the difference of these two cutoffs is 4.7. The chance probability of exceeding the pretrial significance for an isotropic distribution is 8.510-6 or 4.3 [9]
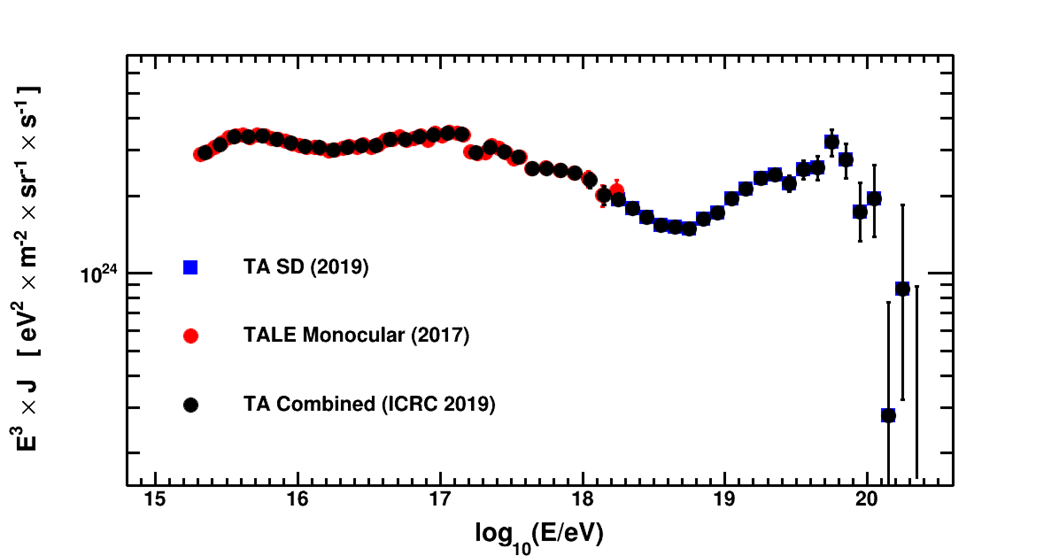
The TALE FD measures a spectrum with mixed Cherenkov and fluorescence signals. The energy spectrum collected by the TALE FD monocular measurement over 22 months was published in [18]. Fig. 4 (left) [17] shows the TA combined spectrum, which is made by combining the TA SD and TALE FD spectra. The range of energies below 1018.2 eV is covered by the TALE FD, while the energy range above 1018.2 eV is covered by the TA SD. We see three features in the energy spectrum: the knee at approximately 1015.5 eV, the low-energy ankle at 1016.22±0.02 eV and the second knee at 1017.04±0.04 eV. Fig. 4 (right) shows the preliminary spectrum using 2.5 years of TA hybrid data, which is consistent with other TA/TALE spectra within systematic uncertainties [19].

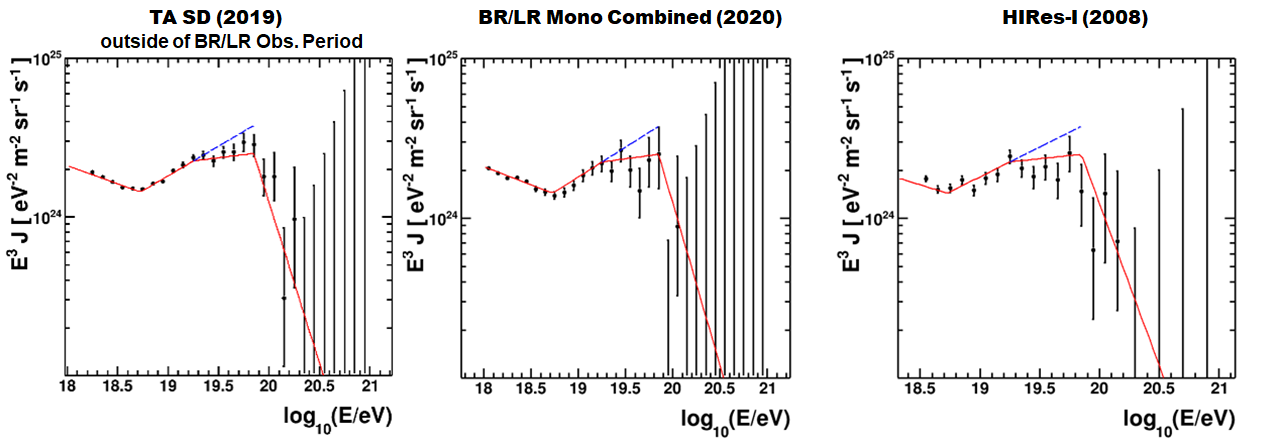
A new feature above 1019 eV, called the shoulder or instep, was first reported by Auger, of which field of view is concentrated in the southern sky [20]. We performed a joint fit of TA SD, TA Black Rock (BR) - Long Ridge (LR) monocular FD and HiRes I monocular spectra in the northern hemisphere into a thrice broken power law. To ensure statistical independence, the TA monocular FD observation period was removed from the TA SD spectrum measurement. The shoulder feature as shown in Fig. 5 was found at 1019.25±0.03 eV with a statistical significance of 5.3 [17].
3 Composition
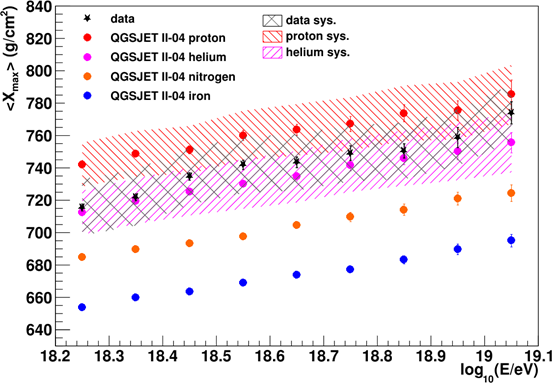
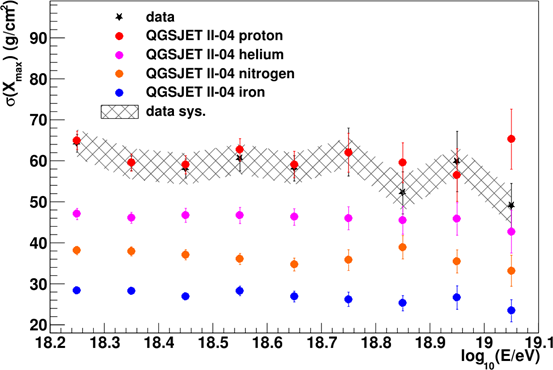
The depth of shower maximum, , of extensive air-shower profiles is the key estimate of the mass composition of UHECRs. The results of measurements in the energy range between 1018.2 eV and 1019.1 eV based on the TA hybrid events observed over 10 years are shown in Fig. 6 together with MC predictions of QGSJET II-04 [21] for proton, helium, nitrogen, and iron primaries [22]. We need more statistics to clarify the feature of above 1019 eV, for example, to more accurately measure the values of the mean and the width of . The model predictions for proton and helium primaries appear to agree with the data within systematic uncertainties.
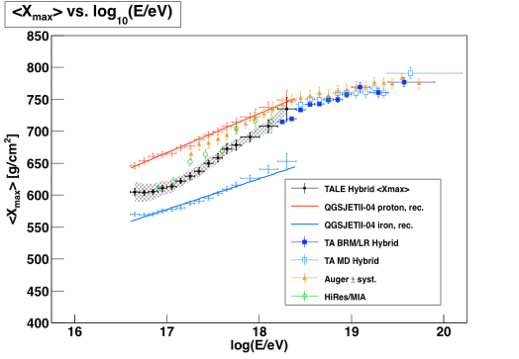
The above 1015.3 1018.3 eV was measured using the TALE FD data and a change in the elongation rate was observed at an energy of 1017.3 eV [23]. The was measured using the TALE hybrid data collected over a period of 2.5 years in the energy range 1016.6 1018.4 eV [19]. Figure 7 shows the mean as a function of the cosmic-ray energy. The systematic uncertainty on is less than 16 g/cm2. The result is not corrected for a bias of about 10 g/cm2. We can see a break point at 1017 eV, which is likely correlated with the observed softening (1017 eV) in the TALE energy spectrum [18]. The values of the mean and the slope of the elongation ratio for the TALE hybrid analysis are consistent with those for the TA hybrid analysis at around 1018.2 eV.
The composition information was also derived by the Boosted Decision Trees (BDT) method using 16 composition sensitive signals from 12 years of TA SD data [24]. The measured mean logarithmic cosmic-ray atomic number shows no significant energy dependence above 1 EeV and = 0.90 0.05(stat.) 0.30(syst.) with the QGSJET II-04 model.
4 Anisotropy
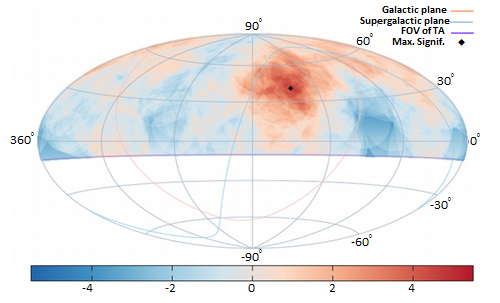
The TA has previously reported an indication of an intermediate-scale cluster of cosmic rays with energies over 5.71019 eV for five years of observation with the TA SD[5]. This TA hotspot result has since been updated using 12 years of data from the TA SD [25]. Figure 8 shows the significance maps of 179 UHECR events with 5.71019 eV. We found the maximum significance of 5.1 at R.A.=144.0∘ and Dec.=40.5∘ for the oversampling circle with a radius of 25∘ after searching for the maximum significance in circles with all grid directions and five different oversampling radii (40 events were observed where 14.6 would be expected). The chance probability of the 12-year hotspot in an isotropic sky is estimated to be 6.810-4 or 3.2.
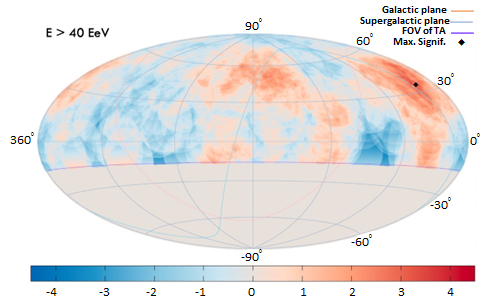
Now we lower the energy threshold slightly. The significances of the TA 11-year data at energies log10(E/eV) 19.4, 19.5, and 19.6 by the oversampling analysis with 20∘-radius circle are 4.4, 4.2, and 4, respectively (see Fig. 9). A new excess was found in the direction of the Perseus-Pisces Supercluster. For E 1019.6 eV, the chance probability of the excess within 6.8∘ from the supercluster center is 3.5.
5 Conclusion
TA confirmed the ankle at 1018.69 eV and the flux suppression above 1019.81 eV in the energy spectrum of UHECRs. The shoulder feature in the energy spectrum in the northern sky was found at 1019.25 eV. We confirmed the breaks at 1016.22 eV and 1017.04 eV in the energy spectrum measured using the data observed with the TALE FD.
The TA hybrid measurements for the energy band 1018.21019.1 eV are consistent with a light composition, in particular, with predictions of QGSJET II-04 proton and helium. We need more statistics to clarify the feature of above 1019 eV. For the TALE FD results in the energy range 1015.3 1018.3 eV, a change in the elongation rate was observed at an energy of 1017.3 eV, which is likely correlated with the observed break at 1017.04 eV in the TALE FD energy spectrum.
We obtained 179 events above 5.71019 eV in 12 years of observation with the TA SD. We found a maximum pretrial significance of 5.1 when using a circle with a 25∘ oversampling radius. The post-significance of detecting such clustered events by chance in the isotropic arrival distribution is estimated to be 3.2. Evidences for some features of anisotropy are found, for example, as a declination dependence of spectrum cutoff in the energy spectrum, and a new excess in the direction of Perseus-Pisces Supercluster using a slightly lower energy threshold.
To confirm the TA hotspot and understand its features, we proposed a plan, which we call the TAx4, to quadruple the TA SD aperture and add two FD stations. The 257 TAx4 SDs were deployed in 2019, and currently the total area is 2.5 times the TA SD. Two TAx4 FD stations are operating.
The 80 TALE SDs were deployed at the TALE site. The preliminary result of the spectrum and using the TALE hybrid data was present in this conference. The TALE infill SD array is planned to further lower the energy threshold for the TALE hybrid analysis.
The TA, TAx4, and TALE will provide important measurements of the energy spectrum, composition, and arrival directions of UHECRs from the knee region up to the highest-energy region spanning five to six decades in energy.
Acknowledgements
The Telescope Array experiment is supported by the Japan Society for the Promotion of Science (JSPS) through Grants-in-Aid for Priority Area 431, for Specially Promoted Research JP21000002, for Scientific Research (S) JP19104006, for Specially Promoted Research JP15H05693, for Scientific Research (S) JP19H05607, for Scientific Research (S) JP15H05741, for Science Research (A) JP18H03705, for Young Scientists (A) JPH26707011, and for Fostering Joint International Research (B) JP19KK0074, by the joint research program of the Institute for Cosmic Ray Research (ICRR), The University of Tokyo; by the Pioneering Program of RIKEN for the Evolution of Matter in the Universe (r-EMU); by the U.S. National Science Foundation awards PHY-1607727, PHY-1712517, PHY-1806797, PHY-2012934, and PHY-2112904; by the National Research Foundation of Korea (2017K1A4A3015188, 2020R1A2C1008230, & 2020R1A2C2102800) ; by the Ministry of Science and Higher Education of the Russian Federation under the contract 075-15-2020-778, IISN project No. 4.4501.18, and Belgian Science Policy under IUAP VII/37 (ULB). This work was partially supported by the grants ofThe joint research program of the Institute for Space-Earth Environmental Research, Nagoya University and Inter-University Research Program of the Institute for Cosmic Ray Research of University of Tokyo. The foundations of Dr. Ezekiel R. and Edna Wattis Dumke, Willard L. Eccles, and George S. and Dolores Doré Eccles all helped with generous donations. The State of Utah supported the project through its Economic Development Board, and the University of Utah through the Office of the Vice President for Research. The experimental site became available through the cooperation of the Utah School and Institutional Trust Lands Administration (SITLA), U.S. Bureau of Land Management (BLM), and the U.S. Air Force. We appreciate the assistance of the State of Utah and Fillmore offices of the BLM in crafting the Plan of Development for the site. Patrick A. Shea assisted the collaboration with valuable advice and supported the collaboration’s efforts. The people and the officials of Millard County, Utah have been a source of steadfast and warm support for our work which we greatly appreciate. We are indebted to the Millard County Road Department for their efforts to maintain and clear the roads which get us to our sites. We gratefully acknowledge the contribution from the technical staffs of our home institutions. An allocation of computer time from the Center for High Performance Computing at the University of Utah is gratefully acknowledged.
References
- [1] T. Abu-Zayyad, et al., The surface detector array of the Telescope Array experiment, Nuclear Instruments and Methods in Physics Research Section A 689 (2012) 87-97.
- [2] H. Tokuno, et al., On site calibration for new fluorescence detectors of the Telescope Array experiment, Nuclear Instruments and Methods in Physics Research Section A 601 (2009) 364-371; H. Tokuno, et al., New air fluorescence detectors employed in the Telescope Array experiment, Nuclear Instruments and Methods in Physics Research Section A 676 (2012) 54-65.
- [3] R.U. Abbasi, et al., Measurement of the flux of ultrahigh energy cosmic rays from monocular observations by the High Resolution Fly’s Eye experiment, Physical Review Letters 92 (2004) 151101 (4pp).
- [4] J.H. Boyer, B.C. Knapp, E.J. Mannel, M. Seman, FADC-based DAQ for HiRes Fly’s Eye, Nuclear Instruments and Methods in Physics Research Section A 482 (2002), 457-474.
- [5] R.U. Abbasi, et al., Indication of intermediate-scale anisotropy of cosmic rays with energy greater than 57 EeV in the northern sky measured with the surface detector of the Telescope Array experiment, The Astrophysical Journal Letters, 790 (2014) L21 (5pp).
- [6] E. Kido, et al., The TAx4 experiment, in proceedings of 35th International Cosmic Ray Conference (ICRC2017), PoS(ICRC2017)386 (2018) (8pp).
- [7] E. Kido, et al., Status and prospects of the TAx4 experiment, in proceedings of 36th International Cosmic Ray Conference (ICRC2019), PoS(ICRC2019)312 (2020) (5pp).
- [8] Some preliminary results can be found in proceedings such as H. Sagawa, et al., Results of ultra-high-energy cosmic rays from the Telescope Array, Journal of Instrumentation 15 (2022) C09012 (10pp).
- [9] D. Ivanov, et al., Energy spectrum measured by the Telescope Array experiment, PoS(ICRC2019)298 (2020) (7pp).
- [10] K. Greisen, End to the cosmic-ray spectrum?, Physical Review Letters 16 (1966) 748-750.
- [11] G.T. Zatsepin and V.A. Kuz’min, Upper limit of the spectrum of cosmic rays, Soviet Physics Journal of Experimental and Theoretical Physics (JETP) Letters 4 (1966) 114-117.
- [12] H. Jeong, et al., Reconstruction of air shower events measured by the surface detectors of the TAx4 experiment, Pos(ICRC2021)331 (2022) (10pp).
- [13] M. Potts, et al., Monocular energy spectrum using the TAx4 fluorescence detector, Pos(ICRC2021)343 (2022) (11pp).
- [14] M. Potts, et al., Ultra-high energy cosmic ray energy spectrum using hybrid analysis with TAx4, American Physical Society April Meeting (2022).
- [15] A. Aab, et al. (Pierre Auger Collaboration), Measurement of the cosmic-ray energy spectrum above 2.5 1018 eV using the Pierre Auger Observatory, Physical Review D 102, 062005 (2020) (27pp).
- [16] Y. Tsunesada, for the Telescope Array and Pierre Auger Collaborations, Joint analysis of the energy spectrum of ultra-high-energy cosmic rays measured at the Pierre Auger Observatory and the Telescope Array, PoS(ICRC2021)337 (2022) (14pp).
- [17] D. Ivanov, et al., Recent measurement of the Telescope Array energy spectrum and observation of the shoulder feature in the northern hemisphere, PoS(ICRC2021)341 (2022) (7pp).
- [18] R.U. Abbasi, et al., The Cosmic ray energy spectrum between 2 PeV and 2 EeV observed with the TALE detector in monocular mode, The Astrophysical Journal, 865 (2018) 74 (18pp).
- [19] K. Fujita et al., The Telescope Array Low-energy Extension hybryd detector in proceedings of 21st International Symposium on Very High Energy Cosmic Ray Interactions (ISVHECRI2022).
- [20] A. Aab, et al. (Pierre Auger Collaboration), Features of the energy spectrum of cosmic rays above 2.5 1018 eV using the Pierre Auger Observatory, Phys. Rev. Lett. 125 (2020) no. 12, 121106 (10pp).
- [21] S. Ostapchenko, Monte Carlo treatment of hadronic interactions in enhanced Pomeron scheme: QGSJET-II model, Physical Review D, 83 (2011) 014018 (27pp).
- [22] W. Hanlon, et al., Telescope Array 10 year composition, PoS(ICRC2019)280 (2020) (7pp).
- [23] T. AbuZayyad, et al., TALE FD cosmic rays composition measurement, PoS(ICRC2019)169 (2020) (5pp).
- [24] Y. Zhezher, et al., Cosmic-ray mass composition with the TA SD 12-year data, PoS(ICRC2021)300 (2022) (11pp).
- [25] J. Kim, et al., Hotspot update, and a new excess of events on the sky seen by the Telescope Array experiment, PoS(ICRC2021)328 (2022) (10pp).