Deep Learning-Based Automatic Diagnosis System for Developmental Dysplasia of the Hip
Yang Li,
Leo Y. Li-Han,
Hua Tian
Yang Li and Leo Y. Li-Han contributed equally to this work.Yang Li and Hua Tian are with the Orthopaedics Department of Peking University Third Hospital, Beijing, 100191, China.Leo Y. Li-Han is with the Department of Electrical & Computer Engineering, University of Toronto, Toronto, ON M5S 3G4, Canada.
Abstract
As the first-line diagnostic imaging modality, radiography plays an essential role in the early detection of developmental dysplasia of the hip (DDH). Clinically, the diagnosis of DDH relies on manual measurements and subjective evaluation of different anatomical features from pelvic radiographs. This process is inefficient and error-prone and requires years of clinical experience. In this study, we propose a deep learning-based system that automatically detects 14 keypoints from a radiograph, measures three anatomical angles (center-edge, Tönnis, and Sharp angles), and classifies DDH hips as grades I–IV based on the Crowe criteria. Moreover, a novel data-driven scoring system is proposed to quantitatively integrate the information from the three angles for DDH diagnosis. The proposed keypoint detection model achieved a mean (95% confidence interval [CI]) average precision of 0.807 (0.804-0.810). The mean (95% CI) intraclass correlation coefficients between the center-edge, Tönnis, and Sharp angles measured by the proposed model and the ground-truth were 0.957 (0.952-0.962), 0.947 (0.941-0.953), and 0.953 (0.947-0.960), respectively, which were significantly higher than those of experienced orthopedic surgeons (<0.0001). In addition, the mean (95%) test diagnostic agreement (Cohen’s kappa) obtained using the proposed scoring system was 0.84 (0.83-0.85), which was significantly higher than those obtained from diagnostic criteria for individual angle (0.76 [0.75-0.77]) and orthopedists (0.71 [0.63-0.79]). To the best of our knowledge, this is the first study for objective DDH diagnosis by leveraging deep learning keypoint detection and integrating different anatomical measurements, which can provide reliable and explainable support for clinical decision-making.
Index Terms:
Convolutional neural network, developmental dysplasia of the hip, keypoint detection, radiograph, scoring system.
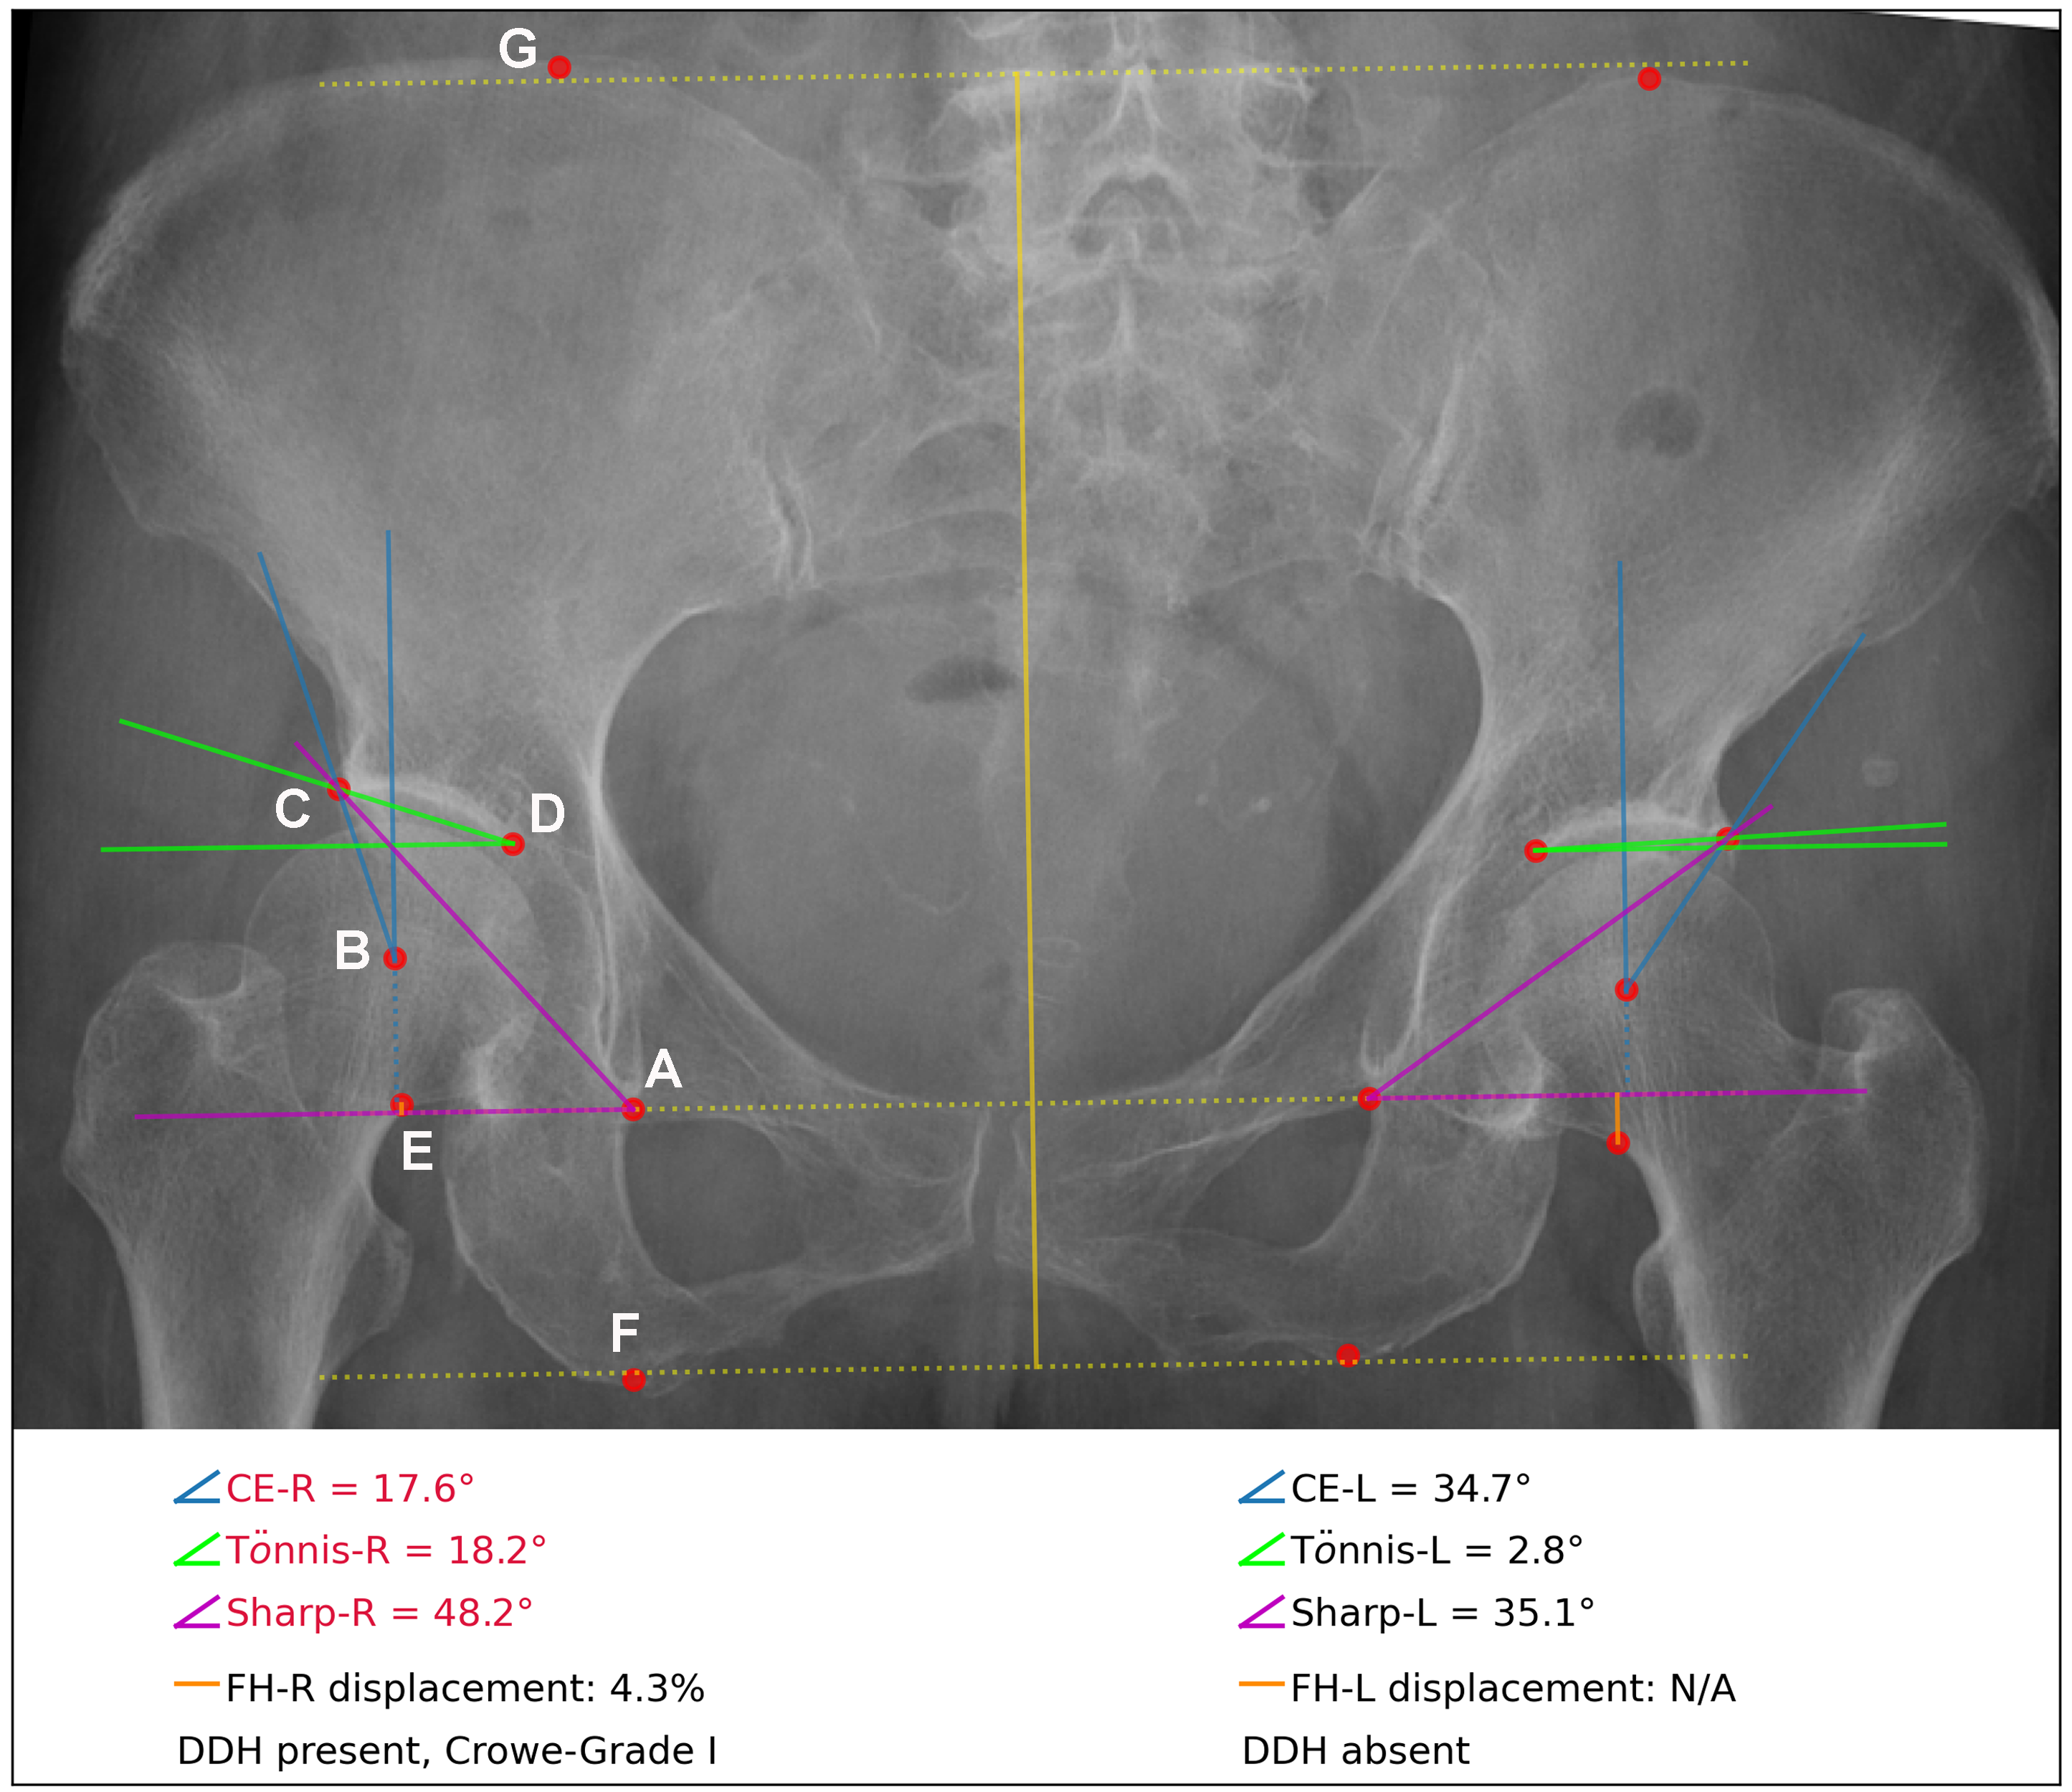
Figure 1: Example of results visualized by the proposed diagnosis system based on an anteroposterior view pelvic radiograph, including keypoints detection (red dots), radiological measurements (angles and proximal displacements), and developmental dysplasia of the hip (DDH) diagnosis/staging (bottom text). There are seven keypoints on each hip: (A) inferior boundary of the teardrop, (B) center of the femoral head, (C) lateral edge of the acetabulum, (D) medial aspect of the acetabulum, (E) caudal femoral head–neck junction, (F) inferior ischial tuberosity, and (G) superior edge of the iliac crest. The right hip is diagnosed as “DDH present” with Crowe grade I while the diagnosis for left hip is “DDH absent”. Angle measurements that significantly exceed the normal range are highlighted in red (CE: center–edge, FH: femoral head).
I Introduction
Developmental dysplasia of the hip (DDH) is a group of hip disorders commonly characterized by a shallow acetabulum with inadequate coverage of the femoral head. The reported prevalence of DDH worldwide is to depending on the diagnostic methods and criteria [1, 2, 3]. DDH is one of the most common causes of osteoarthritis [4] and is responsible for up to of hip arthroplasty in people younger than 60 years [2]. Pain and limping are common symptoms of this condition; however, mild DDH may never lead to clinically apparent symptoms [2]. As a result, there may be delayed diagnosis or misdiagnosis, which requires more complex treatment and increases the risk of treatment failure [5]. Therefore, early detection is crucial to preserve DDH patients’ quality of life.
Radiographic assessment is the first-line clinical diagnostic tool for DDH in adults. Based on radiographic evaluation, therapeutic strategies and/or interventional procedures can be applied for different stages of the disease [6]. To facilitate the diagnosis of DDH, various anatomical and radiological indices have been identified from pelvic radiographs. For example, the center–edge (CE) angle of Wiberg quantifies the lateral coverage of the acetabulum [7]. A CE angle of <20°is considered indicative of DDH. The Tönnis angle measures the weight-bearing surface of the acetabulum, with a normal range from 0°to 10° [8]. The Sharp angle (or acetabular angle) describes the inclination of the acetabulum, and an angle of >47°suggests the presence of DDH [4]. In addition, the Crowe classification system employs four grades of DDH (I to IV, representing mild to severe, respectively) based on the percentage of proximal displacement of the femoral head from the floor of the acetabular fossa [9].
However, the aforementioned diagnostic indices are dependent on the manual identification of landmark features from radiographs, which may be tedious and error-prone, especially for inexperienced clinicians. Thus, the intra-/inter-observer variability and the quality of the radiographs can considerably affect the diagnostic accuracy and reliability. Furthermore, the morphological distinction between mild DDH and normal hips or other conditions (e.g., avascular necrosis of the femoral head) may be minor (Figure 1), which further increases the risk of misdiagnosis; thus, years of training and clinical experience are required. To achieve a more sensitive diagnosis of early DDH, a previous study suggested combining the information from the CE, Tönnis, and Sharp angles [6]. However, to the best of our knowledge, there are no clear clinical guidelines for integrating these measurements for DDH diagnosis. Therefore, it would be clinically invaluable to have a reliable and explainable approach for the automatic diagnosis of DDH based on the comprehensive evaluation of different radiological features.
Deep learning algorithms have demonstrated superior performance in analyzing pelvic radiographs for multiple tasks [10, 11, 12, 13]. In this study, we propose an automatic end-to-end system for DDH diagnosis based on the comprehensive evaluation of pelvic radiographs. Specifically, we developed a deep learning algorithm to detect 14 keypoints from anteroposterior (AP) view pelvic radiographs. The CE, Tönnis, and Sharp angles are automatically measured using the detected keypoints. Furthermore, a novel scoring system learned from the data is proposed to integrate the information from the three radiological angles to achieve objective and reliable diagnosis. The DDH staging results are obtained based on the Crowe classification criteria [9].
The remainder of this paper is organized as follows. Section II reviews research on keypoint detection using deep learning and its application to pelvic radiographs. Section II also summarizes the primary contributions of this study. Section III introduces the methods used in this study, while Section IV presents the results. Section V provides a discussion, while Section VI presents the conclusions.
II Related work
Keypoint detection is an active research area in computer vision and artificial intelligence, and various detection algorithms have been proposed for different problems [14, 15, 16]. Human pose estimation is a task that aims to detect human joints in images or videos. Toshev et al. proposed a convolutional neural network (CNN) model to predict the coordinates of joints [17]. They introduced a cascade architecture to refine the prediction and achieved state-of-the-art performance compared to conventional feature template-based methods. Instead of directly predicting the coordinates, Tompson et al. proposed a CNN model to generate a heatmap indicating the probability of each pixel associated with a target joint [18]. Their results demonstrated that the performance of predicting joint heatmaps surpassed that of coordinates regression; thus, the heatmap method has become a common approach to detect joints. Newell et al. proposed a stacked hourglass CNN architecture for joint detection [19]. This repeated top-down, bottom-up mechanism effectively captured features on different scales and outperformed all preceding models in this task. Furthermore, mask region-based CNN (Mask-RCNN) was originally proposed for object detection and semantic segmentation by He et al. [20]. By changing the semantic segmentation mask to a “one-hot” binary mask for each keypoint, the authors demonstrated that the Mask-RCNN model produced competitive results in keypoint detection.
In the field of diagnosing DDH using deep learning, Park et al. trained a classification model to detect the presence of DDH from pediatric pelvic radiographs and demonstrated that the proposed model achieved performance similar to that of radiologists [21]. However, the proposed CNN model behaves as a “black box” for classification, whereas clinical evidence to support a decision is important to clinicians. Bier et al. proposed a CNN model to regress the location of multiple landmark points from pelvic radiographs with different views. The model was trained and tested on synthetic X-ray images and achieved reasonable prediction performance. In a different study, Li et al. used a modified Mask-RCNN model to detect four keypoints from a pelvic radiograph. Based on the detected keypoints, the Sharp angles were calculated and the diagnosis of DDH was generated according to the criteria in [21]. The proposed model achieved a 76% diagnosis accuracy which was comparable to that of surgeons. However, it has been noted that the diagnosis of DDH based on a single index may not be reliable, especially for mild cases; therefore, it is important to combine information from different indices to obtain a comprehensive diagnosis [6]. To this end, Yang et al. proposed a CNN model with an hourglass architecture to predict the probability map of 10 keypoints on pelvic radiographs [22]. Then, three radiological indices for DDH diagnosis were calculated: the CE, Tönnis, and Sharp angles. The results demonstrated that the keypoint detection model achieved state-of-the-art performance and that the angles generated by the model were similar to those measured by surgeons. However, they didn’t provide diagnostic results based on the measured angles, which may limit its practical application.
Unlike previous works, in this study, we propose a deep learning model based on the Mask-RCNN architecture that detects 14 keypoints from pelvic radiographs. The keypoints of interest include eight keypoints related to the three radiological angles and six keypoints associated with the Crowe classification for DDH staging. Furthermore, we introduce a novel data-driven scoring system to integrate the CE, Tönnis, and Sharp angle measurements for comprehensive diagnosis of DDH. Thus, we achieve an end-to-end automatic radiographic evaluation system with visualization. Figure 1 presents an example of the evaluation results generated by the proposed system based on an anteroposterior pelvic radiograph, where the right hip is diagnosed with mild DDH (grade I) while the diagnosis for the left hip is “DDH absent”.
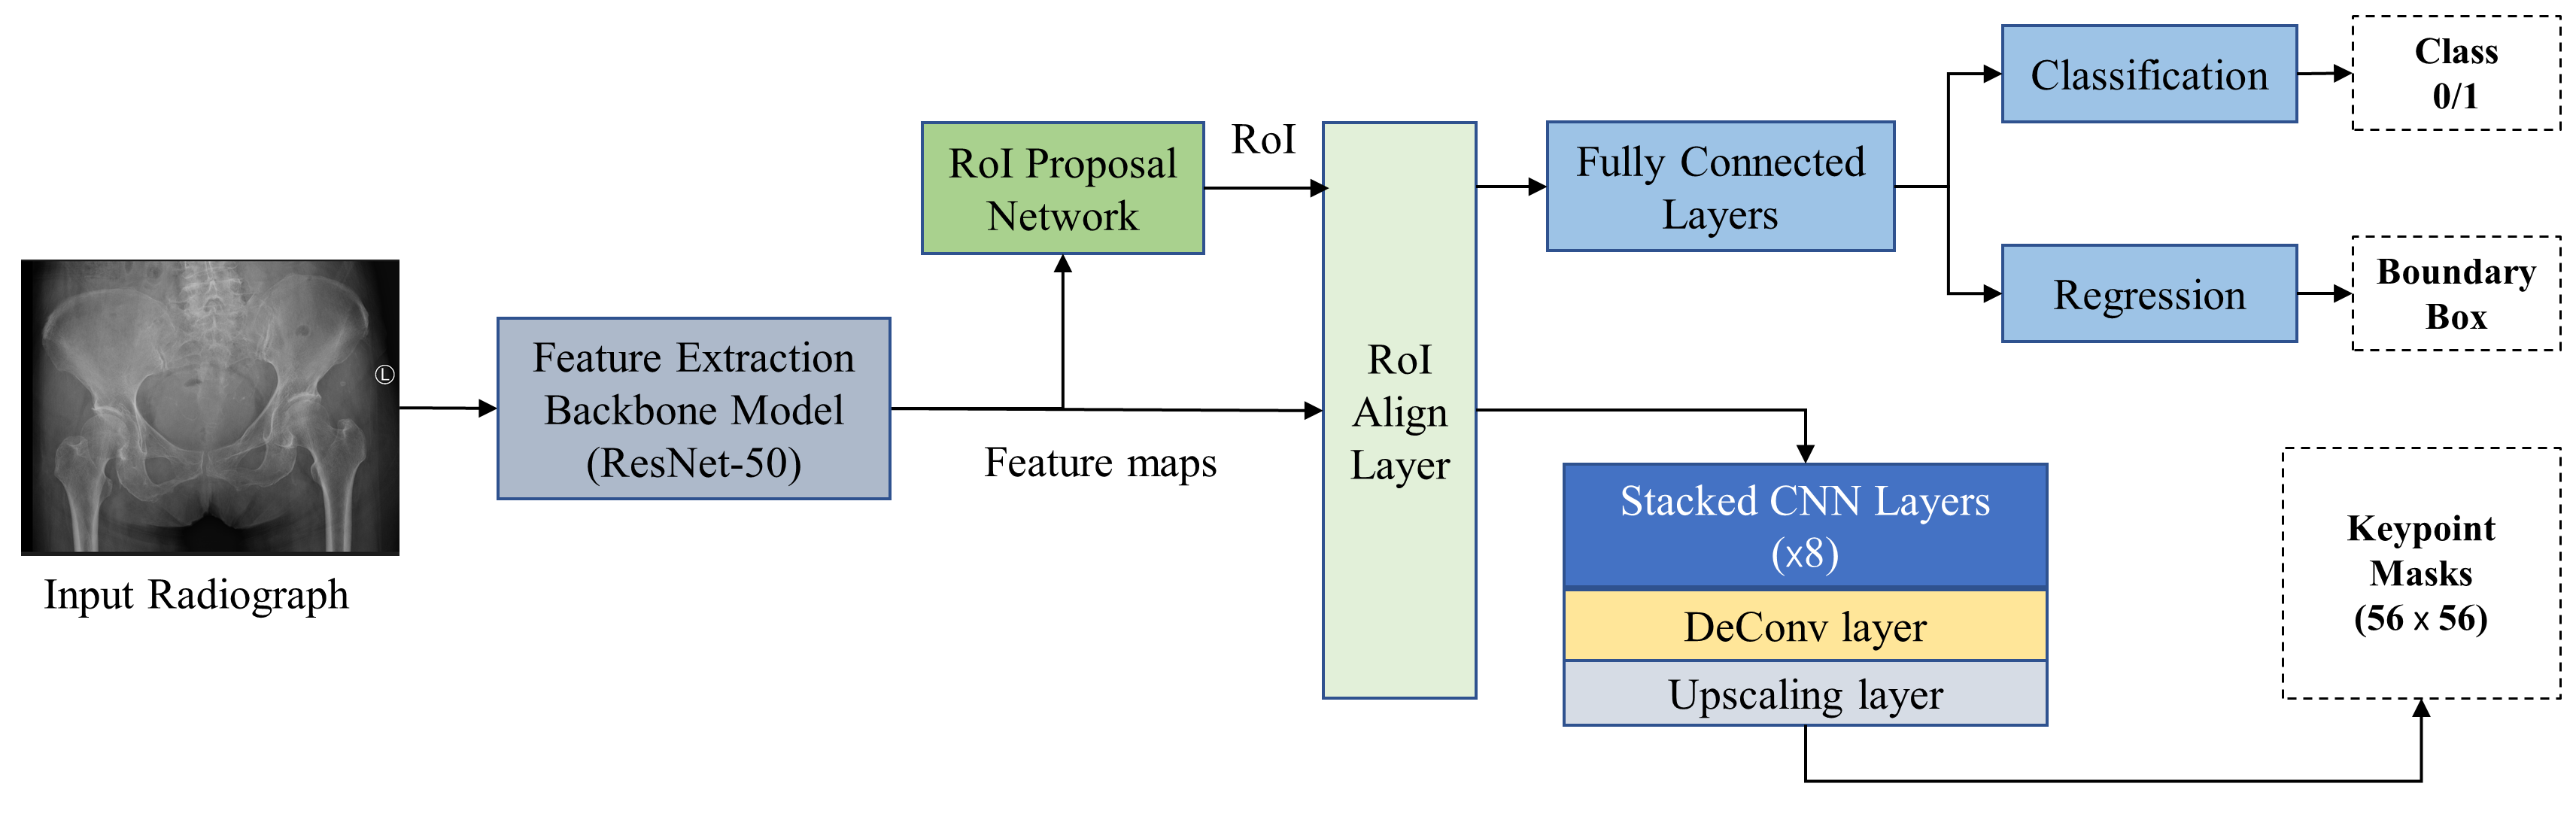
Figure 2: Overall architecture of the keypoint detection model using the Mask Region-based Convolutional Neural Network (Mask-RCNN) structure. The ResNet50 model is used to extract features from the input radiograph. The RoIAlign layer converts the feature maps and proposed regions of interest into the same size. Then, three downstream neural network branches are responsible for classification, object bounding box regression, and keypoint detection, respectively.
III Materials and Methods
III-AData
All radiographs used in this study were extracted from the radiology repository at Peking University Third Hospital, one of the largest tertiary hospitals in China. We reviewed AP view pelvic radiographs of all patients seen at the orthopedic clinic between 2017 and 2021. We excluded pediatric radiographs, and radiographs with implants, fractures, severe osteoarthritis, or advanced avascular necrosis of the femoral head.
Three orthopedic surgeons with at least 15 years of clinical and surgical experience were recruited for data annotation. For each radiograph, the locations of the following seven keypoints on each hip were labeled using the locally hosted open-source annotation tool Make-Sense [23]: (A) the inferior boundary of the teardrop, (B) the center of the femoral head, (C) the lateral edge of the acetabulum, (D) the medial aspect of the acetabulum, (E) the caudal femoral head-neck junction, (F) the inferior ischial tuberosity, and (G) the superior edge of the iliac crest. All annotators individually labeled each radiograph (14 keypoints for both sides), and the coordinates of each labeled point averaged across all annotators were taken as the ground-truth. Figure 1 illustrates the seven keypoints on the right hip. Points A to D were used to calculate the three desired radiological angles, while points E to G were used to measure the proximal displacement of the femoral head and thus determine the Crowe classification of DDH. Moreover, based on manual evaluation, each annotator provided a categorical diagnosis for each side hip, including “normal”, “DDH”, and “other conditions”. Majority voting was used in case of disagreement in the diagnosis. In addition, the region of the pelvis that included all keypoints in each radiograph was marked to facilitate model training (image region in Figure 1).
Following the convention in the literature [7, 8, 4, 6, 24, 9], the anatomical and radiological measurements used in this study were defined as follows, referring to Figure 1. Horizontal reference line: the horizontal line connecting two teardrop points and passing through point A (yellow dotted line). Vertical reference line: the vertical line perpendicular to the horizontal reference line and passing through point B (blue dotted line). CE angle: the angle (blue) between the line connecting points B and C and the vertical reference line. Tönnis angle: the angle (green) between the line connecting points C and D and the line parallel to the horizontal reference line and passing through point D. Sharp angle: the angle (purple) between the line connecting points A and C and the horizontal reference line. Proximal displacement of the femoral head: the distance from point E to the horizontal reference line. Pelvic height: the distance between the two lines parallel to the horizontal reference line and passing the middle points of two superior ilium points and two inferior ischium points (yellow solid line). The Crowe classification is based on the ratio of the proximal displacement to the pelvic height (denoted as ). Grade I to IV are assigned when the ratio is in the range of , , , and , respectively. In addition, the ground-truth measurement of CE, Tönnis, and Sharp angles are calculated based on the labeled keypoints and aforementioned definitions of the three angles.
This study included 1,723 AP view pelvic radiographs (3,446 hips). We used 1,533 radiographs (3,066 hips) in the training set for model training and validation, and 150 radiographs (300 hips) in the test set. Furthermore, we used 40 new DDH radiographs (80 hips) to evaluate DDH staging performance based on Crowe’s classification criteria, denoted as the evaluation set, where annotators provided the ground-truth staging results based on manual measurements and calculations.
III-BKeypoint Detection with Mask-RCNN
The Mask-RCNN architecture [20] was used to construct the keypoint detection model. In this model, the feature maps extracted from the input image by the backbone model and the proposed region of interests (RoIs) are fed into the RoIAlign layer to convert them into the fixed size. Then, three downstream neural network branches use the processed features to perform classification, bounding box regression, and segmentation mask prediction, respectively. In this study, we changed the class-wise
segmentation mask in the segmentation branch into the keypoint-wise mask for keypoint detection. Moreover, we defined an individual “one-hot” mask for each of the 14 keypoints, where one pixel corresponding to the keypoint’s location was 1, and all rest pixels were 0.
We adopted a similar loss function to train the model that used in [20], namely, the sum of the classification loss, bounding box regression loss, and keypoint detection loss, . Since only one class and bounding box were involved in our task, the training goal was to minimize the keypoint detection loss, which is defined as the cross-entropy loss over a -way softmax output in [20] ( is the size of the keypoint mask). However, considering that there is only one foreground pixel in the target mask, using the cross-entropy loss to penalize incorrect keypoint localization may be suboptimal. Thus, we employed the focal loss [25] as the keypoint detection loss to improve the training efficiency. The principle of the focal loss is to help the model focus on learning difficult and misclassified examples by applying a modulating term to the cross-entropy loss. Formally, the keypoint detection loss used in this study is defined as:
(1)
where is the model’s output probability of a pixel () belonging to keypoint , is the binary label for pixel (), is the focusing parameter to down-weight the easily classified samples, are the number of keypoints, and and are the height and width of the image, respectively. In this study, we used for consistency with [25].
TABLE I: PROPOSED SCORING SYSTEM FOR DEVELOPMENTAL DYSPLASIA OF THE HIP (DDH) DIAGNOSIS
Classes
CE angle
Tönnis angle
Sharp angle
Score
Normal
>
<
<
0
Borderline
-
-
-
1
DDH
<
>
>
3 for CE angle
2 for others
•
Note: the diagnosis is “DDH present” when the total score from three angles is ; otherwise, the diagnosis is “DDH absent”.
The overall architecture of the proposed keypoint detection model is presented in Figure 2. We employed the ResNet50 model [26] pre-trained on the ImageNet dataset[27] as the feature extraction backbone. Before being input into the backbone CNN, the radiographs were resized such that the shorter edges were 800 pixels. In training, the initial learning rate was set to 0.005, which was reduced by a factor of 5 when the validation loss did not improve for three consecutive epochs. The model was trained for 15 epochs with a mini-batch size of 4. The stochastic gradient descent algorithm with a weight decay of 0.0001 and momentum of 0.9 was used for optimization. We applied 10-fold cross-validation (CV) in the training phase. In the testing phase, the models trained from each CV fold were evaluated to determine the performance confidence interval (CI). In addition, standard data augmentation techniques, such as small-angle rotation and the addition of random noise, were applied to the training data.
TABLE II: -CONSTANTS FOR THE OBJECT KEYPOINT SIMILARITY METRIC DURING EVALUATION
Laterality
Teardropa
FH centerb
Lat. Sourcilc
Med. Sourcild
Cau. FH-N Jct.e
Inf. Ischiumf
Sup. Iliumg
Right
0.0080
0.0072
0.0098
0.0218
0.0097
0.0331
0.0222
Left
0.0087
0.0076
0.0110
0.0165
0.0086
0.0318
0.0250
•
a Teardrop denotes the inferior boundary of the teardrop. b FH center denotes the center of the femoral head. c Lat. Sourcil denotes the lateral edge of the acetabulum. d Med. Sourcil denotes the medial aspect of the acetabulum. e Cau. FH-N Jct. denotes the caudal head–neck junction. f Inf. Ischium denotes the inferior ischial tuberosity. g Sup. Ilium denotes the superior edge of the iliac crest.
III-CScoring System for DDH Diagnosis
As metioned in Section I, because the CE, Tönnis, and Sharp angles evaluate different anatomical and radiological features of the hip, a previous study suggested combining the information from these angles to achieve sensitive diagnosis, especially for mild DDH cases [6]. However, to the best of our knowledge, there are no clear guidelines on how to integrate these measurements for DDH diagnosis. Therefore, we developed a novel data-driven scoring system for the quantitative and objective diagnosis of DDH based on the measurements of these three angles.
In this system, each hip is first categorized into the following three classes according to the diagnostic criteria for individual angle: normal, borderline, and DDH. Thus, three diagnoses can be obtained for each hip from the three angles. For the CE angle, the normal, borderline, and DDH ranges are >, , and <, respectively [7]. For the Tönnis angle, the normal, borderline, and DDH ranges are <, , and >, respectively [6][28]. For the Sharp angle, the normal, borderline, and DDH ranges are <, , and >, respectively [4]. Different scores are then assigned for the diagnosis from the different angles. Specifically, scores of 0 and 1 are assigned to the normal and borderline classes, respectively, for all three angles. For the DDH class, a score of 3 is assigned for the CE angle, while a score of 2 is assigned for the other two angles. Finally, the sum of the scores for the three angles was compared with the threshold value of 5, leading to the final diagnosis result. A diagnosis of “DDH present” for a hip is made if the total score is ; otherwise, the diagnosis is “DDH absent”. In addition, the angle measurements falling into the DDH range are highlighted in red in the visualized diagnosis output (right hip in Figure 1).
To determine the optimal parameters for the proposed scoring system, we performed grid search in the training set for the scores assigned to each angle and the total score threshold for the final diagnosis. In other words, the parameters of the proposed scoring system were learned from the data such that the diagnostic agreement (i.e., Cohen’s kappa [29]) between the proposed scoring system and the ground-truth labels are maximized. The detailed criteria and parameters of the proposed scoring system are displayed in Table I.
III-DPerformance Evaluation
We adopted the object keypoint similarity (OKS) metric [30] to evaluate the performance of keypoint detection. The OKS is a commonly used metric in human joints detection [31], which measures the distance between the predicted and ground-truth keypoints normalized by the relative scale of the instance. Because all target keypoints are visible in our case, the OKS for each keypoint is defined as:
(2)
where is the Euclidean distance between the detected and ground-truth keypoints, is the square root of the pelvic bounding box’s area representing the object scale, and is a per-keypoint constant representing the detection consistency of human observers. Perfect detection yields an OKS of 1, whereas the OKS approaches zero as the prediction diverges from the ground-truth location. Based on descriptions of the -constant in [30] and [32], a subset of 200 radiographs was labeled five times by each annotators, which provided 3,000 redundant measurements for each keypoint. Therefore, we calculated the per-keypoint standard deviation (SD) according to , and the -constant was defined as to obtain a perceptually meaningful similarity metric. The derived -constants for all keypoints are presented in Table II.
Following the convention in [32], we calculated the average precision and average recall with a threshold based on the OKS. That is, if the detection OKS was greater than the threshold value, this detection was considered a true-positive; otherwise, it was a false-negative. By varying the threshold from 0.5 to 0.95 with a step size of 0.05, we calculated the mean average precision (mAP) and mean average recall (mAR). Then, we performed ablation analysis to compare the effectiveness of different selections in constructing the keypoint detection model. Specifically, we compared the keypoint detection performance when using different loss functions (focal loss vs. cross-entropy loss), feature extraction models (ResNet vs. ResNeXt [33] vs. Feature Pyramid Network [34]), and types of keypoint masks (binary mask vs. heatmap mask [18][35][22]). In addition, the mean Euclidean distances between the detected and ground-truth locations for each keypoint were reported.
Bland-Altman analysis was used to evaluate the level of agreement for the three anatomical angles measured from the detected and ground-truth keypoints. To further determine the performance of the proposed model in comparison with that of orthopedists with different level of clinical experience, we recruited four experienced orthopedic surgeons and four moderately experienced residents to mark the keypoints and diagnose the radiographs in the test set. It should be noted that all annotators were excluded from the evaluation. Then, we compared the intraclass correlation coefficient (ICC) [36] between the ground-truth angle measurements and the angle measurements generated by the proposed model, the annotators, the two groups of orthopedists, and a previous study [22]. Furthermore, the diagnostic agreement (Cohen’s kappa) between the proposed scoring system and the individual angle criteria and orthopedist groups was determined on the test set. Finally, the classification agreement (Cohen’s kappa), F1 score, and confusion matrix were evaluated to compare the DDH staging performance of the proposed model and the ground-truth labels on the evaluation set.
TABLE III: DATA CHARACTERISTICS
Radiographcount
Hipcount
Hip diagnosis (count [percentage])
Normal
DDHa
Others
All
1723
3446
2707 (78.6%)
422 (12.2%)
317 (9.2%)
Training
1533
3066
2471 (80.6%)
308 (10.0%)
287(9.4%)
Testing
150
300
236 (78.7%)
34 (11.3%)
30 (10.0%)
Evaluation
40
80
–
80
(42:21:9:8)b
–
•
a DDH denotes developmental dysplasia of the hip. b Values in parentheses represent the ratio of DDH grade I: grade II: grade III: grade IV.
TABLE IV: ABLATION ANALYSIS OF DIFFERENT LOSS FUNCTIONS, BACKBONE MODELS, AND MASK TYPES
ResNet50+FL+Ba
ResNet50+FL+Hb
ResNet50+CEL+Bc
ResNext50+FL+B
ResNet50+FPN+FL+B
mAP
(95% CI)
0.807
(0.804-0.810)
0.804
(0.802-0.807)
0.794
(0.791-0.797)
0.792
(0.788-0.797)
0.799
(0.795-0.802)
mAR
(95% CI)
0.870
(0.867-0.872)
0.866
(0.863-0.868)
0.858
(0.856-0.861)
0.858
(0.854-0.861)
0.862
(0.859-0.864)
•
a ResNet50+FL+B refers to the proposed model using ResNet50 as the feature backbone with focal loss (FL) and binary (B) keypoint masks. b: H denotes the heatmap keypoint mask. c: CEL denotes to the cross-entropy loss.
TABLE V: PERFORMANCE OF KEYPOINT DETECTION
Laterality
Metrics
Teardrop
FH center
Lat. Sourcil
Med. Sourcil
Cau. FH-N Jct.
Inf. Ischium
Sup. Ilium
Right
OKS
0.895
(0.124)
0.866
(0.151)
0.907
(0.157)
0.942
(0.098)
0.910
(0.117)
0.865
(0.209)
0.881
(0.172)
Distance
2.8
(2.7)
2.9
(2.5)
3.2
(3.7)
4.9
(4.5)
2.9
(2.1)
10.6
(28.9)
12.3
(12.8)
Left
OKS
0.906
(0.122)
0.883
(0.127)
0.935
(0.096)
0.897
(0.173)
0.899
(0.131)
0.896
(0.183)
0.871
(0.166)
Distance
2.8
(2.5)
2.9
(2.6)
2.8
(2.5)
5.3
(5.3)
2.9
(2.4)
8.8
(13.5)
11.9
(10.8)
•
Note: The object keypoint similarity (OKS) and distance (in pixels) are presented as the mean (standard deviation).
•
a Teardrop denotes the inferior boundary of the teardrop. b FH center denotes the center of the femoral head. c Lat. Sourcil denotes the lateral edge of the acetabulum. d Med. Sourcil denotes the medial aspect of the acetabulum. e Cau. FH-N Jct. denotes the caudal head–neck junction. f Inf. Ischium denotes the inferior ischial tuberosity. g Sup. Ilium denotes the superior edge of the iliac crest.
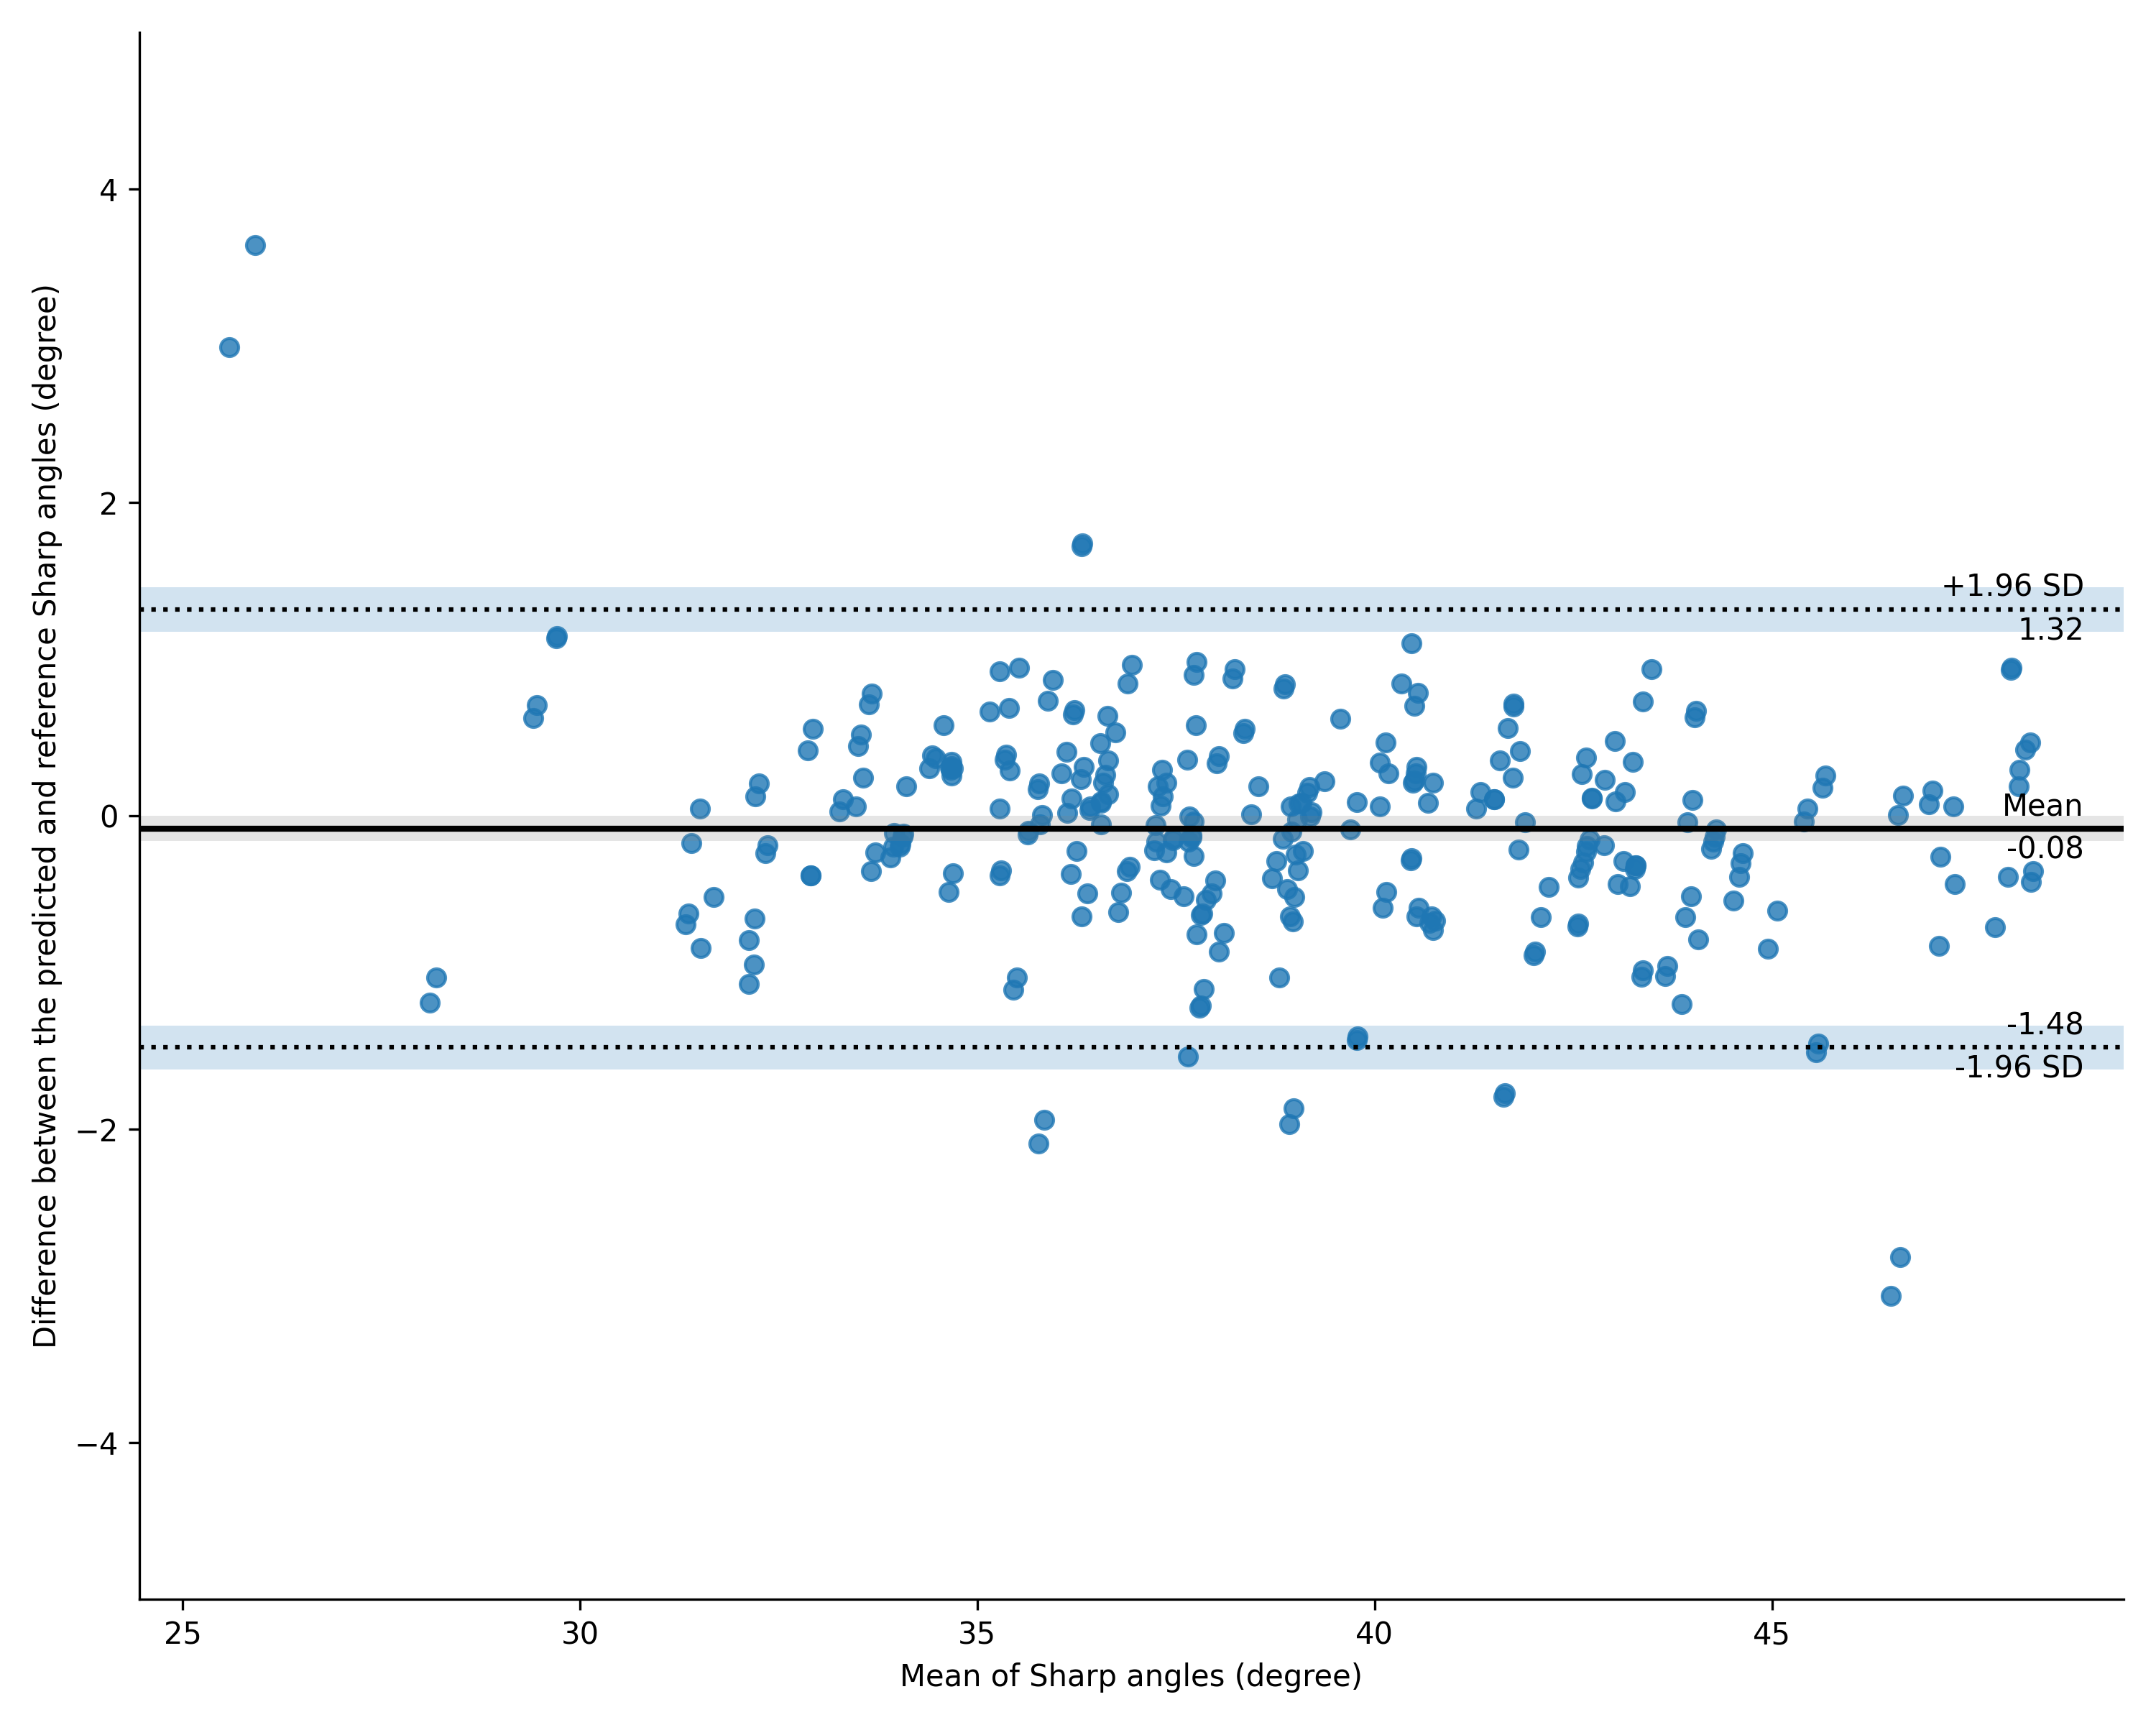
(a)
(b)
(c)
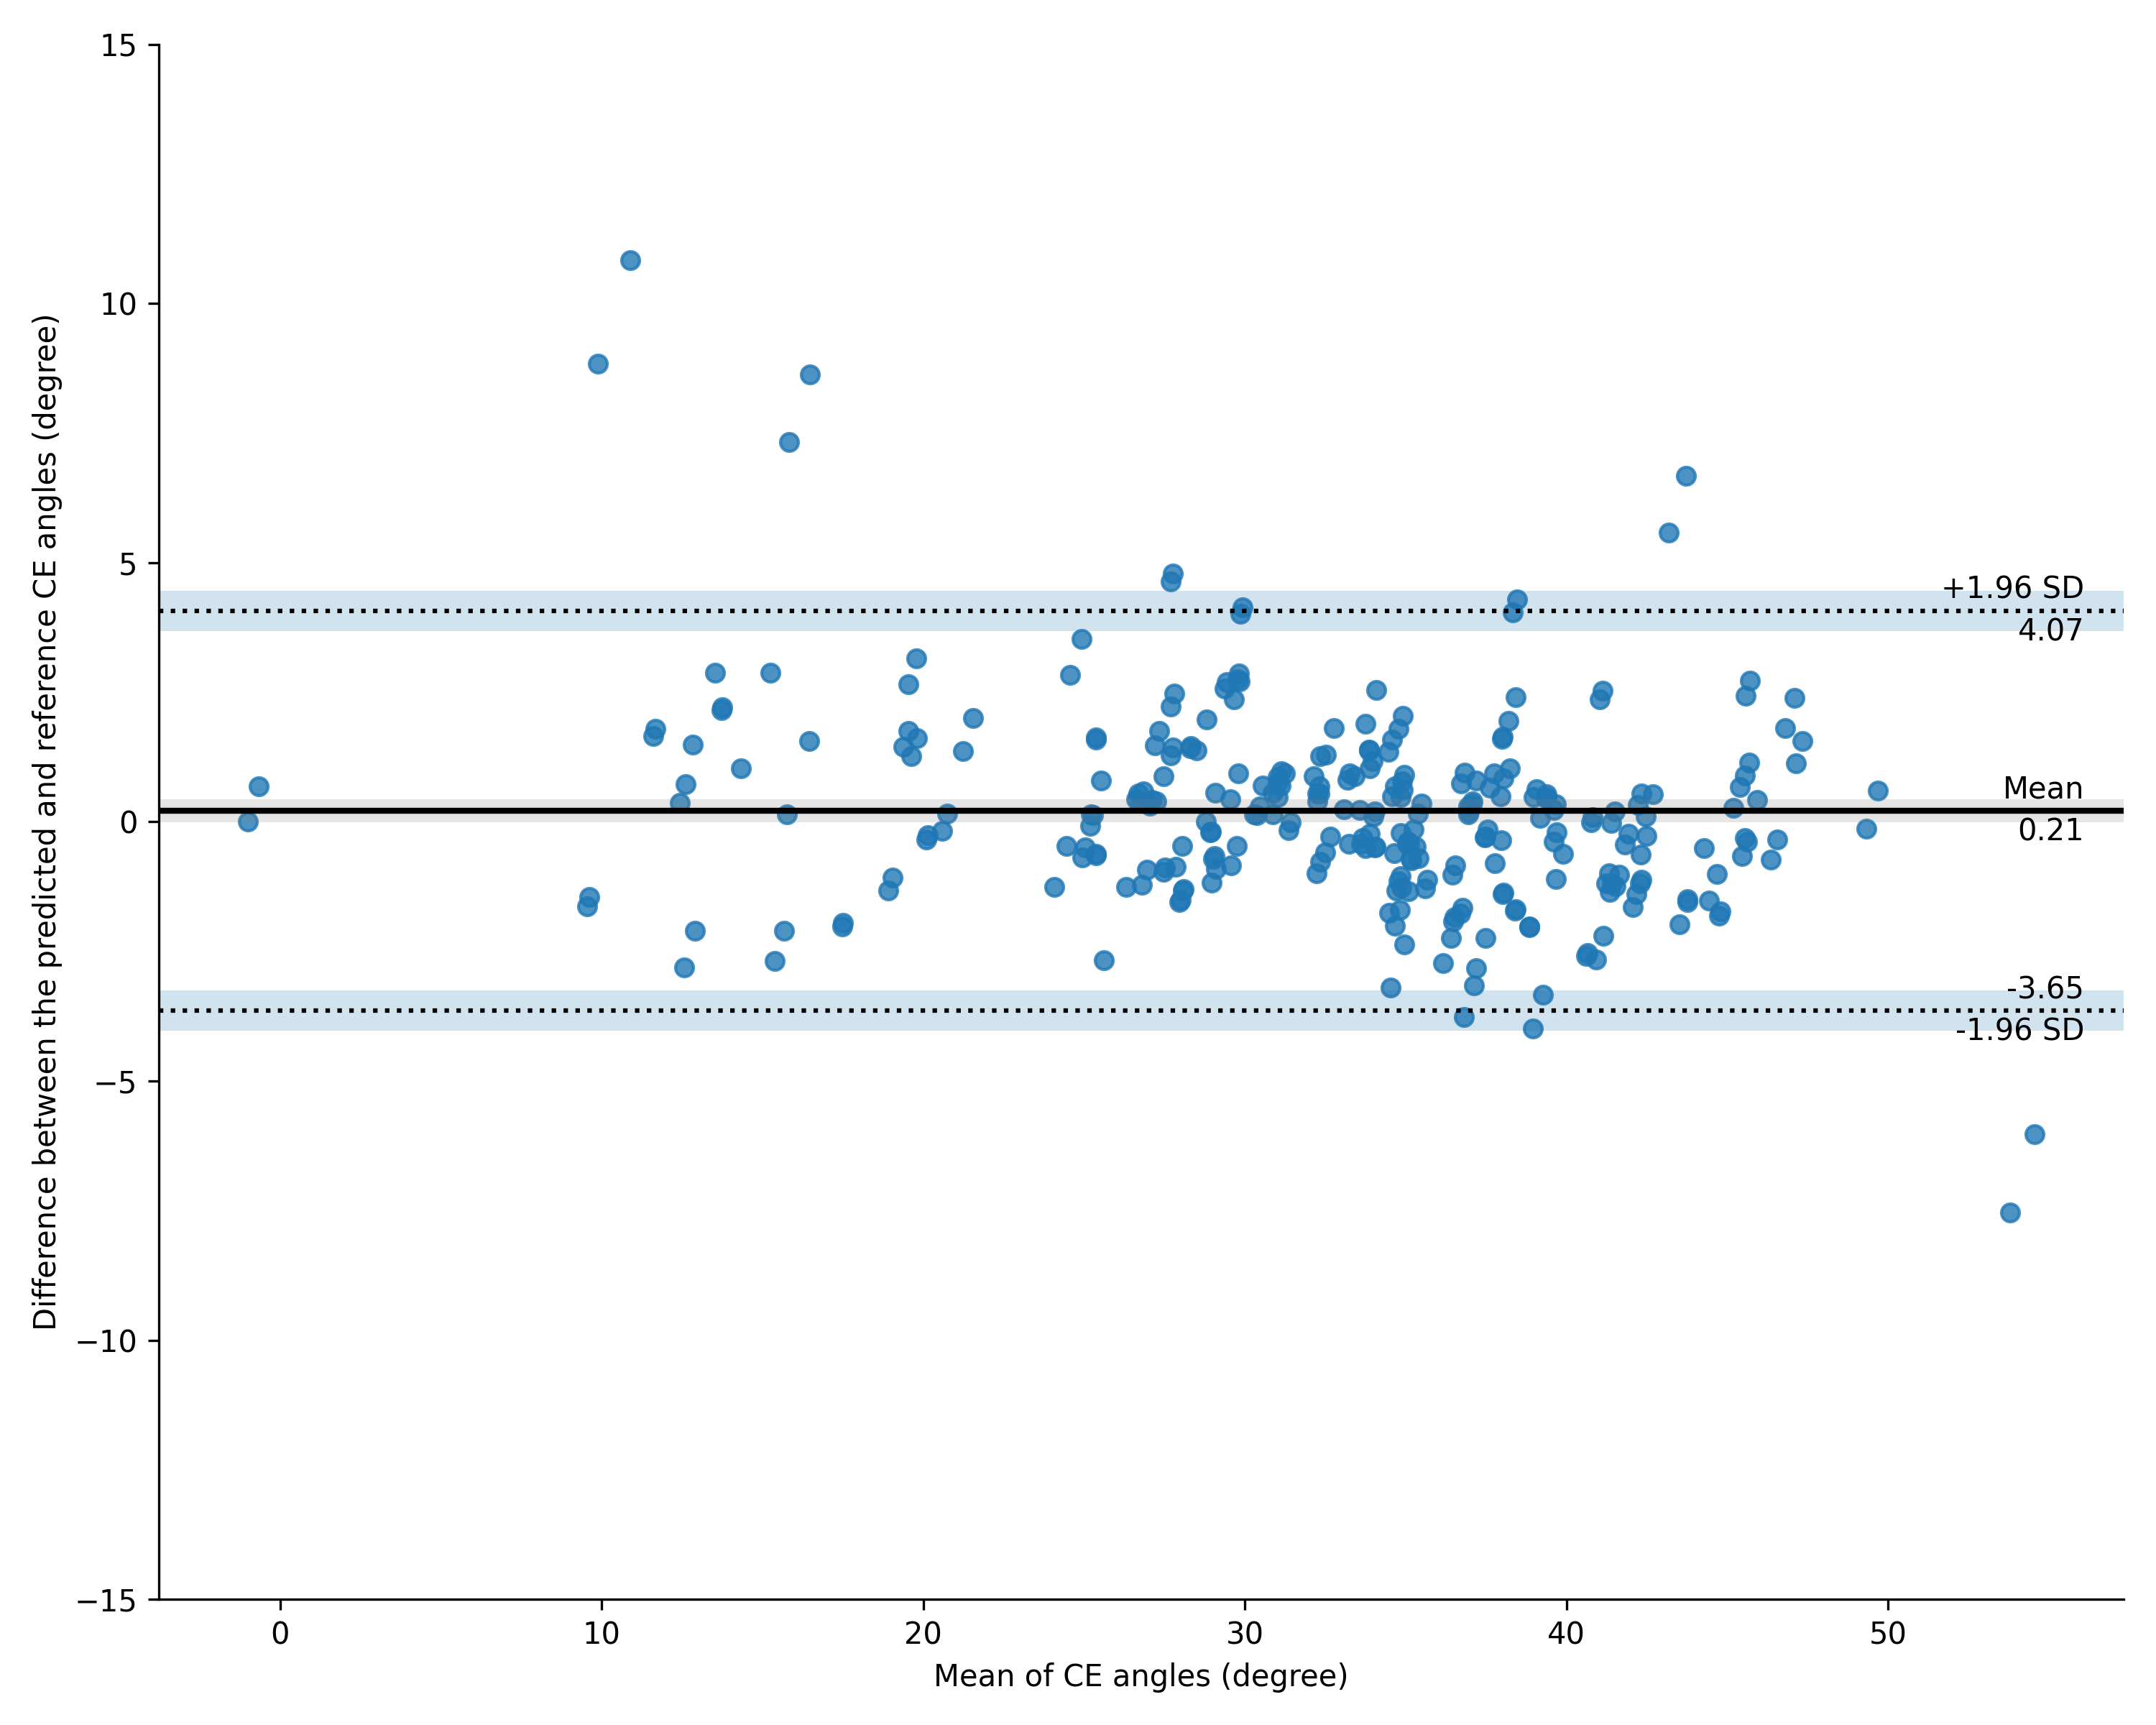
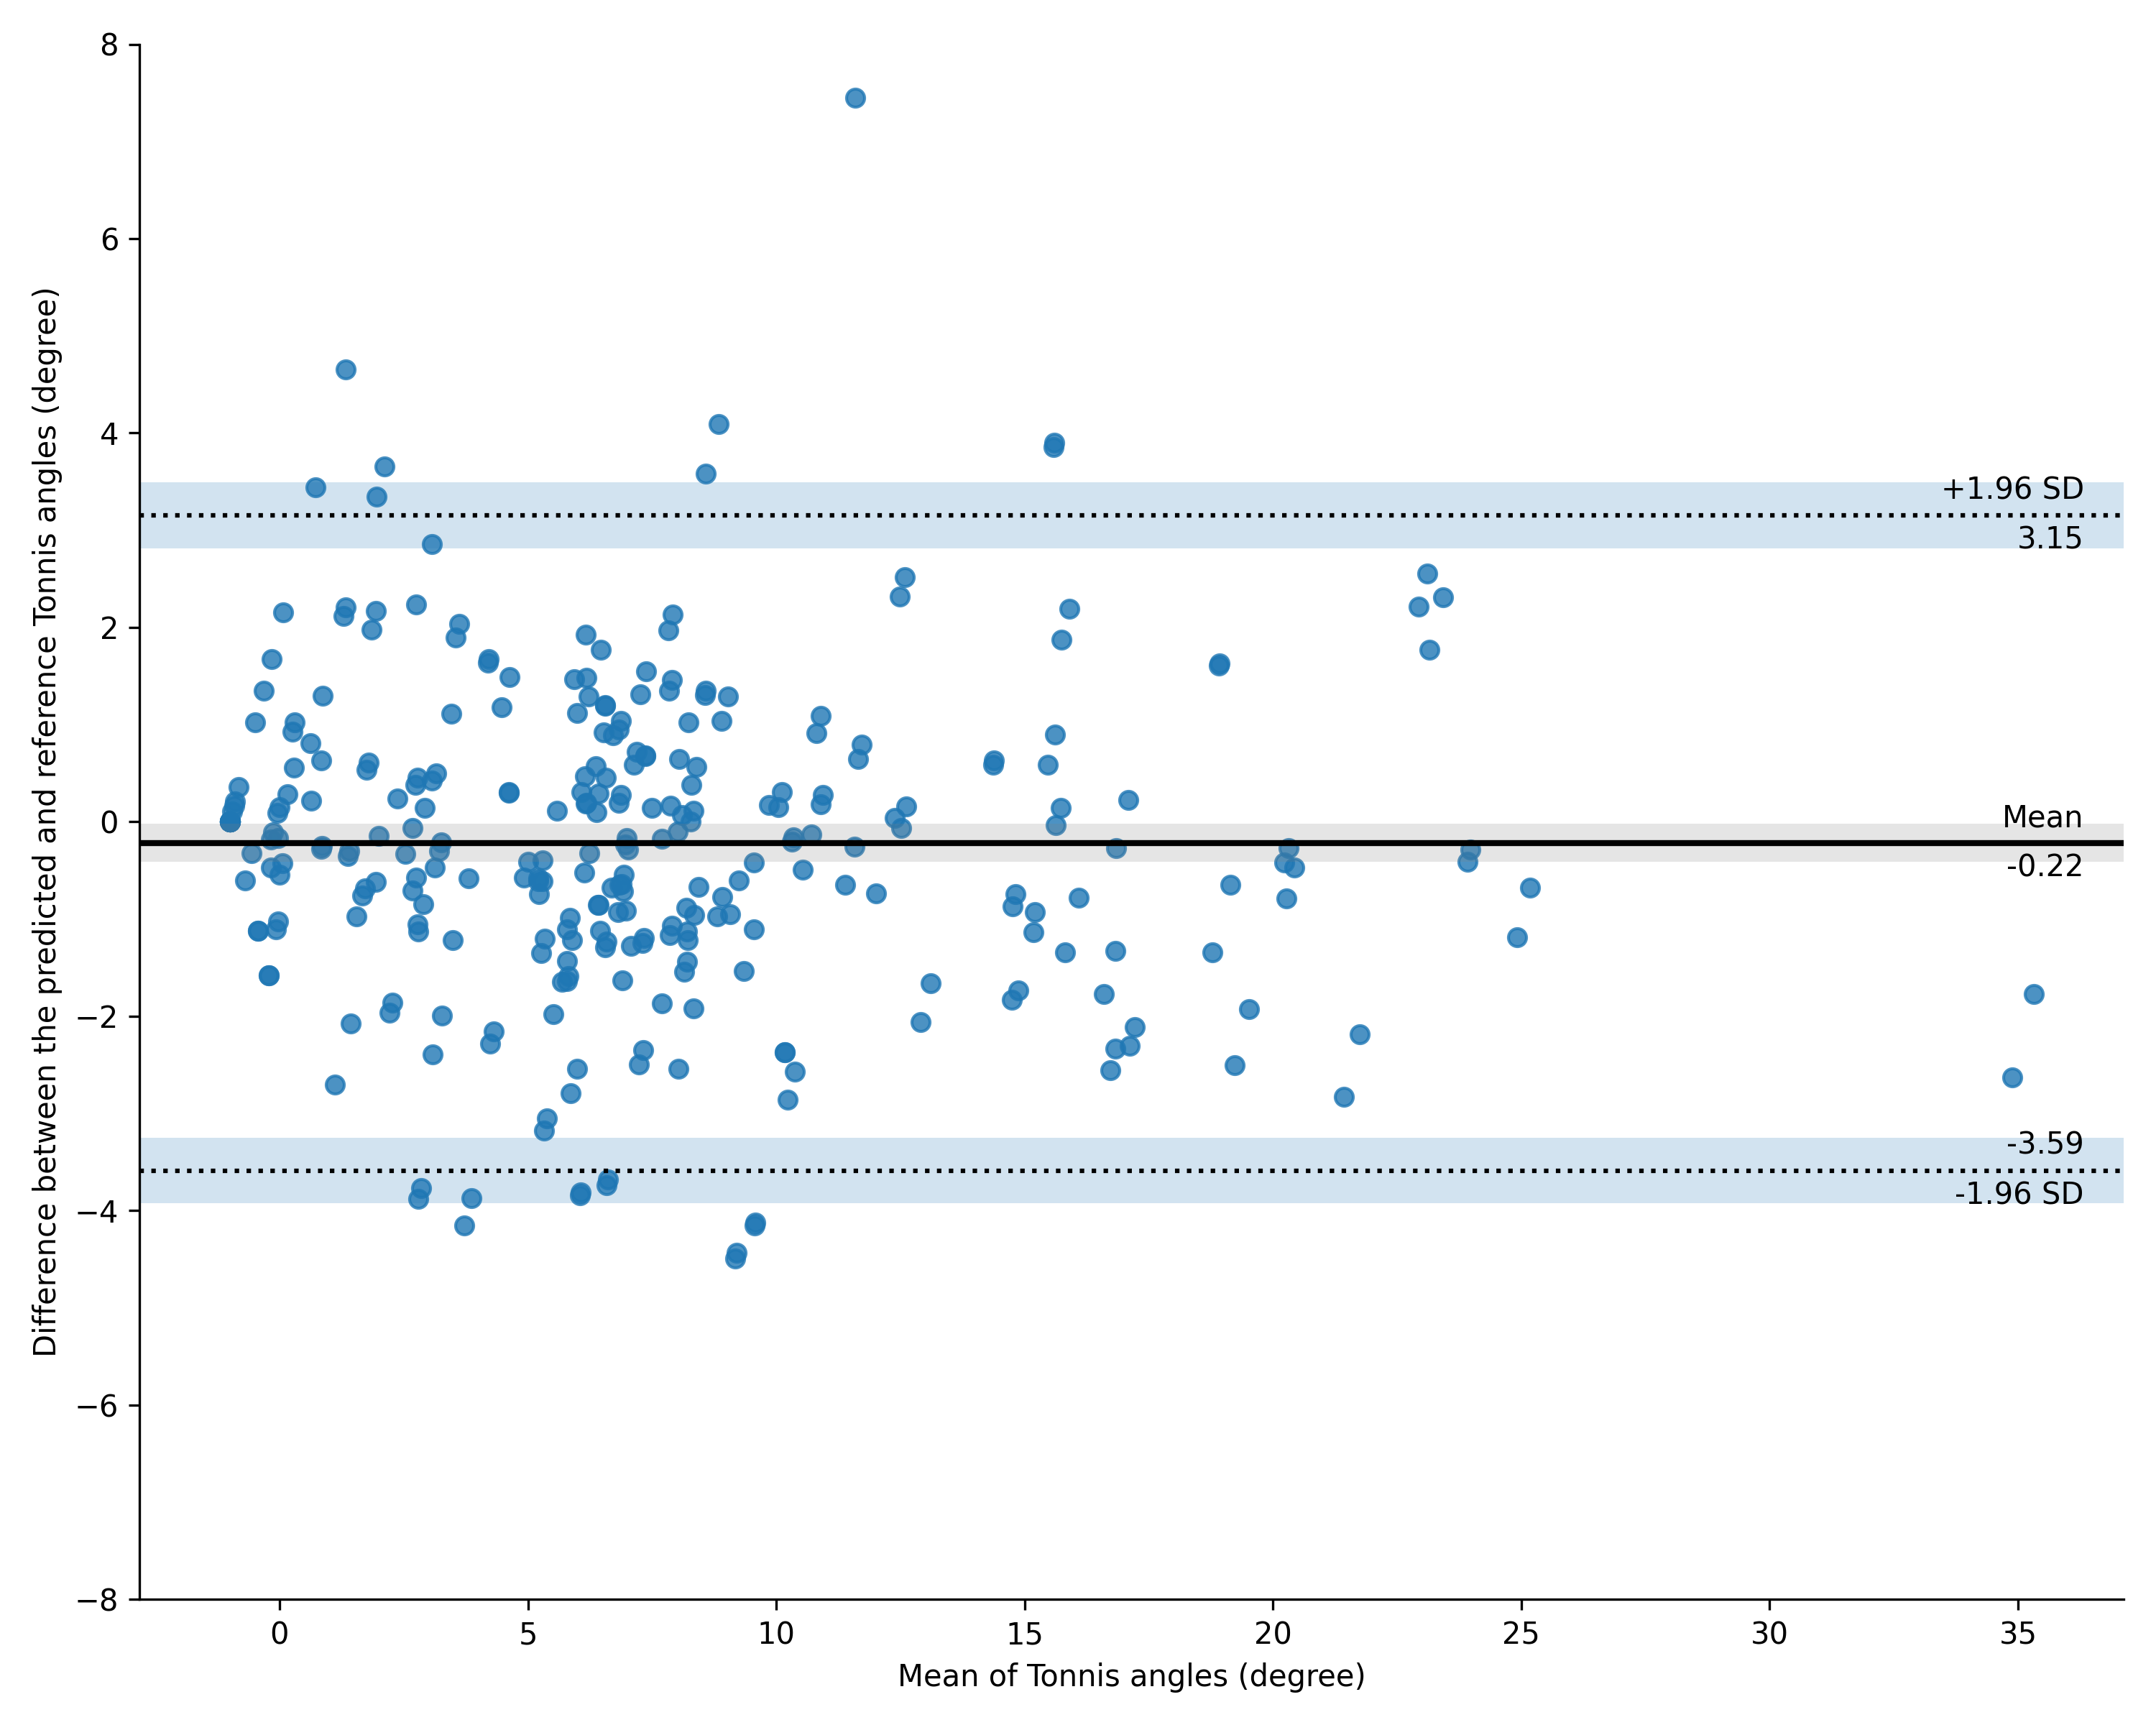
Figure 3: Bland-Altman analysis of the detected and labeled measurement results of the (a) Center-Edge (CE), (b) Tönnis, and (c) Sharp angles (including the angles from right and left hips)
TABLE VI: PERFORMANCE COMPARISON OF RADIOLOGICAL ANGLE ESTIMATES
a The Annotators column refers to the performance of redundant measurements generated by the annotators.
•
b ICC denotes the intraclass correlation coefficient.
•
c Mean Diff. denotes the mean difference between the detected and labeled angles (in degrees).
•
d CI denotes the confidence interval.
IV Results
A total of 1,723 pelvic radiographs (AP view) of 3,446 hips from 1,723 patients (male:female = 623:1,100) with a mean (SD) age of 54.8 (18.5) years were included in this study. The number of radiographs in the training, test, and evaluation sets was 1,533, 150, and 40, respectively. The number of hips labeled as “normal”, “DDH”, and “other diseases” (including avascular necrosis of the femoral head and primary osteoarthritis) were 2,707, 422, and 317, respectively. The data characteristics are summarized in Table III.
When using ResNet50 as the feature extraction backbone model, focal loss as the loss function, and binary keypoint masks as the training target (denoted as ResNet50+FL+B, where FL refers to focal loss, and B refers to binary masks), the keypoint detection model achieved a mAP (95% CI) and mAR (95% CI) of 0.807 (0.804-0.810) and 0.870 (0.867-0.872), respectively. In constrast, when using cross-entropy loss instead of focal loss (denoted as ResNet50+CEL+B), the model achieved a mAP and mAR of 0.794 (0.791-0.797) and 0.858 (0.856-0.861), respectively, which were significantly lower than those using focal loss (<0.0001). When using different backbone models for feature extraction (i.e., ResNeXt50 [33] and ResNet50+FPN111ResNet50+FPN refers to the ResNet50 model with the feature pyramid network structure [34]. [34]), the keypoint detection performance was also inferior to that of the proposed ResNet50+FL+B model (<0.0001). Moreover, when using the heatmap mask as the training target instead of the binary mask (i.e., ResNet50+FL+H, where H refers to the heatmap masks), the mAP (95% CI) and mAR (95% CI) were 0.804 (0.802-0.807) and 0.866 (0.863-0.868), respectively, which were not higher than the results of the proposed model. Therefore, we used the ResNet50+FL+B model in all subsequent experiments. The ablation analysis results of using different configurations for the keypoint detection model are listed in Table IV, while the mean (SD) OKS and mean (SD) distance (in pixels) between the detected and ground-truth keypoints are shown in Table V.
The measurement results of the anatomical angles are as follows. The overall meanSD detected (ground-truth, T-test p-value) CE, Tönnis, and Sharp angles in the test set were (, =0.41), (, =0.23), and (, =0.52), respectively. The Bland-Altman analysis for the detected and ground-truth CE, Tönnis, and Sharp angles in the test set are presented in Figure 3. The overall mean (95% CI) ICCs between the detected and ground-truth measurements in the test set were 0.957 (0.952-0.962), 0.947 (0.941-0.953), and 0.953 (0.947-0.960) for the CE, Tönnis, and Sharp angles, respectively. In addition, the ICCs between the angles labeled five times by each annotator were 0.944 (0.913-0.974), 0.946 (0.918-0.974), and 0.928 (0.888-0.969) for the CE, Tönnis, and Sharp angles, respectively. In contrast, the mean (95%) ICCs for the CE, Tönnis, and Sharp angles measured by the surgeons group were 0.875 (0.865-0.885), 0.914 (0.900-0.928), and 0.897 (0.880-0.915), respectively, and 0.880 (0.861-0.900), 0.874 (0.826-0.921), and 0.914 (0.905-0.924), respectively, for the residents group. Table VI presents a detailed comparison of the angles generated by the proposed model, annotators, experienced surgeons, moderately experienced residents, and state-of-the-art results [22] for each side.
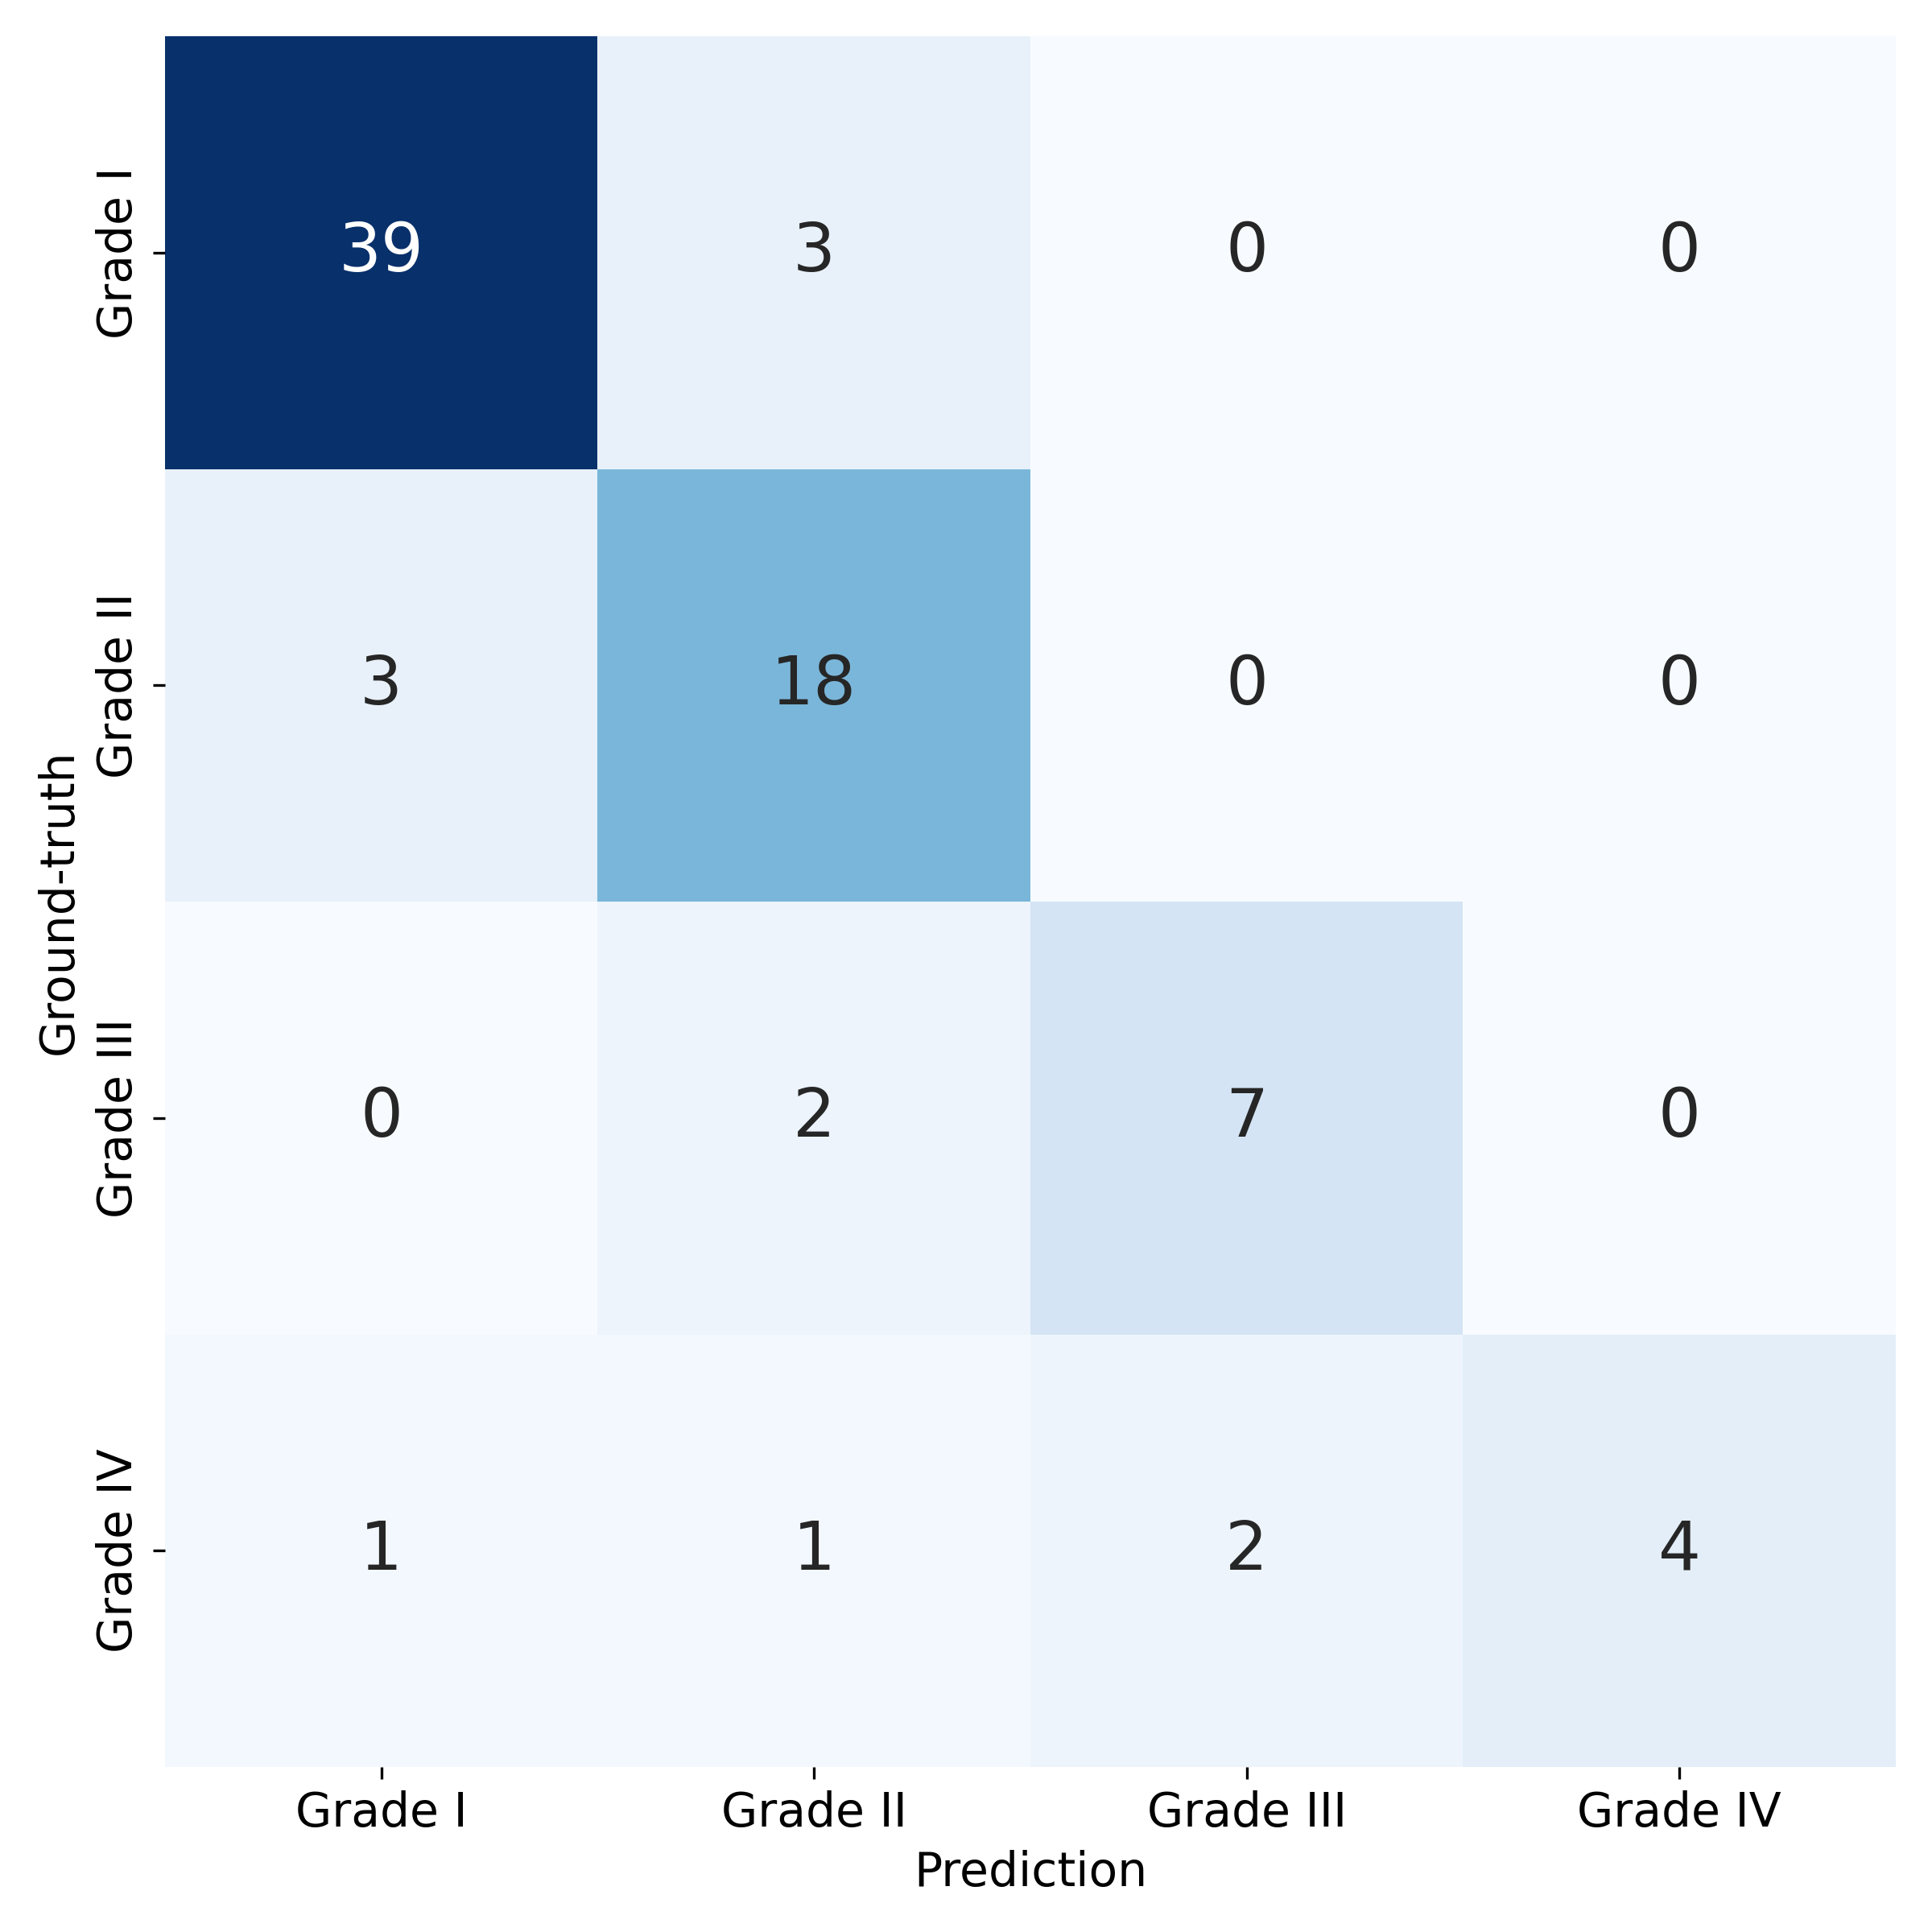
With the parameters presented in Table I, the proposed scoring system achieved excellent agreement with the ground-truth diagnosis when using the ground-truth measurements of the three angles in the test set (Cohen’s kappa=0.91). In contrast, the diagnostic agreement (Cohen’s kappa) was 0.73, 0.49, and 0.47, respectively, when using the criteria for the CE, Tönnis, and Sharp angles individually. When applied to the detected angles in the test set, the proposed diagnosis system obtained a mean (95% CI) diagnostic agreement of 0.84 (0.83-0.85), whereas the mean (95% CI) diagnostic agreement using the detected CE, Tönnis, and Sharp angles individually was 0.76 (0.75-0.77), 0.49 (0.48-0.50), and 0.43 (0.42-0.44), respectively. In comparison, the mean (95% CI) diagnostic agreement of the surgeons and residents group in the test set was 0.71 (0.63-0.79) and 0.67 (0.59-0.75), respectively. Furthermore, when examining the performance of staging DDH in the evaluation set, the proposed model achieved an overall classification agreement of 0.76 (Cohen’s kappa), with F1 scores of 0.92, 0.80, 0.78, and 0.67 for classes of grades I, II, III, and IV, respectively. The confusion matrix of DDH staging using the proposed model in the evaluation set is presented in Figure 4.
Figure 4: Confusion matrix of developmental dysplasia of the hip staging using the proposed model with the evaluation set based on the Crowe classification criteria.
V Discussion
As the first-line medical imaging modality for DDH in adults, radiography plays an essential role in the early detection of the disease. Clinically, the diagnosis of DDH is highly dependent on the manual evaluation of radiological features, including the CE, Tönnis, and Sharp angles, to identify possible pathological changes in the hip. This manual measurement and evaluation process is inefficient and error-prone, and the diagnostic performance may suffer due to intra-/inter-group variability and clinical inexperience. In this study, we proposed a deep learning-based end-to-end system for comprehensive DDH diagnosis from pelvic radiographs that performs automatic keypoint detection, radiological feature measurement, DDH diagnosis, and result visualization.
The Mask-RCNN architecture was employed to construct the proposed keypoint detection model. We replaced the instance masks of the segmentation branch with “one-hot” keypoint masks as the training target. To help the proposed model emphasize keypoint localization, we adopted focal loss as the objective function instead of cross-entropy loss. We further investigated the effectiveness of using heatmap masks as the training target to reduce the penalty on the negative locations in keypoint detection as proposed in [35]. The ablation analysis (Table IV) indicated that using focal loss led to significant higher keypoint detection performance than that using cross-entropy loss (<0.0001), while the heatmap masks did not outperform the proposed binary masks. In addition, we evaluated different CNN models as the feature extraction backbone model. The experimental results demonstrated that as the feature extraction backbone model, ResNet50 was always superior to more sophisticated models, such as the ResNet-FPN model presented in the Mask-RCNN study [20]. The reason for this result may be that our data size was much smaller than that in [20], and thus may have been insufficient to effectively train more sophisticated models.
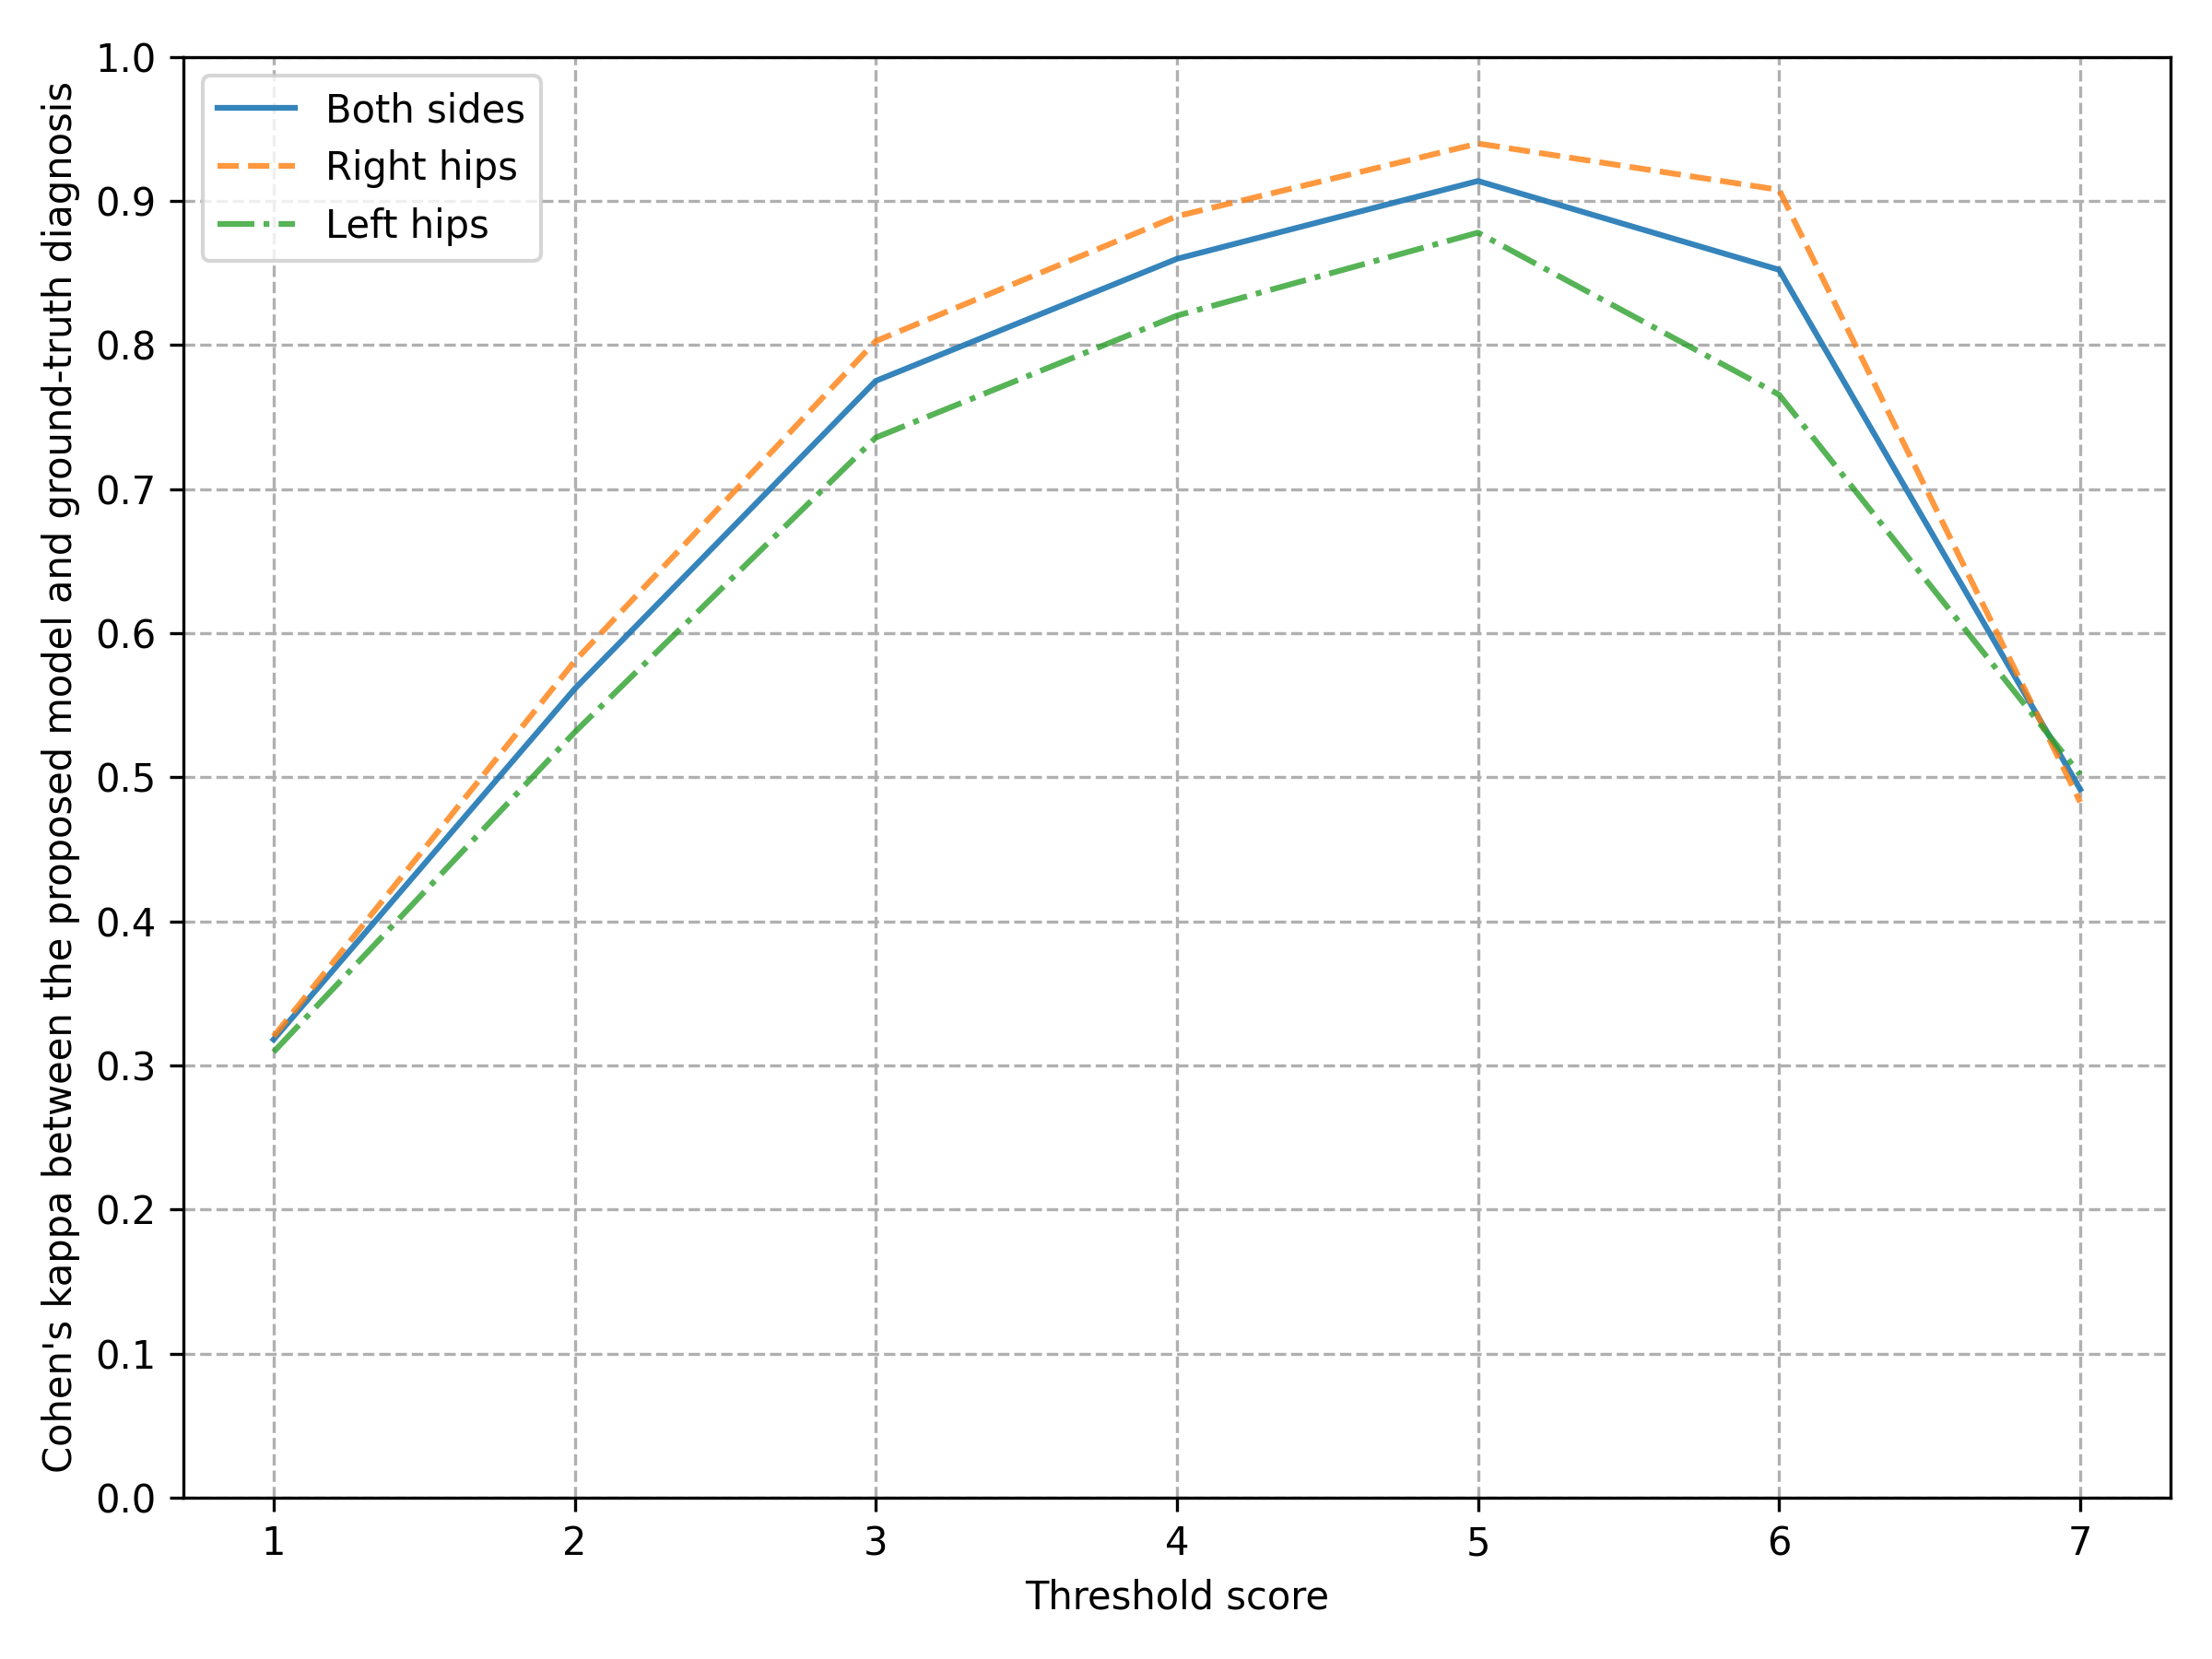
Figure 5: Relationship between the diagnostic agreement (Cohen’s kappa) and different threshold scores in the proposed scoring system for the diagnosis of developmental dysplasia of the hip
We adopted the OKS-based metrics to evaluate our keypoint detection model performance. OKS provides a perceptually meaningful measurement of the difference between detected and ground-truth keypoint locations by accounting for human variability in labeling the same keypoints. Based on a set of repeatedly labeled radiographs, we derived the constants in Equation (2) for each keypoint, representing the consistency of human labeling. Table II indicates that the constant varied remarkably for different keypoints. It is conceptually reasonable that a keypoint from a small instance in the pelvic radiograph (e.g., the center point of the femoral head) would have a smaller k constant than a keypoint from a large instance (e.g., the superior edge of the ilium). This is because a slight deviation in the detected location for a small instance keypoint from its ground-truth location would cause a more visually noticeable difference in performance; therefore, it requires a smaller k constant to make the OKS sensitive to minor localization differences. Moreover, the constant can also be interpreted as an indicator of human variability when labeling different keypoints from instances with similar scales. Thus, the constant may be helpful in understanding the reliability of clinical measurements. For example, the constant for the medial aspect of the acetabulum (keypoint D in Figure 1) was 2 to 3 times higher than that of the femoral head center (keypoint B). Considering that both keypoints are from a similar area of the hip, this suggests that the clinical measurement based on the medial aspect of the acetabulum (e.g., Tönnis angle) may be less reliable than that based on the femoral head center (e.g., CE angle). In terms of the results, the mean ICC between the angles obtained by the proposed model and the ground-truth was similar to that between the annotators’ repeated labels. However, the variance of the angle measurements for proposed model was much lower than that of the annotators, which indicates more stable and reliable results. Moreover, the proposed model exhibited significantly higher agreement in angle measurements (<0.0001) than that of experienced orthopedic surgeons and state-of-the-art results (Table VI).
A novel data-driven scoring system was introduced to integrate the measurements of the CE, Tönnis, and Sharp angles. Different scores were assigned to the diagnosis using the criteria for each angle individually, and the final comprehensive diagnosis was made based on the total score from the three measurements. We performed grid search for optimal parameters such that the diagnostic agreement (Cohen’s kappa) between the proposed scoring system and the ground-truth labels was maximized. For example, when determining the score for the CE angle classified as DDH, the diagnostic agreement for a score of 3 was 0.91 with the proposed setup, whereas that for scores of 1, 2, and 4 were 0.83, 0.88, and 0.90, respectively. Moreover, Figure 5 illustrates the selection of the threshold total score that determines the final diagnosis in the proposed model, where a total score of 5 yields the optimal outcome. Therefore, all parameters are learned from a reasonably large dataset instead of relying on handcrafted rules, which may be derived from subjective experience or based on a limited number of observations. In this case, the proposed scoring system provides a self-contained explanation of the diagnosis, improving the objectivity and generalization of DDH diagnosis. The experimental results also revealed that the proposed scoring system considerably outperformed diagnoses based on single angles as well as diagnoses made by experienced orthopedists. In addition, the proposed scoring system weights abnormal CE angles more than abnormal Tönnis or Sharp angles, and the diagnosis of DDH requires at least two positive detections (Table I). This behavior is consistent with the suggestions in the literature [6] as well as in clinical practice, which can further improve the credibility and explainability of the diagnosis.
Regarding DDH diagnosis, the proposed system achieved significantly better diagnostic agreement (Cohen’s kappa) on the test set than both the surgeons and resident groups (<0.0001); namely, it achieved a mean (95% CI) diagnostic agreement of 0.84 (0.83-0.85), whereas the surgeons and residents groups achieved a mean (95% CI) diagnostic agreement of 0.71 (0.63-0.79) and 0.67 (0.59-0.75), respectively. Moreover, the overall diagnosis F1 score of the proposed system was 0.865, which is much higher than that reported in [37] (0.312, calculated from the reported precision and recall), where the authors performed DDH diagnosis based on the detected Sharp angle only. Upon examining the performance of DDH staging on the evaluation set, the proposed model obtained F1 scores of 0.92 and 0.80 in classifying mild-to-moderate cases (grades I and II, respectively). However, further examination of the confusion matrix indicated that the performance of the proposed model in differentiating serve-stage DDH (grade IV) was suboptimal (F1=0.67). This may have resulted from the limited number of severe DDH cases included in this study, reflected in the data characteristics of the evaluation set (Table III). Furthermore, severe DDH can dramatically change a hip’s radiological features on a case-by-case basis; however, the changes are typically evident on the radiograph. For this reason, detecting keypoints and measuring angles for severe DDH cases may be inefficient and of less clinical interest, as servere DDH is unlikely to be misdiagnosed. Therefore, we can use classification models instead of the keypoint detection-based method to improve the diagnosis of severe DDH in the future.
There are some limitations that should be considered. First, the data size used in this study may have been insufficient to evaluate sophisticated deep learning models. However, the experimental results indicated that our data size could effectively train the proposed keypoint detection model. Second, the diagnosis labels provided by the annotators were based on subjective evaluation and manual measurement and may thus have suffered from inter-observer variability and affected the performance evaluation. Finally, the proposed scoring system for DDH diagnosis was developed and evaluated with data from a single clinic. Thus, the proposed criteria and assessment results may have been biased and may not be valid for data from other sources. Therefore, we plan to collect more data from various sources for further validation and improvement of our proposed system.
VI Conclusion
In this study, we presented a fully automated end-to-end system for the comprehensive diagnosis of DDH from pelvic radiographs based on deep learning keypoint detection and a novel data-driven scoring system. The proposed approach demonstrated state-of-the-art performance on different tasks and can be used to provide reliable and explainable support for clinical decision-making.
References
[1]
M. J. Siegel, Pediatric sonography. Lippincott Williams & Wilkins, 2011.
[2]
C. Dezateux and K. Rosendahl, “Developmental dysplasia of the hip,” The
Lancet, vol. 369, no. 9572, pp. 1541–1552, 2007.
[3]
F.-D. Tian, D.-W. Zhao, W. Wang, L. Guo, S.-M. Tian, A. Feng, F. Yang, and
D.-Y. Li, “Prevalence of developmental dysplasia of the hip in chinese
adults: A cross-sectional survey,” Chinese Medical Journal, vol. 130,
no. 11, pp. 1261–1268, 2017.
[4]
I. K. Sharp, “Acetabular dysplasia: the acetabular angle,” The Journal
of Bone and Joint Surgery. British Volume, vol. 43, no. 2, pp. 268–272,
1961.
[5]
M. Sewell, K. Rosendahl, and D. Eastwood, “Developmental dysplasia of the
hip,” Bmj, vol. 339, 2009.
[6]
F. Pereira, A. Giles, G. Wood, and T. N. Board, “Recognition of minor adult
hip dysplasia: which anatomical indices are important?” Hip
International, vol. 24, no. 2, pp. 175–179, 2014.
[7]
G. Wiberg, “Studies on dysplastic acetabula and congenital subluxation of the
hip joint. with special reference to the complication of coxarthrosis,”
Acta Chir Scand Suppl, vol. 83, pp. 28–38, 1939.
[8]
D. Tönnis, “Normal values of the hip joint for the evaluation of x-rays in
children and adults.” Clinical orthopaedics and related research, no.
119, pp. 39–47, 1976.
[9]
J. Crowe, “Mani vj, ranawat cs. total hip replacement in congenital
dislocation and dysplasia of the hip,” J. Bone and Joint Surg, pp.
15–23, 1979.
[10]
M. A. Badgeley, J. R. Zech, L. Oakden-Rayner, B. S. Glicksberg, M. Liu,
W. Gale, M. V. McConnell, B. Percha, T. M. Snyder, and J. T. Dudley, “Deep
learning predicts hip fracture using confounding patient and healthcare
variables,” NPJ digital medicine, vol. 2, no. 1, pp. 1–10, 2019.
[11]
Y. Li, Y. Li, and H. Tian, “Deep learning-based end-to-end diagnosis system
for avascular necrosis of femoral head,” IEEE Journal of Biomedical
and Health Informatics, vol. 25, no. 6, pp. 2093–2102, 2020.
[12]
C. E. von Schacky, J. H. Sohn, F. Liu, E. Ozhinsky, P. M. Jungmann, L. Nardo,
M. Posadzy, S. C. Foreman, M. C. Nevitt, T. M. Link et al.,
“Development and validation of a multitask deep learning model for severity
grading of hip osteoarthritis features on radiographs,” Radiology,
vol. 295, no. 1, pp. 136–145, 2020.
[13]
P. Rouzrokh, C. C. Wyles, K. A. Philbrick, T. Ramazanian, A. D. Weston, J. C.
Cai, M. J. Taunton, D. G. Lewallen, D. J. Berry, B. J. Erickson
et al., “A deep learning tool for automated radiographic measurement
of acetabular component inclination and version after total hip
arthroplasty,” The Journal of Arthroplasty, vol. 36, no. 7, pp.
2510–2517, 2021.
[14]
D. G. Lowe, “Distinctive image features from scale-invariant keypoints,”
International journal of computer vision, vol. 60, no. 2, pp. 91–110,
2004.
[15]
E. Rublee, V. Rabaud, K. Konolige, and G. Bradski, “Orb: An efficient
alternative to sift or surf,” in 2011 International conference on
computer vision. Ieee, 2011, pp.
2564–2571.
[16]
V. Balntas, K. Lenc, A. Vedaldi, and K. Mikolajczyk, “Hpatches: A benchmark
and evaluation of handcrafted and learned local descriptors,” in
Proceedings of the IEEE conference on computer vision and pattern
recognition, 2017, pp. 5173–5182.
[17]
A. Toshev and C. Szegedy, “Deeppose: Human pose estimation via deep neural
networks,” in Proceedings of the IEEE conference on computer vision
and pattern recognition, 2014, pp. 1653–1660.
[18]
J. Tompson, R. Goroshin, A. Jain, Y. LeCun, and C. Bregler, “Efficient object
localization using convolutional networks,” in Proceedings of the IEEE
conference on computer vision and pattern recognition, 2015, pp. 648–656.
[19]
A. Newell, K. Yang, and J. Deng, “Stacked hourglass networks for human pose
estimation,” in European conference on computer vision. Springer, 2016, pp. 483–499.
[20]
K. He, G. Gkioxari, P. Dollár, and R. Girshick, “Mask r-cnn,” in
Proceedings of the IEEE international conference on computer vision,
2017, pp. 2961–2969.
[21]
H. S. Park, K. Jeon, Y. J. Cho, S. W. Kim, S. B. Lee, G. Choi, S. Lee, Y. H.
Choi, J.-E. Cheon, W. S. Kim et al., “Diagnostic performance of a new
convolutional neural network algorithm for detecting developmental dysplasia
of the hip on anteroposterior radiographs,” Korean Journal of
Radiology, vol. 22, no. 4, p. 612, 2021.
[22]
W. Yang, Q. Ye, S. Ming, X. Hu, Z. Jiang, Q. Shen, L. He, and X. Gong,
“Feasibility of automatic measurements of hip joints based on pelvic
radiography and a deep learning algorithm,” European Journal of
Radiology, vol. 132, p. 109303, 2020.
[23]
P. Skalski, “Make Sense,” https://github.com/SkalskiP/make-sense/,
2019.
[24]
J. A. Hanson, A. L. Kapron, K. M. Swenson, T. G. Maak, C. L. Peters, and S. K.
Aoki, “Discrepancies in measuring acetabular coverage: revisiting the
anterior and lateral center edge angles,” Journal of hip preservation
surgery, vol. 2, no. 3, pp. 280–286, 2015.
[25]
T.-Y. Lin, P. Goyal, R. Girshick, K. He, and P. Dollár, “Focal loss for
dense object detection,” in Proceedings of the IEEE international
conference on computer vision, 2017, pp. 2980–2988.
[26]
K. He, X. Zhang, S. Ren, and J. Sun, “Deep residual learning for image
recognition,” in Proceedings of the IEEE conference on computer vision
and pattern recognition, 2016, pp. 770–778.
[27]
J. Deng, W. Dong, R. Socher, L.-J. Li, K. Li, and L. Fei-Fei, “Imagenet: A
large-scale hierarchical image database,” in 2009 IEEE conference on
computer vision and pattern recognition. Ieee, 2009, pp. 248–255.
[28]
L. Fa, Q. Wang, and X. Ma, “Superiority of the modified tönnis angle over
the tönnis angle in the radiographic diagnosis of acetabular dysplasia,”
Experimental and Therapeutic Medicine, vol. 8, no. 6, pp. 1934–1938,
2014.
[29]
J. Cohen, “A coefficient of agreement for nominal scales,” Educational
and psychological measurement, vol. 20, no. 1, pp. 37–46, 1960.
[30]
M. Ruggero Ronchi and P. Perona, “Benchmarking and error diagnosis in
multi-instance pose estimation,” in Proceedings of the IEEE
international conference on computer vision, 2017, pp. 369–378.
[31]
T.-Y. Lin, M. Maire, S. Belongie, J. Hays, P. Perona, D. Ramanan,
P. Dollár, and C. L. Zitnick, “Microsoft coco: Common objects in
context,” in European conference on computer vision. Springer, 2014, pp. 740–755.
[32]
“Common objects in context.” [Online]. Available:
https://cocodataset.org/#keypoints-eval
[33]
S. Xie, R. Girshick, P. Dollár, Z. Tu, and K. He, “Aggregated residual
transformations for deep neural networks,” in Proceedings of the IEEE
conference on computer vision and pattern recognition, 2017, pp. 1492–1500.
[34]
T.-Y. Lin, P. Dollár, R. Girshick, K. He, B. Hariharan, and S. Belongie,
“Feature pyramid networks for object detection,” in Proceedings of
the IEEE conference on computer vision and pattern recognition, 2017, pp.
2117–2125.
[35]
H. Law and J. Deng, “Cornernet: Detecting objects as paired keypoints,” in
Proceedings of the European conference on computer vision (ECCV),
2018, pp. 734–750.
[36]
T. K. Koo and M. Y. Li, “A guideline of selecting and reporting intraclass
correlation coefficients for reliability research,” Journal of
chiropractic medicine, vol. 15, no. 2, pp. 155–163, 2016.
[37]
Q. Li, L. Zhong, H. Huang, H. Liu, Y. Qin, Y. Wang, Z. Zhou, H. Liu, W. Yang,
M. Qin et al., “Auxiliary diagnosis of developmental dysplasia of the
hip by automated detection of sharp’s angle on standardized anteroposterior
pelvic radiographs,” Medicine, vol. 98, no. 52, 2019.