The Cosmic Telescope that Lenses the Sunburst Arc, PSZ1 G311.6518.48: Strong Gravitational Lensing model and Source Plane Analysis111Based on observations made with the NASA/ESA Hubble Space Telescope, obtained at the Space Telescope Science Institute, which is operated by the Association of Universities for Research in Astronomy, Inc., under NASA contract NAS 5-26555. These observations are associated with programs GO-15101, GO-15377, GO-15418, GO-15949
Abstract
We present a strong lensing analysis of the cluster PSZ1 G311.6518.48, based on Hubble Space Telescope imaging, archival VLT/MUSE spectroscopy, and Chandra X-ray data. This cool-core cluster () lenses the brightest lensed galaxy known, dubbed the “Sunburst Arc” (), a Lyman continuum (LyC) emitting galaxy multiply-imaged 12 times. We identify in this field 14 additional strongly-lensed galaxies to constrain a strong lens model, and report secure spectroscopic redshifts of four. We measure a projected cluster core mass of M⊙. The two least-magnified but complete images of the Sunburst Arc’s source galaxy are magnified by , while the LyC clump is magnified by 4-80. We present time delay predictions and conclusive evidence that a discrepant clump in the Sunburst Arc, previously claimed to be a transient, is not variable, thus strengthening the hypothesis that it results from an exceptionally high magnification. A source plane reconstruction and analysis of the Sunburst Arc finds its physical size to be kpc, and that it is resolved in three distinct directions in the source plane, , , and (east of North). We place an upper limit of pc on the source plane size of unresolved clumps, and pc for the LyC clump. Finally, we report that the Sunburst Arc is likely in a system of two or more galaxies separated by kpc in projection. Their interaction may drive star formation and could play a role in the mechanism responsible for the leaking LyC radiation.
1 Introduction
Nature’s most powerful telescopes, strong gravitational lenses, are now routinely used as a tool to study the highly-magnified universe behind them. Observations of gravitationally-lensed galaxies at can probe spatial scales on the order of tens of parsecs (e.g., Johnson et al., 2017; James et al., 2018), and can enable spectral diagnostics (e.g., Rigby et al., 2018; Chisholm et al., 2019; Fischer et al., 2019; Patrício et al., 2019) that are otherwise beyond the capabilities of current observatories.
Since gravitational lensing is wavelength independent, the interpretation of many observed physical properties of lensed sources is lensing invariant. These include all measurements that rely on color, line ratios, optical depth, and wavelength — like stellar population ages, metallicity, and velocities. In addition, in calculating some relative quantities such as specific star formation rate, the lensing magnification cancels out, making the quotient independent of the magnification.
By contrast, the interpretation of absolute measurements — like luminosity, star formation rate, and stellar mass — relies heavily on properly understanding how gravitational lensing affects the observed quantities, as they are sensitive to the details of the transformation of measured properties from the observed frame to the intrinsic frame of the source.
The strong lensing galaxy cluster PSZ1 G311.6518.48, which is the focus of this paper, was discovered by Dahle et al. (2016), in an optical imaging program to follow up the Planck catalog of Sunyaev Zel’dovich (SZ) cluster candidates. The imaging data confirmed that the candidate is indeed a cluster, and revealed a -long giant arc, which is projected from the brightest cluster galaxy (BCG), and with an azimuthal extent of . Dahle et al. (2016) reported integrated Vega magnitudes of R, z, J, Ks = 17.82, 17.38, 16.75, 15.43 mag, making it brighter by more than one magnitude than any previously known lensed galaxy at . Shallow long-slit spectroscopy of the giant arc, using the Inamori-Magellan Areal Camera & Spectrograph (IMACS) instrument on the Magellan-I 6.5-m telescope (spectral resolution ), revealed numerous emission and absorption lines, including Ly in emission, Si II Å, C IV Å, and nebular semi-forbidden transitions of O III] Å, Si III] Å, and C III] Å at . Observations targeting the foreground cluster lens include a spectrum of the BCG, which places it at redshift . The BCG spectrum interestingly reveals strong emission of the [OII] Å doublet, which is generally an indication of dust-unobscured star formation activity (Calzetti, 2013). Dahle et al. (2016) estimated the mass of the core of the cluster from the projected radial distance of the giant arc, assuming spherical symmetry. The total projected mass density enclosed within the radius of the arc was estimated as M⊙, which, with crude extrapolation of the cluster core mass to larger radii, is consistent with the estimated SZ-inferred mass.
Rivera-Thorsen et al. (2017) observed the brightest region of the arc with the Magellan Echellette (MagE) and with the Folded-port InfraRed Echelle (FIRE) instruments on the Magellan-I 6.5-m telescope, obtaining broad wavelength coverage and higher spectral resolution than the previous IMACS data. They found that the Ly emission is triple-peaked, which they interpreted as a combination of emission from Ly that underwent a large number of scatterings, and a narrow component that emerges directly from the source without scattering. To explain this triple-peaked profile, they proposed that the galaxy has a perforated neutral medium, where some radiation escapes the source directly through an ionized channel, while some radiation experiences multiple scatterings in an optically thick neutral medium. They nicknamed the source “the Sunburst Arc”, for its resemblance to a “direct view of the Sun through rifted clouds”.
In a follow-up work, using data from the Hubble Space Telescope (HST), Rivera-Thorsen et al. (2019) found that large quantities of ionizing photons are escaping from this lensed galaxy, by targeting the field with the HST/WFC3 F275W broad-band filter (GO-15418). At the redshift of the giant arc, the F275W filter captures the Å photons that are capable of ionizing hydrogen — also called the Lyman Continuum (LyC). Given the compact region exhibiting LyC escape, and the Ly profile, Rivera-Thorsen et al. (2019) concluded that the observed emission is consistent with LyC radiation escaping through a narrow clear channel in otherwise optically thick gas. The leaked LyC radiation is coming from a star forming region within the source galaxy, which is strongly lensed into 12 images. The images of the LyC source are unresolved in the HST data, and appear as point sources. The variation of up to a factor of five in the apparent escape fraction measured in the different copies of the source was attributed to varying absorption by neutral hydrogen along the different lines of sight to these images, thus probing the patchiness of the intergalactic or circumgalactic medium.
Chisholm et al. (2019) fit Starburst99 models to MagE spectroscopy (see Section 2.3) of the LyC knot, and derived its UV-light-weighted age and stellar metallicity, finding an age of 3 Myr and .
Vanzella et al. (2020a) used lensing-symmetry arguments to estimate a model-independent lower limit of the average magnification of the arc, . They presented archival Very Large Telescope (VLT) Multi Unit Spectroscopic Explorer (MUSE) spectroscopy (see Section 2.3), and, absent a lens model, derived the physical properties of the source as a function of the unknown magnification, based on the age and metallicity measured by Chisholm et al. (2019). They concluded that the LyC knot is a gravitationally bound star cluster, with an effective radius smaller than 20 pc, and stellar mass in the range M⊙ depending on magnification and initial mass function, implying that it is very massive and very dense, and that the LyC leaking radiation is highly localized.
Using the giant arc as an extended backlight, Lopez et al. (2020) studied the absorbing circumgalactic medium halo of a foreground galaxy at . The interloper is seen in the HST imaging directly, and its gas halo is revealed in the MUSE and MagE spectra of the giant arc as absorption lines from Mgii, Feii, and Mgi. The background arc, which probes the gaseous envelope of the intervening absorber from kpc, enables a dense sampling of the rotation curve, the gas distribution, and its enrichment profile. This study adds to a growing literature of using extended arcs as backlight, which complements the traditional pencil-beam approach of using background quasars as a light source to study intervening absorbers. The absorber plane impact parameters, i.e., distances between segments of the Sunburst Arc images and the studied foreground galaxy in Lopez et al. (2020) were measured using an early version of the lens model presented here.
Two lens models have been published for this system in the past year. Pignataro et al. (2021) used a subset of the HST data we present here, and the same archival MUSE data, to identify lensing constraints and measure spectroscopic redshifts of lensed galaxies. Their parametric lens model is based on constraints from four multiply-imaged lensed galaxies. They also used the velocity dispersion of several cluster-member galaxies to inform their contribution to the lensing potential. They estimated a cluster core mass of M⊙ within kpc, and found that the mass distribution is fairly symmetrical, with contribution of less than 10% from subhalos.
Building on the lensing evidence identified by Pignataro et al. (2021), Diego et al. (2022) modeled the cluster with the hybrid algorithm WSLAP (Diego et al., 2005). They added strong lensing constraints on the positions of the critical curve as identified from the observed symmetry in the giant arcs. Their analysis pays close attention to the non-trivial lensing configuration in the northwest image of the Sunburst Arc in PSZ1 G311.6518.48, and in particular explores models that can produce the high multiplicity and the appearance of a discrepant point source by forcing the critical curve to pass through certain positions. They reported limits on the mass and location of the substructure that is required in order to explain the observed magnifications and morphology within this arc. Diego et al. (2022) also presented time delay and magnification predictions in their analysis and concluded that the discrepant clump is unlikely to be a transient as was claimed by Vanzella et al. (2020b). As we discuss below, our analysis supports their conclusion with additional evidence.
The two lens modeling papers mentioned above appeared in the literature after our lensing analysis was finalized. We emphasise that our lens modeling and source analysis, which we present here, were conducted entirely independently from the lensing analysis, source identification, and redshift measurements of Diego et al. (2022) and Pignataro et al. (2021). Our analysis is based on all the HST imaging available to date; we increase the number of lensed systems that are used as constraints from five to fifteen, and update the redshift measurement of one of these systems.
In this paper, we present a detailed lensing analysis of PSZ1 G311.6518.48 based on extensive HST imaging and VLT/MUSE spectroscopy. A number of science questions can be addressed with accurate strong gravitational lensing models of clusters of galaxies such as PSZ1 G311.6518.48. The strong lensing model maps the projected mass density distribution at the core of the cluster, which can in turn be used to study its structure and the interplay between the dark and luminous components that reside in clusters’ deep potential wells. Other model outputs facilitate investigations of the background Universe using the cluster as cosmic telescope. We derive the lensing magnification in this field, with emphasis on the Sunburst Arc and the LyC knot. A measurement of the lensing magnification is required for converting the observed to intrinsic properties of lensed sources. To fully understand the morphology of the source, we derive deflection maps with which to construct a qualitative view of the Sunburst Arc’s source plane, and constrain the unlensed, intrinsic sizes of unresolved clumps in this galaxy. A prediction of the time delay between images of the source helps interpreting its observed components and could be useful to constraints cosmological parameters if a variable source is found.
The paper is organized as follows. In Section 2 we present the imaging and spectroscopy datasets used in this work. Section 3 details the lensing evidence. Section 4 describes the lens modeling process. We present and discuss our results in Section 5, and summarise our findings in Section 6. Throughout this work we assume a flat cosmology with , , and km s-1 Mpc-1. Magnitudes are reported in the AB system unless otherwise stated. We adopt a cluster redshift of and a systemic redshift of for the Sunburst Arc.
2 Data
2.1 HST Imaging and Grism Spectroscopy
PSZ1 G311.6518.48 was the target of several HST programs in Cycle 25. GO-15101 (PI: Dahle) obtained multi-band imaging and grism spectroscopy of PSZ1 G311.6518.48 with the goals of enabling a robust lensing analysis and investigating the physical conditions of the lensed galaxy. That program used five orbits of broad-band imaging in the F555W, F814W, F105W and F140W filters; four orbits of F410M medium band imaging; and five orbits of WFC3 G141 grism spectroscopy. A second program, GO-15377 (PI: Bayliss), complemented these data with four orbits of HST imaging in F606W, F098M, F125W, and F160W as part of a Chandra Cycle-19 program, to determine whether the source galaxy hosts an active galactic nucleus (AGN) and observe the diffuse X-ray gas of the lensing cluster. Third, the Cycle 25 mid-cycle program GO-15418 (PI: Dahle) used three HST orbits to probe the LyC of the lensed source in F275W. Some of the visits failed due to gyroscope problems, and were repeated. Table 1 tabulates the successful and failed HST Cycle 25 observations from the programs listed above.
The target was also observed by two programs in HST Cycle 27. A two-orbit integration in F390W was executed in 2020 July 13 by GO-15949 (PI: Gladders) and is used in this work; the remaining data from Cycle 27 will be presented and analyzed in forthcoming publications.
The HST imaging data were reduced following standard procedures, after inspecting each image for quality assurance, given the higher than usual failure rate due to the gyroscope problems in Cycles 25–26. We used the Drizzlepac222http://www.stsci.edu/scientific-community/software/drizzlepac.html software package to reduce the data and align the frames to a common reference grid, as follows. First, exposures in each filter that were taken within a single visit were drizzled using the astrodrizzle routine using a Gaussian kernel with a drop size (final_pixfrac) of . Next, for each filter in which observations were executed over multiple visits, the drizzled images from each visit were aligned to a common world coordinate system (WCS) using the tweakreg routine. These WCS solutions were propagated back to the individual exposures using tweakback before all exposures in a single filter were drizzled together using astrodrizzle, with the same parameters listed above. Finally, the drizzled images were aligned in WCS space, again using tweakreg, and drizzled using astrodrizzle with the same kernel and drop size onto a common reference grid with North up and a pixel scale of per pixel.
WFC3 IR G141 Grism observations from GO-15101 were executed with two telescope roll angles, ORIENT= and . The data were reduced using the reduction package Grizli333 https://github.com/gbrammer/grizli, using standard reduction procedures. We used these data to search for or attempt to confirm candidate lensed galaxies in the Grism spectra.
| Program | Camera | Filter/grating | Date (UT) | Exp. Time [s] | |
|---|---|---|---|---|---|
| GO-15101 | WFC3/UVIS | F410M | 2019-08-13 | 13285 | |
| WFC3/UVIS | F555W | 2019-03-11 | 2852 (*) | ||
| WFC3/UVIS | F555W | 2019-03-11 | 2964 (*) | ||
| WFC3/UVIS | F555W | 2019-06-24 | 2792 | ||
| WFC3/UVIS | F555W | 2019-06-24 | 2824 | ||
| ACS | F814W | 2018-02-21 | 2544 | ||
| ACS | F814W | 2018-02-22 | 2736 | ||
| WFC3/IR | F105W | 2019-03-12 | 1312 (*) | ||
| WFC3/IR | F105W | 2019-06-24 | 1312 | ||
| WFC3/IR | F140W | 2019-03-12 | 1312 (*) | ||
| WFC3/IR | F140W | 2019-06-24 | 1312 | ||
| WFC3/GRISM | F140W | 2019-05-12 | 868 | ||
| WFC3/GRISM | F140W | 2019-06-30 | 562 | ||
| WFC3/GRISM | G141 | 2019-05-12 | 8418 | ||
| WFC3/GRISM | G141 | 2019-06-30 | 5612 | ||
| GO-15377 | WFC3/IR | F098M | 2019-03-06 | 1359 | |
| WFC3/IR | F125W | 2019-03-06 | 1359 | ||
| WFC3/IR | F125W | 2019-04-30 | 1359 | ||
| WFC3/IR | F160W | 2018-09-27 | 1359 | ||
| WFC3/UVIS | F606W | 2018-09-27 | 1484 | ||
| WFC3/UVIS | F606W | 2019-01-17 | 2982 (*) | ||
| WFC3/UVIS | F606W | 2019-03-06 | 1484 (*) | ||
| WFC3/UVIS | F606W | 2019-03-06 | 1484 (*) | ||
| WFC3/UVIS | F606W | 2019-03-12 | 2922 | ||
| WFC3/UVIS | F606W | 2019-04-30 | 1424 | ||
| GO-15418 | WFC3/UVIS | F275W | 2018-04-14 | 6318 | |
| WFC3/UVIS | F275W | 2018-04-08 | 3104 | ||
| GO-159491 | WFC3/UVIS | F390W | 2020-07-14 | 3922 |
Note. — HST observations that were used for the lensing analysis presented in this paper. (*) these visits failed due to gyroscope problems in Cycles 25-26 and subsequently repeated. 1Additional data from GO-15949 beyond that listed here were not used in this work.
2.2 Chandra X-ray Data
The field containing the Sunburst Arc was observed with the Chandra X-ray Observatory under observation ID 20442. The purpose of this observation was to constrain any bright X-ray emission from the lensed galaxy, while also producing a robust detection of the foreground cluster lens. The observation was executed as a single 39.53 ks exposure with the aimpoint located near the center of the I3 chip in the ACIS-I array. To minimize background the observation was performed in VFAINT telemetry mode. We reduced the Chandra data using Chandra Interactive Analysis of Observations (CIAO v4.13) with CALDB v4.9.6 to apply routine processing. The data were filtered for flares using the lc_sigma_clip function in the lightcurves Python package that is included in CIAO, resulting in a usable integration time of 38.53 ks. We apply a 0.5–7 keV energy filter to the reduced event file and correct for a small (1″) astrometric offset between the Chandra and HST data by comparing the coordinates of a galaxy that appears both in the HST field of view and as an X-ray point source in the Chandra data. We then use the 0.5–7 keV Chandra image to measure the basic X-ray properties of the foreground cluster lens. The X-ray peak (brightest pixel) is at R.A. 15:50:07.053, Decl. 78:11:29.165, and the X-ray centroid at: R.A. 15:50:06.82, Decl. 78:11:29.921, both within of the BCG in projection.
The total observed keV X-ray flux is erg cm-2 s-1. Excising the central kpc to estimate a core-excised flux results in erg cm-2 s-1. The ratio of those two values (core-excised to total fluxes) make it clear that the cluster has an extremely strong cool core. For example, a comparison to other Planck clusters analyzed by Mantz et al. (2018) places this cluster on the extreme end in terms of , meaning that its X-ray emission is among the most core-dominated. This is consistent with what is observed in the optical and IR; the BCG appears dust-obscured, with evident filamentary star formation activity both in imaging and spectroscopy, similar to what is seen in other extremely strong cool cores (e.g., the Phoenix Cluster; McDonald et al., 2012, 2019).
2.3 Ground-Based Spectroscopy
PSZ1 G311.6518.48 was observed with MUSE on the VLT on 2016 May 13 (ESO program 297.A-2012(A); PI Aghanim). The data were retrieved from the ESO archive; the data reduction process is detailed in Weilbacher et al. (2020) and Urrutia et al. (2019). The field was observed for 2966 s under good conditions, with seeing, spanning Å with . The MUSE cube results in a spectrum for each resolution unit, which is a powerful way to derive redshifts for numerous sources in the field of view, since there is no need to decide in advance which sources to target. We use the MUSE data to confirm counter images in lensed systems and measure their redshifts.
The field was observed with Magellan Echellette on the Magellan-I 6.5-m Baade telescope, covering multiple distinct image plane regions in the north and northwest arcs. The details of the observation and data reduction are given in Rivera-Thorsen et al. (2017, 2019); Lopez et al. (2020), and most comprehensively in Rigby et al. (2022, in prep). These data were used to confirm the identifications of some of the clumps in the sunburst arc.
3 Lensing Evidence
3.1 The Strong Lensing Interpretation of Source 1: the Sunburst Arc
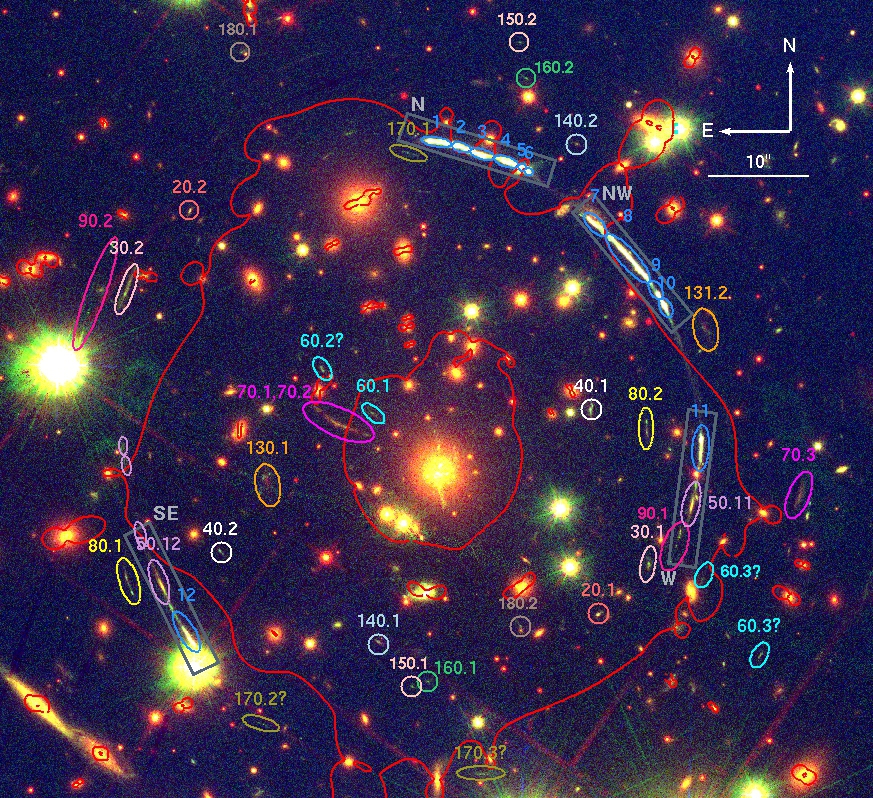
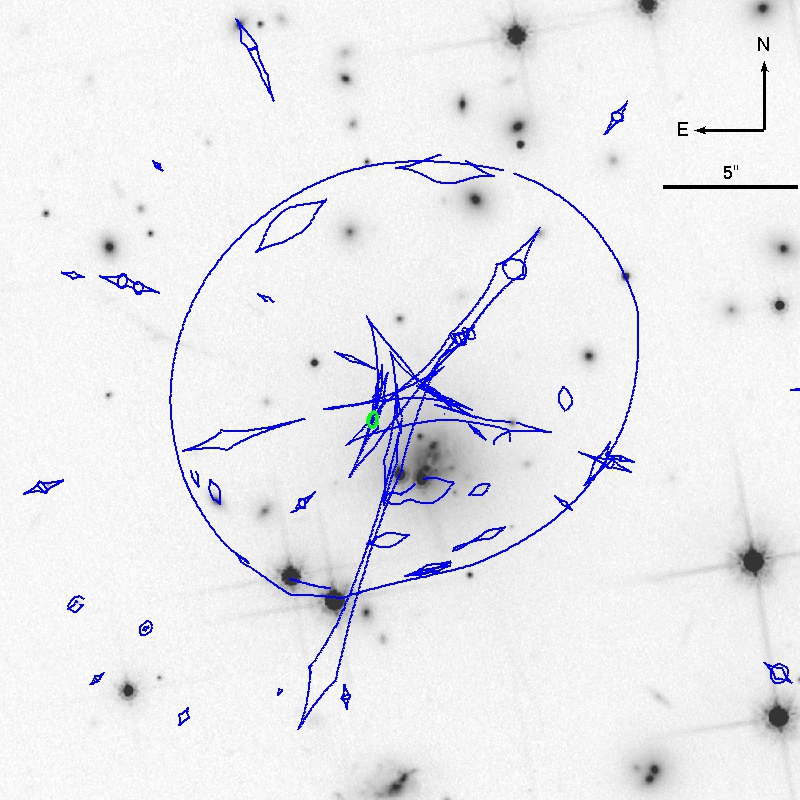
The most prominent lensing feature in the field of PSZ1 G311.6518.48 (Figure 1) is the highly-magnified galaxy discovered by Dahle et al. (2016). In the discovery paper, based on ground-based - and -band imaging data from the ESO New Technology Telescope (NTT), Dahle et al. (2016) reported that the source is lensed into three giant arcs, which appear north, northwest, and west of the BCG (S1, S2, S3 in their notation), with a possible fourth image to the southeast. They measure a spectroscopic redshift of from nebular emission lines, and from the Ly emission line. Rivera-Thorsen et al. (2017) determined the systemic redshift of the system as from nebular line emission in the FIRE spectra. A systemic redshift of was obtained from an average of the velocities of the narrow components of the [O III] 4959, 5007 Å line in several FIRE pointings (Mainali et al. 2022 in prep). Differences of this order are within expectation due to velocity differences between the galaxy components, e.g., winds and relative motions, and insignificant for the purpose of lens modeling. In this work we adopt as the systemic redshift.
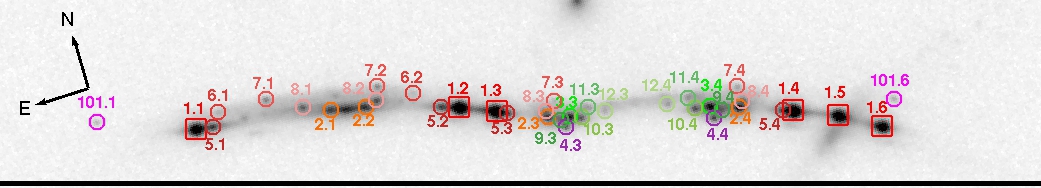
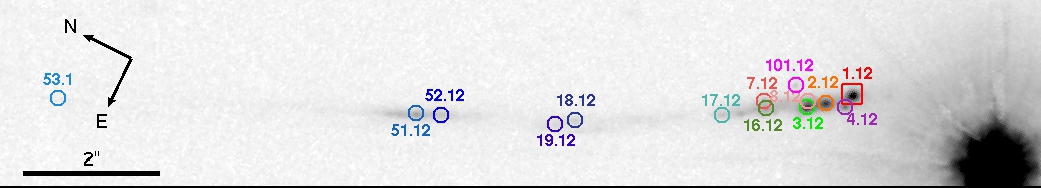
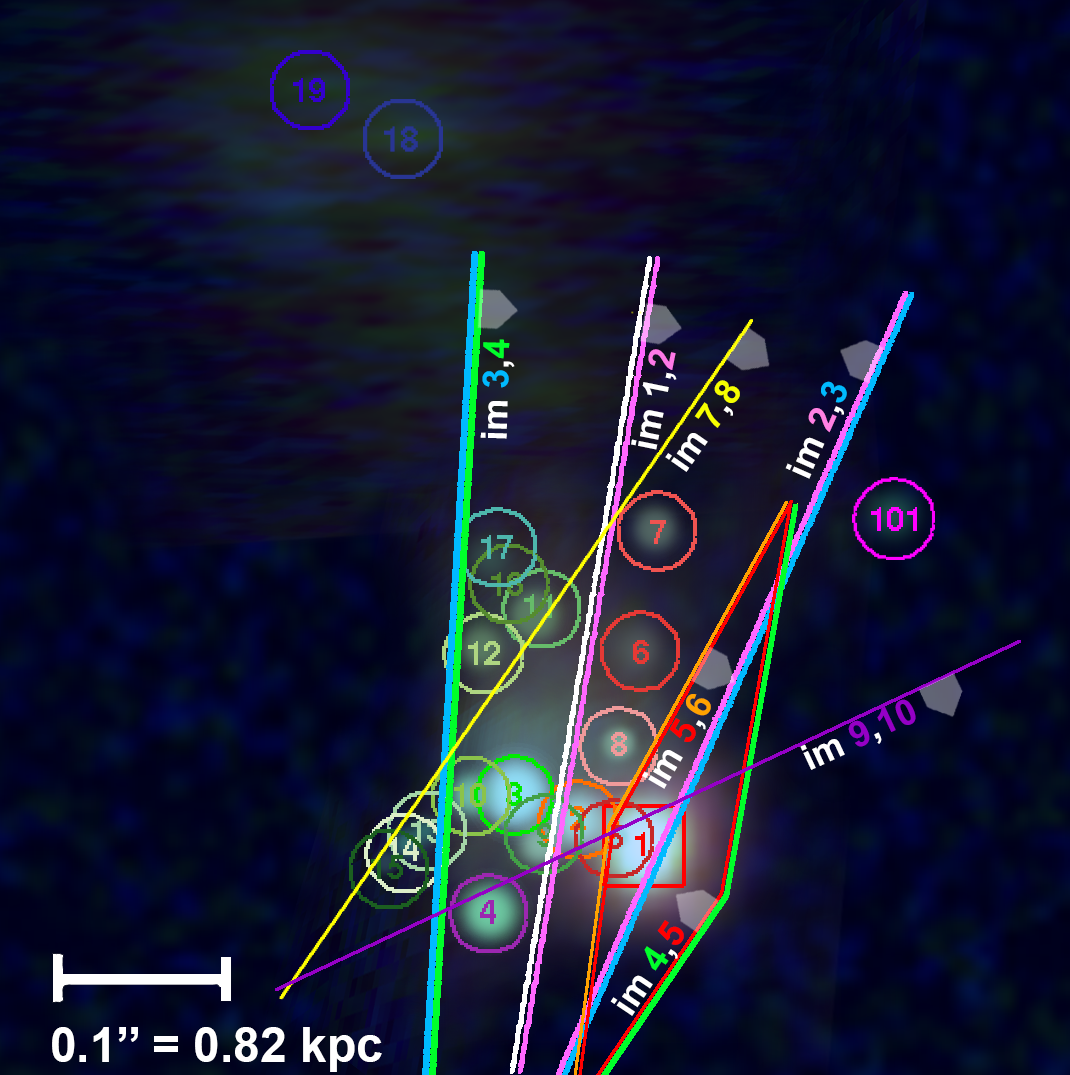
High-resolution HST imaging data are invaluable in understanding the lensing configuration. Studying the first F814W and F275W observations, obtained in February and April 2018, respectively, Rivera-Thorsen et al. (2019) found that the north and northwest arcs are each composed of multiple images, and in particular, the bright emission clump in the source is lensed into a dozen images: six in the north arc, four in the northwest arc, and one each in the west and southeast arcs. With the multi-band HST imaging available to date, we are able to identify numerous emission knots in each image, and match these emission knots between images. Section 3.2 and Figure 2 list the positions of the emission knots, and label their mapping between the lensed images. The identified emission knots within the Sunburst Arc are labeled with prefixes 1 through 19. ID 1.xx is assigned to the bright LyC emitting knots identified by Rivera-Thorsen et al. (2019). The suffix xx denotes the ID of the lensed image within the multiple-image family. For consistency, we follow the multiplicity ID numbers that were introduced by Rivera-Thorsen et al. (2019).
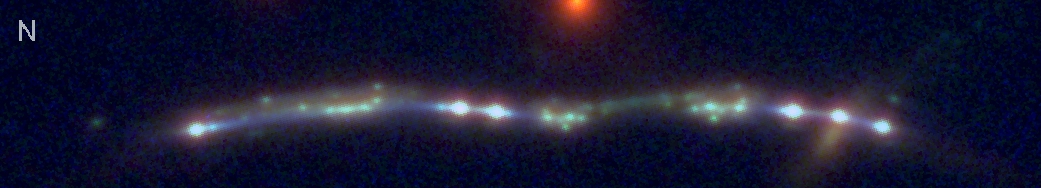
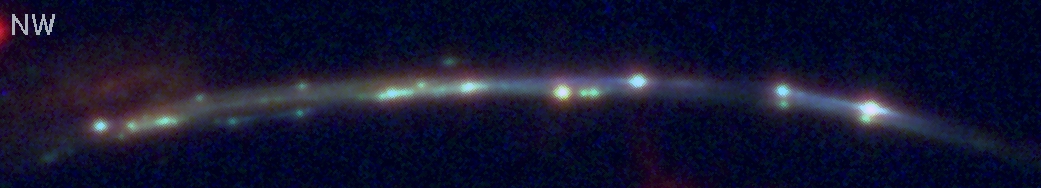
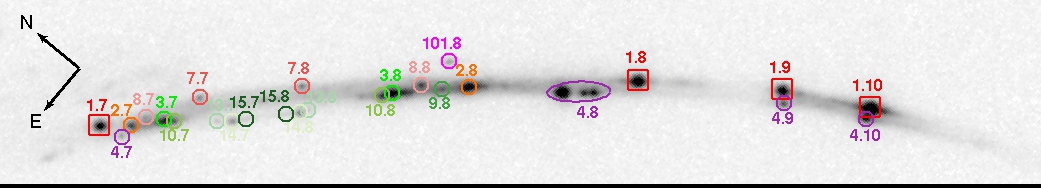
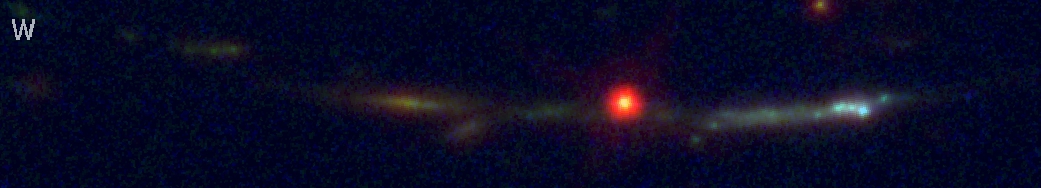
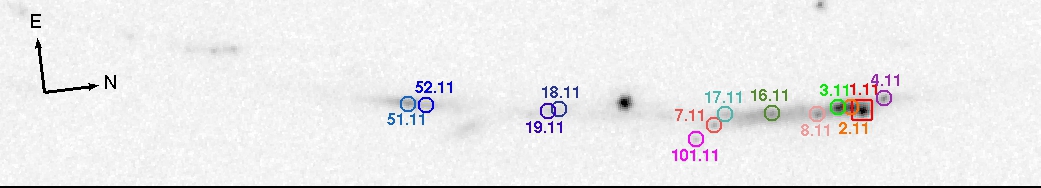
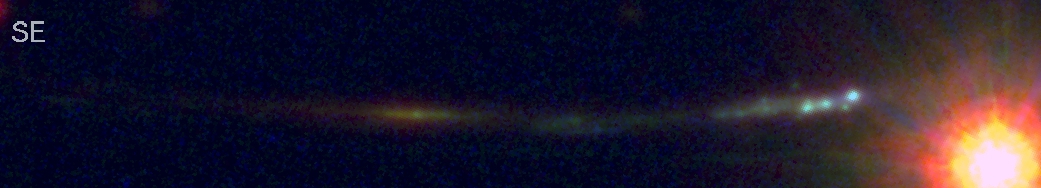
In Figure 2 we show the four images of the Sunburst Arcs: north, northwest, west, and southeast, in color rendition from HST F140W, F606W, and F410M. These bands are selected for this color rendition in order to display the clump-to-clump color variations. For a source at , the broad-band filters F140W and F606W sample emission redward of the Å break, and restframe UV, respectively, while the medium-band filter F410M is centered on the Ly emission. The scale and stretch in this figure are tuned to bring out the clumpiness of the arc and visually resolve its numerous emission knots. We label and color-code the emission knots in the panel adjacent to each color rendition. Knot 1.x (i.e., the one emitting LyC radiation, hereafter LCE clump) is labeled with a red square in all the arcs. We label the next three brightest knots with 2.x, 3.x, 4.x, and the remaining knots are labeled and color-coded to guide the eye to their projected location and arc-to-arc symmetry rather than by brightness.
The north arc (arc 1) consists of six partial images of the source (labeled x.1 through x.6 in Section 3.2 and Figure 2). In two of the images, x.5 and x.6, only the bright LyC emitting knot is seen. The other four include several more emission knots in addition to the bright knot: knots 2, 5, 6, 7, 8 in images x.1 and x.2; and knots 2–12 in images x.3 and x.4. The unusually high multiplicity within the north arc is due to contributions to the lensing potential from three cluster-member galaxies, which complicate the shape of the critical curve in this region.
The west arc (arc 3) and the southeast arc (arc 4) are both full images of the source. As such, these are the only instances where the properties of the galaxy as a whole can be measured (Kim et al., in prep). Only in these two images do we observe a likely companion galaxy, labeled 50 in Section 3.2 (see also the next section). The knots associated with it, 51.x, 52.x as well as knots 18.x and 19.x are not observed in the north and northwest arcs due to the lensing geometry. Because these images have a lower magnification, some of the knots that are identified in other arcs are either not resolved or too faint to be uniquely matched in these arcs. We map knots 16.x and 17.x between these two arcs, but note that they could be matched to knots 11.x and/or 12.x in the north arc (see also Section 5.4).
The northwest arc (arc 2) is the least understood from the perspective of lensing geometry. It has at least two, and up to four, partial images of the source. Rivera-Thorsen et al. (2019) compared the MagE spectra of several spatially distinct regions along the arc, including images 1.1, 1.41.5, 1.8, and 1.10 (images 1, 45, 8, and 10 in their notation, respectively). They found that the spectral features of these images are indistinguishable, arguing in favor of these being images of the same source, which implies that the LCE knot is observed with a multiplicity of 4 in this arc. While in the north arc the 6 multiplicity of the LCE knot can be readily explained by the complexity of the lensing potential due to nearby cluster-member galaxies, no such perturbers are observed near the west end of the northwest arc.
Indeed, near images 1.9, and 1.10, the lensing geometry is not trivial. One explanation for the apparent multiplicity in this region, as suggested by Diego et al. (2022), is that the critical curve serpentines around image 1.9; this requires a lensing potential that is more complex than can be explained from the observed galaxy distribution, e.g., due to a very low surface brightness or a yet unobserved mass component. They forced a high multiplicity in this region by constraining the lens model with critical points between images 1.8, 1.9, and 1.10 (h, i, and l in their notation). The model presented in this paper does not reproduce the multiplicity of images 1.9 and 1.10, because it lacks the flexibility on small scales that is needed in order to wind the critical curve around image 1.9 using only lens components with an observed counterpart. Our early attempts to force the critical curve through those positions (by using critical curve constraints, similar in principle to what was recently done by Diego et al. 2022) resulted in unrealistic magnification ratios between the lensed images. We ruled out those models based on the unrealistic magnifications, and abandoned this direction. We will explore the possibility that a low surface brightness or a “dark” clump is responsible for the lensing complexity in this region in future work. Despite its limitation in the southern part of the northwest arc, our lens model correctly recovers the numerous lensing constraints from multiple source planes (Section 3) elsewhere; the global lens properties and measurements are not affected.
An alternative explanation of the observed images 1.9 and 1.10 is that the LCE clump itself is composed of multiple smaller clumps, unresolved in the other instances but resolved in this image due to its high tangential distortion. Additional data, such as the approved JWST NIRSpec Integral Field Unit (IFU) spectroscopy of this part of the arc (JWST-GO program 02555, PI: Rivera-Thorsen), will provide more clues. The IFU spectroscopy of images 1.9 and 1.10 could reaffirm that they are indeed identical to the other images of the LCE, thus confirming its 4 multiplicity within this arc, and requiring a more complex lens model with sufficient flexibility to wind a critical curve around image 1.9, as was attempted by Diego et al. (2022). Deep imaging may reveal a faint interloper that complicates the lensing potential, or put limits on the surface brightness of such a component if undetected. The first public JWST data already showcase its power to detect low surface brightness structures (e.g., the intracluster light; Mahler et al. 2022b; Montes & Trujillo 2022). Alternatively, the IFU data may reveal that one or two of these clumps differ from the main LCE source, indicating that the LCE clump is actually composed of several distinct LyC leaking regions.
A further anomaly observed in the northwest arc is a bright, unresolved, emission clump that displays significantly different colors and spectral features, compared to other clumps of similar brightness. This emission clump can be seen in Figure 2, as the bright clump in the left part of the 4.8 ellipse. Because a counter image with similar brightness does not appear in any of the other giant arcs, in particular those which display full images of the source, Vanzella et al. (2020b) argued that this unresolved emission clump (labeled Tr in Vanzella et al., 2020a) is a transient. They further identified Bowen fluorescence lines (Bowen, 1934) in its spectrum. Diego et al. (2022) examined the possibility that the observed brightness and morphology of this candidate (which they nicknamed “Godzilla” in their paper) is due to an unobserved lensing perturber in close proximity. They found that such a perturber requires mass of order M⊙. In Section 5.3.1, we discuss the discrepant emission clump in more detail, and demonstrate that it is unlikely to be a transient.
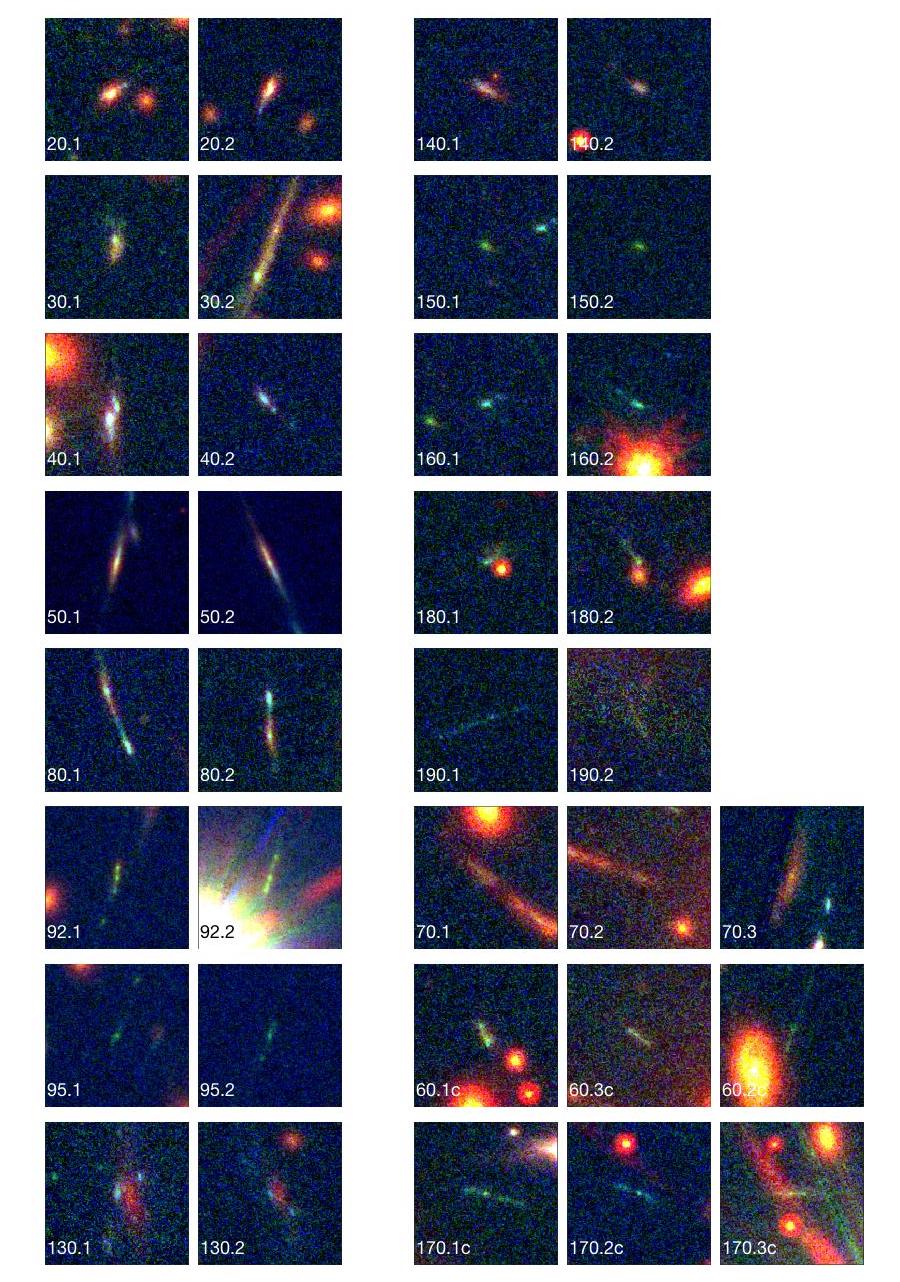
3.2 Secondary lensed systems
From the multi-band HST imaging and archival MUSE spectroscopy, we identify multiple images of several other galaxies that are also strongly lensed by PSZ1 G311.6518.48. Their positions, and where available, spectroscopic redshifts, are used as constraints in the lensing analysis. To avoid confusion with the IDs of clumps within the Sunburst Arc, we assign these secondary lensed galaxies ID numbers starting at 20. The tens digit denotes the source ID, and the ones digit denotes the label of each emission knot. The digit right of the decimal point labels each image within the multiple image “family” of the same source. For example, images 21.1 and 21.2 are two lensed images of clump number 1 in source number 20. Candidate features have an additional prefix . Figure 1 shows the locations of the images of the secondary systems. The positions of individual emission knots, and the available redshifts, are tabulated in Section 3.2. In Figure 3 we present a close-up view of the identified multiple images of each system. We note that for each of the tangential systems the model predicts a demagnified () counter image behind the BCG. These highly demagnified images are predicted to be several magnitudes fainter than the observed arcs, and as such they are not expected to be detectable in the current data. As noted in Section 1 and Section 2.2, the BCG area is active with star formation, which is expected for a cool core cluster such as PSZ1 G311.6518.48. Since star formation chains near the BCG can mimic the appearance of radial arcs (e.g., Sharon et al., 2014; Tremblay et al., 2014; McDonald et al., 2019), we treat the central region with extra care in order to not misidentify star formation as lensed features.
Source 101
Likely associated with the Sunburst Arc, Source 101 (Figure 2) appears as a single emission knot projected less than half an arcsecond from the main arc, but with only five multiple images: two by the north arc, one by the northwest arc, one by the west arc and one by the southeast arc. A sixth image is predicted by the northern tip of the northwest arc, and we tentatively identify it blended in the light of a foreground galaxy. The sixth image candidate is not used as a constraint. Due to its proximity to the main arc, and the lack of independent redshift measurement, we cannot spectroscopically rule out its association with the main arc. When leaving its redshift as a free parameter, the model-predicted redshift for this source converges to that of the main arc. Furthermore, narrow-band HST imaging reveals strong line emission from all the images of Source 101 at a wavelength consistent with [O III] 4959 Å at the redshift of the Sunburst Arc (Rigby et al., in prep.). We therefore proceed by assigning this clump the same redshift as the Sunburst Arc.
Source 20
This source appears with two images, one southwest and one northeast of the BCG. Although we do not have a spectroscopic redshift of this galaxy, the morphology and color variations along the images provide confidence in their identification as multiple images of the same source.
Source 30
We detect two images of source 30, with similar morphology and color. A single emission line appears in both locations in the MUSE data, placing this source at , assuming this line is from C III]. The secure lensing identification, and high-confidence redshifts of other sources rule out other possible emission lines, which would result in too high or too low redshifts (e.g., Ly, [OII] [OIII]). The east image of this source (30.2), as well as image 2 of source 90, appear in a region with higher tangential shear than the west images of the same sources (Figure 1).
Source 40
Source 40 is lensed into two images, projected 17 and 22 arcseconds from the cluster center. Archival MUSE spectroscopy indicates that it is a star-forming galaxy at , based on several emission lines that are observed in both of its images, 40.1 and 40.2.
Source 50
We identify two images of a galaxy, one extending the west Sunburst Arc to the south, and the other extending the southeast Sunburst Arc to the east. Images of this source do not appear near any of the other Sunburst Arc images because of the location of the source with respect to the caustics in the source plane; this is consistent with expectation from the lensing geometry. Source 50 is smoother and redder than the main arc, with a distinctive color gradient. We identify two clumps within the images to be used as constraints.
MUSE spectroscopy of images 50.11 and 50.12 places this source at the same redshift as the Sunburst Arc, , based on weak C III] emission lines and Si II and C IV in absorption in both images of the source. We note that the spectrum of 50.11 contains features from an interloping galaxy at , based on a bright double emission feature at Å and Å from [O II] doublet, corroborated by other lines including H emission and [O III] emission. We identify the interloper as a faint galaxy in close projected proximity, , northwest of 51.11. The identified interloper has the same spectroscopic features that contaminate the MUSE spectrum of 50.11.
Our redshift analysis of source 50 disagrees with the redshift reported for this galaxy by Pignataro et al. (2021), who measured (Sys-3 in their paper). While their paper does not provide information regarding the spectroscopic features that were used to establish this redshift, it could possibly be based on a misidentification of the [O II] line from the interloper, as a C III] line at . Source 50 is close in projection to the Sunburst Arc ( kpc away in projected distance in the source plane according to our lensing analysis, Section 5.4), which could explain the absorption lines had source 50 been in the background. Nevertheless, the identification of the C III] emission line adds confidence to our interpretation.
A close inspection of the imaging data reveals a thin elongated arc that extends 50.12 towards the northeast. This emission is likely the magnified image of just the edge of Source 50, which is lensed to this location by contribution to the lensing potential from a nearby cluster-member galaxy. The three images that make this extension are labeled 53.1, 53.2, 53.3.
Source 60 (candidate)
We identify this image as a candidate radial arc. At this time, we have no spectroscopic redshift for it. There are several possible counter images at the expected locations that match its surface brightness, colors, and expected lensing shear, but neither can be spectroscopically confirmed as counter images. We therefore do not include this system as a constraint in the lens model.
Source 70
This source appears as a radial arc, observed east of the cluster core. We identify a candidate counter image of this arc, west of the west Sunburst Arc. The candidate has similar colors to the radial arc. The direction in which the arcs are sheared is consistent with expectation from lensing geometry. The radial arc appears in the MUSE data with low significance, and a redshift could not be secured from these data. The location of the counter image falls outside of the footprint of the archival MUSE data, and we are therefore unable to confirm or rule it out with the MUSE data. Similarly, the arc is too faint in the Cycle 25 GRISM data available to this study. It is possible that the HST-WFC3/G280 data (GO-15966) are deep enough for spectroscopic redshift confirmation. The redshift of this source is left as a free parameter in our modeling.
Source 80
The two images of source 80 present distinctive color and morphology, which secure their identification despite not having a spectroscopic redshift confirmation.
Source 90
Source 90 has two images, one appears south of the west Sunburst Arc, and the second one appears northeast of the cluster core. We measure the redshift of both images, , based on MUSE detection of extended Ly emission coincident with this galaxy. We identify five unique emission knots in the HST imaging of this source, while the Ly emission appears much more extended than the optical/IR emission. The eastern image of source 90 spans , about three times more extended than its west counterpart, at , indicating that there is significantly more lensing shear in the east region. We observe similar behavior in the nearby system 30.
Source 130
System 130 has two images, both resolved, with a red center and two distinct blue emission knots. We use the blue emission knots as constraints, as their location can be more precisely determined than that of the extended red center. We have no spectroscopic redshift for this system, but its unique morphology and colors provide confidence in its identification.
Sources 140, 150, 160
Each of these systems has two images, with no spectroscopic redshift. We identify them based on their colors and morphology.
Source 170 (candidate)
We identify three images of this candidate system, with similar surface brightness and morphology, which are predicted by the lens model to be counter images of each other. Image 170.1 appears in the north part of the field, close to image 1.1. The lens model predicts its counter images in the south of the field. We identify arcs with similar morphology, that match the lensing parity and shear direction that are predicted by the model. We note that image 170.1 appears slightly greener than 170.2 in the rendition shown in Figure 3, likely due to contamination from bright nearby cluster galaxies. The colors of 170.3 are contaminated by a nearby star. To be conservative, these candidate images were not used as constraints.
Source 180
We identify two images of this source, one in the northeast and one southwest of the BCG. The MUSE spectra of both images suggest a low confidence line, which could be CIII] at . Due to its low confidence the suggestive redshift is not used as constraint. The morphology of the two images is similar, and consistent with the expected lensing parity and shear direction.
Source 190
We identify two faint candidate images of this source, a radial arc west of the BCG, and a counter image northwest.
| ID | R.A. [deg] | Decl. [deg] | 1 uncertainty on | |
|---|---|---|---|---|
| J2000 | J2000 | [lower upper] | ||
| 1.1 | 237.530818 | -78.182515 | 34.7 | [29 – 38] |
| 1.2 | 237.525561 | -78.182754 | 82.7 | [75 – 97] |
| 1.3 | 237.524859 | -78.182817 | 58.7 | [56 – 71] |
| 1.4 | 237.519097 | -78.183181 | 15.3 | [9.3 – 23] |
| 1.5 | 237.518255 | -78.183256 | 2.3 | [0.5 – 10.0] |
| 1.6 | 237.517455 | -78.183354 | 13.2 | [7.6 – 23] |
| 1.7 | 237.509198 | -78.184647 | 4.3 | [3.9 – 5.0] |
| 1.8 | 237.501508 | -78.186259 | 29.6 | [27 – 34] |
| 1.9 | 237.499785 | -78.186745 | 27.3 | [25 – 34](*) |
| 1.10 | 237.498917 | -78.187077 | 30.1 | [28 – 37](*) |
| 1.11 | 237.493859 | -78.190767 | 12.1 | [12 – 13] |
| 1.12 | 237.562830 | -78.196471 | 13.4 | [12 – 16] |
| 2.1 | 237.528078 | -78.182604 | 128.9 | [92 – 128] |
| 2.2 | 237.527379 | -78.182635 | 109.4 | [127 – 180] |
| 2.3 | 237.523906 | -78.182902 | 15.0 | [13 – 16] |
| 2.4 | 237.520126 | -78.183100 | 12.9 | [11 – 14] |
| 2.7 | 237.508784 | -78.184748 | 6.0 | [4.8 – 6.3] |
| 2.8 | 237.503795 | -78.185731 | 42.8 | [35 – 49] |
| 2.11 | 237.493953 | -78.190812 | 12.0 | [12 – 13] |
| 2.12 | 237.563214 | -78.196386 | 13.2 | [12 – 15] |
| 3.3 | 237.523472 | -78.182926 | 13.0 | [11 – 14] |
| 3.4 | 237.520701 | -78.183058 | 15.5 | [13 – 17] |
| 3.7 | 237.508271 | -78.184839 | 12.5 | [9.2 – 13] |
| 3.8 | 237.504896 | -78.185501 | 51.2 | [40 – 59] |
| 3.11 | 237.493989 | -78.190867 | 12.3 | [12 – 13] |
| 3.12 | 237.563459 | -78.196326 | 13.1 | [12 – 15] |
| 4.3 | 237.523614 | -78.182962 | 15.5 | [14 – 17] |
| 4.4 | 237.520679 | -78.183110 | 15.7 | [13 – 17] |
| 4.7 | 237.509090 | -78.184749 | 5.2 | [4.3 – 5.7] |
| 4.8 | 237.502257 | -78.186149 | 35.5 | [32 – 41] |
| 4.9 | 237.499970 | -78.186785 | 31.1 | [28 – 40](*) |
| 4.10 | 237.499155 | -78.187089 | 33.9 | [31 – 44](*) |
| 4.11 | 237.494057 | -78.190672 | 11.1 | [11 – 12] |
| 4.12 | 237.563109 | -78.196465 | 12.9 | [12 – 15] |
| 5.1 | 237.530472 | -78.182525 | 33.7 | [28 – 35] |
| 5.2 | 237.525924 | -78.182728 | 53.0 | [48 – 62] |
| 5.3 | 237.524665 | -78.182835 | 35.8 | [33 – 41] |
| 5.4 | 237.519300 | -78.183166 | 13.3 | [8.6 – 17] |
| 6.1 | 237.530282 | -78.182473 | 36.5 | [31 – 38] |
| 6.2 | 237.526374 | -78.182639 | 34.4 | [31 – 39] |
| 7.1 | 237.529282 | -78.182482 | 32.1 | [27 – 37] |
| 7.2 | 237.527034 | -78.182569 | 43.0 | [40 – 50] |
| 7.3 | 237.523693 | -78.182846 | 10.9 | [9.7 – 12] |
| 7.4 | 237.520049 | -78.183013 | 12.2 | [10 – 13] |
| 7.7 | 237.507458 | -78.184894 | 45.5 | [26 – 47] |
| 7.8 | 237.505953 | -78.185193 | 59.6 | [52 – 66] |
| 7.11 | 237.493967 | -78.191389 | 16.3 | [16 – 18] |
| 7.12 | 237.563746 | -78.196152 | 13.9 | [13 – 16] |
| 8.1 | 237.528607 | -78.182557 | 48.8 | [38 – 53] |
| 8.2 | 237.527136 | -78.182623 | 62.2 | [61 – 79] |
| 8.3 | 237.523917 | -78.182875 | 14.1 | [13 – 16] |
| 8.4 | 237.520032 | -78.183080 | 12.6 | [10 – 14] |
| 8.7 | 237.508469 | -78.184775 | 8.4 | [6.4 – 8.5] |
| 8.8 | 237.504388 | -78.185573 | 44.7 | [36 – 51] |
| 8.11 | 237.493900 | -78.190958 | 13.3 | [13 – 14] |
| 8.12 | 237.563346 | -78.196316 | 13.4 | [12 – 15] |
| 9.3 | 237.523676 | -78.182928 | 14.1 | [12 – 15] |
| 9.4 | 237.520492 | -78.183090 | 14.3 | [12 – 16] |
| 9.8 | 237.504180 | -78.185652 | 45.7 | [37 – 53] |
| 10.3 | 237.523251 | -78.182942 | 13.4 | [12 – 14] |
| 10.4 | 237.521002 | -78.183046 | 18.7 | [16 – 21] |
| 10.7 | 237.508163 | -78.184876 | 15.7 | [11 – 16] |
| 10.8 | 237.505064 | -78.185473 | 53.6 | [42 – 61] |
| 11.3 | 237.523067 | -78.182913 | 11.7 | [10 – 13] |
| 11.4 | 237.521062 | -78.182998 | 19.4 | [17 – 21] |
| 12.3 | 237.522753 | -78.182948 | 16.0 | [13 – 17] |
| 12.4 | 237.521510 | -78.182999 | 37.0 | [32 – 48] |
| 13.7 | 237.507614 | -78.185015 | 45.9 | [32 – 46] |
| 13.8 | 237.506255 | -78.185277 | 101.1 | [82 – 123] |
| 14.7 | 237.507415 | -78.185061 | 74.4 | [51 – 75] |
| 14.8 | 237.506400 | -78.185256 | 123.9 | [102 – 161] |
| 15.7 | 237.507203 | -78.185102 | 149.0 | [97 – 148] |
| 15.8 | 237.506595 | -78.185218 | 180.0 | [159 – 277] |
| 16.11 | 237.494050 | -78.191144 | 14.6 | [14 – 16] |
| 16.12 | 237.563858 | -78.196174 | 13.5 | [12 – 15] |
| 17.11 | 237.494158 | -78.191336 | 15.6 | [15 – 17] |
| 17.12 | 237.564375 | -78.196021 | 13.7 | [12 – 15] |
| 18.11 | 237.494696 | -78.192019 | 15.9 | [15 – 17] |
| 18.12 | 237.565800 | -78.195482 | 16.3 | [14 – 18] |
| 19.11 | 237.494679 | -78.192066 | 16.1 | [15 – 18] |
| 19.12 | 237.566061 | -78.195415 | 16.6 | [15 – 18] |
| 51.111 | 237.495214 | -78.192641 | 13.5 | [13 – 15] |
| 51.12 | 237.567111 | -78.194878 | 22.8 | [19 – 25] |
| 52.11 | 237.495142 | -78.192566 | 12.3 | [12 – 14] |
| 52.12 | 237.566914 | -78.194972 | 21.4 | [18 – 24] |
| 53.1 | 237.570080 | -78.193511 | 1246.8 | [83 – …] |
| 53.2 | 237.572192 | -78.191494 | 726.5 | [29 – …] |
| 53.3 | 237.572516 | -78.191086 | 32.9 | [24 – 37] |
| 101.12 | 237.532701 | -78.182363 | 37.8 | [27 – 49] |
| 101.6 | 237.517073 | -78.183258 | 17.7 | [11 – 36] |
| 101.8 | 237.503649 | -78.185600 | 34.8 | [29 – 39] |
| 101.11 | 237.493719 | -78.191473 | 17.2 | [16 – 19] |
| 101.12 | 237.563151 | -78.196242 | 14.5 | [13 – 17] |
Note. — The IDs and positions of emission knots in the Sunburst Arc, identified in the multiple images of the source and used as lensing constraints. Clumps are labeled as where is a number of the clump, and is a number or a letter indicating the ID of the lensed image within the multiple image family. The best-fit model-predicted magnifications for a point source located at the exact position of each feature are given in the fourth column, and the brackets indicate the lower and upper magnification corresponding to 1 confidence interval in the parameter space, sampled from the MCMC chain. (*) The magnifications of images 1.9, 1.10, 4.9, 4.10 are measured at their observed positions; they should be used with caution, as the lens model does not correctly recover these positions. The redshift of the Sunburst Arc, , was measured by Dahle et al. (2016), Rivera-Thorsen et al. (2019), and Rivera-Thorsen et al. (2017), and confirmed with MUSE spectroscopy by this work. 1The redshift of source 50 was measured by this work, placing it at the same redshift as the main arc. 2Source 100 is possibly associated with the same source as the Sunburst Arc, and is either part of the same galaxy or a companion (see Section 5)
Note. — The IDs, positions, and redshifts of lensed multiply-imaged galaxies other than the Sunburst Arc, that were used as constraints in this work. Where possible, individual emission knots in each image are identified and used as lensing constraints. The IDs of images of lensed galaxies are labeled as or where or is a number indicating the source ID (or system name); is a number indicating the ID of the emission knot within the system; and is a number indicating the ID of the lensed image within the multiple image family. A prefix identifies candidates. The reference for spectroscopic redshifts is this work; see Section 3. The redshifts of source 40 and 90 are consistent with the independent measurement of Pignataro et al. (2021) using the same data, of 1.186, 3.505, respectively.
4 Strong Lens Modeling Procedure
4.1 Methodology
We use the lens modeling software Lenstool (Jullo et al., 2007), which is a parametric lens modeling algorithm, i.e., it assumes that the lens plane can be constructed from a linear combination of individual parametric mass halos. In this work, we model each mass component with a pseudo-isothermal ellipsiodal mass distribution (PIEMD, also known as dPIE; Elíasdóttir et al., 2007), with seven parameters: position (, , measured in arcseconds from a reference point), ellipticity , position angle , core radius , truncation radius , and a normalization .
Following procedures that have become standard in the field, the lens plane is modeled iteratively. The most obvious lensing evidence (i.e., the most prominent features in the Sunburst Arc) is used to constrain an initial lens model. The model is then used to identify additional lensing constraints, and predict the locations of their counter images. We use the archival MUSE data to spectroscopically confirm candidates. Following the recommendations of Johnson & Sharon (2016), we re-initiate the modeling process when including new spectroscopically confirmed constraints, in order to not bias the lens model by its own predictions. As new constraints are identified, we increase the lens model complexity as needed by either freeing the parameters of galaxies in close proximity to the giant arc, or by adding dark matter halos that represent correlated substructure (e.g., Mahler et al., 2018).
This lens model is a significant improvement upon the model published by Rivera-Thorsen et al. (2019), which only used the Sunburst Arc images as constraints, and consequently had a limited flexibility with which to model the lens plane. Two important datasets enabled this improvement: multi-band HST imaging to identify lensed sources and resolve substructure within lensed images, and MUSE spectroscopy to derive reliable redshifts. The large number of constraints coming from the clumpy, highly magnified Sunburst Arc and the other lensed sources discussed in Section 3 enables construction of a lens model with high flexibility and complexity, allowing a large number of free parameters. The availability of constraints from secondary systems, i.e., multiply-imaged galaxies at different source planes, provides important leverage for constraining the global properties of the cluster mass distribution, and lowers the uncertainties (Johnson & Sharon, 2016).
The components of the lens model are described in the next section. The model uses positional constraints from 146 images of 48 identified clumps within 15 multiply imaged lensed galaxies (19 of the clumps are in the Sunburst Arc) with multiplicities ranging from 2–12, and has a total of 57 free parameters including 9 free redshifts. The best-fit model RMS scatter between predicted and observed images is .
4.2 Lens Components
The lens plane is represented by one cluster-scale and two group-scale dark matter halos, supplemented by galaxy-scale halos. We position the cluster-scale halo near the BCG. We free all the parameters of this halo with the exception of the cut radius, which is fixed at kpc, as for cluster scale halos this radius is far beyond the observed lensing evidence. This mass component accounts for the dark matter halo of the cluster, as well as the hot X-ray gas, which we find to be centered within of the BCG. We place one group-size halo in the general direction of a small group of bright cluster galaxies approximately arcseconds northeast of the BCG, and one group-size halo arcseconds south of the BCG fixed to the position of a luminous cluster member. All the other parameters, of both halos are left free, with broad priors. The cluster halos are supplemented with 250 galaxy-scale halos, positioned on the observed locations of cluster-member galaxies. The selection procedure of these galaxies is explained in the next section. The galaxies are modeled as PIEMDs, with positional parameters fixed at their observed properties (R.A., Decl., ellipticity, and position angle), and the other parameters scaled to their luminosity following a parametric scaling relation given in Limousin et al. (2005, eqn. 28), with pivot parameter mag. Several galaxies were modeled as individual halos, allowing Lenstool to solve for their best-fit parameters. These are either galaxies that lie in close projected proximity to the arcs, or galaxies that are not expected to follow the same scaling relations as the red-sequence cluster galaxies, e.g., the BCG, and spectroscopically-confirmed star forming galaxies at the cluster redshift.
At the core of the cluster, the UV/optical light of the central galaxy appears to be obscured by dust. We therefore measure its position in the reddest band, F160W, which should be the least affected by dust obscuration. We leave all the parameters of the BCG free, including its position, with a prior around the F160W centroid.
We include in the lens model a lensing galaxy which is positioned close to the northern part of the northwest arc, behind the cluster, at (galaxy G1 in Lopez et al., 2020). We approximate this interloper as contributing to the lensing potential at the same plane by allowing high flexibility in modeling its mass. The degeneracy between the normalization and the distance term means that the mass of this galaxy cannot be computed reliably with this approximation. Similarly, a faint interloper galaxy near image 50.11 (; see Section 3) is also included in the lens model at the cluster redshift. We refer the reader to Raney et al. (2020) for a thorough examination of the implications of the modeling approach of projecting the interloper onto the same lens plane of the main lensing structure.
4.3 Selection of Cluster Galaxies
The mass associated with cluster member galaxies contributes to the lensing potential of the cluster. We use Source Extractor (Bertin & Arnouts, 1996) in dual-image mode to generate a photometric catalog of the field, with the F814W image used as the detection image, and MAG_AUTO measured in both the F814W and F606W images within the same aperture. We use a detection threshold of 5 sigma, and deblending contrast of 0.001. Stars were flagged by their locus in MU_MAX vs MAG_AUTO plane and excluded from the catalog. We select cluster-member galaxies based on their F814W-F606W color in a color-magnitude diagram, following Gladders & Yee (2000). These particular bands were selected because they span the characteristic Å break of passive galaxies at the cluster redshift. The ACS data provide the widest field of view around the cluster core. Finally, we visually inspect the galaxy catalog and remove objects that were erroneously picked as cluster members, such as diffraction spikes, faint stars, and parts of over-deblended galaxies.
5 Results and Discussion
5.1 Cluster Mass Distribution
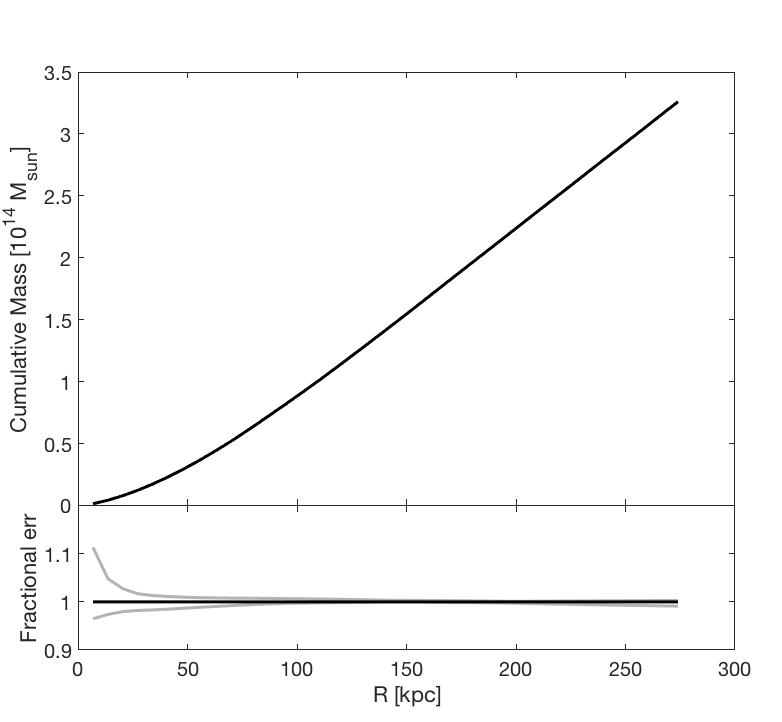
Figure 4 shows the projected mass density profile of PSZ1 G311.6518.48, measured as a function of distance from the BCG. We find that the projected mass density of the core of PSZ1 G311.6518.48, enclosed within kpc is M⊙. For comparison with previous mass estimates, we report the mass within kpc, M⊙, and the mass within 200 kpc, M⊙, which is similar to what was estimated by Pignataro et al. (2021) and Diego et al. (2022). It is unclear whether there is a discrepancy since no uncertainties were provided in those publications. Interestingly, we find that the mass within the radius of the giant arc, M⊙, is in perfect agreement with what was estimated by Dahle et al. (2016), M⊙ for kpc. Their mass estimate is based on the relationship between the Einstein radius and the projected mass enclosed within it, , for a circularly symmetric lens. Such a close agreement between the detailed lens model measurement and the mass enclosed by the Einstein radius method indicates that the circular symmetry assumption is valid for this cluster (Remolina González et al., 2021).
The main cluster halo coincides with the BCG and the X-ray gas centroid to within , which is consistent with PSZ1 G311.6518.48 being a relaxed cluster.
5.2 Lensing Magnification
Figure 5 maps the absolute value of the lensing magnification and its statistical uncertainty for a source at , with a zoom-in on the north arc shown in Figure 6. Consistent with the visual interpretation of the lensing evidence, we find that the north and northwest images of the Sunburst Arc form in regions of highest magnification; the west and southeast arcs have the lowest magnification.
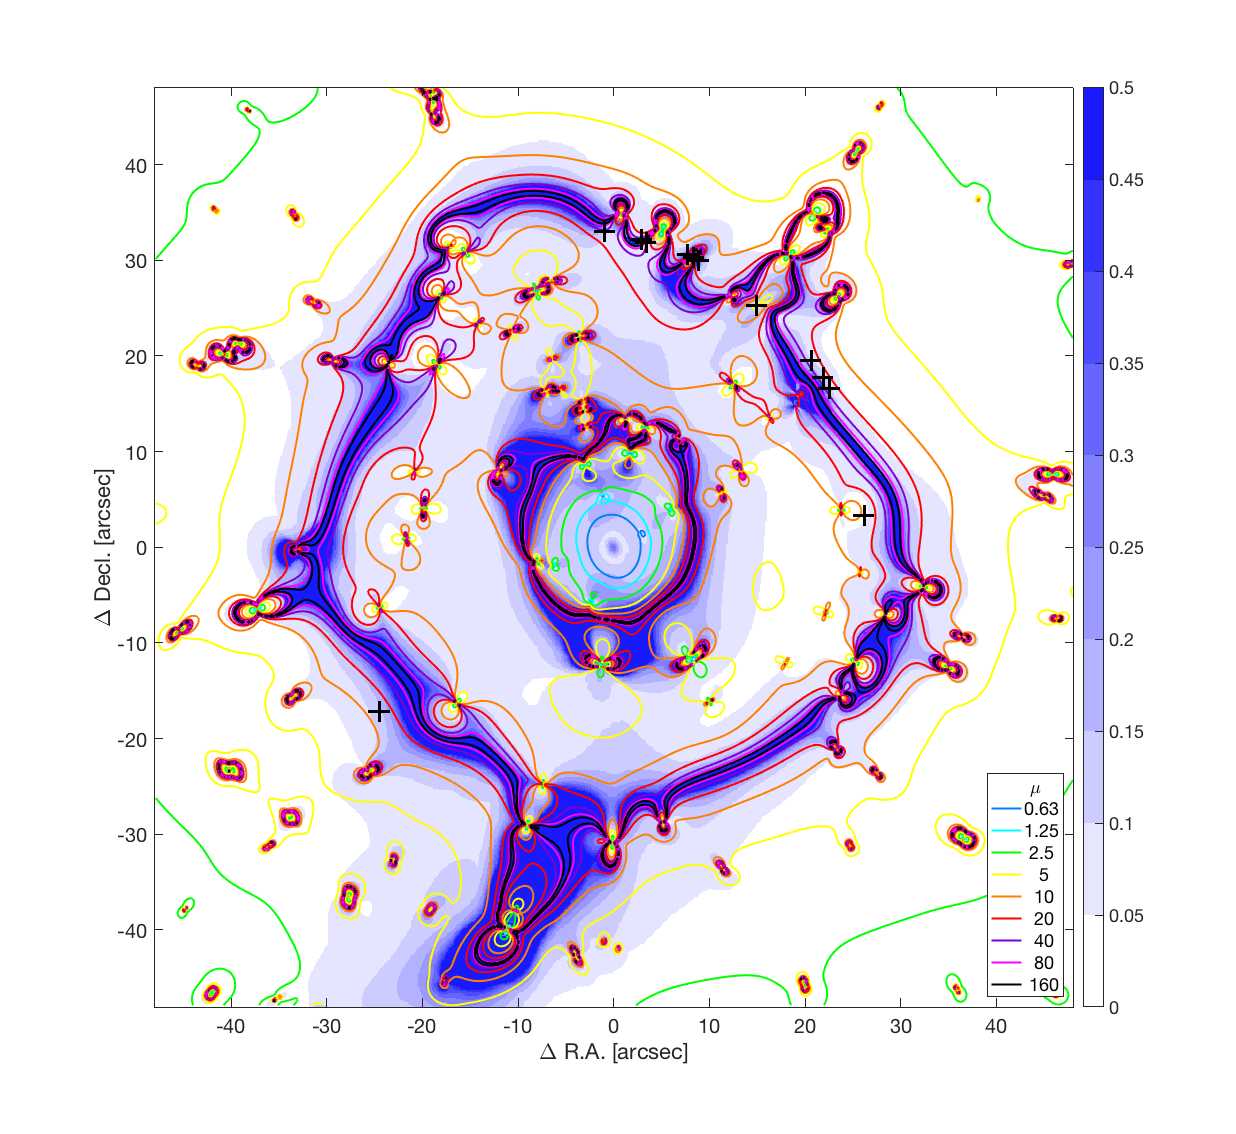
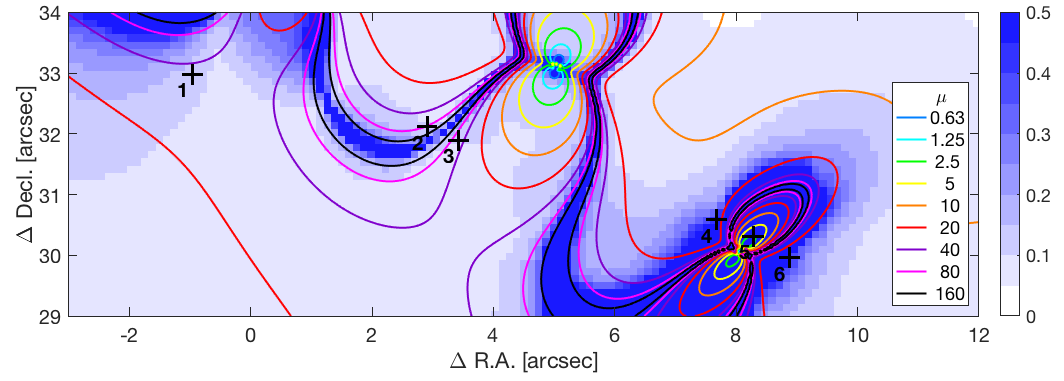
Estimated over the entire arc, the average magnifications of the west and southeast arcs are and , respectively. Since these are the only two complete images of the source galaxy, a magnification measurement of the entire galaxy is only possible for these two arcs. The average magnifications of the west and southeast arcs are computed by defining an aperture in the image plane, ray-tracing the aperture to the source plane, and dividing the image-plane area by the source-plane area of the ray-traced aperture. For small enough regions that are far from the critical curves, the average magnification is not different from the value given by the magnification map at the center of the feature of interest. Section 3.2 lists the magnification for each of the knots in the Sunburst Arc, measured at the center of each feature. To estimate the statistical modeling uncertainties, we generate lens models, each with a set of parameters from the MCMC chain, which sample a confidence interval in the parameter space. We then run our calculation on the magnification and deflection outputs.
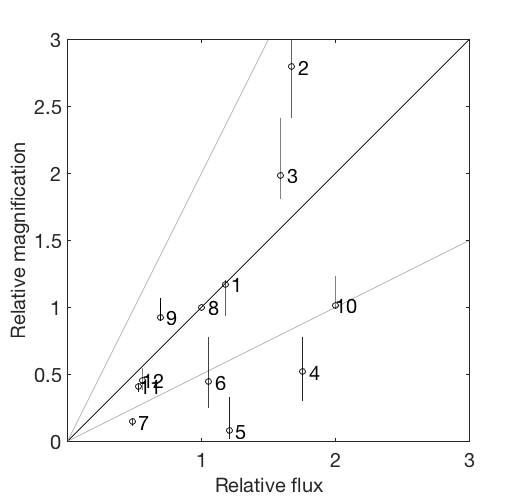
As a test of the lens model, we compare the model-predicted magnifications to the observed flux of the LCE clump images. The absolute magnification prediction can be tested only when the absolute luminosity of the source can be estimated (e.g., for a standard candle, Rodney et al., 2015). Since the intrinsic fluxes of the sources in this field are unknown, we evaluate predicted relative magnifications against relative fluxes. We choose to run this analysis on the images of the LCE clump, which is the brightest lensed feature with the highest multiplicity in the field. Fluxes are measured within a aperture in the F555W image, after matching it to the point spread function (PSF) of the F160W filter (a full description of the aperture photometry measurement will be presented in Kim, J. K. et al. 2022, in preparation). We divide the flux of each image of the LCE by that of image 1.8. Since the magnification uncertainties of the different images are likely correlated, we calculate the magnification relative to that of image 1.8 in each of the models sampled from the MCMC, and combine these measurements to estimate the uncertainty on the relative magnification. The formal uncertainty of the flux measurement is negligible compared to the lensing uncertainty, even in cases where the light from the source is somewhat obscured by foreground galaxies. The comparison is shown in Figure 7. Most of the images have a relative magnification within a factor of 2 from the relative fluxes, within errors. The relative magnifications of images 4, 5, 6, and 7, are lower than expected. This could be due to their proximity to foreground galaxies whose local contribution to the lensing potential is not adequately reproduced by the modeling process. The results of this exercise emphasize that there are systematic uncertainties that are unaccounted for in the lensing analysis, as was repeatedly highlighted in the literature (e.g., Rodney et al., 2015; Zitrin et al., 2015; Johnson & Sharon, 2016; Priewe et al., 2017; Meneghetti et al., 2017; Mahler et al., 2018; Remolina González et al., 2018; Kelly et al., 2018). Based on this evaluation, we conclude that our statistical magnification uncertainties likely underestimate the full uncertainty by a factor of 4-5. It also indicates that the strong lens model can be improved upon by tapping into relative magnification constraining power, which can provide leverage over the second derivative of the lensing potential. For example, flux anomalies in lensed quasars were found to be indicative of substructure in the lens plane (Bradač et al., 2002).
5.3 Time Domain
The arrival time surface, also known in the literature as the Fermat potential, is described by the following equation (e.g., Schneider, 1985):
| (1) |
where is the position of the source in the source plane, is a coordinate in the image plane, is the lens redshift, and are the angular diameter distances from the observer to the lens and to the source, respectively, is the angular diameter distance from the lens to the source, and is the lensing potential. Multiple images of a strongly-lensed source form in stationary points in this surface, i.e., minima, maxima, and saddle points. The time delay between any two images can be calculated as the difference in arrival time, . The source location is formally the same for all images of the same source; however, since lens models have finite accuracy, the calculated source positions of the different images are expected to have a small scatter in the source plane. It is therefore common to use the average or magnification-weighted average of the model-derived source positions of the multiple images as .
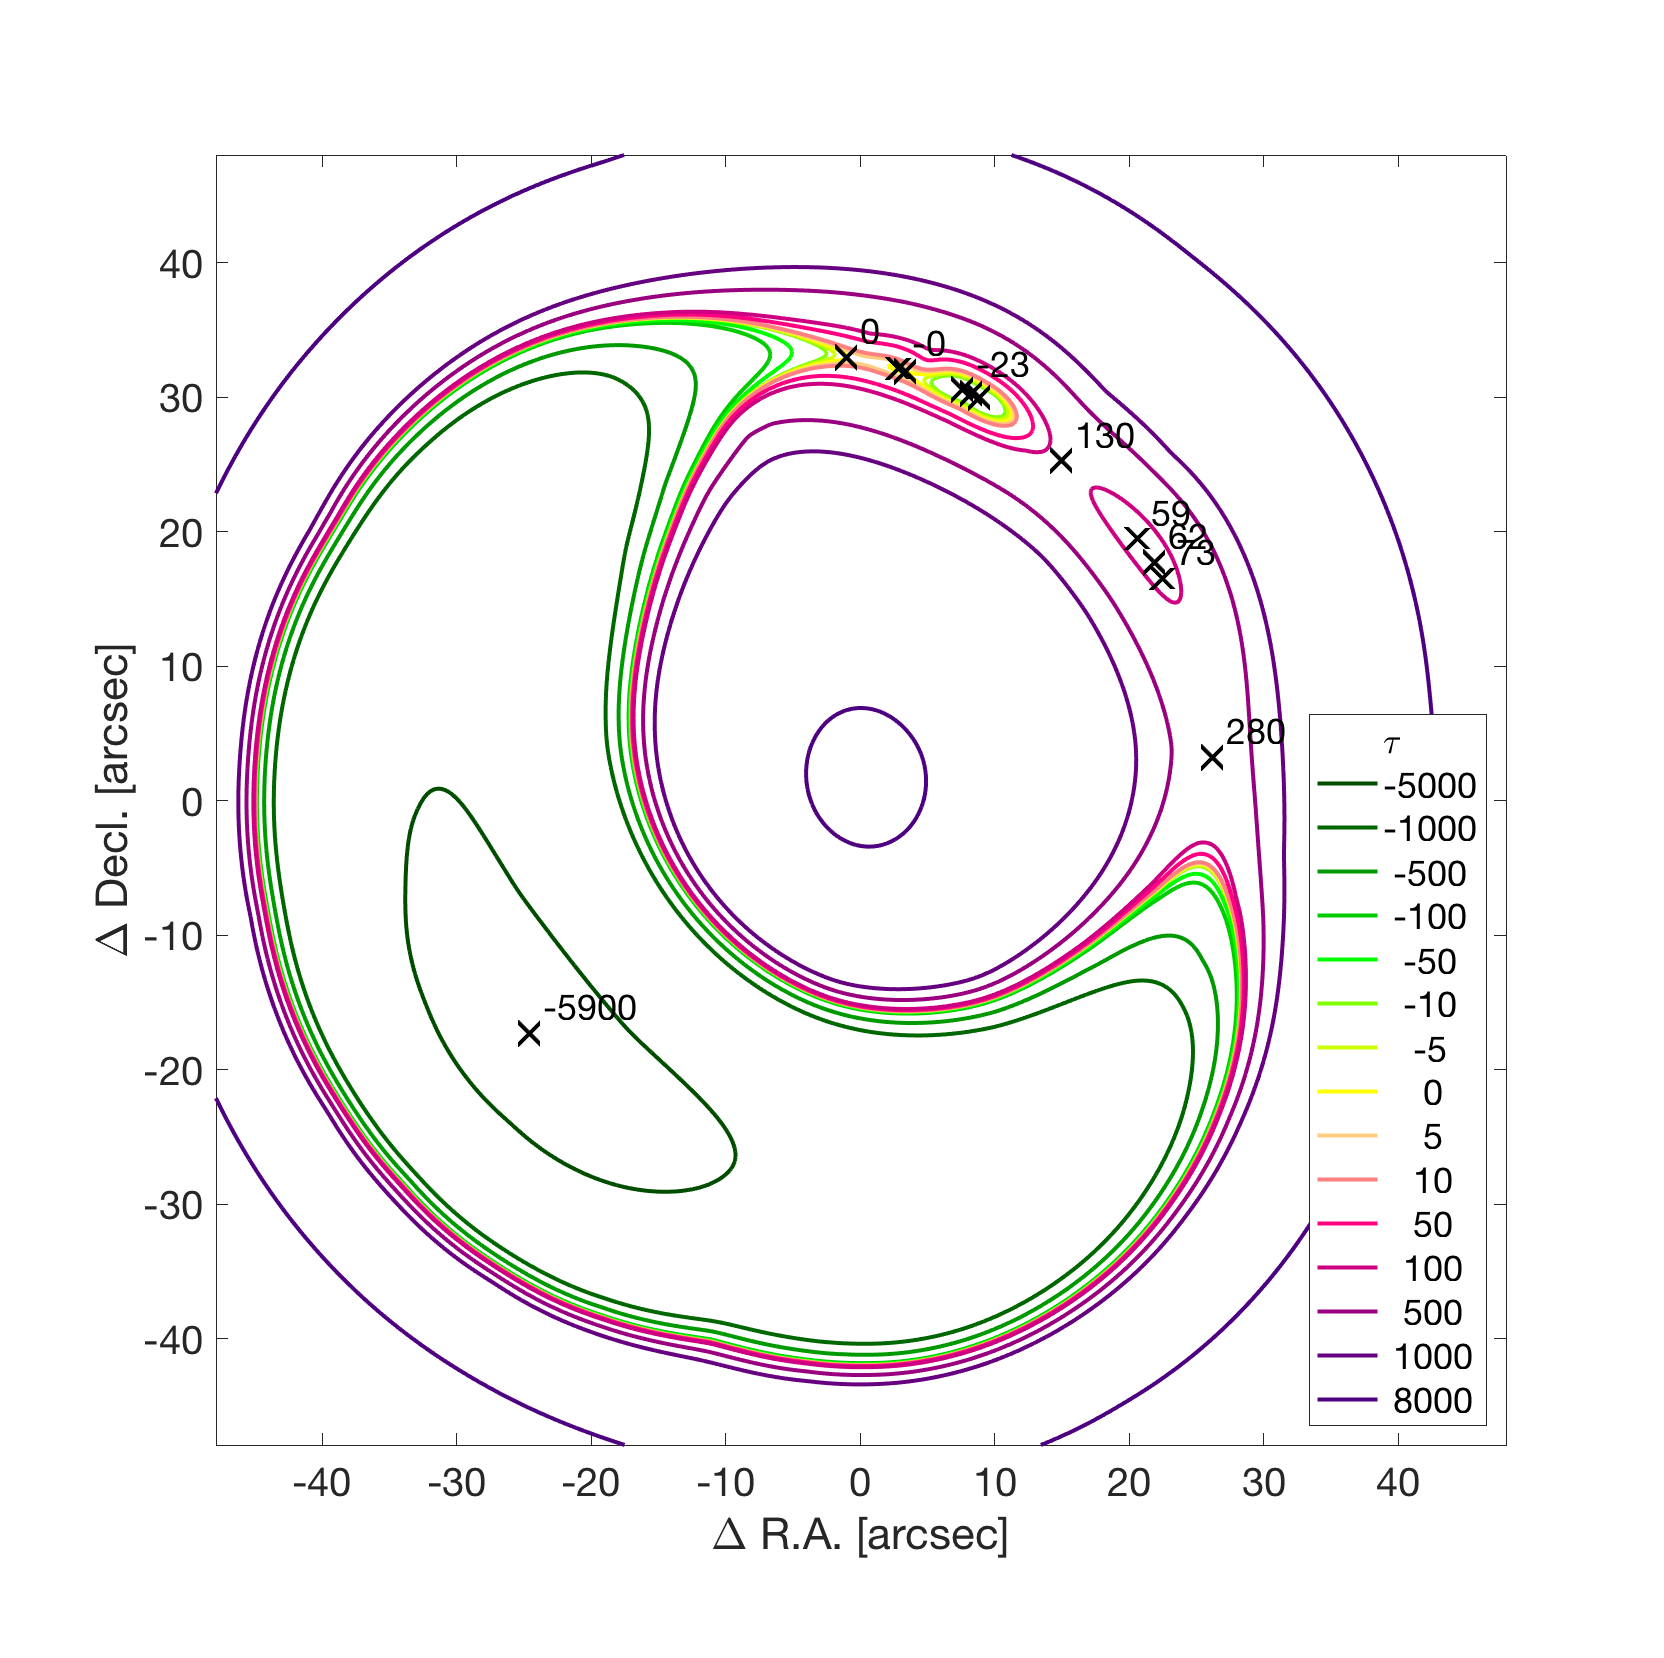
Figure 8 shows the Fermat potential result from the best-fit lens model. The relative arrival time is calculated with respect to image 1.1 of the LCE. We find that a packet of light emerging from the galaxy in the source plane arrives at the southeast arc first (image 12), preceding the other arc positions by 16–17 years. Next to appear are the images of the north arc (1-6), followed by the northwest arc (7-10) and the west arc. Finally, the light from the source plane is predicted to arrive at the location of the (unobserved) demagnified central image some 26 years after the north arc, owing to gravitational time delay by the deep potential well of the cluster. Interestingly, we find that images 1–11 of the source occur within the span of several months to a year, a result that is qualitatively quite robust to the details of the lens model. This relatively short time delay implies that counter images of transient events in the Sunburst Arc, such as supernova explosions, could potentially be observed, and their time delays measured, within the expected lifetime of current observational facilities. We discuss this point further in the next section.
5.3.1 The discrepant clump: variability or something else?
As noted in Section 3, a bright point source appears in the northwest arc, with similar brightness but different spectral energy distribution from the LCE images. A counter image of this point source is not apparent in any of the other arcs. Vanzella et al. (2020b) interpreted the occurrence of this source to be due to time variability, and postulate that this source is transient in nature. They estimate its magnification at , based on lensing symmetry arguments (Vanzella et al., 2020a). Multi-band HST imaging of PSZ1 G311.6518.48 span more than two years, from 2018-02-21 to 2020-12-30, and while not designed as a cadenced survey, the field was imaged with a wide-throughput filter between 2–4 times each year, with the longest gap of approximately one year between 2019 June 30 and 2020 July 14. During this time, the discrepant clump does not show significant variability. A quantitative epoch-to-epoch comparison is challenging, since different filters were used in different epochs with the exception of F140W that was repeated four times (2019 May, and 2020 Aug, Nov, Dec). Nevertheless, the brightness of the discrepant clump remains qualitatively similar to that of the LCE for over two years, and does not fade away. Moreover, Vanzella et al. (2020b) note that the distinct spectral features of this source are observed in MUSE data as early as 2016. If indeed this discrepant emission is transient in nature, its lightcurve appears to be flat on a several-year observed time scale, and more than a year intrinsic time scale (cosmological expansion stretches the rest-frame time by a factor of ), significantly longer than most supernovae.
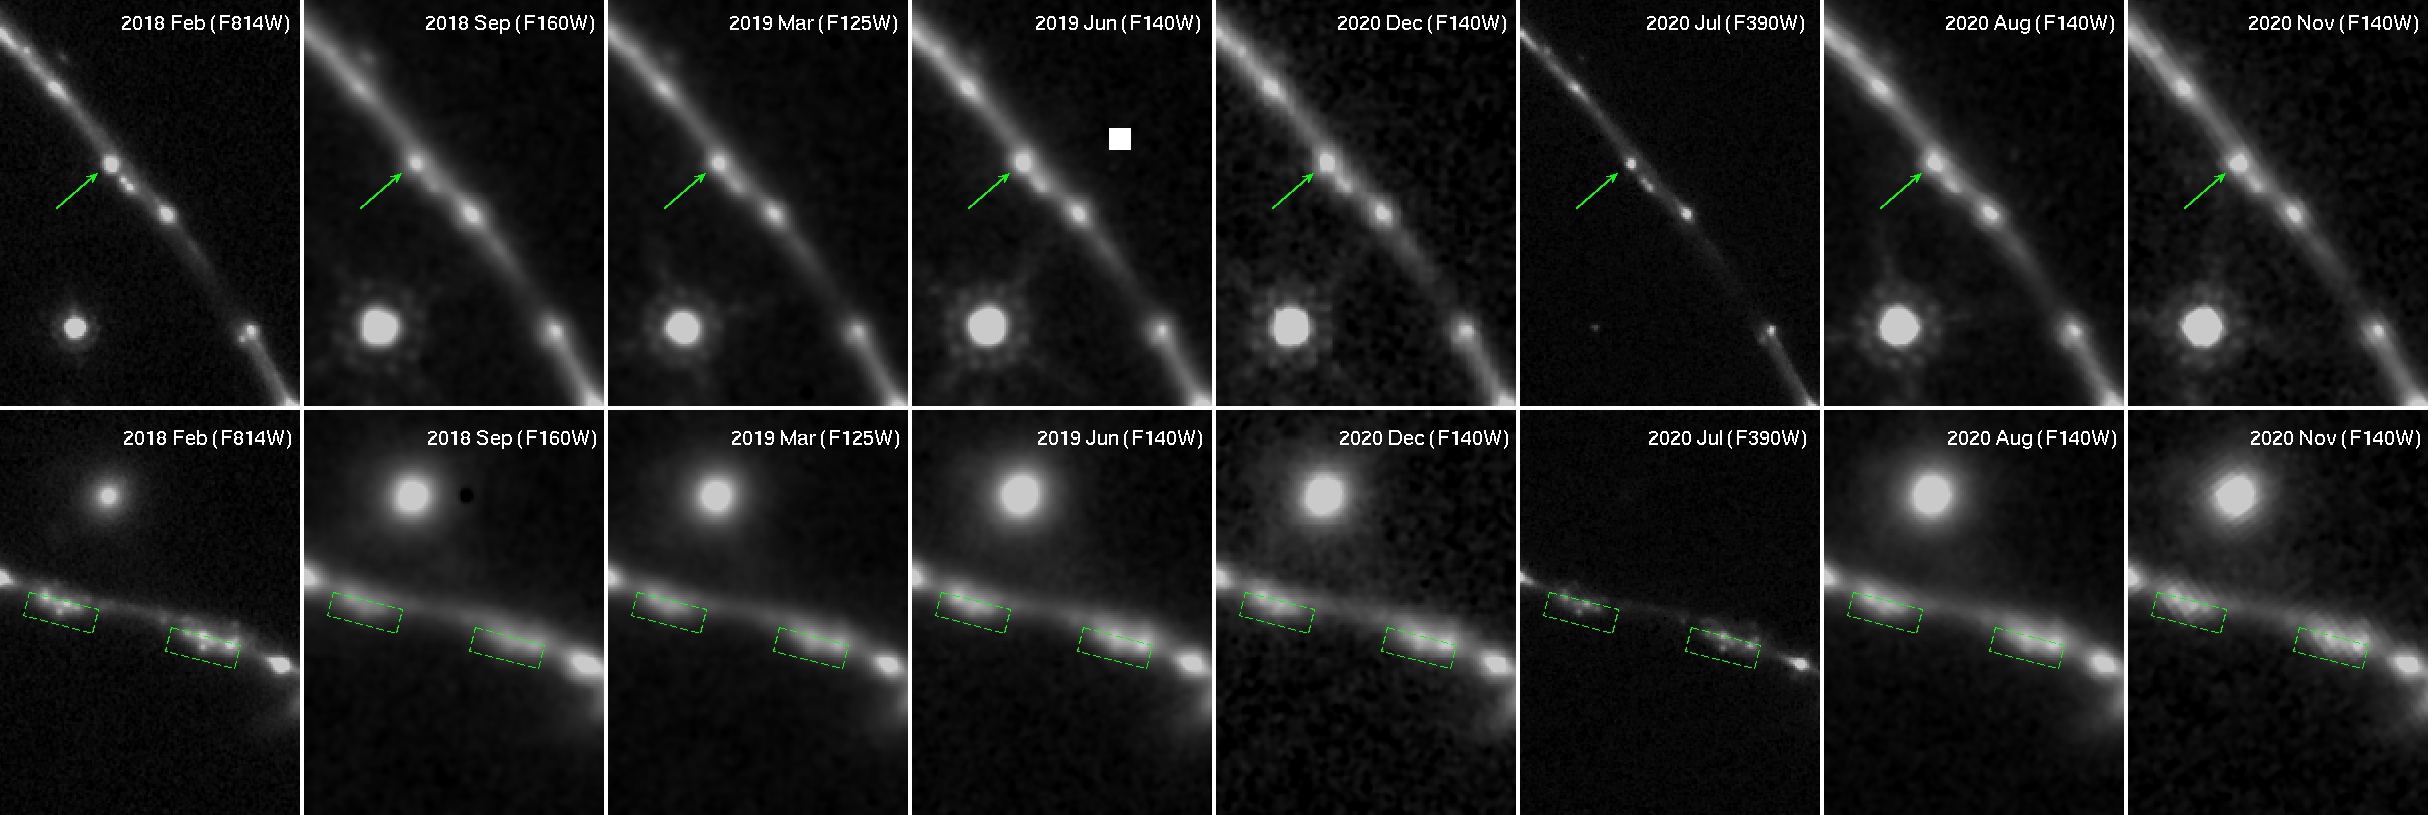
Our lensing analysis points to a short time delay between the north and northwest arcs, meaning that a transient event in any of these arcs should appear in the other arcs within a few months; time variability alone cannot explain why multiple images of the discrepant source are not detected. Unless this image experiences extreme magnification at the position of the discrepant clump, its counter images should be detectable in close proximity to images 4.3 and 4.4 in the north arc. In Figure 9 we show the location of the discrepant arc (top row) and the location of where a counter image should appear (bottom row) in the reddest available HST broad-band filter in each of eight epochs. The discrepant source is clearly detected in each epoch in the northeast arc, with observed brightness comparable to that of the LCE clump. A dashed box marks a broad region around the expected location of the counter image, near clump 4. If the transient hypothesis were correct, a counter image of the discrepant clump should be visible in these regions with brightness similar to that of the LCE. However, throughout the observing window, no such sources appear in or disappear from these regions. The lensing analysis indicates that image 7 and 11 of the source, the northern tip of the northwest arc, and the west arcs, respectively, lag less than a year behind image 8 and the discrepant clump. Although these images are less magnified than image 8, a clump with comparable brightness to the LCE clump would have been detectable. We observe no counter image of the discrepant clump in either location.
To summarize, the combined model-predicted time delays and the observational data tell us that the fact that the discrepant clump appears only in the northwest arc must be lensing related and not variability of the clump. Had it been only due to variability, we should have observed its counter image.
The only explanation that remains for why the discrepant clump appears in the northwest arc but is absent from all other counter images of the source galaxy is an extreme magnification at this image-plane location. Such extreme magnification can occur if the source of emission is intrinsically small, and located extremely close to the source-plane caustic. For a point-like source, source-plane caustics formally map to loci of infinite magnification. Such a lensing geometry was invoked in order to explain candidate extremely-magnified single stars due to caustic crossing (Kelly et al., 2018) or proximity (Welch et al., 2022). The average tangential magnification of image 8 is higher than the other arcs, evident by its overall higher distortion; for example, compare the image-plane distance between the three brightest clumps, 1, 2, and 3, in each of the images. In image 8, a grazing critical curve could be resolving clump 4 into two emission knots plus the discrepant clump, the latter being further magnified by its proximity to the critical curve.
An interesting solution was recently proposed by Diego et al. (2022); they explore the possibility that the critical curve near image 8 is perturbed by a small mass, M⊙, with no observed counterpart. They show that such a perturber could place the source of the discrepant clump right on top of a caustic, thus magnifying it extremely, and cause image 4.8 to split into the two observed clumps. A similar approach was also employed by Mahler et al. (2022a), where supermassive black holes were shown to be a plausible reason for lensing anomalies. Upcoming JWST imaging might be able to detect a faint perturber in this location.
5.4 Sunburst Galaxy Source Plane Analysis
The overall effect of gravitational lensing magnification is in amplifying the solid angle of a source while conserving its surface brightness, thus increasing the amount of light that reaches the observer from the source by a factor of . The angular amplification is not spatially uniform; it is a combination of an isotropic magnification (convergence, ) and distortion (shear, ). and are combinations of second partial derivative components of the lensing potential, and thus are a function of the image plane position (Narayan & Bartelmann, 1996).
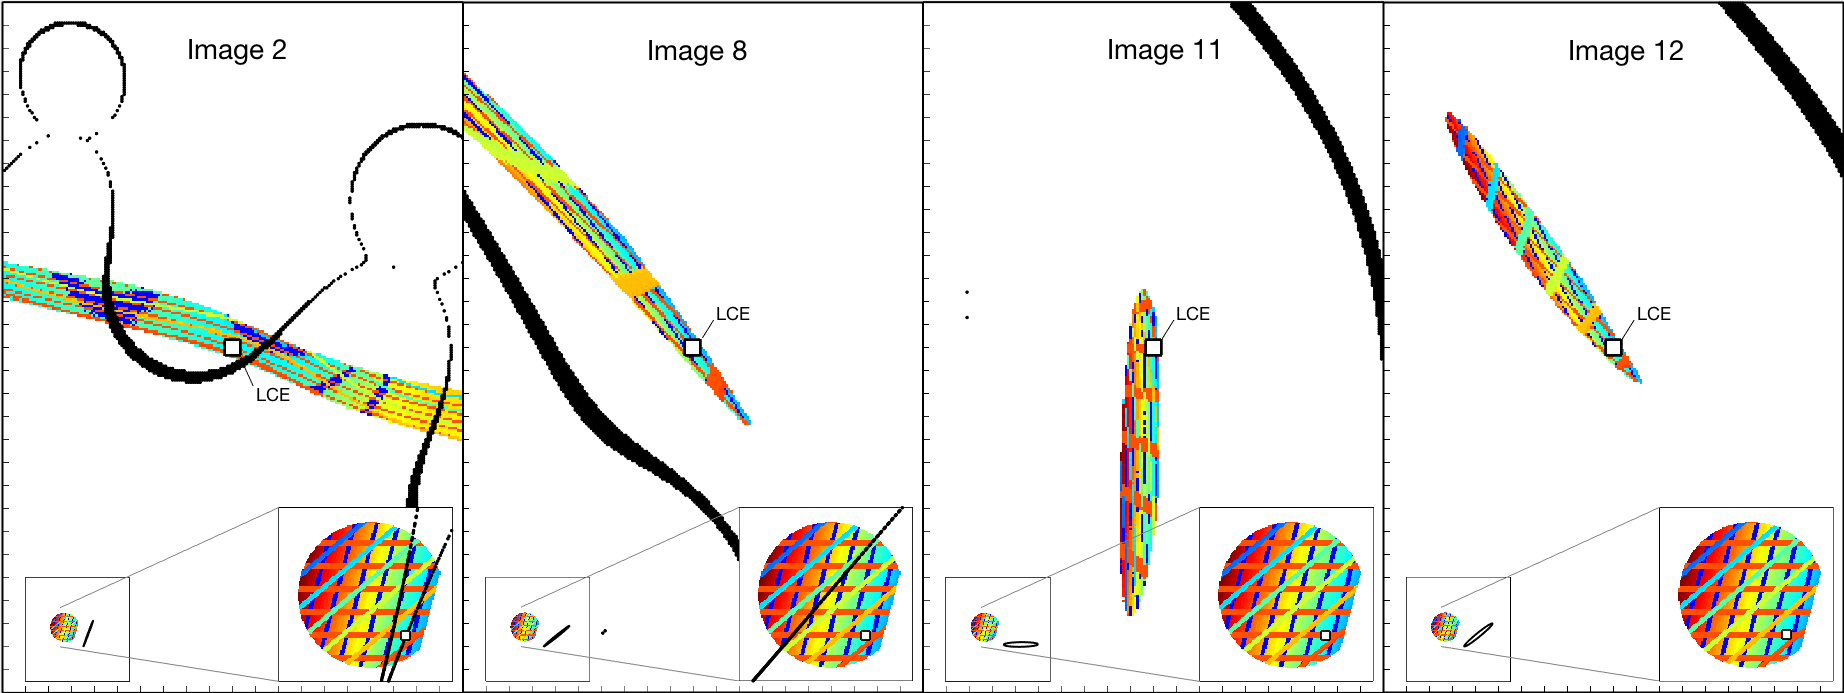
The extreme tangential shear that makes the images of the Sunburst Arc acts to resolve the source galaxy in multiple directions; in each arc, the shear acts most strongly in a preferential primary orientation. We illustrate this behavior in Figure 10, showing a mock source and its resulting lensed images in four regions of the image plane: Image 2 in the north arc, Image 8 in the northwest arc, Image 11: the west arc, and Image 12: the southeast arc. While the source does appear to be magnified in the radial direction, most of its magnification is in the tangential direction. The mock source is designed to highlight the three primary source-plane angles in which the shear acts in this line of sight, with parallel lines plotted at , , and (measured ccw from North), perpendicular to the primary shear directions, , , and , respectively. By lensing the mock source through the lens model, we find that the shear near the west arc (image 11) acts to resolve the source in the north-south direction, separating the red lines in the mock source, which are angled at . Near the southeast arc (image 12), the shear resolves the source in the northeast-southwest direction, increasing the separation between the color-sequence lines that are plotted at a angle. It acts in a similar direction near Image 8. Finally, near Image 2 in the north arc, the resolution is almost perpendicular to that of Image 11, acting to separate the blue parallel lines that are plotted at .
The multi-directional gravitational lensing distortion can therefore enable a tomographic reconstruction of the source plane, facilitating a high resolution analysis, by carefully combining information from differently distorted images. Structures that may appear unresolved in one image of the source may be resolved in a different image. Understanding the directional distortion also enabled an informed selection of our upcoming JWST NIRSpec IFU pointings, to resolve the same source component in different directions (JWST-GO program 02555, PI: Rivera-Thorsen).
A comprehensive computed tomography (a.k.a. CT) reconstruction and forward-modeling of the source plane of the Sunburst Arc is reserved for future work. In this section, we use the lens model and our understanding of the multi-directional lensing distortion of the source to qualitatively construct the galaxy in the source plane by hand. Figure 11 shows an “artist’s impression” of the source, as an approximate visualization of the Sunburst Arc galaxy in the source plane. The conceptual reconstruction was produced by ray-tracing the position of each of the emission clumps from the image plane to the source plane through the lens model. The approximate location of the features was determined by taking into account the ray-tracing of the different images of the Sunburst Arc, taking advantage of the high magnification of some of the images from the northern arcs as well as the less-magnified but more complete images in the west and southeast. We then populate these approximate locations with circular artificial sources with colors and surface brightness approximately matching those of the composite color view in Figure 2. The source image of the extended galaxy (Source 50) and connecting “bridge” to the north is a direct ray-tracing of the image plane color rendition.
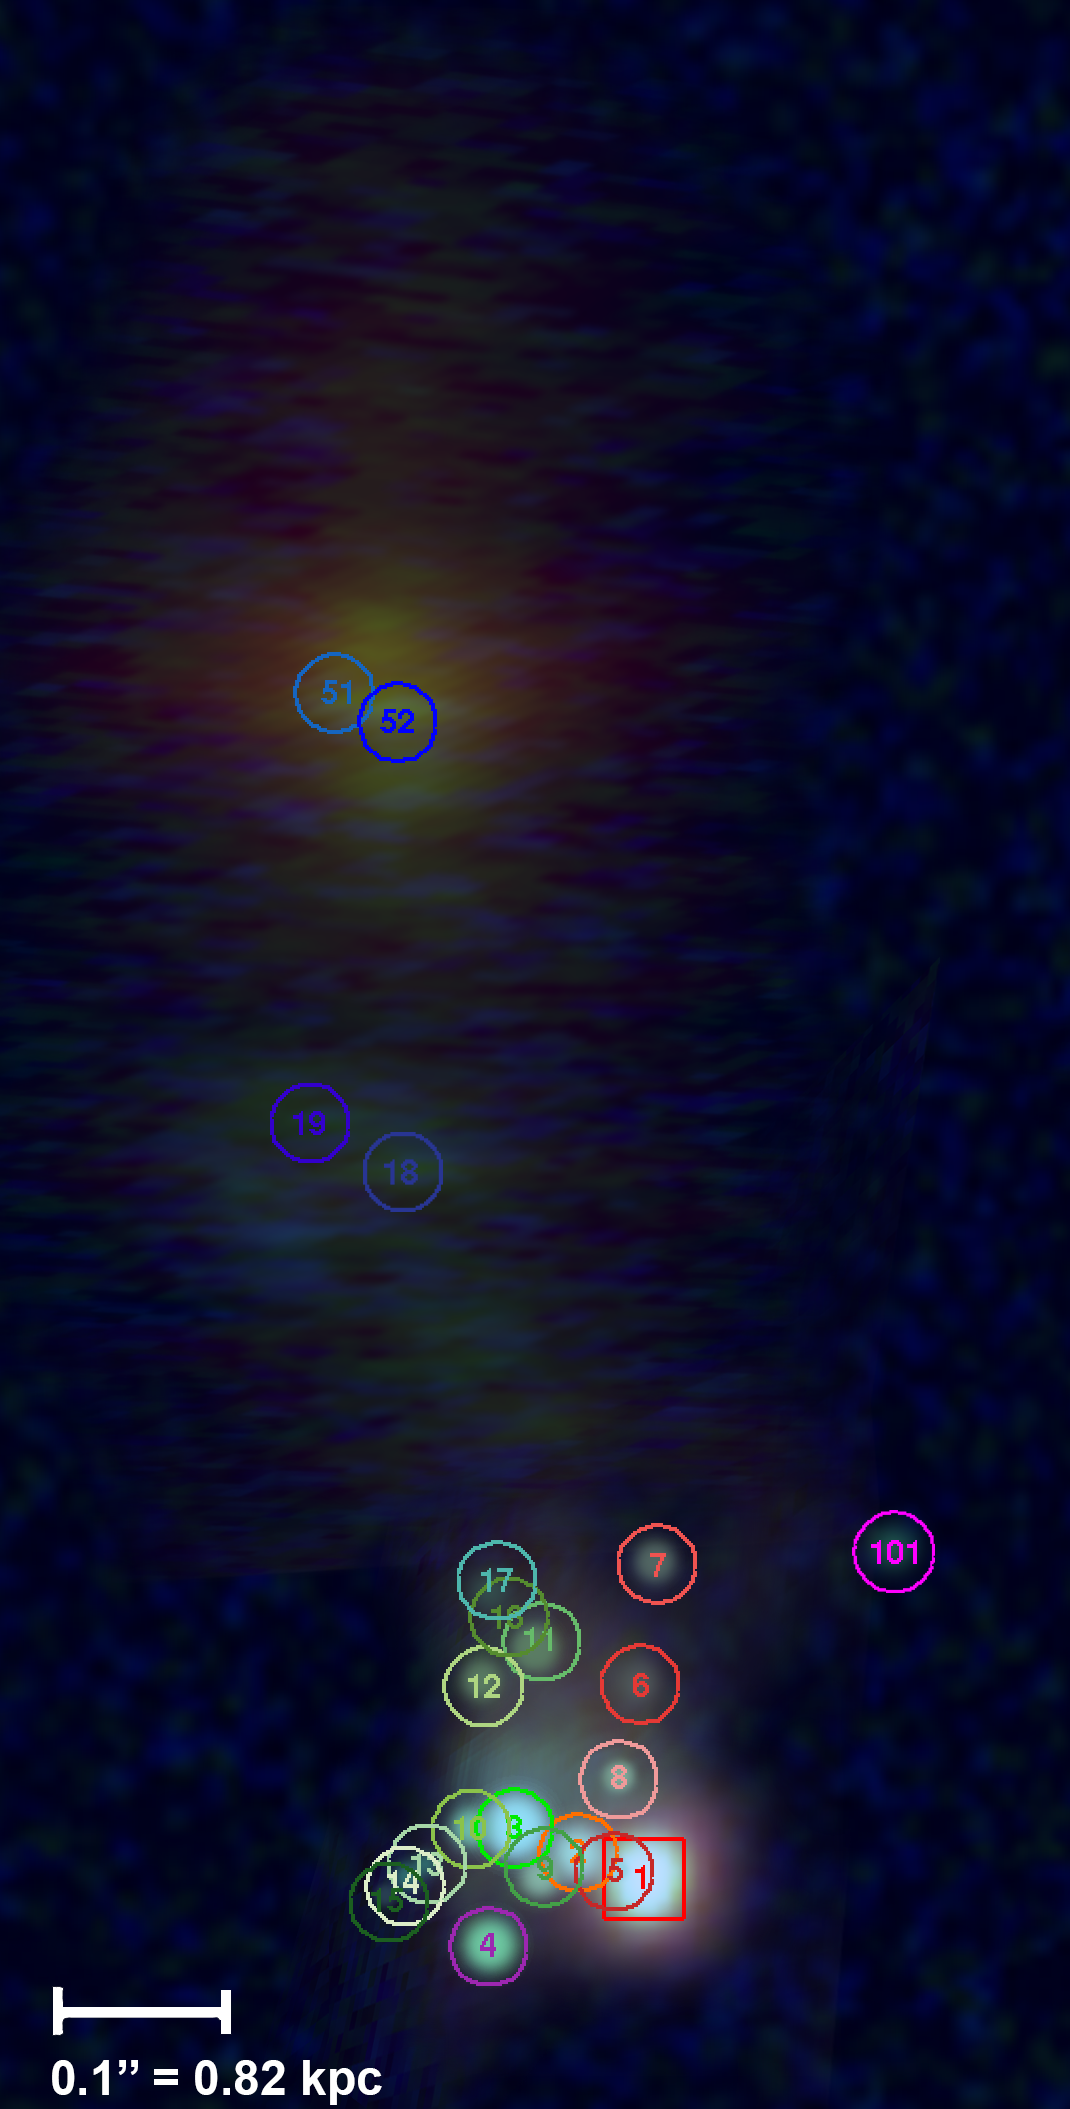
We identify 19 discrete clumps in the main source galaxy. Clump 1 (the LCE) is positioned in the source plane such that it is multiply-imaged 12 times (a 13th undetected image is predicted by the lens model to be a central demagnified image). The clumps occupy a region sized kpc in the source plane, with the LCE clump positioned at one edge of the galaxy.
The closest clump to the LCE, clump 5, is resolved from the LCE mainly in the north arc; other arcs lack the resolving power in the direction connecting clumps 1–5. As Figure 10 showcases, the eastern parts of the source are not imaged in the north arc. Clumps 1, 2, and 5–8 appear in all the images of the source except Images 5 and 6. Images 3 and 4 contain more of the source galaxy, including clumps 1–12, but lack the clumps at the east edge, which are seen in Images 7 and 8. Images 5 and 6 include only clump 1: Image 5 because it is only isolating clump 1 within its caustics (red caustics in Figure 12); Image 6 would have included any emission west of clump 1 (i.e., west of the orange caustic in Figure 12), if there was any. It does show an image of clump 101 which may be related to the same galaxy. From color considerations and the source plane analysis, we identify that the non-leaking clump in Images 9 and 10 is clump 4. A lensing caustic can separate clumps 1 and 4 from the rest of the galaxy, thus creating their multiple images at these locations, as can be seen in Figure 12. We identify an apparent double image of clump 4 in Image 8, which along with the discrepant clump (see Section 5.3.1) can be a result of a more complex caustic or a more complex source that is extremely magnified and tangentially resolved into several components only in this location. Finally, all the clumps appear in Images 11 and 12, which are complete images of the galaxy. However, due to the lower magnification, only the brightest clumps are readily identified. From their source plane positions, it is possible that the clumps we label 16 and 17 are the same as clump 11 or 12, but are less resolved, or that they are outside of the caustic of Images 3 and 4.
For studies of the source properties of the Sunburst Arc galaxy, and in particular the physical properties of its LyC leaking versus non leaking regions, it is informative to know the source plane separation between each clump and the LCE. In subsubsection 5.4.2 we summarise this information. For each clump, we measure the source plane distance between the center of the clump and the LCE, and note in which of the twelve Sunburst Arc images it appears. The lower and upper limits on the distance to the LCE take into account the statistical lens modeling uncertainties from the MCMC, as well as the variations of source plane mapping from different images. The quoted distance is the average of the distances calculated from the different images of the same clump, i.e., where is the distance between clump and clump in the source plane projection of Image . The projections from Image 7 were excluded from this calculation due to the effect of modeling the foreground galaxy in this region on the lensing magnification. Including the source predictions from Image 7 would increase the upper uncertainty by a factor of .
5.4.1 Clump Sizes
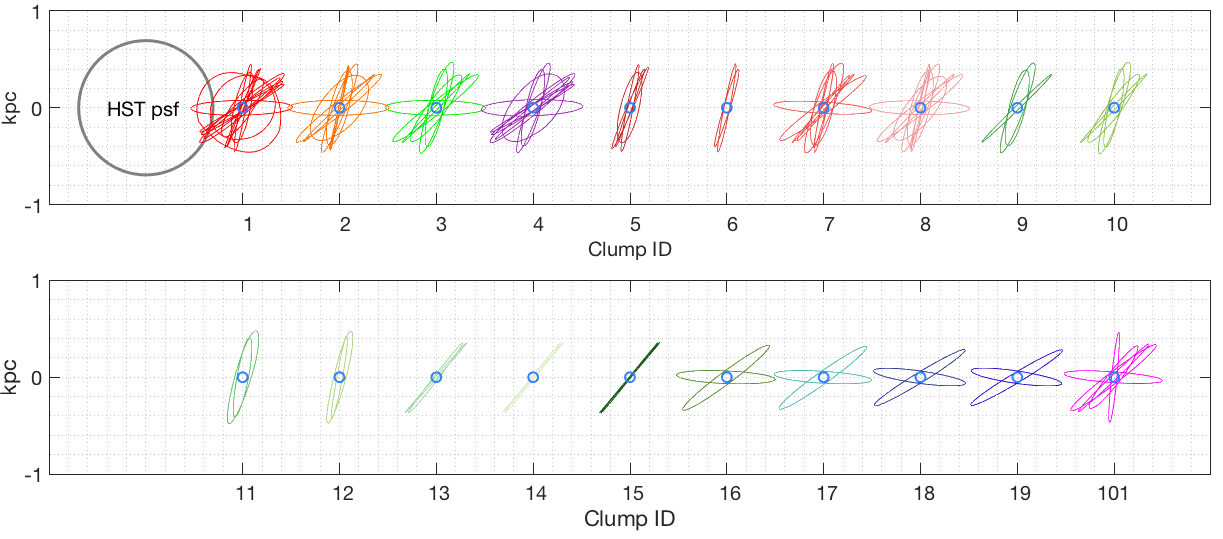
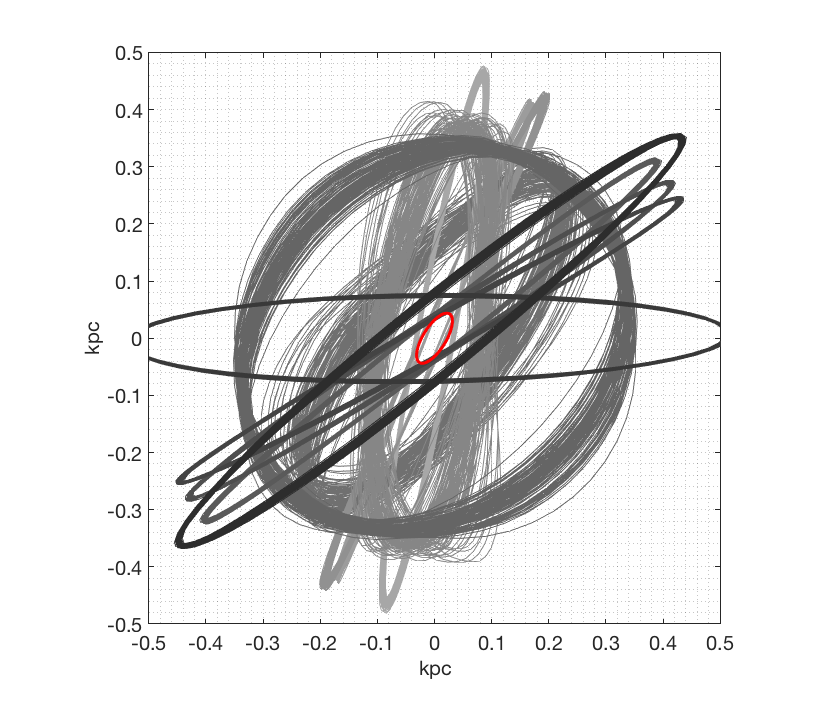
The extreme shear and anisotropic magnification, combined with the telescope PSF, complicates a traditional ray-tracing based source reconstruction of barely-resolved star forming regions. Simply ray-tracing unresolved lensed image to the source plane can only place upper limits on the clump size, as it will return the telescope PSF corrected for the linear magnification. A properly unmagnified, undistorted source plane can be recovered by using forward modeling techniques (e.g., Johnson et al., 2017), where a parameterized model of the source is constructed, ray-traced through the lens equation to the observer, the raw lensed image is convolved with the telescope PSF, and perturbed by noise and other instrument effects. The resulting image is then compared to the observed data iteratively to solve for the set of source plane model parameters that best minimizes the scatter between the model and the data. These and other techniques have been demonstrated to resolve structures down to tens of parsecs, especially when the magnification is particularly high (e.g., Zitrin et al., 2011; Johnson et al., 2017; Vanzella et al., 2017; Welch et al., 2022). A full forward-modeling of the Sunburst Arc is saved for a future publication. We can however deduce an upper limit for clump sizes from their apparent circular morphology and size in the image plane.
The different directions in which the source is distorted in the different images of the same part of the Sunburst Arc source galaxy allow for not only a tomographic analysis of the galaxy morphology, but also for a tomographic measurement of clump sizes, i.e., to constrain the spatial extent of individual star forming regions in multiple directions. We show this for each of the 19 clumps we identify, in Figure 13. For each of the images of each clump, we place a circle with in the image plane, representing the HST/ACS PSF. We ray-trace the PSF circle to the source plane using the lens equation and the lens model outputs. For clarity, we only plot the results from the best fit model. With the exception of image 1.5 of the LCE, plotting the statistical uncertainties would have resulted in only slight broadening of the shown ellipse lines. We find that typically, the HST PSF circles de-lens into high-eccentricity ellipses in the source plane, with semi-minor axes of order pc, and semi-major axes of order pc. This means that to be unresolved or barely resolved in the image plane, a clump must be smaller than pc in the source plane. Regions with larger spatial extent in the source plane should appear extended and elongated in the image plane, as they span several source plane resolution elements. We note that the distinct star forming clumps observed in the Sunburst Arc are largely barely resolved.
Our upper limits on star forming clump sizes are significantly smaller than those reported for unlensed galaxies at cosmic noon, which is consistent with expectations from numerical simulations. For example, Meng & Gnedin (2020) conclude that clump sizes measured in field galaxies are overestimated by a factor of due to combination of the insufficient resolution of the telescope (usually HST) and projection effects. They show that without the benefit of high lensing magnification, the observed clumps are likely an aggregate of several smaller clumps.
Since the LCE clump is of high interest in the literature, we plot the delensed PSF for it separately, in Figure 14, and include lines from the 100 models that sample the parameter space. The projection from each image of the clump is shown in a different shade of gray; image 1.5 is not shown, because the high magnification uncertainty due to a foreground galaxy prevents it from providing useful constraints. The clump, which is unresolved in our HST imaging data, is constrained to pc in its short axis and pc in its long axis, leading to an effective radius of pc. The estimate of Vanzella et al. (2020a) of in the tangentially-resolved direction, which they obtained by measuring the image plane size and assuming , is consistent with our lens model-based upper limit.
5.4.2 Evidence for galaxy interaction in the plane of the Sunburst Arc
A likely companion to the Sunburst Arc, source 50 appears at the same redshift and kpc in projection north of the LCE clump. In velocity space, source 50 and the Sunburst Arc galaxy are separated by km s-1, indicating that they are likely interacting. Unlike the Sunburst Arc, this galaxy does not exhibit strong emission lines indicative of ongoing star formation; while a clear color gradient within this galaxy is apparent, overall it is redder and significantly less clumpy than the Sunburst Arc.
As can be seen in the source plane projection in Figure 11, the Sunburst Arc and its neighbor galaxy appear to be connected with a “bridge” of faint and largely diffuse emission. This emission could be a tidal tail resulting from a recent interaction between these two galaxies. Another clump, labeled 101 in our figures and tables, is projected kpc from the LCE but in a direction perpendicular to the line connecting the Sunburst Arc and galaxy 50. This clump has no direct spectroscopic redshift measurement, but based on the lensing analysis its redshift is consistent with that of the Sunburst Arc. It is therefore likely another correlated structure.
This likely interaction between the Sunburst Arc and nearby galaxies could explain its clumpy nature. Analyses of zoom-in hydro-cosmological simulations indicate that minor galactic mergers can induce formation of clumps, and that massive clumps observed at large radii were likely formed ex-situ and merged (e.g., Mandelker et al., 2014, 2017; Meng & Gnedin, 2020).
Other than the MUSE data, the images of source 50 were not targeted for detailed spectroscopy (e.g., by our MagE or FIRE programs). Deep, high resolution IFU observations targeting both galaxies could inform an investigation of their interaction properties through spatially resolved velocity structure (e.g., Wuyts et al., 2014). The anticipated 6-filter, 1.4 h JWST NIRCam imaging, which is planned for Cycle 1 (JWST-GO program 02555, PI: Rivera-Thorsen) will provide depth and high resolution, and, combined with the existing multi-band HST data, will enable spatially-resolved SED fitting of the two galaxies and the bridging emission in restframe-UV through NIR (0.08 – 1.3). Such SED analysis will map these galaxies’ metallicity, dust, star formation rate and history, and determine whether a recent burst of star formation occurred, as might be triggered by an interaction. It may provide clues to whether galaxy interactions play a role in LyC escape from star forming galaxies such as the Sunburst Arc.
Note. — Average projected distance in kpc between each of the non-LyC leaking clumps and the LCE (clump 1) in the source plane of the Sunburst Arc galaxy. The quoted distance is measured as the average of the source plane distances predictions from different multiple images. Uncertainties take into account both the image-to-image variation and the strong lens modeling uncertainty.
6 Summary
We present new multi-band Hubble Space Telescope imaging data and a lensing analysis of PSZ1 G311.6518.48, a cluster lensing the Sunburst Arc galaxy. In addition to the Sunburst Arc, we identify multiple images of 14 strongly lensed galaxies, and measure spectroscopic redshifts of four of them from archival Multi Unit Spectroscopic Explorer on the Very Large Telescope. The main arc in this line of sight, the Sunburst Arc, is a lensed image of a star-forming, LyC leaking galaxy at , which is lensed into ten partial images and two complete images. In particular, we confirm the identification of 12 images of the LyC emitting clump. We model the field using the public software Lenstool (Jullo et al., 2007), a parametric algorithm that uses MCMC sampling of the parameter space. The lensing analysis provides a measurement of the mass distribution of the foreground lensing cluster, and the magnification and distortion solutions for analyses of the lensed sources behind it. Our findings are summarised as follows.
-
•
The projected mass density of the lens cluster PSZ1 G311.6518.48, enclosed within kpc, is M⊙. We find this detailed lens model-based measurement to be in good agreement with previous estimates, and in particular, with the mass inferred from the arc radius; this agreement implies a symmetric mass distribution. The Chandra X-ray data indicate that the cluster is relaxed, and has a cool core, consistent with the star-formation activity identified in the BCG from imaging and spectroscopy.
-
•
We measure the average magnification affecting the complete images of the Sunburst Arc galaxy, and , for the west and southeast arcs, respectively. Uncertainties are measured from models representing a sampling of the parameter space.
-
•
The source galaxy of the Sunburst Arc is clumpy, with 19 emission clumps identified and mapped between its different images. The magnifications acting upon individual clumps within the Sunburst Arc range from a factor of a few, to in regions close to the critical curve. We provide the lensing magnifications and statistical uncertainties of the images of the identified emission clumps, and the average distance between each clump and the LCE clump.
-
•
A discrepant unresolved clump in the northwest arc of the Sunburst Arc shows significantly different colors and spectral features from other similarly bright point sources. Previous work claimed that it is a transient, since it does not appear in the other images of the galaxy (Vanzella et al., 2020b). We conduct a time delay analysis of the field, and show that the relative time delays between images 1-11 of the source span only several months to a year, a time span covered by our observations. A counter image of the discrepant clump would have been detectable in our data had it been a transient event. However, such a source does not appear or disappear in any of the images of the Sunburst Arc. Our analysis instead confirms the conclusion of Diego et al. (2022), that the occurrence of this clump (dubbed “Godzilla” in their publication) is due to extreme magnification at this location, not due to time variability.
-
•
We show that the lensing potential of PSZ1 G311.6518.48 results in multi-direction distortion of the source galaxy, providing tomographic resolving power to constrain the morphology of the source galaxy of the Sunburst Arc. We show that the source is probed in three distinct axes. While a full computed tomography and forward modeling source reconstruction analyses are left for future work, we use the lensing information to generate a qualitative reconstruction of the source galaxy by hand. We show an “artist’s impression” realization of the source galaxy, with the emission clumps painted onto the source plane with similar colors as the observed image and at approximate positions as determined by projecting the twelve images to the source plane. We show conceptually how the source galaxy is bisected by the source plane caustics, thus forming the twelve observed images.
-
•
Based on the projected source plane size of the HST PSF, combined with the multi-direction sampling of the source plane by the lensing distortion, we place an upper limit on the size of any unresolved clump of pc. In particular, the unresolved LCE clump is constrained to pc. That is, to our knowledge, the most precise localization of a LyC escape site in any galaxy, an order of magnitude better than other observed LyC leaking galaxies so far; it showcases the unique power of gravitational lensing in the study of the mechanisms enabling ionizing escape.
-
•
We identify a likely companion galaxy, located kpc north of the Sunburst Arc in the source plane, labeled source 50 and observed near the west and southeast arcs. In velocity space, source 50 is separated from the Sunburst Arc galaxy by 36 km s-1, indicating that the galaxies could be interacting. Future IFU observations of the two galaxies can map their velocity structures, while a combination of the existing HST and the future JWST multi-band imaging will enable spectral energy distribution fits to measure spatially resolved stellar populations, ages, metallicities, and other diagnostics, and examine the role of galaxy-galaxy interactions in prompting the escape of LyC radiation.
The multi-band HST imaging, combined with spectroscopy from ground-based and space based observatories, enable the detailed analysis of the lensing potential of PSZ1 G311.6518.48 presented here, which in turn facilitates its use as a powerful cosmic telescope to study the background Universe. Our model is and will be utilized by several ongoing and future works. The primary lensed galaxy in this field, the extremely bright Sunburst Arc, is a topic of numerous publications, primarily because it is the most spatially-resolved example of LyC escape at any redshift. With an Einstein radius of and complex critical curve, this line of sight is a treasure trove for studies of intermediate and high redshift lensed galaxies and cluster physics alike.
ACKNOWLEDGMENTS
Based on observations made with the NASA/ESA Hubble Space Telescope, obtained at the Space Telescope Science Institute, which is operated by the Association of Universities for Research in Astronomy, Inc., under NASA contract NAS 5-26555. These observations are associated with programs GO-15101, GO-15418, GO-15377, and GO-15949. The authors acknowledge support from Programs GO-15101, GO-15949, GO-15337, provided through grants from the STScI under NASA contract NAS5-26555. Based on VLT/MUSE observations collected at the European Southern Observatory under ESO programme 297.A-5012(A), PI: Aghanim, obtained from the ESO Science Archive Facility. Support for this work was also provided by the National Aeronautics and Space Administration through Chandra Award Number GO8-19084X issued by the Chandra X-ray Center, which is operated by the Smithsonian Astrophysical Observatory for and on behalf of the National Aeronautics Space Administration under contract NAS8-03060. The scientific results reported in this article are based on observations made by the Chandra X-ray Observatory, and this research has made use of software provided by the Chandra X-ray Center (CXC) in the application package, CIAO. This paper used data gathered with the 6.5 m Magellan Telescopes located at Las Campanas Observatory, Chile. We thank the staff of Las Campanas for their dedicated service, which has made possible these observations. We thank the anonymous referee for a thoughtful and constructive review of the manuscript.
References
- Bertin & Arnouts (1996) Bertin, E., & Arnouts, S. 1996, A&AS, 117, 393
- Bowen (1934) Bowen, I. S. 1934, PASP, 46, 146
- Bradač et al. (2002) Bradač, M., Schneider, P., Steinmetz, M., et al. 2002, A&A, 388, 373
- Calzetti (2013) Calzetti, D. 2013, in Secular Evolution of Galaxies, ed. J. Falcón-Barroso & J. H. Knapen, 419
- Chisholm et al. (2019) Chisholm, J., Rigby, J. R., Bayliss, M., et al. 2019, ApJ, 882, 182
- Dahle et al. (2016) Dahle, H., Aghanim, N., Guennou, L., et al. 2016, A&A, 590, L4
- Diego et al. (2022) Diego, J. M., Pascale, M., Kavanagh, B. J., et al. 2022, arXiv e-prints, arXiv:2203.08158
- Diego et al. (2005) Diego, J. M., Protopapas, P., Sandvik, H. B., & Tegmark, M. 2005, MNRAS, 360, 477
- Elíasdóttir et al. (2007) Elíasdóttir, Á., Limousin, M., Richard, J., et al. 2007, arXiv e-prints, arXiv:0710.5636
- Fischer et al. (2019) Fischer, T. C., Rigby, J. R., Mahler, G., et al. 2019, ApJ, 875, 102
- Fruscione et al. (2006) Fruscione, A., McDowell, J. C., Allen, G. E., et al. 2006, in Society of Photo-Optical Instrumentation Engineers (SPIE) Conference Series, Vol. 6270, Society of Photo-Optical Instrumentation Engineers (SPIE) Conference Series, ed. D. R. Silva & R. E. Doxsey, 62701V
- Gladders & Yee (2000) Gladders, M. D., & Yee, H. K. C. 2000, AJ, 120, 2148
- James et al. (2018) James, B. L., Auger, M., Pettini, M., et al. 2018, MNRAS, 476, 1726
- Johnson & Sharon (2016) Johnson, T. L., & Sharon, K. 2016, ApJ, 832, 82
- Johnson et al. (2017) Johnson, T. L., Rigby, J. R., Sharon, K., et al. 2017, ApJ, 843, L21
- Jullo et al. (2007) Jullo, E., Kneib, J. P., Limousin, M., et al. 2007, New Journal of Physics, 9, 447
- Kelly et al. (2018) Kelly, P. L., Diego, J. M., Rodney, S., et al. 2018, Nature Astronomy, 2, 334
- Limousin et al. (2005) Limousin, M., Kneib, J.-P., & Natarajan, P. 2005, MNRAS, 356, 309
- Lopez et al. (2020) Lopez, S., Tejos, N., Barrientos, L. F., et al. 2020, MNRAS, 491, 4442
- Mahler et al. (2022a) Mahler, G., Natarajan, P., Jauzac, M., & Richard, J. 2022a, arXiv e-prints, arXiv:2201.10900
- Mahler et al. (2018) Mahler, G., Richard, J., Clément, B., et al. 2018, MNRAS, 473, 663
- Mahler et al. (2022b) Mahler, G., Jauzac, M., Richard, J., et al. 2022b, arXiv e-prints, arXiv:2207.07101
- Mandelker et al. (2017) Mandelker, N., Dekel, A., Ceverino, D., et al. 2017, MNRAS, 464, 635
- Mandelker et al. (2014) —. 2014, MNRAS, 443, 3675
- Mantz et al. (2018) Mantz, A. B., Allen, S. W., Morris, R. G., & von der Linden, A. 2018, MNRAS, 473, 3072
- McDonald et al. (2012) McDonald, M., Bayliss, M., Benson, B. A., et al. 2012, Nature, 488, 349
- McDonald et al. (2019) McDonald, M., McNamara, B. R., Voit, G. M., et al. 2019, ApJ, 885, 63
- Meneghetti et al. (2017) Meneghetti, M., Natarajan, P., Coe, D., et al. 2017, MNRAS, 472, 3177
- Meng & Gnedin (2020) Meng, X., & Gnedin, O. Y. 2020, MNRAS, 494, 1263
- Montes & Trujillo (2022) Montes, M., & Trujillo, I. 2022, arXiv e-prints, arXiv:2209.00043
- Narayan & Bartelmann (1996) Narayan, R., & Bartelmann, M. 1996, arXiv e-prints, astro
- Ofek (2014) Ofek, E. O. 2014, MAAT: MATLAB Astronomy and Astrophysics Toolbox, Astrophysics Source Code Library, record ascl:1407.005
- Patrício et al. (2019) Patrício, V., Richard, J., Carton, D., et al. 2019, MNRAS, 489, 224
- Pignataro et al. (2021) Pignataro, G. V., Bergamini, P., Meneghetti, M., et al. 2021, A&A, 655, A81
- Priewe et al. (2017) Priewe, J., Williams, L. L. R., Liesenborgs, J., Coe, D., & Rodney, S. A. 2017, MNRAS, 465, 1030
- Raney et al. (2020) Raney, C. A., Keeton, C. R., & Brennan, S. 2020, MNRAS, 492, 503
- Remolina González et al. (2018) Remolina González, J. D., Sharon, K., & Mahler, G. 2018, ApJ, 863, 60
- Remolina González et al. (2021) Remolina González, J. D., Sharon, K., Mahler, G., et al. 2021, ApJ, 920, 98
- Rigby et al. (2022) Rigby, J., authors, & authors. 2022, ApJ, in prep, xxx
- Rigby et al. (2018) Rigby, J. R., Bayliss, M. B., Sharon, K., et al. 2018, AJ, 155, 104
- Rivera-Thorsen et al. (2017) Rivera-Thorsen, T. E., Dahle, H., Gronke, M., et al. 2017, A&A, 608, L4
- Rivera-Thorsen et al. (2019) Rivera-Thorsen, T. E., Dahle, H., Chisholm, J., et al. 2019, Science, 366, 738
- Rodney et al. (2015) Rodney, S. A., Patel, B., Scolnic, D., et al. 2015, ApJ, 811, 70
- Schneider (1985) Schneider, P. 1985, A&A, 143, 413
- Sharon et al. (2014) Sharon, K., Gladders, M. D., Rigby, J. R., et al. 2014, ApJ, 795, 50
- Tremblay et al. (2014) Tremblay, G. R., Gladders, M. D., Baum, S. A., et al. 2014, ApJ, 790, L26
- Urrutia et al. (2019) Urrutia, T., Wisotzki, L., Kerutt, J., et al. 2019, A&A, 624, A141
- Vanzella et al. (2017) Vanzella, E., Calura, F., Meneghetti, M., et al. 2017, MNRAS, 467, 4304
- Vanzella et al. (2020a) Vanzella, E., Caminha, G. B., Calura, F., et al. 2020a, MNRAS, 491, 1093
- Vanzella et al. (2020b) Vanzella, E., Meneghetti, M., Pastorello, A., et al. 2020b, MNRAS, 499, L67
- Weilbacher et al. (2020) Weilbacher, P. M., Palsa, R., Streicher, O., et al. 2020, A&A, 641, A28
- Welch et al. (2022) Welch, B., Coe, D., Diego, J. M., et al. 2022, Nature, 603, 815
- Wuyts et al. (2014) Wuyts, E., Rigby, J. R., Gladders, M. D., & Sharon, K. 2014, ApJ, 781, 61
- Zitrin et al. (2011) Zitrin, A., Broadhurst, T., Coe, D., et al. 2011, MNRAS, 413, 1753
- Zitrin et al. (2015) Zitrin, A., Fabris, A., Merten, J., et al. 2015, ApJ, 801, 44