Metal-Enriched Neutral Gas Reservoir around a Strongly-lensed, Low-mass Galaxy at Identified by JWST/NIRISS and VLT/MUSE
Abstract
Direct observations of low-mass, low-metallicity galaxies at provide an indispensable opportunity for detailed inspection of the ionization radiation, gas flow, and metal enrichment in sources similar to those that reionized the Universe. Combining the James Webb Space Telescope (JWST), VLT/MUSE, and ALMA, we present detailed observations of a strongly lensed, low-mass ( ) galaxy at (also see Vanzella et al. 2022). We identify strong narrow nebular emission, including C IV , He II , O III] , [Ne III] , [O II] , and Balmer series of Hydrogen from this galaxy, indicating a metal-poor H II region () powered by massive stars. Further, we detect a metal-enriched damped Ly system (DLA) associated with the galaxy with the H I column density of cm-2. The metallicity of the associated DLA may reach the super solar metallicity (). Moreover, thanks to JWST and gravitational lensing, we present the resolved UV slope () map at the spatial resolution of pc at , with steep UV slopes reaching around three star-forming clumps. Combining with low-redshift analogs, our observations suggest that low-mass, low-metallicity galaxies, which dominate reionization, could be surrounded by a high covering fraction of the metal-enriched, neutral-gaseous clouds. This implies that the metal enrichment of low-mass galaxies is highly efficient, and further support that in low-mass galaxies, only a small fraction of ionizing radiation can escape through the interstellar or circumgalactic channels with low column-density neutral gas.
1 Introduction
It is now believed that low-mass galaxies significantly contribute the major fraction of the ionization photons in the epoch of reionization (e.g., Atek et al., 2015; Bouwens et al., 2016). Observations of faint galaxies at high-redshift, though very difficult, are required, especially in the era of James Webb Space Telescope (JWST), to directly constrain the ionization radiation, gas environment, galaxy growth, and metal enrichment of the surrounding intergalactic medium (IGM).
Extensive efforts have been conducted to study the intrinsic ultra-violet (UV) continuum and the ionization of low-mass galaxies. The ultraviolet (UV) continuum slope () reveals crucial properties of high-redshift galaxies. It is believed that young stellar population and intense star formation in early galaxies lead to very blue UV slopes (e.g. Schaerer, 2003), even reaching with extremely efficient ionizing agents with minimal dust reddening (e.g. Topping et al., 2022). The high spatial resolution of JWST enables studies on spatial variations of , mapping the distribution of stellar populations and star forming regions within early galaxies, often with clumpy structures, on sub-kiloparsec scales (Chen et al., 2022).
A great many studies aim to understand how ionization radiation escapes into the IGM (e.g., Ramambason et al., 2020). Before UV photons reach the IGM, how much radiation can escape from galaxies depends on: (1) the intrinsic intensity and the slope of UV spectra; and (2) the distribution of optically-thick neutral hydrogen (H I) gas in the interstellar and circumgalactic medium (CGM) (e.g., Chisholm et al., 2018). It is therefore crucial to study both UV continua and gas properties around low-mass galaxies to quantify the H I (Ly) optical depth in the CGM for better understanding the reionization process.
The existence of the neutral gas in and around low-mass star forming galaxies has been suggested mainly through observations of Ly emission (e.g., Stark et al., 2017; Gronke et al., 2017). Low-mass galaxies often have strong Ly and other ionized nebular emission (e.g. Erb et al., 2010; Stark et al., 2014). The presence of optically-thick, H I “shell” makes the Ly emission showing the double-peak structure (e.g., Yang et al., 2017), with the expanding outflow further suppressing blue peaks of Ly emission (Yang et al., 2014).
Nevertheless, only through emission, the nature of the interplay between the neutral gas and galaxy cannot be completely understood. Detailed gas properties, including the gas metallicity, geometry and density need to be constrained. The strong lensing, plus the deep integration of JWST and VLT/MUSE provide us with an excellent opportunity to conduct direct and detailed observations of a low-mass galaxy at , through both emission and absorption. Here, we present a detailed analysis of a strongly magnified arclet galaxy in the Abell2744 field, combined with optical, infrared and millimeter observations. The system is lensed into three multiple images, and the arclet is composed of two of them lying on both sides of the critical line, with three bright compact clumps (knots in the arc) mirrored on each side (Mahler et al., 2018; Bergamini et al., 2022). We name this galaxy “A2744-arc3”. It was also reported in Vanzella et al. (2022). Through spectral-energy-distribution (SED) fitting, they found that these clumps are gravitationally-bound young massive star clusters with bursty star formation.
In this paper, we probe detailed properties of the interstellar and circumgalactic medium (CGM) of A2744-arc3. With VLT/MUSE and JWST, we provide detailed analysis of both nebular emission and absorption lines. Copious emission lines, including the detection of C IV , He II , O III] , [Ne III] , [O II] , and Balmer series of Hydrogen, allow us to quantify the low metallicity of the ionized medium (e.g., Smit et al., 2017; Witstok et al., 2021). Further, the high signal-to-noise (S/N) observations of absorption enable us, for the first time, to examine the detailed properties of the neutral gas reservoir surrounding a low-mass galaxy at . The excellent de-lensed spatial resolution down to pc in rest-frame UV observations allow the examination of the spatial variations of the UV radiation. All these information yield unparalleled understanding of low-mass, young galaxies at high-redshift using A2744-arc3 as a textbook example.
This paper is organized as follows. In Section 2, we describe the observations and data reduction, including JWST/NIRISS imaging and spectroscopy, HST imaging, VLT/MUSE and ALMA continuum observations; In Section 3, we provide details of photometry, SED fitting, and the lensing reconstruction in source-plane. We also show the spatially resolved UV slope map. In Section 4, we present further analysis on the rest-frame UV and optical spectrum of A2744-arc3, including the analysis of both emission and absorption features. Discussions are conducted in Section 5. We assume a flat cosmological model with and . The Glafic lensing model (Oguri, 2010; Kawamata et al., 2016) is adopted.
2 Data
2.1 JWST/NIRISS imaging & grism observations
NIRISS observations of A2744 were taken by the GLASS JWST Early Release Science Program (Treu et al., 2022), devoting about for direct imaging and for GR150 row and column (R+C) grism in F115W, F150W, and F200W. Especially the NIRISS/F200W data, spanning from 1.7 to 2.2 , allows us to better improve constraints on its stellar mass. The data were reduced in the same way as shown in Wu et al. (2022). Here we summarize the procedure as follows: the data were reduced using the standard JWST pipeline111https://github.com/spacetelescope/jwst v1.6.2 with calibration reference files “jwst_0944.pmap”; 1/f noise (see Schlawin et al. 2020) was modeled and removed using the code tshirt/roeba222https://github.com/eas342/tshirt, and the “snowball” artifacts from cosmic rays (Rigby et al., 2022) were identified and masked; the world coordinate system of mosaicked images were registered using the Pan-STARRS1 catalog (Flewelling et al., 2020); the pixel scale of final mosaicked images was resampled to 0.03″ with pixfrac 0.8. We reduced NIRISS grism data using Grizli 333https://github.com/gbrammer/grizli/, and the 2D grism spectra were drizzled with a pixel scale 0.065″.
To optimally extract 1D spectra of A2744-arc3, we first split the entire arclet into six segments, each with one clump. We extracted their 1D spectra using 5-th Chebyshev polynomials. We summed over five 1D spectra of the six segments to get the final spectra. One of them was excluded since it is severely contaminated by zero-th and first order images from other sources.
2.2 Hubble Frontier Fields images
The A2744 cluster was observed as part of the Hubble Space Telescope Frontier Fields program444https://archive.stsci.edu/prepds/frontier/ (HFF; ID: 13495, PI: J. Lotz) between 2013 October 25 and 2014 July 1 for 164.5 orbits in total, in three filters with the Advanced Camera for Surveys (ACS; F435W, F606W, F814W) and four with the Wide Field Camera 3 (WFC3; F105W, F125W, F140W and F160W). The high-level science product released by Space Telescope Science Institute (STScI) with a pixel size of 30 mas is used in this study.
2.3 VLT/MUSE observation
Multi Unit Spectroscopic Explorer (MUSE) observations toward A2744 were taken by the GTO Program 094.A-0115 (PI: Richard) between 2014 September and 2015 October, with a 2 arcmin2 arcmin designed mosaic of pointings centred at = 00h14m20.952s and = -30∘23′53.88′′ (Mahler et al., 2018). Each pointing was observed for a total of 3.5, 4, 4 and 5h in addition to 2h at the cluster center. The publicly available data cube555http://muse-vlt.eu/science/a2744/ is adopted in this work.
2.4 ALMA continuum observations
The millimeter continuum observations are obtained from the ALMA Lensing Cluster Survey (ALCS). A2744 is observed by ALMA band 6 (Program 2018.1.00035.L, PI: Kohno; 2013.1.00999.S, PI: Bauer) which covers a frequency range with two tunings of GHz and GHz, corresponding to wavelengths of mm (Sun et al., 2022). The continuum sensitivity or say rms is 45 Jy beam-1. The data were reduced using the standard pipeline with the CASA (McMullin et al., 2007) with natural weighting, and will be described in details in S. Fujimoto et al., in prep. This leads to a synthesized beam size (FWHM) of ″, corresponding to kpc at .
3 Result and Analysis
3.1 Photometry and SED fitting
We use a box aperture along A2744-arc3 to carry out the photometry on seven broad-band HST observations (ACS/F435W, F606W, F814W and WFC3/F105W, F125W, F140W, and F160W) and three JWST NIRISS observations (NIRISS/F115W, F150W, and F200W). For each band, the length and width of the box aperture are designed to match the 2 contours of the arc, where is determined by the local sky background. A sersic modelling is performed to the nearest source in the north to exclude potential light contamination. Magnification and multi-image effects are corrected to determine the delensed flux. The median magnification along the arc is about 45 according to the Glafic model. We repeat the photometry and SED analysis using Richard et al. (2021) model, as described in Appendix A, and yield consistent results.
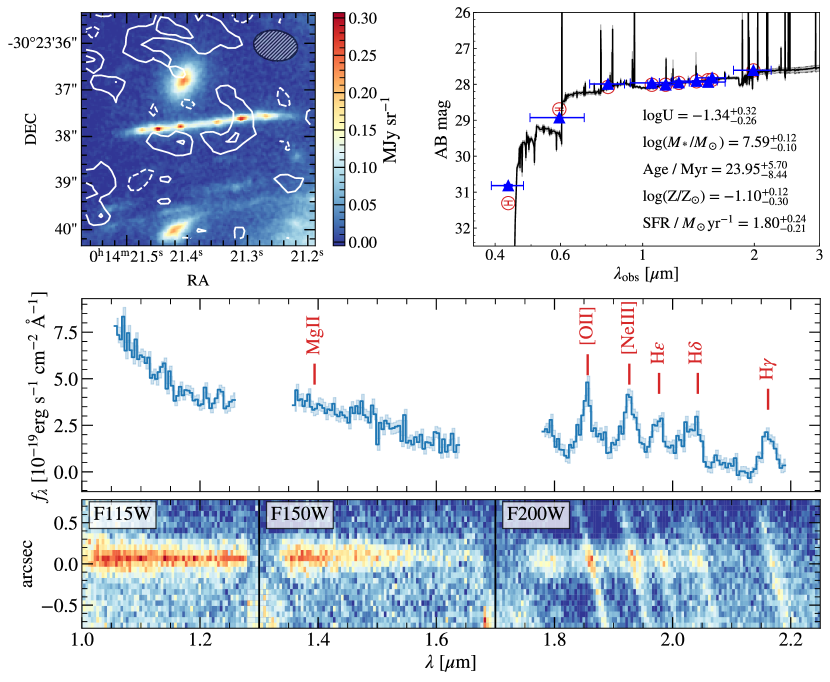
We perform SED modeling with the Bayesian code BEAGLE (Chevallard & Charlot, 2016). We assume a constant star formation history, the dust extinction curve of the Small Magellanic Cloud with the optical depth in the V band varying in the range 0 – 0.5, and the Chabrier (2003) initial mass function (IMF) with an upper limit of 300. The metallicity of the interstellar medium is kept the same as that of the stellar populations. A flat prior is applied for metallicity, , and ionization parameter (the dimensionless ratio of the number density of H-ionizing photons to that of hydrogen) in log-space, , for nebular emission (Gutkin et al., 2016). These priors are chosen on the basis of detections of the UV emission lines (see Section 4.2 for more details). A JWST NIRISS/F150W view of A2744-arc3, the SED fitting results, and the NIRISS grism 2D and 1D spectra are shown in Figure 1. It implies that A2744-arc3 is a young, low-mass galaxy with massive star formation, accompanied by blue UV slopes, strong nebular emission lines and a faint intrinsic UV luminosity. The absence of a Balmer break in the NIRISS spectrum further confirms a young stellar age. The continuum of ALMA band 6 at rest-frame 0.23 mm shows no clear detection, which indicates a 3 upper limit of far-infrared luminosity surface density assuming a dust temperature and dust emissivity spectral index . This corresponds to an upper limit of star formation rate surface density (Murphy et al., 2011). and an upper limit of dust mass surface density (da Cunha et al., 2013).
In Vanzella et al. (2022), SED analysis was performed on each mirrored clump using images from NIRISS/F115W, F150W, F200W, and HST/WFC3 F105W, F125W, F140W, F160W, along with the ground-based VLT/HAWKI Ks-band. Their derived star formation rate (SFR) is , total stellar mass of (Table 1, 3c), and age of Myr. Our derived properties are marginally consistent with theirs within . They found that these nucleated star-forming regions have optical/UV effective radii spanning 3–20 pc, bursty star formation activities () and UV slopes of , and stellar mass surface densities resembling those of local globular clusters. Our conclusion is consistent with theirs. Note that the upper limit of IR-based SFR density is smaller than that obtained from UV ( for clumps in Vanzella et al. (2022)), and this may be due to a low dust-obscured fraction of SFR in this low-mass galaxy with negligible dust content.
3.2 Source Plane Reconstruction and Spatially-resolved UV Slope
To explore the spatially-resolved UV slope variation, we construct UV slope maps in both the image plane and source plane using HST and JWST broad-band images. We recover the intrinsic source morphology by ray-tracing back the image-plane pixels on a regular source plane grid based on the corresponding deflection field (Patrício et al., 2016). More details about the selection of lensing models and the reconstruction are presented in Appendix A.
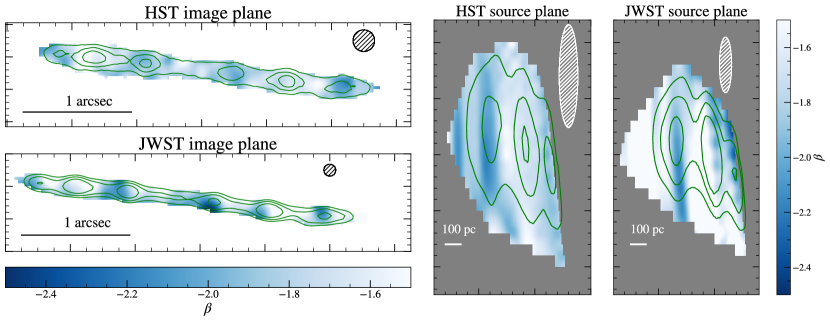
The image-plane and reconstructed source-plane UV slope maps are shown in Figure 2. The HST image plane map is constructed using PSF-matched WFC3/F105W, F125W, F140W and F160W images which trace continua at 2125, 2513, 2805, 3091 Å in the rest frame respectively. The JWST image plane map is constructed from PSF-matched NIRISS/F115W and F150W, corresponding to rest-frame continua at 2315 and 3015 Å. NIRISS/F200W is discarded to avoid potential [O II] and [O III] emission. The map constructed from JWST images exhibits more fine structures and variations, thanks to its high spatial resolution. On both image- and source-plane maps, spans from -1.5 to -2.5. The bluest resides around the compact star clumps, reaching -2.5, caused by ionizing radiation from massive star formation. On the source plane, we confirm that varies on the physical scale of pc.
4 Associated Damped Ly System with Super-solar Metallicity
The optical spectrum of A2744-arc3, as shown in Figure 3(a), is extracted from the MUSE data cube by making a 2 deblended segmentation map on a 5 arcsec 5 arcsec white-light image cutout around it. Abundant absorption and emission features are highlighted, including high-column density Ly absorption line and the multiplicity of metal absorption lines (e.g., O I , Si II , Si IV ), strong high-ionization emission lines such as C IV , HeII and O III] . We also detect a series of intervening Fe II absorbers at along the sightline. The spectral properties of the arc are reported in Table 1.
| Basic Physical Parameters | ||||||||||
|---|---|---|---|---|---|---|---|---|---|---|
| R.A. (deg) | Dec (deg) | aaRedshift determined by O I absorption. | bbPhysical parameters are derived from BEAGLE SED fitting. | Age (Myr) | SFR (/yr) | ccMagnification from the Glafic model. is the median value along the arc based on the JWST/NIRISS F115W profile. , and is the median magnification of the three mirrored clump pairs from inside (closest to the axis of symmetry/critical curve) to outside respectively. | ccMagnification from the Glafic model. is the median value along the arc based on the JWST/NIRISS F115W profile. , and is the median magnification of the three mirrored clump pairs from inside (closest to the axis of symmetry/critical curve) to outside respectively. | ccMagnification from the Glafic model. is the median value along the arc based on the JWST/NIRISS F115W profile. , and is the median magnification of the three mirrored clump pairs from inside (closest to the axis of symmetry/critical curve) to outside respectively. | ccMagnification from the Glafic model. is the median value along the arc based on the JWST/NIRISS F115W profile. , and is the median magnification of the three mirrored clump pairs from inside (closest to the axis of symmetry/critical curve) to outside respectively. | |
| 3.589089 | -30.393844 | 3.980 | 7.59 | 23.95 | 1.80 | -1.34 | 45 | 142 | 46 | 30 |
| Absorption Features | ||||||||||
| Ion | (Å) | CoG Method | Voigt Profile Fitting | |||||||
| EW (Å)ddRest-frame equivalent width of the absorbers. The uncertainties are estimated by varying the continuum level by 10%, combined with the flux uncertainties. | (N/cm2)eeColumn densities are derived assuming =10km s-1. Uncertainties are estimated by varying the doppler parameters from 5-15km s-1, combined with the uncertainties from EW measurements. | [X/H]ff[X/H] = (X/H) - (X/H)⊙. Solar (photosphere) abundances from the compilation by Asplund et al. (2009). | (N/cm2)ggColumn densities are determined by two-component Voigt profile fits to the absorption features simultaneously, assuming km s-1. We also perform Voigt profile fits using =5 and 15km s-1, and the uncertainties presented here include systematics induced by different values. | [X/H]hhMetallicities are calculated by summing over column densities of the two Voigt profiles. | ||||||
| H I | 1215.670 | - | - | - | 21.811The uncertainty is determined by varying the continuum level by 10% and the doppler parameter from 20 to 200km/s. | - | ||||
| O I | 1302.168 | 0.770.10 | 18.9 | 0.41 | 18.70.4 | 0.210.40 | ||||
| Si II22The Si II 1260 and Fe II 1608 absorption might be blended with other lines. | 1260.422 | 1.120.11 | - | - | ||||||
| 1304.370 | 0.470.10 | 17.8 | 0.74 | 18.0 | 0.81 | |||||
| Si IV | 1402.770 | 0.67 0.11 | 17.70.3 | 17.5 | ||||||
| C II33The C II 1334 absorption is saturated. | 1334.532 | 1.310.09 | - | - | - | - | ||||
| Fe II22The Si II 1260 and Fe II 1608 absorption might be blended with other lines. | 1608.451 | 0.800.08 | 18.7 | 1.400.20 | 19.1 | 1.80 | ||||
| Al II | 1670.787 | 0.720.10 | 16.40.4 | 0.150.40 | 16.4 | 0.15 | ||||
| Emission Lines | ||||||||||
| Ion | (Å) | EW (Å) | FWHM (km s-1)iiFWHMs are measured in the rest-frame relative to , using Gaussian fits and eliminating the effect of MUSE line spread function (LSF) (Bacon et al., 2017). | Flux (10-18 erg s-1 cm-2) | ||||||
| C IV | 1548.187 | 3.140.23 | 1189 | 7.80.655There might be potential C IV absorption from neutral gas blended with its emission. | ||||||
| 1550.772 | 46144The C IV 1550 emission line is likely interfered by noise. | |||||||||
| He II | 1640.420 | 1.620.09 | 1438 | 3.80.2 | ||||||
| O III] | 1660.809 | 6.250.27 | 1449 | 3.70.2 | ||||||
| 1666.150 | 1396 | 7.90.6 | ||||||||
| [O II]66Measured from the coadd of JWST/NIRISS slitless spectra as described in Section 2.1. We do not provide FWHMs due to blending effect in grism data and the low resolving power of NIRISS (R150). Flux is measured by fitting single Gaussian profiles to each emission line. | 372777The doublet of [O II] at 3726.032 and 3728.815Å cannot be distinguished. | 80.212.9 | - | 56.06.4 | ||||||
| [Ne III] | 3868.760 | 105.616.7 | - | 66.17.3 | ||||||
4.1 Metal-enriched H I gas with high column density
In Figures 3(b) and 3(c), we display the DLA H I and its associated metal absorption-line profiles, respectively. The metal lines exhibit tentative P-Cygni features. We use the Voigt profile to fit absorption lines. The Ly and Ly absorption associated with the galaxy at , depicted in Figure 3(b), indicates a H I column density of cm-2, i.e. an extremely strong damped Ly systems (ESDLA, ; Noterdaeme et al., 2014). The measurement is performed using VoigtFit (Krogager, 2018), varying from 20 to 200 km s-1. We then add the continuum uncertainty, varying the continuum level by 10%. Tentative detection of residual Ly emission in the absorption trough might imply partial DLA coverage. Nevertheless, the possibilities of contamination from foreground sources or imperfect sky subtraction cannot be excluded. The source-reconstruction in Figure 2 illustrates that the ESDLA extends over at least sub-kpc scales. Note that VLT/MUSE’s seeing leads to a spatial resolution of 0.6 arcsec, and the six clumps along it have radii of arcsec, beyond the spatially-resolving capability of MUSE. Thus, we did not show spatially resolved absorption information in this work.
We measure the gas-phase metallicity from the accurate indicator O I. Because O I and H I have similar ionization potentials and are coupled by resonant charge exchange reactions, we then have [O I/H I] [O/H]. Considering the O I 1302 line may be saturated, we estimate the metallicity from both the Voigt profile fitting and curves of growth (CoG) analysis, by varying the Doppler parameter between 5–15 km s-1, the typical values for the intrinsic doppler parameter of DLAs as concluded from high-resolution observations (e.g., Penprase et al., 2010; Bashir et al., 2019). We do not adopt large values (i.e. 20 km s-1) to avoid the underestimation of DLA metallicity without resolving the absorber subcomponent by high resolution spectroscopy (Prochaska, 2006). We list both the Voigt fitting results and the estimates from the curves of growth of metallicity in Table 1 ( km s-1). More details about the Voigt fitting results are presented in Appendix C. The estimates from O I and other metal lines such as Si II all yield a super-solar metallicity, with [O/H] ranging from 0.11 to 0.61 and [Si/H] from 0.21 to 1.1 (Si II + Si IV) respectively, corresponding to 1.29–4.07 and 1.63–12.59 . ([O/H]0.41, [Si/H]0.74, corresponding to 2.57 and 5.50 if assuming km s-1) This metallicity, as highlighted in Figure 3(d), is much higher than the prediction of the cosmic metallicity evolution of DLAs ([X/H] at , Rafelski et al. 2012), and the metal abundances of typical star-forming galaxies at , measured using nebular emission lines originated from their H II regions (e.g, [X/H] in Troncoso et al. 2014). However, we are cautious to conclude the high metallicity given the low resolution spectra (R 2000-3000) and the non-detection of weak lines such as Ni II and Zn II. We need high resolution spectra to confirm our measurements.
Additionally, we also obtain super-solar metallicity from the Fe II absorption lines. Since Fe II can be depleted onto the dust, the high abundance of Fe II indicates not much dust in both the absorbing gas and the galaxy, consistent with the ALMA millimeter continuum non-detection.
4.2 Strong narrow nebular emission – an indication of metal-poor H II region
A2744-arc3 exhibits significant high-ionization nebular emission in both optical and infrared spectra, e.g., C IV , He II , O III] and [Ne III] (see Figure 1, 3(a) and Table 1), which have been detected in nearby dwarf galaxies and metal-poor or strong LyC emitting galaxies (e.g., Erb et al., 2010; Schaerer et al., 2022b), but not typically detected in Lyman break galaxies (LBGs) (e.g., Reddy et al., 2008). These strong narrow nebular emission lines, especially He II , are believed to be tightly linked to low-metallicity galaxies with a possible contribution from Pop III-like stars (Schaerer, 2003; Patrício et al., 2016).
The line ratio between [O II] and [Ne III], two of the principal coolants in H II regions, serves as a metallicity indicator for star-forming galaxies. In A2744-arc3, we obtain ([Ne III]/[O II]), i.e. 12+, based on the empirical metallicity calibrations in Bian et al. (2018), corresponding to [O/H] = or 666Possible systematics are discussed in Appendx B, e.g., line blending and the scatters of the calibration relation. More observations are expected to confirm its metal abundance.. The mass-metallicity relation (MZR) in Sanders et al. (2021) predicts 12+(O/H)=7.70.1 for a galaxy at ; Ma et al. (2016) predicts 12+ at . These values, including our SED fitting result, are well consistent with models of He II emitters, which favour sub-solar metallicities () and young stellar ages ( years; Saxena et al. 2020). A further evidence is C IV 1548,1550 in pure emission, which is revealed uniquely in galaxies with 12+log(O/H)8 (Mingozzi et al., 2022) The line ratio of O III] 1666/He II 1640 is , inconsistent with any photoionization models powered by AGN or shocks which expect more flux in He II 1640 than in O III] 1666 ((O III] 1666/He II 1640) to ) (Allen et al., 2008; Feltre et al., 2016; Mainali et al., 2017; Senchyna et al., 2017). This disjoint favours the explanation that the nebular emission in A2744-arc3 should primarily be powered by photoionization due to massive stars (Gutkin et al., 2016).
5 Discussion
5.1 A2744-arc3 has properties similar to those local analogues
SL2S J0217 (James et al., 2014) and SBS 0335-052 (Brammer et al., 2012; Berg et al., 2018; Erb et al., 2019) at lower redshifts share similar features to A2744-arc3. Strong nebular emission lines such as C IV , He II and O III] are notable in their UV spectrum, suggesting a very high ionizing field from the low-metallicity starbursting region and young stellar populations. SBS 0335-052 is a nearby blue compact dwarf galaxy () which shows a damped Ly profile of , while SL2S J0217, a low-mass (), low-metallicity () galaxy at magnified by a foreground massive galaxy, may be characterized by a superposition of strong Ly emission and damped absorption. SL2S J0217 also shows a blue UV slope of over rest-frame 2100-2800 Å, and an ionization parameter of .
In addition, Green Pea galaxies at with extremely high degree of ionization in H II regions often present a blend of strong emission and underlying absorption (McKinney et al., 2019), with column densities ranging from , well above the LyC thick limit (e.g., Steidel et al., 2018). The presence of the DLA in the spectra of A2744-arc3 at further suggests that low-mass, low-metallicity galaxies, even at high redshift of , may commonly possess abundant neutral hydrogen gas, and the ultimate Ly and ionizing photon escape may strongly depend on geometrical effects.
5.2 The metal-enriched neutral gas reservoir around young, low-mass and metal-poor Galaxies
As discussed above, A2744-arc3 is a low-mass () galaxy with low-metallicity () H II regions, estimated from the nebular emission lines. In contrast, metal absorbers associated with the DLA shows that the HI gas around the galaxy may have the super-solar metallicity. Super-solar metallicity of the neutral gas around a low-Z, high-U and low-mass galaxy is also reported in Berg et al. (2018). The metal-enriched gas can be generated by a high efficiency in the gas cooling and enriched by the recycled inflow from the star formation (e.g., Frye et al., 2019). Due to the metal-enrichment process is rapid, the metal-enriched environment may be further enhanced by the continuous star formation in the high-redshift Universe.
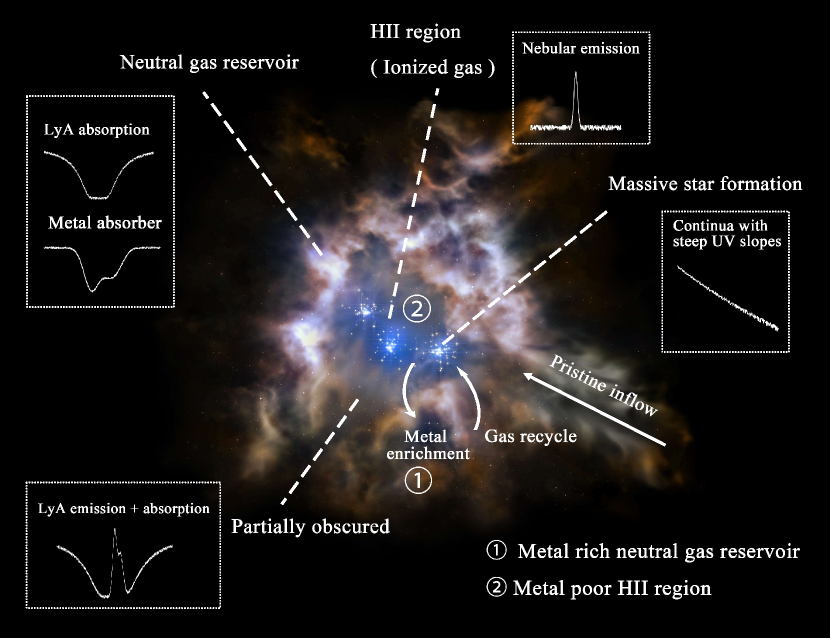
We propose a simple schematic model to explain the metallicity variances in the ISM/CGM and star-forming region at , as shown in Figure 4. Massive stars produce a hard radiation field, forming a highly ionized H II region. As mentioned above, the compact star-forming regions could be surrounded by H I clouds with varying column densities (Erb et al., 2019). DLA can be observed when the sightline is completely blocked by high column density neutral clouds, while residual Ly emission in the absorption trough can be detected in partially obscured cases. These outskirt environments could be metal-polluted by the efficient feedback from massive stars due to the high-velocity stellar wind. The metal-enriched gaseous environment could result in the presence of metal absorbers detected in Figure 3(c), sometimes with the detectable P-Cygni profiles (Erb et al., 2012). This scenario explains the tentative detection of Ly emission shown in Figure 3(b) and asymmetry profiles of metal absorbers shown in Figure 3(c).
Figure 3(d) implies that the metal abundance of A2744-arc3 is tentatively higher than that predicted by cosmic evolution of DLA metallicities. This could be resulted from strong feedback and metal-enrichment. Whether the enhanced metal enrichment is prevalent among low mass galaxies, more observations on DLA host galaxies are required.
5.3 Implications of the spatially resolved UV slope map
The ultraviolet (UV) continuum slope () is a prominent metric for properties of high-redshift galaxies. Both simulations and observations suggest that, bluer galaxies observed at have , while values as blue as can in principle be produced by a young (age years), low-metallicity () stellar population (e.g., Schaerer, 2003; Jiang et al., 2020; Topping et al., 2022). Bouwens et al. (2010) predicted that the bluest for low metallicity () starbursts is about , consistent with around the three clumps in Figure 2. This further indicates the low-metallicity nature of these early star clusters. Aside from the blue radiation from young stars, recombination continuum radiation from the ionized gas can make the UV spectrum redder. When metallicity is greater than 0.02 , the UV slope generated by the recombination continuum become greater (redder) than . With a high spatial resolution, we are able to separate the relatively red nebular continuum emission from the ionized gas from the massive star continuum (e.g., Bouwens et al., 2009) which may be consistent with what we have observed here in A2744-arc3 with JWST.
5.4 Implication of such a Low-mass, but dominating population of galaxies during Reionization
The UV luminosity of A2744-arc3 is , corresponding to 0.049 galaxies in the faint-end of the galaxy luminosity function (, Bouwens et al., 2015). Through the spatially-resolved emission and absorption lines, A2744-arc3 at provides us with a text-book example, allowing an unparalleled view of low-mass galaxies at the epoch of Reionizaiton (EoR).
Low-mass, metal-poor galaxies with hard ionizing radiation show much promise to dominate the ionizing photon budget during EoR (Wise et al., 2014), with a predicted escape fraction of (Duffy et al., 2014). Similar to lower-redshift analogs (e.g., James et al., 2014; Berg et al., 2018; Erb et al., 2019), A2744-arc3 at has shown the prevalence of a neutral gas reservoir. Given these observations, we argue that, when modelling the escape of ionizing radiation into the intergalactic medium during EoR, the neutral gas reservoir surrounding galaxies themselves (see Figure 4) should be seriously considered. Our identification of the metal-enriched, neutral-gaseous clouds might support the picture that only a small fraction of ionizing radiation of low-mass galaxies escape through the circumgalactic channels with low column density of neutral gas. With more observations of such galaxies, the statistics of the spatial variations of ionization, metallicity, HI covering fraction can be better constrained. In particular, the distribution of the optically thick HI clouds could affect the photon escape by geometrical effects. Then, these HI clouds could regulate the star formation and ionization fields through feedback. On the one hand, the outflow from stellar winds could metal enrich the clouds, and then, the clouds could further power the star formation through the recycled inflow (e.g, Frye et al., 2019). In the future, with telescopes such as the Large Ultraviolet Optical Infrared Surveyor (LUVOIR; Roberge & Moustakas 2018), we will be able to better constrain the spatial distribution of optically-thick HI absorbers at , and improve our understanding towards the UV photon escape of low-mass galaxies in the high-redshift Universe.
6 Conclusion
In this letter, we presented a detailed analysis on a strongly magnified arclet, A2744-arc3, in the Abell 2744 field with the combination of JWST/NIRISS (both imaging and grism spectroscopy), HST/WFC3, HST/ACS, VLT/MUSE and ALMA observations. The photometry and SED fitting imply that A2744-arc3 has a young age of Myr, high-ionization of of , low-mass of , and the low-metallicity H II regions of 12+, corresponding to 0.12 at .
The reconstructed source-plane images based on JWST observations provide the resolved UV slope at the spatial resolution of 100 pc. Three compact clumps show blue UV slopes, ranging approximately from to , consistent with Vanzella et al. (2022), implying young massive star clusters with bursty star formation activities.
Through absorption studies, we have identified an associated extremely strong DLA system, with . Multiple metal absorbers indicate that this DLA may be super-solar metallicity, with [O/H] varying from 0.11 to 0.61 assuming the doppler paramter in the range of 5–15 , higher than typical DLAs and LBGs at similar redshifts, indicative of strong metal-enrichment from low-mass galaxies. Additionally, the tentative P-Cygni profiles of the metal lines strengthen evidences for the young stellar feedback. To confirm our conclusion, we need higher resolution spectra with further larger wavelength coverage to measure the absorbing gas-phase metallicity. A2744-arc3 also shows strong narrow nebular emission lines of C IV , He II and O III] , indicative of a metal-poor H II region with a hard ionization field.
Combing the lower-redshift analogs SL2S J0217 at and SBS 0335-052 at , our observations of A2744-arc3 at suggest that neutral gas reservoir may be prevalent around low-mass galaxies. In our schematic model (Figure 4), massive star formation reside within a metal poor H II region. The galaxy is surrounded by a large reservoir of neutral gas with a metallicity that could reach solar metallicity. The ionizing photons could only escape through low column density channels. A2744-arc3 at provide us an excellent picture in understanding faint-end galaxies that may have played a vital role during the EoR.
Acknowledgments
Xiaojing Lin and Zheng Cai thank Eros Vanzella, Lilan Yang, Dandan Xu and Shiwu Zhang for very helpful discussions. X.L. thanks Zechang Sun for the useful tool SpecViewer (Sun, 2021). Zheng Cai, X.L., Y.W., Z.L., M.L.,& S.Z. are supported by the National Key R&D Program of China (grant no. 2018YFA0404503), the National Science Foundation of China (grant no. 12073014), and the science research grants from the China Manned Space Project with No. CMS-CSST2021-A05. F.S. acknowledges support from the NRAO Student Observing Support (SOS) award SOSPA7-022. F.S. and E.E. acknowledge funding from JWST/NIRCam contract to the University of Arizona, NAS5-02105. J.X.P. acknowledges partial support from NSF AST-2107991. D.E. acknowledges support from the Beatriz Galindo senior fellowship (BG20/00224) from the Spanish Ministry of Science and Innovation, projects PID2020-114414GB-100 and PID2020-113689GB-I00 financed by MCIN/AEI/10.13039/501100011033, project P20_00334 financed by the Junta de Andalucía, and project A-FQM-510-UGR20 of the FEDER/Junta de Andalucía-Consejería de Transformación Económica, Industria, Conocimiento y Universidades.
This work is based on observations made with the VLT/MUSE, ALMA, NASA/ESA Hubble Space Telescope and NASA/ESA/CSA James Webb Space Telescope. MUSE observations collected at the European Organisation for Astronomical Research in the Southern Hemisphere under ESO program 094.A-0115. HST and JWST data were obtained from the Mikulski Archive for Space Telescopes at the Space Telescope Science Institute, which is operated by the Association of Universities for Research in Astronomy, Inc., under NASA contract NAS 5-03127 for JWST and NAS 5–26555 for HST. The JWST observations are associated with program ERS-1324. The HST observations are associated with the Hubble Space Telescope Frontier Fields program. The authors acknowledge the GLASS team for developing their observing program with a zero-exclusive-access period. The following ALMA data is also adopted: ADS/JAO.ALMA#2018.1.00035.L and #2013.1.00999.S. ALMA is a partnership of ESO (representing its member states), NSF (USA) and NINS (Japan), together with NRC (Canada), MOST and ASIAA (Taiwan), and KASI (Republic of Korea), in cooperation with the Republic of Chile. The Joint ALMA Observatory is operated by ESO, AUI/NRAO and NAOJ. The National Radio Astronomy Observatory is a facility of the National Science Foundation operated under cooperative agreement by Associated Universities, Inc.
Some of the data presented in this paper were obtained from the Mikulski Archive for Space Telescopes (MAST) at the Space Telescope Science Institute. The specific observations analyzed can be accessed via https://doi.org/10.17909/T9KK5N (catalog 10.17909/T9KK5N) and https://doi.org/10.17909/91zv-yg35 (catalog 10.17909/91zv-yg35).
Appendix A Systematics of lensing models
A.1 Systematics on photometry
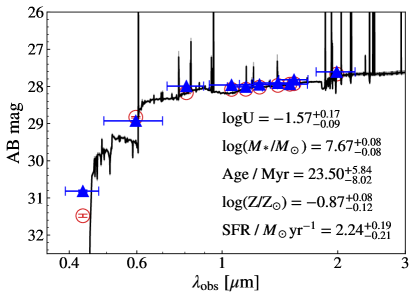
In Section 3.1 we measure the delensed-flux of A2744-arc3 using Glafic lensing model. Here we repeat the measurement using the lensing model in Richard et al. (2021, hereafter R21), and the physical properties of A2744-arc3 keeps consistent with those shown in Figure 5, with the difference of the stellar mass and age .
A.2 Systematics on source reconstruction
In Section 3.2 we adopt Glafic lensing model to reconstruct the intrinsic UV slope distribution of A2744-arc3. Limited by the lensing model, we can hardly reconstruct the three clump pairs onto the source plane simultaneously, where each pair should have perfectly overlapped. Among all publicly released lensing models, the Glafic model presents the smallest offsets between source-plane positions of these clumps pairs, yielding 0010, 0017, and 0033 from inside to outside respectively. To avoid model-dependent systematics introduced by the non-overlap, the reconstruction is only performed on the west side of the arclet that is predicted to have larger separation for the three clumps.
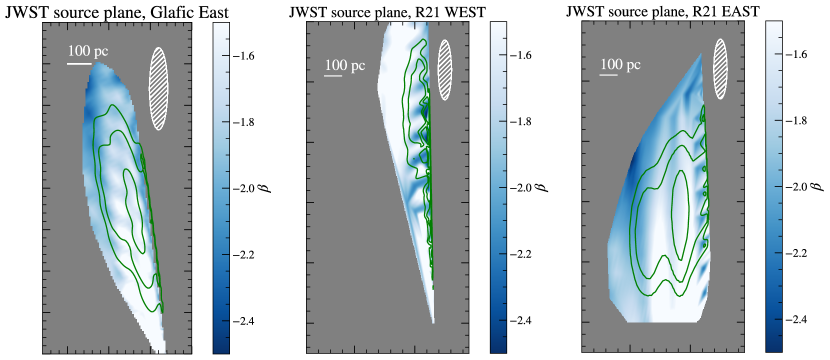
Different lensing model yields different magnification and deflection fields, which would lead to different reconstructed morphology. As discussed before, lensing models can not perfectly recover the symmetric clumps in A2744-arc3 in the source plane, and we choose Glafic because it provides smallest offsets for the reconstructed clump pairs. In Figure 6 we show the reconstructed UV slope using the R21 lensing model, which yields offsets of 012, 005 and 019 for the three clump pairs, as well as the Glafic reconstruction for the arc on the east side. Though the source-plane morphology and layout of the three clumps varies with different lensing models, the UV slope keeps within in the range to and the spatial variation keeps on scales of 100 pc.
Appendix B Sysematics on metallicity
In Section 4.2 we estimate the H II region metallicty of A2744-arc3 using the [Ne III]/[O II]-metallicity callibration relation in Bian et al. (2018): . Due to the low resolving power of JWST/NIRISS (), [Ne III] at 3869Å is blended with He I+ H8 at 3889Å (e.g., Schaerer et al., 2022a), so that the true [Ne III]/[O II] ratio would be lower and hence the metallicty a bit higher than the [Ne III]/[O II]-derived one. But this won’t change the metal-poor nature of A2744-arc3. Despite large scatters in the [Ne III]/[O II]-metalicity relation (e.g., Schaerer et al., 2022a) concluded from various galaxies at , recent observations show that the metalicity of high-redshift galaxies (Sanders et al., 2020; Curti et al., 2022) tends to be consistent with or smaller than the prediction from the empirical calibration in Bian et al. (2018). The latter puts A2744-arc3 to the lower metallicty end. All these facts, along with the strong UV emission lines, support that A2744-arc3 should possess a metal-poor H II region. A more precise measurement of its metallicity is expected in the future with high resolution spectroscopy.
Appendix C Two-component Voigt profile fit
In Figure 7 we present the results of simultaneous Voigt profile fits to Al II 1670, Fe II 1608, O I 1302, Si II 1526 and Si IV 1402 absorbers, assuming each absorber has two components. We perform the fits by fixing the doppler parameter to 5, 10, 15 as well as 30km s-1. The column densities and metallicities listed in Table 1 are concluded from estimates with =5, 10 and 15km s-1 , which is the typical values for metal absorbers seen in high-resolution spectra (Penprase et al., 2010). However, as discussed in Section 4, a possible large , e.g., 30km s-1, due to possible unresolved sub-components of the absorption profile in low-resolution spectra, would yield a lower column density and thus lower metallicity.
References
- Allen et al. (2008) Allen, M. G., Groves, B. A., Dopita, M. A., Sutherland, R. S., & Kewley, L. J. 2008, ApJS, 178, 20, doi: 10.1086/589652
- Asplund et al. (2009) Asplund, M., Grevesse, N., Sauval, A. J., & Scott, P. 2009, ARA&A, 47, 481, doi: 10.1146/annurev.astro.46.060407.145222
- Atek et al. (2015) Atek, H., Richard, J., Jauzac, M., et al. 2015, ApJ, 814, 69, doi: 10.1088/0004-637X/814/1/69
- Bacon et al. (2017) Bacon, R., Conseil, S., Mary, D., et al. 2017, A&A, 608, A1, doi: 10.1051/0004-6361/201730833
- Bashir et al. (2019) Bashir, W., Zafar, T., Khan, F. M., & Chishtie, F. 2019, New A, 66, 9, doi: 10.1016/j.newast.2018.07.001
- Berg et al. (2018) Berg, D. A., Erb, D. K., Auger, M. W., Pettini, M., & Brammer, G. B. 2018, ApJ, 859, 164, doi: 10.3847/1538-4357/aab7fa
- Bergamini et al. (2022) Bergamini, P., Acebron, A., Grillo, C., et al. 2022, arXiv e-prints, arXiv:2207.09416. https://arxiv.org/abs/2207.09416
- Bian et al. (2018) Bian, F., Kewley, L. J., & Dopita, M. A. 2018, ApJ, 859, 175, doi: 10.3847/1538-4357/aabd74
- Bouwens et al. (2016) Bouwens, R. J., Smit, R., Labbé, I., et al. 2016, ApJ, 831, 176, doi: 10.3847/0004-637X/831/2/176
- Bouwens et al. (2009) Bouwens, R. J., Illingworth, G. D., Franx, M., et al. 2009, ApJ, 705, 936, doi: 10.1088/0004-637X/705/1/936
- Bouwens et al. (2010) Bouwens, R. J., Illingworth, G. D., Oesch, P. A., et al. 2010, ApJ, 708, L69, doi: 10.1088/2041-8205/708/2/L69
- Bouwens et al. (2015) —. 2015, ApJ, 803, 34, doi: 10.1088/0004-637X/803/1/34
- Brammer et al. (2012) Brammer, G. B., Sánchez-Janssen, R., Labbé, I., et al. 2012, ApJ, 758, L17, doi: 10.1088/2041-8205/758/1/L17
- Bushouse et al. (2022) Bushouse, H., Eisenhamer, J., Dencheva, N., et al. 2022, spacetelescope/jwst: JWST 1.6.2, 1.6.2, Zenodo, Zenodo, doi: 10.5281/zenodo.6984366
- Chabrier (2003) Chabrier, G. 2003, PASP, 115, 763, doi: 10.1086/376392
- Chen et al. (2022) Chen, Z., Stark, D. P., Endsley, R., et al. 2022, arXiv e-prints, arXiv:2207.12657. https://arxiv.org/abs/2207.12657
- Chevallard & Charlot (2016) Chevallard, J., & Charlot, S. 2016, MNRAS, 462, 1415, doi: 10.1093/mnras/stw1756
- Chisholm et al. (2018) Chisholm, J., Gazagnes, S., Schaerer, D., et al. 2018, A&A, 616, A30, doi: 10.1051/0004-6361/201832758
- Curti et al. (2022) Curti, M., D’Eugenio, F., Carniani, S., et al. 2022, arXiv e-prints, arXiv:2207.12375. https://arxiv.org/abs/2207.12375
- da Cunha et al. (2013) da Cunha, E., Groves, B., Walter, F., et al. 2013, ApJ, 766, 13, doi: 10.1088/0004-637X/766/1/13
- Duffy et al. (2014) Duffy, A. R., Wyithe, J. S. B., Mutch, S. J., & Poole, G. B. 2014, MNRAS, 443, 3435, doi: 10.1093/mnras/stu1328
- Erb et al. (2019) Erb, D. K., Berg, D. A., Auger, M. W., et al. 2019, ApJ, 884, 7, doi: 10.3847/1538-4357/ab3daf
- Erb et al. (2010) Erb, D. K., Pettini, M., Shapley, A. E., et al. 2010, ApJ, 719, 1168, doi: 10.1088/0004-637X/719/2/1168
- Erb et al. (2012) Erb, D. K., Quider, A. M., Henry, A. L., & Martin, C. L. 2012, ApJ, 759, 26, doi: 10.1088/0004-637X/759/1/26
- Feltre et al. (2016) Feltre, A., Charlot, S., & Gutkin, J. 2016, MNRAS, 456, 3354, doi: 10.1093/mnras/stv2794
- Flewelling et al. (2020) Flewelling, H. A., Magnier, E. A., Chambers, K. C., et al. 2020, ApJS, 251, 7, doi: 10.3847/1538-4365/abb82d
- Frye et al. (2019) Frye, B. L., Bowen, D. V., Tripp, T. M., et al. 2019, ApJ, 872, 129, doi: 10.3847/1538-4357/ab0083
- Gronke et al. (2017) Gronke, M., Dijkstra, M., McCourt, M., & Oh, S. P. 2017, A&A, 607, A71, doi: 10.1051/0004-6361/201731013
- Gutkin et al. (2016) Gutkin, J., Charlot, S., & Bruzual, G. 2016, MNRAS, 462, 1757, doi: 10.1093/mnras/stw1716
- James et al. (2014) James, B. L., Aloisi, A., Heckman, T., Sohn, S. T., & Wolfe, M. A. 2014, ApJ, 795, 109, doi: 10.1088/0004-637X/795/2/109
- Jiang et al. (2020) Jiang, L., Cohen, S. H., Windhorst, R. A., et al. 2020, ApJ, 889, 90, doi: 10.3847/1538-4357/ab64ea
- Kawamata et al. (2016) Kawamata, R., Oguri, M., Ishigaki, M., Shimasaku, K., & Ouchi, M. 2016, ApJ, 819, 114, doi: 10.3847/0004-637X/819/2/114
- Krogager (2018) Krogager, J.-K. 2018, arXiv e-prints, arXiv:1803.01187. https://arxiv.org/abs/1803.01187
- Ma et al. (2016) Ma, X., Hopkins, P. F., Faucher-Giguère, C.-A., et al. 2016, MNRAS, 456, 2140, doi: 10.1093/mnras/stv2659
- Mahler et al. (2018) Mahler, G., Richard, J., Clément, B., et al. 2018, MNRAS, 473, 663, doi: 10.1093/mnras/stx1971
- Mainali et al. (2017) Mainali, R., Kollmeier, J. A., Stark, D. P., et al. 2017, ApJ, 836, L14, doi: 10.3847/2041-8213/836/1/L14
- McKinney et al. (2019) McKinney, J. H., Jaskot, A. E., Oey, M. S., et al. 2019, ApJ, 874, 52, doi: 10.3847/1538-4357/ab08eb
- McMullin et al. (2007) McMullin, J. P., Waters, B., Schiebel, D., Young, W., & Golap, K. 2007, in Astronomical Society of the Pacific Conference Series, Vol. 376, Astronomical Data Analysis Software and Systems XVI, ed. R. A. Shaw, F. Hill, & D. J. Bell, 127
- Mingozzi et al. (2022) Mingozzi, M., James, B. L., Arellano-Córdova, K. Z., et al. 2022, arXiv e-prints, arXiv:2209.09047. https://arxiv.org/abs/2209.09047
- Murphy et al. (2011) Murphy, E. J., Condon, J. J., Schinnerer, E., et al. 2011, ApJ, 737, 67, doi: 10.1088/0004-637X/737/2/67
- Noterdaeme et al. (2014) Noterdaeme, P., Petitjean, P., Pâris, I., et al. 2014, A&A, 566, A24, doi: 10.1051/0004-6361/201322809
- Oguri (2010) Oguri, M. 2010, PASJ, 62, 1017, doi: 10.1093/pasj/62.4.1017
- Patrício et al. (2016) Patrício, V., Richard, J., Verhamme, A., et al. 2016, MNRAS, 456, 4191, doi: 10.1093/mnras/stv2859
- Penprase et al. (2010) Penprase, B. E., Prochaska, J. X., Sargent, W. L. W., Toro-Martinez, I., & Beeler, D. J. 2010, ApJ, 721, 1, doi: 10.1088/0004-637X/721/1/1
- Prochaska (2006) Prochaska, J. X. 2006, ApJ, 650, 272, doi: 10.1086/507126
- Rafelski et al. (2012) Rafelski, M., Wolfe, A. M., Prochaska, J. X., Neeleman, M., & Mendez, A. J. 2012, ApJ, 755, 89, doi: 10.1088/0004-637X/755/2/89
- Ramambason et al. (2020) Ramambason, L., Schaerer, D., Stasińska, G., et al. 2020, A&A, 644, A21, doi: 10.1051/0004-6361/202038634
- Reddy et al. (2008) Reddy, N. A., Steidel, C. C., Pettini, M., et al. 2008, ApJS, 175, 48, doi: 10.1086/521105
- Richard et al. (2021) Richard, J., Claeyssens, A., Lagattuta, D., et al. 2021, A&A, 646, A83, doi: 10.1051/0004-6361/202039462
- Rigby et al. (2022) Rigby, J., Perrin, M., McElwain, M., et al. 2022, arXiv e-prints, arXiv:2207.05632. https://arxiv.org/abs/2207.05632
- Roberge & Moustakas (2018) Roberge, A., & Moustakas, L. A. 2018, Nature Astronomy, 2, 605, doi: 10.1038/s41550-018-0543-8
- Sanders et al. (2020) Sanders, R. L., Shapley, A. E., Reddy, N. A., et al. 2020, MNRAS, 491, 1427, doi: 10.1093/mnras/stz3032
- Sanders et al. (2021) Sanders, R. L., Shapley, A. E., Jones, T., et al. 2021, ApJ, 914, 19, doi: 10.3847/1538-4357/abf4c1
- Saxena et al. (2020) Saxena, A., Pentericci, L., Mirabelli, M., et al. 2020, A&A, 636, A47, doi: 10.1051/0004-6361/201937170
- Schaerer (2003) Schaerer, D. 2003, A&A, 397, 527, doi: 10.1051/0004-6361:20021525
- Schaerer et al. (2022a) Schaerer, D., Marques-Chaves, R., Barrufet, L., et al. 2022a, arXiv e-prints, arXiv:2207.10034. https://arxiv.org/abs/2207.10034
- Schaerer et al. (2022b) Schaerer, D., Izotov, Y. I., Worseck, G., et al. 2022b, A&A, 658, L11, doi: 10.1051/0004-6361/202243149
- Schlawin et al. (2020) Schlawin, E., Leisenring, J., Misselt, K., et al. 2020, AJ, 160, 231, doi: 10.3847/1538-3881/abb811
- Senchyna et al. (2017) Senchyna, P., Stark, D. P., Vidal-García, A., et al. 2017, MNRAS, 472, 2608, doi: 10.1093/mnras/stx2059
- Smit et al. (2017) Smit, R., Swinbank, A. M., Massey, R., et al. 2017, MNRAS, 467, 3306, doi: 10.1093/mnras/stx245
- Stark et al. (2014) Stark, D. P., Richard, J., Siana, B., et al. 2014, MNRAS, 445, 3200, doi: 10.1093/mnras/stu1618
- Stark et al. (2017) Stark, D. P., Ellis, R. S., Charlot, S., et al. 2017, MNRAS, 464, 469, doi: 10.1093/mnras/stw2233
- Steidel et al. (2018) Steidel, C. C., Bogosavljević, M., Shapley, A. E., et al. 2018, ApJ, 869, 123, doi: 10.3847/1538-4357/aaed28
- Sun et al. (2022) Sun, F., Egami, E., Fujimoto, S., et al. 2022, ApJ, 932, 77, doi: 10.3847/1538-4357/ac6e3f
- Sun (2021) Sun, Z. 2021, SpecViewer, https://github.com/ZechangSun/SpecViewer, GitHub
- Topping et al. (2022) Topping, M. W., Stark, D. P., Endsley, R., et al. 2022, arXiv e-prints, arXiv:2208.01610. https://arxiv.org/abs/2208.01610
- Treu et al. (2022) Treu, T., Roberts-Borsani, G., Bradac, M., et al. 2022, ApJ, 935, 110, doi: 10.3847/1538-4357/ac8158
- Troncoso et al. (2014) Troncoso, P., Maiolino, R., Sommariva, V., et al. 2014, A&A, 563, A58, doi: 10.1051/0004-6361/201322099
- Vanzella et al. (2022) Vanzella, E., Castellano, M., Bergamini, P., et al. 2022, arXiv e-prints, arXiv:2208.00520. https://arxiv.org/abs/2208.00520
- Wise et al. (2014) Wise, J. H., Demchenko, V. G., Halicek, M. T., et al. 2014, MNRAS, 442, 2560, doi: 10.1093/mnras/stu979
- Witstok et al. (2021) Witstok, J., Smit, R., Maiolino, R., et al. 2021, MNRAS, 508, 1686, doi: 10.1093/mnras/stab2591
- Wu et al. (2022) Wu, Y., Cai, Z., Sun, F., et al. 2022, arXiv, arXiv:2208.08473. https://arxiv.org/abs/2208.08473
- Yang et al. (2014) Yang, H., Wang, J., Zheng, Z.-Y., et al. 2014, ApJ, 784, 35, doi: 10.1088/0004-637X/784/1/35
- Yang et al. (2017) Yang, H., Malhotra, S., Gronke, M., et al. 2017, ApJ, 844, 171, doi: 10.3847/1538-4357/aa7d4d