Stellar Bars in Isolated Gas-Rich Spiral Galaxies Do Not Slow Down
Abstract
Elongated bar-like features are ubiquitous in galaxies, occurring at the centers of approximately two-thirds of spiral disks in the nearby Universe. Due to gravitational interactions between the bar and the other components of galaxies, it is expected that angular momentum and matter will redistribute over long (Gyr) timescales in barred galaxies. Previous work ignoring the gas phase of galaxies has conclusively demonstrated that bars should slow their rotation over time due to their interaction with dark matter halos. We have performed a simulation of a Milky Way-like galactic disk hosting a strong bar which includes a state-of-the-art model of the interstellar medium and a live dark matter halo. In this simulation the bar pattern does not slow down over time, and instead remains at a stable, constant rate of rotation. This behavior has been observed in previous simulations using more simplified models for the interstellar gas, but the apparent lack of secular evolution has remained unexplained. We find that the presence of the gas phase arrests the process by which the dark matter halo slows down a bar, a phenomenon we term bar locking. This locking is responsible for stabilizing the bar pattern speed. We find that in a Milky Way-like disk, a gas fraction of only about 5% is necessary for this mechanism to operate. Our result naturally explains why nearly all observed bars rotate rapidly and is especially relevant for our understanding of how the Milky Way arrived at its present state.
1 Introduction
Approximately two-thirds of spiral disks host an elongated bar-like feature at their centers (Eskridge et al., 2000; Menéndez-Delmestre et al., 2007), including our own Milky Way (Johnson, 1957; Blitz & Spergel, 1991). The ubiquity of bars is not difficult to explain, since stellar disks simulated in isolation almost always form bar-like structures (Hohl, 1971). Several studies have shown that a hot, centrally concentrated mass distribution, such as a stellar bulge or dark matter halo, acts to stabilize stellar disks against bar formation (e.g., Ostriker & Peebles, 1973; Hohl, 1976).
It is more difficult to reconcile numerical simulations with the observed pattern speeds of extragalactic bars. Currently, the best technique for measuring the pattern speeds of individual galaxies is the Tremaine-Weinberg method (Tremaine & Weinberg, 1984a; Corsini, 2011). This approach has recently been applied to samples of galaxies from the MaNGA survey (Guo et al., 2019; Garma-Oehmichen et al., 2020) and CALIFA survey (Aguerri et al., 2015). These studies confirm what was found in earlier works, that nearly all extragalactic bars are fast rotators (i.e., they rotate close to their maximum rotation rate).
This is a problem for theoretical simulations, for which there is ample evidence that galactic bars should resonantly interact with the dark matter halo, causing the bar to slow down over time (Combes & Sanders, 1981; Hernquist & Weinberg, 1992; Debattista & Sellwood, 2000; Athanassoula & Misiriotis, 2002; Athanassoula, 2002, 2003; O’Neill & Dubinski, 2003; Holley-Bockelmann et al., 2005; Martinez-Valpuesta et al., 2006; Weinberg & Katz, 2007; Dubinski et al., 2009). The physical mechanism of this interaction can be understood as an angular form of dynamical friction between the bar and the dark matter halo. While studied in detail for the bar (Tremaine & Weinberg, 1984b; Weinberg, 1985), this process is generic for any non-axisymmetric disturbance (Lynden-Bell & Kalnajs, 1972). (For an old but still useful review of bar dynamics, see Sellwood & Wilkinson (1993).)
Bar pattern speeds are usually measured using the parameter , where is the corotation radius and is the bar length.111The radius of corotation is defined for circular orbits as the radius at which the orbital frequency is equal to the pattern speed, , of a given non-axisymmetric feature. In a galaxy with a constant circular velocity , it is given by . Bars with are considered “fast rotators” while bars with are considered “slow rotators” (Debattista & Sellwood, 2000). Bars with are not thought to be stable (Contopoulos, 1980). Observational estimates of the pattern speeds of bars indicate that nearly all galaxies have (Corsini, 2011; Aguerri et al., 2015; Guo et al., 2019; Garma-Oehmichen et al., 2020). We note that Font et al. (2017) argue that the pattern speed should be measured relative to a characteristic angular velocity of the outer disk.
While the fact that a bar is slowed down by a dark matter halo is well-understood theoretically, this is not the case for the interaction between a bar and a gaseous disk. Some argue that the gas disk should slow down the bar more (Athanassoula, 2003), while others argue that the tendency of the bar to drive gas inwards means the bar should speed up due to the effect of the gas disk (Athanassoula et al., 2013; Athanassoula, 2014). Since the gas phase typically contributes only about of the mass of a galaxy at the present day, one might naively expect it to have a subdominant effect on the bar. However, because gas is collisional, it can participate in non-resonant angular momentum exchange with the bar (Hopkins & Quataert, 2011). Thus, numerical work has shown that the gas phase can have a stronger influence on a bar than its contribution to the mass of a galaxy would suggest (e.g., Villa-Vargas et al., 2010; Athanassoula et al., 2013).
In the last decade, stellar bars have been studied mainly in the context of the instability processes that lead to their formation and their ability to drive gas toward the galaxy center and contribute to the formation of supermassive black holes (SMBH). The primary interest of these studies mainly was in the loss of angular momentum of the gas and the associated gaseous flow down to the inner disk, possibly forming a central mass concentration (Villa-Vargas et al., 2010), and fueling the central SMBH (e.g. Shlosman et al., 1989, 1990). A revisit of the more general problem of galactic bar properties and formation, including the case of disk galaxies with very large gas fraction is timely since it is clear now that galactic disks show massive bars already at redshift (Guo et al., 2022). At that time the universe was 2.5 billion year old and galaxies might have as high gas fraction as 80% (Tacconi et al., 2020). Furthermore, unlike nearby disk galaxies, the high-redshift disks also continuously accrete cold gas from the cosmic web, making the formation, stability and evolution of non-axisymmetric features a key question to address since they can play a fundamental role in the more general problem of disk galaxy evolution.
We have performed a simulation of a disk galaxy using the finite-volume, gravito-hydrodynamics code AREPO (Springel, 2010). We use the galaxy formation model Stars and MUltiphase Gas in GaLaxiEs (SMUGGLE; Marinacci et al., 2019). This disk galaxy exhibits almost no evolution in the bar pattern speed over several Gyr when the gas phase is accounted for and robustly modeled. This behavior has been observed in previous works (Friedli & Benz, 1993; Berentzen et al., 2007; Villa-Vargas et al., 2009, 2010; Athanassoula, 2014). We propose a new physical explanation for this stable behavior.
In particular, we find that the presence of a gas phase in a barred galaxy can arrest the process by which the dark matter halo brakes the bar. The constant positive torque on the bar by the gas causes the bar’s resonance to reside in regions which have become depopulated. In the halo wake picture, this is equivalent to no new material being available to reinforce the wake. We show that this occurs in a Milky Way-like disk with gas fractions as low as about .
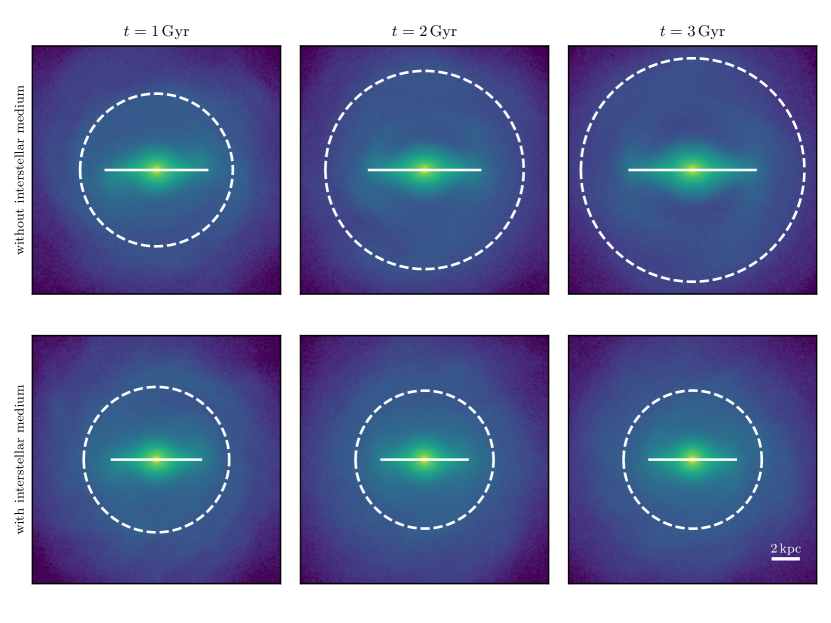
We show stellar mass distributions of our barred galaxy in a case with and without gas in Fig. 1. We see that the bar grows longer and stronger without gas (bar length shown as a white bar), while it remains at approximately the same length and strength when gas is included. As the bar without gas slows down, the corotation radius (white dashed circle) grows larger with time.
2 Methods
2.1 Initial Conditions
The initial setup of the galactic disk used in this work follows closely the GALAKOS model (D’Onghia & L. Aguerri, 2020), which uses a modified version of the MakeNewDisk code (Springel et al., 2005). The GALAKOS model has three components - a radially exponential and vertically isothermal stellar disk, and a stellar bulge and dark matter halo following a Hernquist profile (Hernquist, 1990). All -body runs in this work used the same setup parameters as the GALAKOS disk, more details of which can be found in the original paper.
The addition of the gas phase was done as follows. The version of MakeNewDisk used for the original GALAKOS model can generate a gas disk which is radially exponential and in vertical gravito-hydrodynamic balance. We modified the radial profile of this code in order to allow us to generate a disk with a constant surface density within some cut-off radius, and then exponentially declining beyond that radius with the scale-length of the stellar disk. Our fiducial model used an initial surface density of and a cut-off radius of . This corresponds to an initial gas fraction of . The initial gas disk is generated with a temperature of and solar metallicity.
After generating the gaseous disk in this way, we stitched the gas disk together with the GALAKOS -body disk (and bulge and dark matter halo) after the GALAKOS disk has been allowed to evolve for . The purpose of allowing the GALAKOS disk to evolve first for a short period of time is to allow for the bar to form unimpacted by the presence of the gas. We found that including the gas before the bar has formed disrupts the formation of the bar, as has been seen previously (e.g., Athanassoula et al., 2013). Throughout this work, we consider for the -body run to be the time at which we added the gas phase for the SMUGGLE run (i.e., we ignore the first of evolution of the -body disk when the bar is forming).
We made one additional modification when stitching the gas disk together with the -body disk - we created a hole within the central of the gas disks. This hole guards against an initial dramatic infall of gas within the bar region, which we found to destroy the bar. It is not uncommon for observed barred galaxies to have gas deficits in the bar region (though not in the very center; Sellwood & Wilkinson, 1993). Therefore, our practice of allowing the gas distribution to have a hole in the central region is consistent with our choice to begin the simulations with a bar already formed. In this manner, we are able to study the ensuing self-consistent interaction between the bar and the gas, but of course we are unable to explore the origin of bars in the presence of the gas.
Our method for initializing gas was arrived at after numerous attempts to include enough gas in the simulation to be compatible with the Milky Way while also not destroying the bar. For example, we tried evolving an exponential gas disk adiabatically with the barred disk (i.e., no cooling, star formation, or feedback). Because there is no mechanism to remove gas from the central region, a large, highly pressurized pileup of gas forms in the center.222 We noticed that the bar slows down in this adiabatic model which lacks a mechanism to remove gas from the central region. Berentzen et al. (2007) also noted slowdown behavior in models which lacked central gas removal. It appears that gas removal from the center (in our model due to star formation) is necessary to stabilize a bar’s pattern speed. We then turned on the full SMUGGLE model. As a result, there is a sudden collapse of gas to the center as pressure support is lost due to cooling and star formation. This abrupt change in the potential destroys the bar.
We don’t believe our method is the only nor even the best way to include gas. One advantage of our method, though, is that it approximates the expectation that in the bar region the gas surface density should be significantly reduced (e.g. Sellwood & Wilkinson, 1993)
We used a mass resolution of for the baryonic components (initial stellar disk, stellar bulge, and gas) and a mass resolution of for the dark matter halo. This mass resolution is closest to “level 3” in the AURIGA simulations (Grand et al., 2017). This corresponds to approximately particles in the stellar disk, in the bulge, in the gas disk, and in the dark matter halo. We used a softening length of for all collisionless components. This softening length is smaller than used in the original GALAKOS model ( in their model, but when scaled to our mass resolution). Our smaller softening length is consistent with other resolved ISM models (Hopkins et al., 2018; Marinacci et al., 2019). However, as a consistency check, we reran our fiducial SMUGGLE run with softening and found no difference in the pattern speed evolution of the bar. For the gas component, the softening length is fully adaptive with a softening factor of (e.g., Weinberger et al., 2020). Snapshots were saved at equal intervals of in the time units of the simulation, .
Our setup is initially out of equilibrium, but we found that after about , the system has settled into a roughly steady-state configuration and initial transients appear not to affect the results after this point. The constant surface density of the initial gas disk is important for ensuring that the gas disk is dense enough in order for comparisons to real galaxies to be appropriate.
2.2 Numerical Model
We use the Stars and MUltiphase Gas in GaLaxiEs (SMUGGLE) model (Marinacci et al., 2019) implemented within the moving-mesh, finite-volume hydrodynamics and gravity code AREPO (Springel, 2010). The SMUGGLE model additionally includes radiative heating and cooling, star formation, and stellar feedback. Explicit gas cooling and heating of the multi-phase interstellar medium is implemented, covering temperature ranges between and .
Star formation occurs in cells above a density threshold () with a star-formation efficiency of . Star formation converts gas cells into star particles which represent single stellar populations with a Chabrier initial mass function (Chabrier, 2003). For each star particle, the deposition of energy, momentum, mass, and metals from stellar winds and supernovae is modeled. Photo-ionization and radiation pressure are handled using an approximate treatment. A more detailed description of this model can be found in the flagship SMUGGLE paper (Marinacci et al., 2019). A pedagological review of cosmological simulations of galaxy formation can be found in Vogelsberger et al. (2020).
We used the fiducial model parameters, except that we increased the number of effective neighbors for the deposition of feedback from to . We found that a lower value of resulted in inefficient photo-ionization feedback since the photo-ionizing budget had not been exhausted after deposition into neighboring cells. We also employed an updated version of SMUGGLE using a new mechanical feedback routine similar to the one described in Hopkins et al. (2018). This updated routine is a tensor renormalization which ensures linear and angular momentum conservation to machine precision.
In addition to the SMUGGLE model, we considered a simpler model of the interstellar medium based upon Springel & Hernquist (2003). In this approach, the multiphase nature of the interstellar medium is described in a subgrid manner by allowing each resolution element to have a “cold” and “hot” component, with the equation of state of the gas suitably modified. Gas is allowed to interchange between the cold and hot components through processes such as cooling and stellar feedback. Cold gas is allowed to undergo star formation. We refer to this model as the smooth interstellar medium model, and it is described in more detail in Marinacci et al. (2019).
2.3 Bar Analysis
The analysis of various bar properties is performed as follows. First, the pattern speed is measured from the angle of the second Fourier component. We measured the second Fourier component by computing,
| (1) |
where and are the mass and azimuthal angle of each particle, respectively. We computed and in cylindrical bins of width from radii of to . We defined the angle of the bar to be half the angle of the complex number as measured in the bin extending from a radius of to . After correcting for the periodicity of , we measured the pattern speed as one-half the two-sided finite gradient of as a function of time. We note that using the second Fourier mode is a blunt tool, discussed in Petersen et al. (2019a).
In order to compute other properties of the bar, it is necessary to decompose the disk into a barred and unbarred component. We achieved this by following closely the methods described in Petersen et al. (2016, 2021). Our implementation is described in more detail in Appendix A. After the disk has been decomposed into a trapped and untrapped component, we measured the bar length as being the radius which encapsulates of the stars identified as being trapped in the bar.
To compute torques we used the tree algorithm in MakeNewDisk (Springel et al., 2005) customized to be accessible from Python using Cython. This algorithm is based on the TREESPH code (Hernquist & Katz, 1989). We constructed a tree with an opening angle of using only the star particles identified as being trapped in the bar. We then queried the tree at the locations of all resolution elements in the other components and computed the torque of the bar on such components. The torque on the bar by the other components is simply the negative of the torque on the other components by the bar. A similar analysis using basis function expansions was performed in Petersen et al. (2019b).
2.4 Plotting Details
We saved snapshots in intervals of in the time units of the simulation, , which is very nearly equal to (it is ). Therefore, throughout this work we referred to the native code time unit as Gyr. None of our results are sensitive to this choice. We applied a Savitzky-Golay filter (Savitzky & Golay, 1964) as implemented in scipy using a window length of and polynomial order of to the plot of torques (Fig. 2 and Fig. 9) and angle differences (Fig. 5) in order to remove some numerical noise.
3 Results
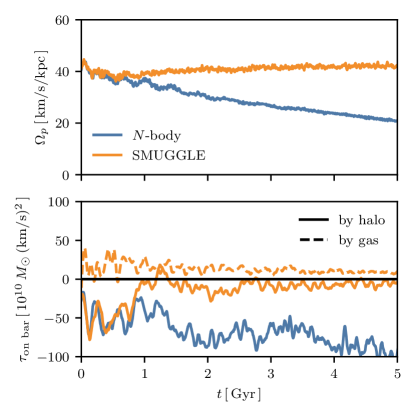
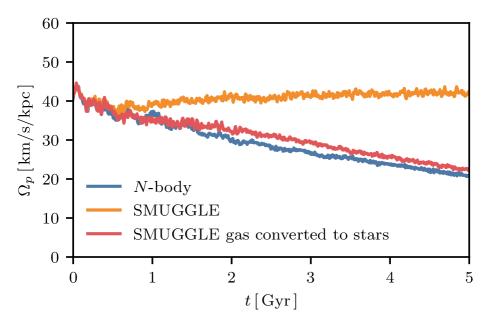
We present the time evolution of different bar properties in Fig. 2. In the upper panel, we show the pattern speed over time in the -body (blue) and SMUGGLE (orange) runs. The pattern speed in the -body case slows down while the pattern speed in the SMUGGLE case remains roughly constant. The slowing down of the pattern speed in the -body case is consistent with a long line of numerical research on bars in -body simulations (Hernquist & Weinberg, 1992; Debattista & Sellwood, 2000; Athanassoula & Misiriotis, 2002; Athanassoula, 2002, 2003; O’Neill & Dubinski, 2003; Holley-Bockelmann et al., 2005; Martinez-Valpuesta et al., 2006; Weinberg & Katz, 2007; Dubinski et al., 2009).
However, in the SMUGGLE case the pattern speed remains constant. After the first Gyr of evolution, we find that the pattern speed increases by only over the next , compared to a decrease in the pattern speed for the -body run over the same interval.
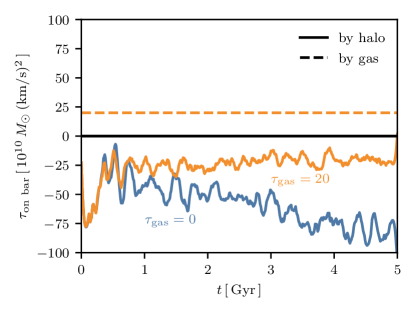
The bottom panel of Fig. 2 shows the torque exerted on the bar by different components. The solid lines indicate the torque on the bar by the dark matter halo, whereas the dashed line is the torque on the bar by the gas phase. In the -body case, the halo exerts a steady negative torque on the bar, with an average torque from to of in units of . The halo in the SMUGGLE case exerts a similar negative torque on the bar in the first Gyr of evolution, but after that the halo exerts a much weaker torque on the bar, averaging only in the same units and over the same time interval. The gas in the SMUGGLE case exerts a steady positive torque averaging over in the same units.
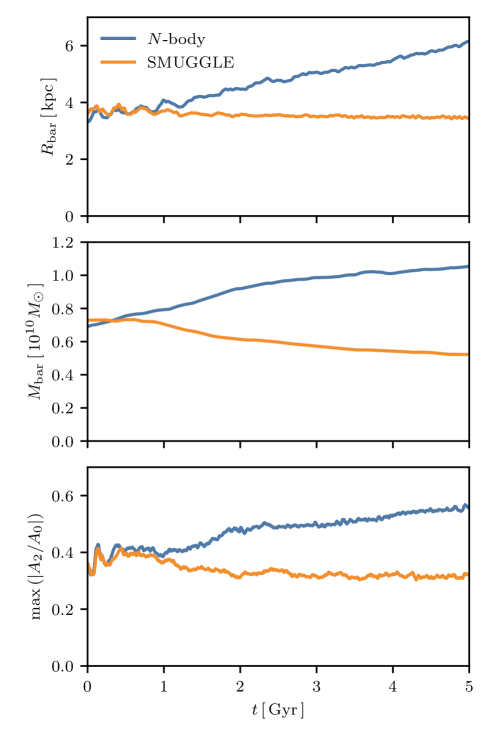
As we saw qualitatively in Fig. 1, the upper panel of Fig. 3 shows that the length of the bar in the -body case grows over time while it remains roughly constant in the SMUGGLE case. This is also consistent with previous numerical work, which found that bars tend to grow as they slow down and the radius of corotation increases (Debattista & Sellwood, 2000; Athanassoula, 2003). The middle panel of Fig. 3 shows the mass of the bar. As the -body bar slows down and lengthens, it also grows in mass. The SMUGGLE bar, however, loses mass over time. This indicates a change in the bar’s angular momentum without a change in pattern speed, and highlights the fact that bars are not solid bodies and can respond to external torques through mass redistribution.
The time evolution of the bar strength, defined as the maximum of as a function of radius, is shown in the lower panel of Fig. 3. The quantity varies from to , with larger values indicating a stronger bar pattern. We see that in the -body case, increases over time as the bar pattern slows. This is consistent with previous -body simulations which showed a clear correlation between the bar pattern speed and the bar strength (e.g., Athanassoula, 2003). In the SMUGGLE case, we see that the bar strength has an initial drop but then remains at a roughly constant, but slightly decreasing, strength. This is consistent with the pattern speed in the SMUGGLE case being roughly constant or slightly increasing.
4 Discussion
4.1 Pattern Speed Evolution
The lack of evolution in the pattern speed of the SMUGGLE case (seen in Fig. 2) is intimately tied to the sudden decrease in torque exerted on the bar by the dark matter halo.
We interpret this behavior in terms of the halo wake mechanism. In the -body case, a well known phenomenon is that the halo material resonant with the bar forms a wake, and this wake lags behind (Tremaine & Weinberg, 1984b; Weinberg, 1985; Hernquist & Weinberg, 1992) and exerts a negative torque on the bar, slowing it down (see Fig. 5 below).333Since the bar is not a solid body, it is not guaranteed that a negative torque will slow it down - e.g. a negative torque could reduce the mass of the bar, reducing its moment of inertia without changing its pattern speed. However, the bar seems to empirically respond to a negative torque induced by a halo wake by slowing down. As the bar slows down, the location of the resonances in the phase space changes (see Fig. 12 and Table 1 in D’Onghia & L. Aguerri (2020)) allowing halo material newly resonant with the bar to participate in the formation of the wake. However, the gas is also a reliable source of positive torque on the bar, speeding the bar up. In turn, this stops the location of the resonance from changing such that the halo cannot reinforce the wake, therefore arresting the process by which the halo can slow the bar down. We term this process “bar pattern speed locking,” or simply bar locking for short.444 To be more explicit, it is the gas which locks the pattern speed of the bar. The gas does this by forcing the resonant locations of the bar into regions of the halo phase space that can no longer support significant negative torque.
This bar locking process is similar to the “metastability” effect, which has been previously discussed in the literature (Valenzuela & Klypin, 2003; Sellwood & Debattista, 2006). Finally, we also note that these authors, in particular, observe that the effects of numerical resolution in the simulations adopted to explore these mechanisms have yet to be fully explored and could play a role in the observed phenomenology of the simulations. We plan to address these issues in future dedicated work.
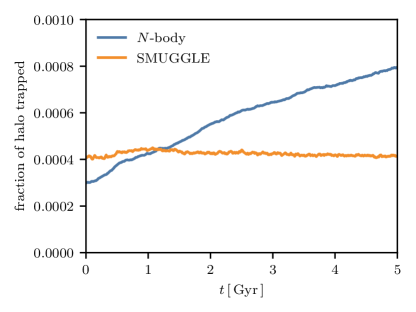
We test this interpretation in two ways. First, we measure the fraction of mass trapped in the halo. As material in the halo wake torques the bar, that material becomes trapped on bar-like orbits (the “shadow bar”; Petersen et al., 2016). In Fig. 4 we show the halo trapped fraction for particles with radii less than two disk scale lengths (). In the -body case, the trapped fraction increases with time, as expected since the halo is actively torquing the bar (which is, therefore, unlocked). In the SMUGGLE case, the trapped fraction is constant (or perhaps slightly decreasing) with time (indicating the bar is locked). This supports our interpertation that the halo wake process has shut down in the presence of the gas phase.
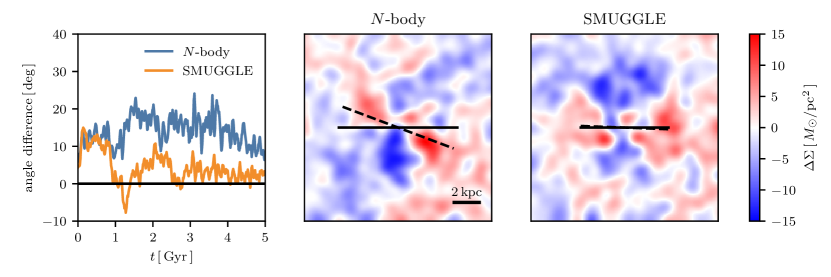
Second, we measure the angle offset between the halo wake and the bar. If the wake and the bar are aligned (i.e., there is no angle offset), then the wake cannot exert a negative torque on the bar. This angle is plotted in the left panel of Fig. 5, which shows that the angle offset is larger in the -body case than in the SMUGGLE case by about a factor of three. The center and right panels of Fig. 5 show the halo wake with respect to the location of the bar in the -body (center) and SMUGGLE (right) cases at one point in time. Note that in Fig. 5 we have removed the halo material trapped in the bar, which exerts no net torque on the bar.
The presence of the gas can arrest the process by which additional material in the dark matter halo can contribute to a wake. However, this does not explain why the pattern speed in the SMUGGLE case is nearly constant over several Gyr. Naively, it would be a coincidence that the bar pattern speed remains constant in the SMUGGLE case, resulting from a chance cancellation of the halo and gas torques. However, a constant pattern speed in the presence of gas has been observed in a few simulations of barred galaxies with gas (Friedli & Benz, 1993; Berentzen et al., 2007; Villa-Vargas et al., 2009, 2010; Athanassoula, 2014).
Friedli & Benz (1993) argue this behavior is due to the steepening of the circular velocity curve in the central region as the bar drives gas to the center. Villa-Vargas et al. (2009) argue this behavior occurs when the corotation resonance is larger than the disk radius, but we observe the behavior when the corotation radius is well within the disk.
We propose that an equilibrium mechanism is responsible for the pattern speed remaining approximately constant. In this scenario, residual negative torque from the dark matter halo balances out the positive torque from the gas phase. It has been shown when an analytic bar is forced to rotate at a constant pattern speed for a few Gyr, the halo exerts almost no torque on the bar (Chiba & Schönrich, 2022). We saw in Fig. 2 that the dark matter halo in our simulation is still able to support some negative torque over a several Gyr time span.
We argue that the following occurs. First, the bar is not able to slow down quickly enough due to the positive torque of the infalling gas. This causes the resonant halo phase space at a particular pattern speed, , to become mixed and no longer able to support a negative torque.555In the halo wake picture, this corresponds to the wake becoming fully aligned with the bar. Second, the gas is still exerting a positive torque on the bar, and therefore the pattern speed will again increase. Since at higher pattern speeds the halo has not yet been totally mixed, the halo will once again be able to exert a negative torque on the bar. The pattern speed will then settle at a new value slightly higher than where the gas and halo torques cancel. Over time, the pattern speed should slowly increase.
4.2 Delayed Gas Injection
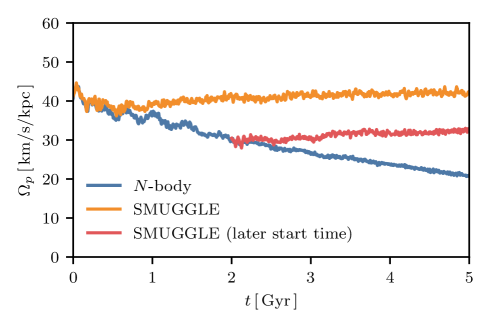
A clear prediction of our proposed mechanism is that the constant pattern speed a particular galaxy will end up is somewhat arbitrary. In the real universe for an isolated galaxy it would be the formation pattern speed of the bar while in our simulation it is the pattern speed of the bar when gas is added to the system. We tested this by adding gas to the system at a later time when the bar has further grown and slowed down with time. In our particular test, we added the gas at a time when the pattern speed is . As shown in Fig. 6, we find that the pattern speed evolution is very similar between the two cases (orange and red lines). If anything, the system with a lower pattern speed seems to speed up more, which is consistent with our picture since the stronger bar should experience a larger torque from the gas as it is more efficient at driving gas inflows. We also show in the Appendix B that more slowly rotating bars at fixed bar strength are more efficient at driving gas inflows as well. Nonetheless, when the initial pattern speed is lower (red line), the addition of gas does not cause the pattern speed to quickly return to the higher value of our fiducial simulation (orange line).
4.3 Varying Initial Gas Fractions
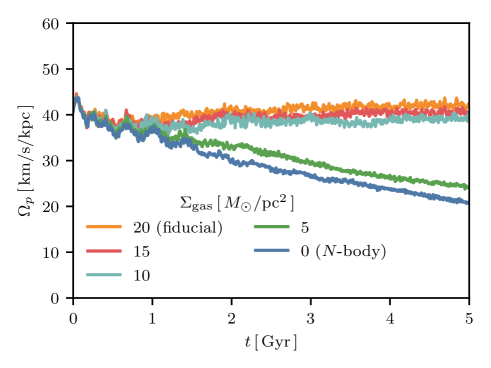
We performed a test in which we varied the initial gas fraction of the disk. In our fiducial run, we set the surface density of the gas disk from to to be . We also ran with surface densities of , , and . These correspond to initial gas fractions of approximately , , , and . The pattern speed evolution is shown in Fig. 7. We find that the bar in disks with initial surface densities of , , and evolve with a constant pattern speed while the bar in a disk with initial surface density of slows down at a similar rate to the -body case.
After , the simulation has a gas fraction of , but still exhibits constant pattern speed behavior. As a result, we conclude that for the disk, bar, and halo properties considered in this work, a gas fraction of only approximately is necessary in order for the proposed stabilizing mechanism to operate. We stress that this gas fraction threshold is only for the system considered in this work. Systems with different structural parameters may require a different threshold. For example, Aumer & Schönrich (2015) find slowdown behavior in a barred disk times less massive than ours with a gas fraction of . To make things more complicated, Villa-Vargas et al. (2010) find that the gas fraction cutoff varies with the softening length used. Determining exactly how the gas fraction cutoff varies with these considerations deserves further attention.
4.4 Semi-Analytic Model
We also developed a simple semi-analytic model of a bar-disk-halo system. This exercise demonstrates that our proposed mechanism follows from a few simple assumptions. Our method follows closely the one developed in Chiba & Schönrich (2022). We model the bar-disk-halo system with three components: a dark matter Hernquist (1990) halo, a Miyamoto & Nagai (1975) disk, and a pure quadrupole bar described in Chiba & Schönrich (2022). The bar and disk components are just described by their potential, but we integrate the trajectories of test particles drawn from a Hernquist halo. Note that we do not include the interactions between these test particles, and so this model is not self-consistent. We give our chosen parameter values in Appendix E.
We allow the bar in this model to rotate as a solid body. However, we crucially allow the pattern speed of the bar to freely change with time in accordance with the torque exerted on the dark matter halo by the bar. In particular, we subtract the -component of this torque divided by the moment of inertia of the bar from the pattern speed at each timestep. Since the radius of corotation is a parameter in the bar model from Chiba & Schönrich (2022), we allow the moment of inertia of the bar to vary with . This is inspired by the fact that the moment of inertia of an ellipsoid scales with the sum of the square of its axes. To be more precise, we allow
| (2) |
where is a free parameter chosen by the user. We found that allowing is a good approximation to our fiducial disk model. In code units, the moment of inertia of the SMUGGLE bar (i.e., the particles classified as being in the bar) is about . This is a factor of smaller than our fiducial value of , but this is probably due either to the fact that the bar does not really rotate as a solid body or that resonantly captured stars contribute to the real bar’s effective moment of inertia (Weinberg, 1985).
In addition to , we allowed for another free parameter - the torque from the gas phase on the bar, . This torque is applied to the bar in the same way as the torque from the halo is applied. The torque is given in code units ().
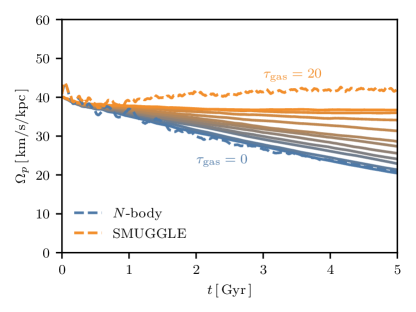
We show the effect of varying the gas torque from to in increments of in Fig. 8. The solid lines indicate the semi-analytic model, while the two dashed lines correspond to our fiducial simulations introduced earlier. For reference, the average torque exerted by the gas phase on the bar in our fiducial simulation was in code units. We see in Fig. 8 that we can reproduce the stability of our fiducial gas disk (i.e., its lack of secular evolution) simply by including a positive torque on the order of . Our semi-analytic model with no gas torque can reproduce the pattern speed evolution of the -body case.
We next take the and cases from Fig. 8 and plot the halo torque evolution. This result, given in Fig. 9, is comparable to the lower panel of Fig. 2. We find that the case compares favorably to the -body case described in previous sections. The bar exerts a steady negative torque in this case (blue line). When a gas torque is included (orange lines), we find that the halo’s torque becomes much weaker, similar to what we found in the SMUGGLE case. The gas applies a steady positive torque by construction. Therefore, the locking process is reproduced in our simple semi-analytic model. Curiously, we do not see the bimodal behavior in Fig. 7 and described in Villa-Vargas et al. (2010). It is not presently clear why this is the case.
4.5 Observations
Observational estimates of the pattern speeds of bars indicate that nearly all galaxies have (Corsini, 2011; Aguerri et al., 2015; Guo et al., 2019; Garma-Oehmichen et al., 2020), where was defined in Section 1 to be . This observational fact has long been in conflict with the theoretical expectation that bars should slow down, increasing (e.g. Tremaine & Weinberg, 1984b; Weinberg, 1985; Debattista & Sellwood, 2000). Explanations for this discrepancy have been given in the past. Some have argued that perhaps the central regions of dark matter haloes are less dense than we expected from (e.g. Debattista & Sellwood, 2000; Fragkoudi et al., 2021). Some have argued that perhaps bars are recurrent, short-lived phenomena, and that all the bars we see in the local universe are very young (Bournaud & Combes, 2002; Bournaud et al., 2005). Some have argued that modifications to General Relativity ease the tension between the observed universe and (e.g. Roshan et al., 2021a, b).
Because such a small gas fraction is necessary for our stabilizing mechanism to operate ( in our Milky Way-like disk), we argue that most galaxies host a bar that is not slowing down. This naturally explains why most observed bars are fast rotators. However, we acknowledge two instances of reported discrepancies between our mechanism and observations.
First, we note that Garma-Oehmichen et al. (2020) found that the rotation parameter positively correlates with gas fraction, such that galaxies with higher gas fractions are rotating more slowly. However, it is not obvious this is in tension with our result since the gas fraction of galaxies correlates with other galactic properties (Blanton & Moustakas, 2009). Furthermore, the measurement of pattern speeds is a delicate process still prone to large errors.
Second, the work of Chiba et al. (2021) and Chiba & Schönrich (2021) have made indirect measurements of the deceleration of the bar’s pattern speed from kinematics and chemistry. We point out that these reported measurements are not direct measurements of the Milky Way bar’s deceleration. For instance, Chiba et al. (2021) measures the pattern speed based on the asymmetry of the Hercules stream, but this can also be produced by spiral arms (Hunt et al., 2018). Much like the simulations in the present work, the simulations of these two works do not properly account for the complicated formation process of the Galactic bar, which may leave imprints on the present day distribution of stars in spatial, kinematic, and chemical space. More investigation is necessary to reconcile the present work with these two well-executed manuscripts.
Lenticular galaxies which lack a signficant gas phase offer an opportunity to find slowly rotating bars. It would still take several Gyr for a galaxy hosting a fast bar to transition to the slow bar regime, so slow bars should only occupy lenticular galaxies which have been lenticular for some time. NGC 4277 is one such example, whose bar has been found to rotate with (Buttitta et al., 2022). On the other hand, NGC 4264 has a fast bar with (Cuomo et al., 2019). The difference has been explained by differences in the dark matter content of the galaxies (Buttitta et al., 2023). We offer another explanation based on the timing of when gas was stripped from these galaxies.
There are further examples of gas-rich galaxies hosting slow bars. For example, UGC 628 (; Chemin & Hernandez, 2009) and NGC 2915 (; Bureau et al., 1999). UGC 628 has been studied in detail by Chequers et al. (2016), who note that it indeed has a low gas fraction for galaxies of its type. NGC 2915 has a gas fraction of (Werk et al., 2010), which would seem to be in conflict with our prediction that only a gas fraction is necessary to arrest the halo slowdown process. However, NGC 2915 has significantly different structural properties than the Milky Way-like model we considered in this work. In particular, it has a signficantly lower mass ( compared to in our model). Further work is necessary to see how the gas fraction threshold varies with galactic properties.
Fraser-McKelvie et al. (2020) find that quenched galaxies tend to host longer bars than star-forming galaxies. This provides some support for our proposed mechanism since there is evidence quenching can occur through gas depletion (e.g. Whitaker et al., 2021). However, this correlation could be explained simply by the fact that longer bars ought to be more efficient at quenching their host galaxies (e.g Gavazzi et al., 2015).
Finally, we mention the evolution of in our simulation. In the -body simulation, the bar forms with at , which is already well within the slow bar regime. After of evolution, has risen to . In the SMUGGLE simulation, the gas is added to the snapshot, so it begins with . As expected, after of evolution is still . However, this relies on our measure of the bar length as being the maximum radius of all orbits trapped in the bar, which is not an observationally accessible measure of bar length. One would need to test different observationally possible bar length estimators, such as ellipse fitting (Athanassoula et al., 1990; Márquez et al., 1999; Athanassoula & Misiriotis, 2002; Michel-Dansac & Wozniak, 2006; Aguerri et al., 2009, 2015). This is beyond the scope of our current work. Nonetheless, our prediction that is stable in the presence of sufficient gas is robust. Assuming bars form with , we predict this should remain the case with further evolution. Why the -body simulation forms a bar with is a separate question deserving further attention.
4.6 Previous Idealized Simulation Work
Substantial work has been devoted to the role of gas in bar dynamics. We discuss this and highlight the novel aspects of the present investigation.
To our knowledge the first work on a barred galaxy with a gas component was by Friedli & Benz (1993). They found a stable pattern speed when a dissipative component was added to the system, with a slight increase in the pattern speed near the end of their simulation. However, their model was only evolved for , so it is unclear if their bar exhibits a stable pattern speed over several Gyr.
Berentzen et al. (2007) describe a model containing up to gas. Their disk is similar to ours (though their dark matter halo is a factor of less massive). They find slowdown behavior up to a gas fraction of , with the finding that higher gas fractions lead to a reduced slowdown. However, for the models which they show pattern speeds, they do not include star formation or the removal of gas from the center of their disk. In preliminary work, we found slowdown behavior in an adiabatic model with similar gas fractions but lacking any method for removing gas from the central region (in our fiducial SMUGGLE model this is achieved through star formation). We surmise that the removal of gas from the central region is an important requisite for stable pattern speeds, though a careful torque analysis is necessary to confirm this hypothesis.
Villa-Vargas et al. (2010) do find stable pattern speeds in models with gas fractions as low as (depending on the force softening used). Crucially, their model does contain a routine for removing gas from the central region of the disk. These authors state the behavior is bimodal, with a clear stable regime and a slowdown regime. These authors make no mention of the process by which the halo braking process is arrested, as we propose in the present paper.
Athanassoula et al. (2013); Athanassoula (2014) find stable evolution in for a triaxial halo over with initial (final) gas fractions of (), (), and (). For a model with () gas fraction they find an increasing . In their model with a spherical halo they always find increasing , contrary to the present work. We note there is a structural difference in their dark matter halo. They use a cored isothermal sphere as opposed to our Hernquist halo. It is not clear to us the impact this would have on the expected torque from the halo (i.e., the velocity structure of their halo may allow for more efficient capture and thus stronger torquing). The bar locking process (or something similar) which we propose in this paper is not mentioned by these authors.
There may also be issues related to structural differences between their bars and the bar considered in this work. In our case, we allowed the bar to form in an -body run and then added gas after the bar formation. In Athanassoula et al. (2013); Athanassoula (2014) the bar forms from a disk that is initially gas-rich. Neither approach is inherently better, but it is known that in the latter case the resultant bar strength is weaker for initially gas-rich systems (e.g., Athanassoula et al., 2013). Weaker bars are less efficient at driving gas inwards (Regan & Teuben, 2004) and thus should experience less positive torque from the gas phase. A direct comparison based on the torque by the gas phase on the bar is necessary.
Aumer & Schönrich (2015) describe a model containing gas and stars which slows down with time. In their model gas is added to the system to target a gas fraction of . However, their disk is about a factor of less massive than the disk considered in this work. The necessary gas fraction for a stable pattern speed probably depends on galaxy properties like mass. It is unclear whether is sufficient for their bar to have a stable pattern speed.
4.7 Cosmological Simulations
Barred galaxies in cosmological simulations of galaxy formation continue to be in conflict with observations by producing bars which rotate too slowly (Algorry et al., 2017; Peschken & Łokas, 2019; Fragkoudi et al., 2021; Frankel et al., 2022).666Though see Frankel et al. (2022) who argue bars have consistent pattern speeds with observations, but are too short. These works examine bars in EAGLE (Crain et al., 2015; Schaye et al., 2015), Illustris (Vogelsberger et al., 2014a, b), and Illustris TNG50 (Pillepich et al., 2019; Nelson et al., 2019). Okamoto et al. (2015) describe cosmological zoom simulations of two barred Milky Way-like galaxies that both slow down over time. As pointed out by Villa-Vargas et al. (2010), the gas fraction cutoff for the stable pattern speed regime increases with lower softening lengths. Okamoto et al. (2015) use softening lengths larger than ours by about a factor of . This highlights the importance of future work exploring precisely when barred galaxies ought to be in the stable regime.
Fragkoudi et al. (2021) explored the evolution of bars in the Auriga cosmological zoom simulations (Grand et al., 2017). They find values consistent with observations. Furthermore, their pattern speed evolution shows some apparent periods of stability (see their Fig. B1). One galaxy, Au26, appears to even transition from the stable pattern speed regime to the slowing down regime at a lookback time of .
Furthermore, the pattern speeds of bars in both cosmological simulations and the real universe can be affected by environmental processes not included in our simulation – e.g., satellite infall (Purcell et al., 2011), non-sphericity (Athanassoula et al., 2013), rotation in the dark matter halo (Saha & Naab, 2013; Long et al., 2014; Collier et al., 2018, 2019), or perhaps even the gaseous circumgalactic medium. Naturally, extending our present work to account for such effects is a crucial next step in understanding the formation and evolution of galactic bars. We are presently engaged in such an exploration.
5 Conclusions
We performed a simulation of a Milky Way-like galactic disk hosting a strong bar with a state-of-the-art model for the interstellar medium. We found that the pattern speed of the bar in this simulation does not slow down but rather remains at a stable, constant pattern speed. We provided a simple semi-analytic model which reproduces many of the features from our fiducial disk model.
The implications of our findings are numerous. First, we naturally explain why nearly all observed galaxies are fast rotators without requiring the inner regions of dark matter halos to be underdense (Debattista & Sellwood, 1998, 2000) or requiring new physics (Roshan et al., 2021a, b). Second, we show that the role of gas is of paramount importance in studies which attempt to uncover the nature of dark matter from its effect of slowing down the bar (Chiba et al., 2021; Chiba & Schönrich, 2021). Third, we provide an explanation for how the Milky Way’s bar could be both long-lived and a fast rotator, of which there is some observational evidence (Bovy et al., 2019). And finally, we complicate the picture of stellar radial mixing expected to sculpt the Milky Way’s disk (Bird et al., 2012; Hayden et al., 2015), a process which relies upon the pattern speed of the bar to change with time. The radial mixing of the gas phase induced by the bar, as predicted in Hopkins & Quataert (2011), might have implications for the radial metallicity gradients of galaxies. Our work does not alter expectations for radial mixing induced by spiral arms (Sellwood & Binney, 2002).
We found that below a certain gas fraction, bars should still be able to slow down. Therefore, we expect barred spiral galaxies which have been gas-poor for extended periods of time to be rotating very slowly. We therefore predict that observations which target such galaxies (e.g., lenticular barred galaxies (Blanton & Moustakas, 2009)) would find slowly rotating bars.777This does not mean that we predict all gas-poor galaxies should be slowly rotating. Indeed, they would need to be gas-deficient for several Gyr before they would be classified as slow rotators. There does exist examples of galaxies known to be slow rotators – the low surface brightness galaxy UGC 628 (Chemin & Hernandez, 2009), lenticular galaxy NGC 4277 (Buttitta et al., 2022), and NGC 2915 (Bureau et al., 1999). UGC 628 has been studied in detail by Chequers et al. (2016), who note that it indeed has a low gas fraction for galaxies of its type. NGC 2915 has a gas fraction of (Werk et al., 2010), which would seem to be in conflict with our prediction that only a gas fraction is necessary to arrest the halo slowdown process. However, NGC 2915 has significantly different structural properties than the Milky Way-like model we considered in this work, discussed in Section 4.5. We predict a general trend that bars in gas-rich spiral galaxies should rotate quickly while some bars in gas-poor spiral galaxies should rotate slowly.
Snapshots at cadence are publicly available at https://drive.google.com/drive/folders/1nZF7mZ98T0QPc2pt7CVCUUdQAm7Q9nK-?usp=sharing.
Appendix A Bar Decomposition
Computing the length of the bar and the torque on the bar by different components requires us to decompose the disk into a component which is trapped by the bar and a component which is untrapped. In order to do this, we follow closely the technique developed in Petersen et al. (2016). We analyzed the orbit of each star particle (meaning initial disk, bulge, and newly formed stars) by extracting the - positions of the apoapse of each in a frame corotating with the bar, where apoapses are defined as local maxima in . For each apoapse, we searched for the closest apoapses in time and applied a -means clustering algorithm on this set of points with . We then computed for each of the two clusters the average angle from the bar , the standard deviation in of the points , and the average radius of the cluster . At each apoapse, a particle was considered to be in the bar if it met the following criteria:
| (A1) |
| (A2) |
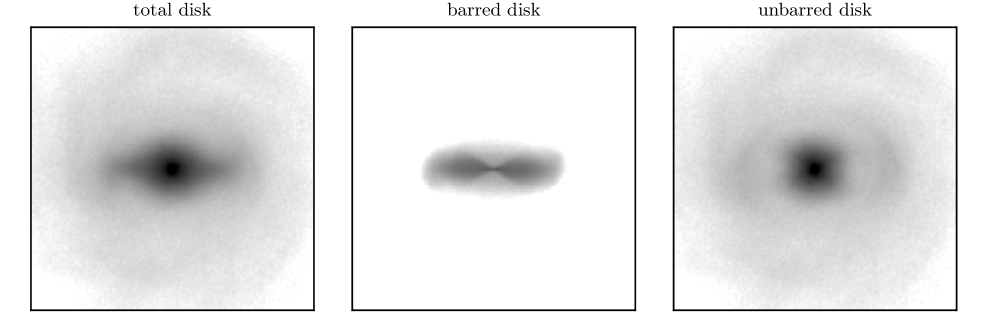
These criterion are slightly different and simplified from the ones used in Petersen et al. (2016), but we found them to empirically work well at decomposing the disk into a bar and disk component. In Fig. 10, we show an example of this decomposition. The left panel shows a surface density projection of the stellar disk and bulge (including newly formed stars) from the SMUGGLE model after of evolution in a frame such that the bar is aligned with the -axis. The middle panel shows a projection of the subset of stars that are identified as being trapped in the bar and the right panel shows a projection of the stars that are not identified as being trapped. The fact that the right panel is roughly axisymmetric indicates the bar decomposition is performing adequately.
We computed the second Fourier component for all particles classified as barred and unbarred. We found that of the total Fourier component is in the particles classified as barred (i.e., ). Some of this is probably coming from the component (e.g., boxy orbits) being classified as unbarred, or the presence of weak spiral arms. See also Petersen et al. (2021) for more details on the orbit family breakdown.
Appendix B Varying Pattern Speed
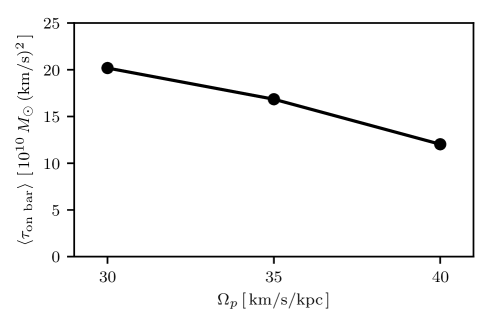
When the bar slows down, we argue that this induces a larger positive torque from the gas phase. Only gas within corotation will flow inwards, while gas outside corotation will flow outwards (Hopkins & Quataert, 2011). Since the corotation radius is larger for more slowly rotating bars, it follows that more slowly rotating bars should be more efficient at driving gas inflows and thus experience a larger positive torque from the gas phase.
We performed an experiment to test this hypothesis by freezing the stellar disk in the SMUGGLE run and forcing it to rotate at a constant angular rate. This has the effect of forcing the bar to rotate as a solid body at a constant angular rate which we control. The gas is evolved self-consistently with this rotating disk. We measured the torque on the bar by the gas phase at different rotation rates. The result of this experiment is illustrated in Fig. 11, which shows that a more slowly rotating bar experiences a larger positive torque from the gas.
We also note that since Hopkins & Quataert (2011) predicts gas outside of corotation will flow outward, the bar should exert a positive torque on that gas. Indeed, we measured the average torque on gas outside corotation from to to be in code units (). For reference, the average torque inside corotation is over the same time period and in the same units. So, while gas outside corotation does experience a positive torque, the total torque on the gas phase is still negative.
Appendix C Stars Instead of Gas
In the SMUGGLE model considered in this work, we instantaneously added gas to the -body system after of evolution. One might wonder if this sudden change to the potential is responsible for the stable pattern speed evolution. To test whether this is the case, we added mass to the system in the same way we did for the SMUGGLE model, but using collisionless particles instead of gas. The result of this experiment is shown in Fig. 12. While there is an offset compared to the pure -body case, we see that the pattern speed evolution is broadly consistent with a declining pattern speed. This indicates that the gas phase is responsible for the stable pattern speed.
Appendix D Smooth Interstellar Medium
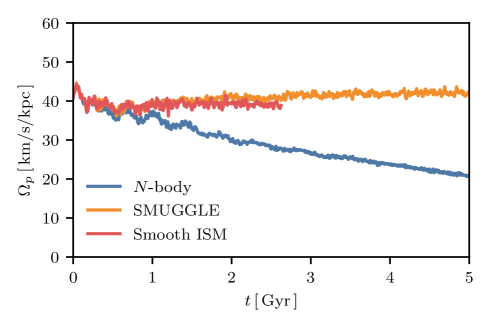
We performed a simulation of the same disk but with a simpler model of the interstellar medium (Springel & Hernquist, 2003), closer to standard methods used in cosmological simulations of galaxy formation and described in more detail in Section 2. The result of this test is presented in Fig. 13. We find that the pattern speed evolution is nearly the same in this case, and so conclude that our result is not sensitive to the details of the model for the interstellar medium.
Appendix E Semi-Analytic Model Parameters
Our semi-analytic model consisted of a three-component bar-disk-halo system. We describe here the parameters we chose for these components. The parameters of the disk and halo were chosen to match closely what we used in our fiducial simulations. The system can thus be understood as being roughly similar to the Milky Way, though no careful analysis has been performed to ensure the closest match possible.
For the dark matter halo, we used a Hernquist potential (Hernquist, 1990) with mass and a scale length of . For the stellar disk, we used a Miyamoto-Nagai disk (Miyamoto & Nagai, 1975) with mass , radial scale length of , and vertical scale length of . For the bar, we used the quadrupole potential described in Chiba & Schönrich (2022). We used their fiducial parameter values – specifically, we set , , and . Our initial pattern speed is always set to .
We integrated our model for with a timestep of .
Appendix F Comparison to the Milky Way
For several Gyr, our fiducial disk exhibits several properties in reasonable agreement to the Milky Way. This is uncommon in models of galaxies that include the gas phase of the disk but no circumgalactic medium. As mentioned earlier, the pattern speed seems to match the observed pattern speed of the Milky Way’s bar (Bovy et al., 2019). We briefly summarize some of the other ways our disk is comparable to the Milky Way.
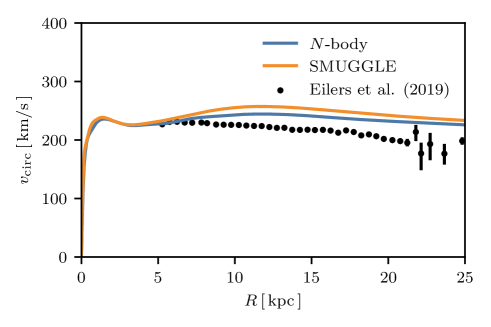
We computed the circular velocity curve of our model using the AGAMA package (Vasiliev, 2019). We fit the baryonic component (stellar disk, bulge, gas, and newly formed stars) with an axisymmetric cylindrical spline with grid points in both the radial and vertical direction spanning to in the radial direction and from to in the vertical direction. We fit the dark matter halo using an axisymmetric multipole fit with a maximum angular harmonic coefficient of , to account for the compression of the halo by the disk. We plot the circular velocity curve at in Fig. 15 compared to observational estimates (Eilers et al., 2019). The SMUGGLE disk (which includes additional mass in the form of gas) has a slightly higher circular velocity than the -body disk which, itself, is slightly higher than the observational estimates. Overall, though, the circular velocity curves between our model and that observed in the Milky Way are broadly consistent.
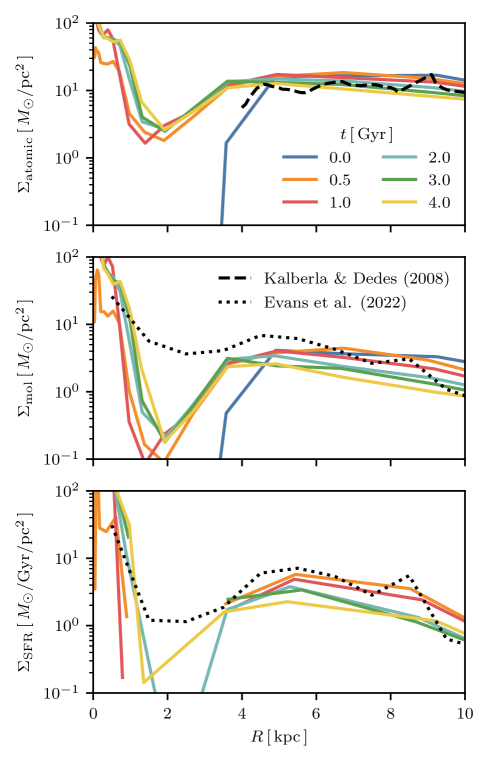
We also show the evolution of the surface density profile in Fig. 14 We find that in our simulation the atomic and molecular gas surface density and the SFR surface density is broadly consistent with the expected values for the Milky Way (Kalberla & Dedes, 2008; Evans et al., 2022). The discrepancy between and in the molecular and SFR surface density is probably due to the fact that the distances to molecular clouds which underlines this work used a simple kinematic distance based on an axisymmetric model of the Milky Way (Miville-Deschênes et al., 2017), which is not accurate in the bar region where gas has large non-circular velocities.
We measured the initial scale height of the atomic gas disk in a bin extending from to . The initial vertical profile is well-fit by a Gaussian with a scale height of . At , the vertical profile in the same radial bin is better fit by an exponential profile with scale height of . These are somewhat lower than the observed value in the HI disk of (Malhotra, 1995; Marasco et al., 2017). This may be caused by the model in our simulations not driving enough turbulent pressure, and is an interesting avenue of further investigation.
References
- Aguerri et al. (2009) Aguerri, J. A. L., Méndez-Abreu, J., & Corsini, E. M. 2009, A&A, 495, 491, doi: 10.1051/0004-6361:200810931
- Aguerri et al. (2015) Aguerri, J. A. L., Méndez-Abreu, J., Falcón-Barroso, J., et al. 2015, A&A, 576, A102, doi: 10.1051/0004-6361/201423383
- Algorry et al. (2017) Algorry, D. G., Navarro, J. F., Abadi, M. G., et al. 2017, MNRAS, 469, 1054, doi: 10.1093/mnras/stx1008
- Astropy Collaboration et al. (2013) Astropy Collaboration, Robitaille, T. P., Tollerud, E. J., et al. 2013, A&A, 558, A33, doi: 10.1051/0004-6361/201322068
- Astropy Collaboration et al. (2018) Astropy Collaboration, Price-Whelan, A. M., Sipőcz, B. M., et al. 2018, AJ, 156, 123, doi: 10.3847/1538-3881/aabc4f
- Athanassoula (2002) Athanassoula, E. 2002, ApJ, 569, L83, doi: 10.1086/340784
- Athanassoula (2003) —. 2003, MNRAS, 341, 1179, doi: 10.1046/j.1365-8711.2003.06473.x
- Athanassoula (2014) —. 2014, MNRAS, 438, L81, doi: 10.1093/mnrasl/slt163
- Athanassoula et al. (2013) Athanassoula, E., Machado, R. E. G., & Rodionov, S. A. 2013, MNRAS, 429, 1949, doi: 10.1093/mnras/sts452
- Athanassoula & Misiriotis (2002) Athanassoula, E., & Misiriotis, A. 2002, MNRAS, 330, 35, doi: 10.1046/j.1365-8711.2002.05028.x
- Athanassoula et al. (1990) Athanassoula, E., Morin, S., Wozniak, H., et al. 1990, MNRAS, 245, 130
- Aumer & Schönrich (2015) Aumer, M., & Schönrich, R. 2015, MNRAS, 454, 3166, doi: 10.1093/mnras/stv2252
- Berentzen et al. (2007) Berentzen, I., Shlosman, I., Martinez-Valpuesta, I., & Heller, C. H. 2007, ApJ, 666, 189, doi: 10.1086/520531
- Bird et al. (2012) Bird, J. C., Kazantzidis, S., & Weinberg, D. H. 2012, MNRAS, 420, 913, doi: 10.1111/j.1365-2966.2011.19728.x
- Blanton & Moustakas (2009) Blanton, M. R., & Moustakas, J. 2009, ARA&A, 47, 159, doi: 10.1146/annurev-astro-082708-101734
- Blitz & Spergel (1991) Blitz, L., & Spergel, D. N. 1991, ApJ, 379, 631, doi: 10.1086/170535
- Bournaud & Combes (2002) Bournaud, F., & Combes, F. 2002, A&A, 392, 83, doi: 10.1051/0004-6361:20020920
- Bournaud et al. (2005) Bournaud, F., Combes, F., & Semelin, B. 2005, MNRAS, 364, L18, doi: 10.1111/j.1745-3933.2005.00096.x
- Bovy et al. (2019) Bovy, J., Leung, H. W., Hunt, J. A. S., et al. 2019, MNRAS, 490, 4740, doi: 10.1093/mnras/stz2891
- Bureau et al. (1999) Bureau, M., Freeman, K. C., Pfitzner, D. W., & Meurer, G. R. 1999, AJ, 118, 2158, doi: 10.1086/301064
- Buttitta et al. (2022) Buttitta, C., Corsini, E. M., Cuomo, V., et al. 2022, A&A, 664, L10, doi: 10.1051/0004-6361/202244297
- Buttitta et al. (2023) Buttitta, C., Corsini, E. M., Aguerri, J. A. L., et al. 2023, MNRAS, 521, 2227, doi: 10.1093/mnras/stad646
- Chabrier (2003) Chabrier, G. 2003, PASP, 115, 763, doi: 10.1086/376392
- Chemin & Hernandez (2009) Chemin, L., & Hernandez, O. 2009, A&A, 499, L25, doi: 10.1051/0004-6361/200912019
- Chequers et al. (2016) Chequers, M. H., Spekkens, K., Widrow, L. M., & Gilhuly, C. 2016, MNRAS, 463, 1751, doi: 10.1093/mnras/stw2113
- Chiba et al. (2021) Chiba, R., Friske, J. K. S., & Schönrich, R. 2021, MNRAS, 500, 4710, doi: 10.1093/mnras/staa3585
- Chiba & Schönrich (2021) Chiba, R., & Schönrich, R. 2021, MNRAS, 505, 2412, doi: 10.1093/mnras/stab1094
- Chiba & Schönrich (2022) —. 2022, MNRAS, 513, 768, doi: 10.1093/mnras/stac697
- Collier et al. (2018) Collier, A., Shlosman, I., & Heller, C. 2018, MNRAS, 476, 1331, doi: 10.1093/mnras/sty270
- Collier et al. (2019) —. 2019, MNRAS, 488, 5788, doi: 10.1093/mnras/stz2144
- Combes & Sanders (1981) Combes, F., & Sanders, R. H. 1981, A&A, 96, 164
- Contopoulos (1980) Contopoulos, G. 1980, A&A, 81, 198
- Corsini (2011) Corsini, E. M. 2011, Memorie della Societa Astronomica Italiana Supplementi, 18, 23. https://arxiv.org/abs/1002.1245
- Crain et al. (2015) Crain, R. A., Schaye, J., Bower, R. G., et al. 2015, MNRAS, 450, 1937, doi: 10.1093/mnras/stv725
- Cuomo et al. (2019) Cuomo, V., Corsini, E. M., Aguerri, J. A. L., et al. 2019, MNRAS, 488, 4972, doi: 10.1093/mnras/stz1943
- Debattista & Sellwood (1998) Debattista, V. P., & Sellwood, J. A. 1998, ApJ, 493, L5, doi: 10.1086/311118
- Debattista & Sellwood (2000) —. 2000, ApJ, 543, 704, doi: 10.1086/317148
- D’Onghia & L. Aguerri (2020) D’Onghia, E., & L. Aguerri, J. A. 2020, ApJ, 890, 117, doi: 10.3847/1538-4357/ab6bd6
- Dubinski et al. (2009) Dubinski, J., Berentzen, I., & Shlosman, I. 2009, ApJ, 697, 293, doi: 10.1088/0004-637X/697/1/293
- Eilers et al. (2019) Eilers, A.-C., Hogg, D. W., Rix, H.-W., & Ness, M. K. 2019, ApJ, 871, 120, doi: 10.3847/1538-4357/aaf648
- Eskridge et al. (2000) Eskridge, P. B., Frogel, J. A., Pogge, R. W., et al. 2000, AJ, 119, 536, doi: 10.1086/301203
- Evans et al. (2022) Evans, N. J., Kim, J.-G., & Ostriker, E. C. 2022, ApJ, 929, L18, doi: 10.3847/2041-8213/ac6427
- Font et al. (2017) Font, J., Beckman, J. E., Martínez-Valpuesta, I., et al. 2017, ApJ, 835, 279, doi: 10.3847/1538-4357/835/2/279
- Fragkoudi et al. (2021) Fragkoudi, F., Grand, R. J. J., Pakmor, R., et al. 2021, A&A, 650, L16, doi: 10.1051/0004-6361/202140320
- Frankel et al. (2022) Frankel, N., Pillepich, A., Rix, H.-W., et al. 2022, ApJ, 940, 61, doi: 10.3847/1538-4357/ac9972
- Fraser-McKelvie et al. (2020) Fraser-McKelvie, A., Aragón-Salamanca, A., Merrifield, M., et al. 2020, MNRAS, 495, 4158, doi: 10.1093/mnras/staa1416
- Friedli & Benz (1993) Friedli, D., & Benz, W. 1993, A&A, 268, 65
- Garma-Oehmichen et al. (2020) Garma-Oehmichen, L., Cano-Díaz, M., Hernández-Toledo, H., et al. 2020, MNRAS, 491, 3655, doi: 10.1093/mnras/stz3101
- Gavazzi et al. (2015) Gavazzi, G., Consolandi, G., Dotti, M., et al. 2015, A&A, 580, A116, doi: 10.1051/0004-6361/201425351
- Grand et al. (2017) Grand, R. J. J., Gómez, F. A., Marinacci, F., et al. 2017, MNRAS, 467, 179, doi: 10.1093/mnras/stx071
- Guo et al. (2019) Guo, R., Mao, S., Athanassoula, E., et al. 2019, MNRAS, 482, 1733, doi: 10.1093/mnras/sty2715
- Guo et al. (2022) Guo, Y., Jogee, S., Finkelstein, S. L., et al. 2022, arXiv e-prints, arXiv:2210.08658. https://arxiv.org/abs/2210.08658
- Harris et al. (2020) Harris, C. R., Millman, K. J., van der Walt, S. J., et al. 2020, Nature, 585, 357, doi: 10.1038/s41586-020-2649-2
- Hayden et al. (2015) Hayden, M. R., Bovy, J., Holtzman, J. A., et al. 2015, ApJ, 808, 132, doi: 10.1088/0004-637X/808/2/132
- Hernquist (1990) Hernquist, L. 1990, ApJ, 356, 359, doi: 10.1086/168845
- Hernquist & Katz (1989) Hernquist, L., & Katz, N. 1989, ApJS, 70, 419, doi: 10.1086/191344
- Hernquist & Weinberg (1992) Hernquist, L., & Weinberg, M. D. 1992, ApJ, 400, 80, doi: 10.1086/171975
- Hohl (1971) Hohl, F. 1971, ApJ, 168, 343, doi: 10.1086/151091
- Hohl (1976) —. 1976, AJ, 81, 30, doi: 10.1086/111849
- Holley-Bockelmann et al. (2005) Holley-Bockelmann, K., Weinberg, M., & Katz, N. 2005, MNRAS, 363, 991, doi: 10.1111/j.1365-2966.2005.09501.x
- Hopkins & Quataert (2011) Hopkins, P. F., & Quataert, E. 2011, MNRAS, 415, 1027, doi: 10.1111/j.1365-2966.2011.18542.x
- Hopkins et al. (2018) Hopkins, P. F., Wetzel, A., Kereš, D., et al. 2018, MNRAS, 480, 800, doi: 10.1093/mnras/sty1690
- Hunt et al. (2018) Hunt, J. A. S., Hong, J., Bovy, J., Kawata, D., & Grand, R. J. J. 2018, MNRAS, 481, 3794, doi: 10.1093/mnras/sty2532
- Hunter (2007) Hunter, J. D. 2007, Computing in Science & Engineering, 9, 90, doi: 10.1109/MCSE.2007.55
- Johnson (1957) Johnson, H. M. 1957, AJ, 62, 19, doi: 10.1086/107441
- Kalberla & Dedes (2008) Kalberla, P. M. W., & Dedes, L. 2008, A&A, 487, 951, doi: 10.1051/0004-6361:20079240
- Lam et al. (2015) Lam, S. K., Pitrou, A., & Seibert, S. 2015, in Proceedings of the Second Workshop on the LLVM Compiler Infrastructure in HPC, 1–6
- Long et al. (2014) Long, S., Shlosman, I., & Heller, C. 2014, ApJ, 783, L18, doi: 10.1088/2041-8205/783/1/L18
- Lynden-Bell & Kalnajs (1972) Lynden-Bell, D., & Kalnajs, A. J. 1972, MNRAS, 157, 1, doi: 10.1093/mnras/157.1.1
- Malhotra (1995) Malhotra, S. 1995, ApJ, 448, 138, doi: 10.1086/175946
- Marasco et al. (2017) Marasco, A., Fraternali, F., van der Hulst, J. M., & Oosterloo, T. 2017, A&A, 607, A106, doi: 10.1051/0004-6361/201731054
- Marinacci et al. (2019) Marinacci, F., Sales, L. V., Vogelsberger, M., Torrey, P., & Springel, V. 2019, MNRAS, 489, 4233, doi: 10.1093/mnras/stz2391
- Márquez et al. (1999) Márquez, I., Durret, F., González Delgado, R. M., et al. 1999, A&AS, 140, 1, doi: 10.1051/aas:1999516
- Martinez-Valpuesta et al. (2006) Martinez-Valpuesta, I., Shlosman, I., & Heller, C. 2006, ApJ, 637, 214, doi: 10.1086/498338
- Menéndez-Delmestre et al. (2007) Menéndez-Delmestre, K., Sheth, K., Schinnerer, E., Jarrett, T. H., & Scoville, N. Z. 2007, ApJ, 657, 790, doi: 10.1086/511025
- Michel-Dansac & Wozniak (2006) Michel-Dansac, L., & Wozniak, H. 2006, A&A, 452, 97, doi: 10.1051/0004-6361:20041038
- Miville-Deschênes et al. (2017) Miville-Deschênes, M.-A., Murray, N., & Lee, E. J. 2017, ApJ, 834, 57, doi: 10.3847/1538-4357/834/1/57
- Miyamoto & Nagai (1975) Miyamoto, M., & Nagai, R. 1975, PASJ, 27, 533
- Nelson et al. (2019) Nelson, D., Pillepich, A., Springel, V., et al. 2019, MNRAS, 490, 3234, doi: 10.1093/mnras/stz2306
- Okamoto et al. (2015) Okamoto, T., Isoe, M., & Habe, A. 2015, PASJ, 67, 63, doi: 10.1093/pasj/psv037
- O’Neill & Dubinski (2003) O’Neill, J. K., & Dubinski, J. 2003, MNRAS, 346, 251, doi: 10.1046/j.1365-2966.2003.07085.x
- Ostriker & Peebles (1973) Ostriker, J. P., & Peebles, P. J. E. 1973, ApJ, 186, 467, doi: 10.1086/152513
- Peschken & Łokas (2019) Peschken, N., & Łokas, E. L. 2019, MNRAS, 483, 2721, doi: 10.1093/mnras/sty3277
- Petersen et al. (2016) Petersen, M. S., Weinberg, M. D., & Katz, N. 2016, MNRAS, 463, 1952, doi: 10.1093/mnras/stw2141
- Petersen et al. (2019a) —. 2019a, arXiv e-prints, arXiv:1903.08203, doi: 10.48550/arXiv.1903.08203
- Petersen et al. (2019b) —. 2019b, MNRAS, 490, 3616, doi: 10.1093/mnras/stz2824
- Petersen et al. (2021) —. 2021, MNRAS, 500, 838, doi: 10.1093/mnras/staa3202
- Pillepich et al. (2019) Pillepich, A., Nelson, D., Springel, V., et al. 2019, MNRAS, 490, 3196, doi: 10.1093/mnras/stz2338
- Purcell et al. (2011) Purcell, C. W., Bullock, J. S., Tollerud, E. J., Rocha, M., & Chakrabarti, S. 2011, Nature, 477, 301, doi: 10.1038/nature10417
- Regan & Teuben (2004) Regan, M. W., & Teuben, P. J. 2004, ApJ, 600, 595, doi: 10.1086/380116
- Roshan et al. (2021a) Roshan, M., Banik, I., Ghafourian, N., et al. 2021a, MNRAS, 503, 2833, doi: 10.1093/mnras/stab651
- Roshan et al. (2021b) Roshan, M., Ghafourian, N., Kashfi, T., et al. 2021b, MNRAS, 508, 926, doi: 10.1093/mnras/stab2553
- Saha & Naab (2013) Saha, K., & Naab, T. 2013, MNRAS, 434, 1287, doi: 10.1093/mnras/stt1088
- Savitzky & Golay (1964) Savitzky, A., & Golay, M. J. E. 1964, Analytical Chemistry, 36, 1627
- Schaye et al. (2015) Schaye, J., Crain, R. A., Bower, R. G., et al. 2015, MNRAS, 446, 521, doi: 10.1093/mnras/stu2058
- Sellwood & Binney (2002) Sellwood, J. A., & Binney, J. J. 2002, MNRAS, 336, 785, doi: 10.1046/j.1365-8711.2002.05806.x
- Sellwood & Debattista (2006) Sellwood, J. A., & Debattista, V. P. 2006, ApJ, 639, 868, doi: 10.1086/499482
- Sellwood & Wilkinson (1993) Sellwood, J. A., & Wilkinson, A. 1993, Reports on Progress in Physics, 56, 173, doi: 10.1088/0034-4885/56/2/001
- Shlosman et al. (1990) Shlosman, I., Begelman, M. C., & Frank, J. 1990, Nature, 345, 679, doi: 10.1038/345679a0
- Shlosman et al. (1989) Shlosman, I., Frank, J., & Begelman, M. C. 1989, Nature, 338, 45, doi: 10.1038/338045a0
- Springel (2010) Springel, V. 2010, MNRAS, 401, 791, doi: 10.1111/j.1365-2966.2009.15715.x
- Springel et al. (2005) Springel, V., Di Matteo, T., & Hernquist, L. 2005, MNRAS, 361, 776, doi: 10.1111/j.1365-2966.2005.09238.x
- Springel & Hernquist (2003) Springel, V., & Hernquist, L. 2003, MNRAS, 339, 289, doi: 10.1046/j.1365-8711.2003.06206.x
- Tacconi et al. (2020) Tacconi, L. J., Genzel, R., & Sternberg, A. 2020, ARA&A, 58, 157, doi: 10.1146/annurev-astro-082812-141034
- Tremaine & Weinberg (1984a) Tremaine, S., & Weinberg, M. D. 1984a, ApJ, 282, L5, doi: 10.1086/184292
- Tremaine & Weinberg (1984b) —. 1984b, MNRAS, 209, 729, doi: 10.1093/mnras/209.4.729
- Valenzuela & Klypin (2003) Valenzuela, O., & Klypin, A. 2003, MNRAS, 345, 406, doi: 10.1046/j.1365-8711.2003.06947.x
- Vasiliev (2019) Vasiliev, E. 2019, MNRAS, 482, 1525, doi: 10.1093/mnras/sty2672
- Villa-Vargas et al. (2009) Villa-Vargas, J., Shlosman, I., & Heller, C. 2009, ApJ, 707, 218, doi: 10.1088/0004-637X/707/1/218
- Villa-Vargas et al. (2010) —. 2010, ApJ, 719, 1470, doi: 10.1088/0004-637X/719/2/1470
- Virtanen et al. (2020) Virtanen, P., Gommers, R., Oliphant, T. E., et al. 2020, Nature Methods, 17, 261, doi: 10.1038/s41592-019-0686-2
- Vogelsberger et al. (2020) Vogelsberger, M., Marinacci, F., Torrey, P., & Puchwein, E. 2020, Nature Reviews Physics, 2, 42, doi: 10.1038/s42254-019-0127-2
- Vogelsberger et al. (2014a) Vogelsberger, M., Genel, S., Springel, V., et al. 2014a, Nature, 509, 177, doi: 10.1038/nature13316
- Vogelsberger et al. (2014b) —. 2014b, MNRAS, 444, 1518, doi: 10.1093/mnras/stu1536
- Weinberg (1985) Weinberg, M. D. 1985, MNRAS, 213, 451, doi: 10.1093/mnras/213.3.451
- Weinberg & Katz (2007) Weinberg, M. D., & Katz, N. 2007, MNRAS, 375, 460, doi: 10.1111/j.1365-2966.2006.11307.x
- Weinberger et al. (2020) Weinberger, R., Springel, V., & Pakmor, R. 2020, ApJS, 248, 32, doi: 10.3847/1538-4365/ab908c
- Werk et al. (2010) Werk, J. K., Putman, M. E., Meurer, G. R., et al. 2010, ApJ, 715, 656, doi: 10.1088/0004-637X/715/1/656
- Whitaker et al. (2021) Whitaker, K. E., Williams, C. C., Mowla, L., et al. 2021, Nature, 597, 485, doi: 10.1038/s41586-021-03806-7