TickTock: Detecting Microphone Status in Laptops Leveraging Electromagnetic Leakage of Clock Signals
Abstract.
We are witnessing a heightened surge in remote privacy attacks on laptop computers. These attacks often exploit malware to remotely gain access to webcams and microphones in order to spy on the victim users. While webcam attacks are somewhat defended with widely available commercial webcam privacy covers, unfortunately, there are no adequate solutions to thwart the attacks on mics despite recent industry efforts. As a first step towards defending against such attacks on laptop mics, we propose TickTock, a novel mic on/off status detection system. To achieve this, TickTock externally probes the electromagnetic (EM) emanations that stem from the connectors and cables of the laptop circuitry carrying mic clock signals. This is possible because the mic clock signals are only input during the mic recording state, causing resulting emanations. We design and implement a proof-of-concept system to demonstrate TickTock’s feasibility. Furthermore, we comprehensively evaluate TickTock on a total of 30 popular laptops executing a variety of applications to successfully detect mic status in 27 laptops. Of these, TickTock consistently identifies mic recording with high true positive and negative rates.
1. Introduction
Remote privacy attacks on modern day laptops continue to cause significant social problems. For example, remote attackers inject malware to gain access to webcams to stealthily spy on victims by disabling the webcam’s indicator LED (Cook, 2020; Schlesinger, 2014; Nelson, 2015; Brocker and Checkoway, 2014). To defend against such attacks, users often place commercially available webcam privacy covers to physically block the webcams (Norton, 2022; Schlesinger, 2014). Exacerbating the problem, there are also reported attacks that spy on laptop microphones – including zero-day vulnerabilities and stalker-installed malware that stealthily eavesdrop from victims’ laptops (Mayo, 2019; Newman, 2020; Son, 2018; Cimpanu, 2018). Moreover, bugs have been identified until recently in popular video calling apps, such as Zoom, which captured audio on Mac OS, even after the meeting had ended (Roth, 2022). Unlike webcam covers, there are no immediately adequate solutions to defend against mic-based eavesdropping.
To defend against such attacks, companies such as Purism are pushing forward new laptop designs with hardware kill switches for mics, which can cut off power supply to the mics when not in use (Purism, 2021b, a). Apple designed a hardware disconnect feature for Macbook 2019 and later models, which disables the mic whenever the lid is closed (Schwab, 2019). Dell has updated its drivers on newer devices to allow for disabling mics at the operating systems level (Vaughan-Nichols, 2020). Furthermore, several operating systems such as Windows 10 and Mac OS 12 are providing indicators on screen during mic usage for increased user awareness (Henry, 2021; Hoffman, 2019).
While these efforts are promising first steps, they all suffer from significant shortcomings. First, these solutions require users to trust the implementation of the laptop manufacturers or the operating systems, both of which have been compromised by attackers several times in the past (Brocker and Checkoway, 2014; Heinzman, 2019; Y, 2020) or that the manufacturers themselves could be malicious. Second, these solutions are incorporated in only a small fraction of devices, hence most current day laptops do not have a way to detect/prevent eavesdropping.
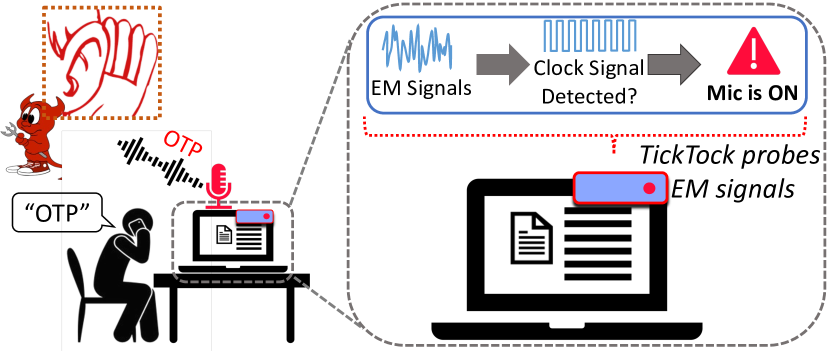
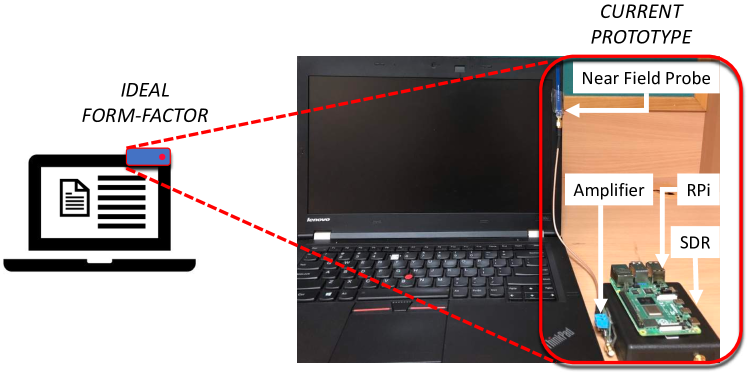
The aforementioned shortcomings lead us to the following research question: Can we design a novel mic-based eavesdropping attack detection system that – (1) is robust to powerful remote attackers, (2) is applicable to existing laptops without any modifications, and (3) places limited trust on device manufacturers? To this end, we propose TickTock that utilizes the phenomenon that digital MEMS mics equipped in commodity laptops, when turned on (i.e., while recording), emanate electromagnetic (EM) signals. The emanation stems from the cables and connectors that carry the clock signals to the mic hardware, ultimately to operate its analog-to-digital converter (ADC) (see §4.1). TickTock captures this leakage to identify the on/off status of the laptop mic. Figure 1 depicts the process of utilizing TickTock. The user locates TickTock device – consisting of a small EM probe — on the external housing of the laptop near the leakage location. When the mic starts recording, TickTock detects the clock signal and alerts the user (e.g., LED lights up). We envision TickTock to have a form-factor, similar to a USB drive (Figure 1), that can be adhered to the external of the laptop for detecting mic on/off status. However, TickTock’s current fully-functional prototype has a table-top form-factor (Figure 2), but we see several opportunities to miniaturize this further (see §8).
Designing TickTock leads to three significant challenges. First, the frequency of the mic clock signal is unknown as its value varies across devices (typically ranging between 512 kHz to 4.8 MHz), particularly depending on the audio codec chip. Second, the location of maximum leakage of the EM signals due to the mic clock signals is also unknown, as it depends on the underlying location of the leaking cables and connectors. Third, as the EM signals captured typically include noise from neighbouring signal lines, we need to devise a robust mechanism for preventing false predictions.
To overcome the aforementioned challenges, TickTock uses a one-time bootstrapping process per device model to infer the mic clock frequency (), as well as the maximum leakage location (). In order to solve the third challenge of robust detection of clock signals in the presence of noise, TickTock leverages both the fundamental clock frequency as well as the harmonics, which are multiples of the fundamental frequency, to improve detection accuracy.
TickTock has several advantages. First, adversaries with software capabilities cannot evade our detection as TickTock’s approach relies on EM leakage due to the mic hardware, hence making it robust against powerful remote attackers. Second, as TickTock’s detection system is completely external to the devices themselves, it places minimal trust on the device manufacturers and software vendors.
We evaluate TickTock on a total of 30 laptops, with EM signals collected for over ten hours to demonstrate that TickTock detects mic activities across most laptop brands we tested including Lenovo, Dell, HP and Asus. We comprehensively evaluate TickTock’s performance over different mic-based applications (e.g., Zoom, Audacity), non-mic based applications (e.g., Google News, YouTube), as well as different audio driver implementations (e.g., Ubuntu vs. Windows). In addition, we also evaluate its real-time performance, as well as its robustness to EM noise. From our analysis, TickTock successfully identifies the mic clock frequency in 27 out of 30 tested laptops. Of the 27 laptops, TickTock consistently predicts mic activities with high true positive and true negative rates.
2. System and Threat Model
We present the system and threat models of TickTock.
System Model. The goal of TickTock is to identify mic recording status (i.e., on/off) in victim-owned devices, such as his/her laptop. We define a mic to be recording (i.e., mic on), whenever it captures physical acoustic signals and converts them into digital signals. Hence, we do not distinguish between cases where the digital signals from the mic are saved to memory vs. when they are discarded, and consider both as recording. TickTock is constrained to only capture EM leakages from close contact on a device (e.g., from external housing of a laptop). Hence, we do not consider mic status detection in spying devices (e.g., audio bugs hidden in a room). Furthermore, TickTock is constrained to only detect mic status in devices with digital mics (i.e., mics that require clock signals for their operation).
Threat Model. In designing TickTock, we consider an attacker with the following goal and capabilities. The attacker’s goal is to stealthily capture audio from the mic of the victim’s laptop. The attacker’s capabilities include launching remote attacks with unconstrained software capabilities. Specifically, we consider powerful attackers that may control malicious or compromised applications, and are capable of exploiting kernel vulnerabilities to modify the audio drivers. However, we assume that the attacker does not have physical access to the laptop, and cannot modify the hardware (e.g., embed a standalone audio bug within the laptop).
3. TickTock Usage Scenarios
This section presents the potential usage scenarios of TickTock.
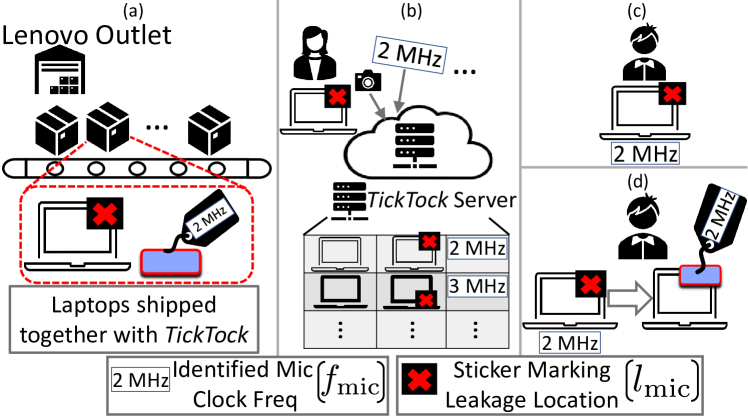
Bootstrapping Scenario. TickTock requires a one-time bootstrapping phase, to infer mic clock frequency, , and maximum EM leakage location, , for each device model. We present three scenarios we envision for different entities performing bootstrapping.
(1) Bootstrapping by Manufacturers. Laptop manufacturers, e.g., Lenovo, can perform the bootstrapping phase for their products. Following which, as depicted in Figure 3(a), they ship each of their laptops with – (a) an accompanying TickTock device, that is set to detect the (e.g., 2 MHz), and (b) a sticker placed on the laptops (e.g., in the top-right corner), in order to mark .
(2) Crowd-sourced Bootstrapping. A crowd-sourced approach (see Figure 3(b)) is where average users conduct bootstrapping on one/more devices, and upload detected and to TickTock’s server. This information can be utilized when users deploy TickTock.
(3) User-level Bootstrapping. TickTock’s bootstrapping is conducted by the user (Figure 3(c)) intending to use TickTock on his/her laptop.
Deployment Scenario. To use TickTock (Figure 3(d)), the user leverages the bootstrapping information, and sets on the TickTock device. Subsequently, the user places the TickTock device on to enable TickTock to function as a mic on/off status indicator.
4. Background
We provide background on the role of clock signals in determining mic status, why they leak, and how their leakage can be detected.
4.1. Digital MEMS Mics
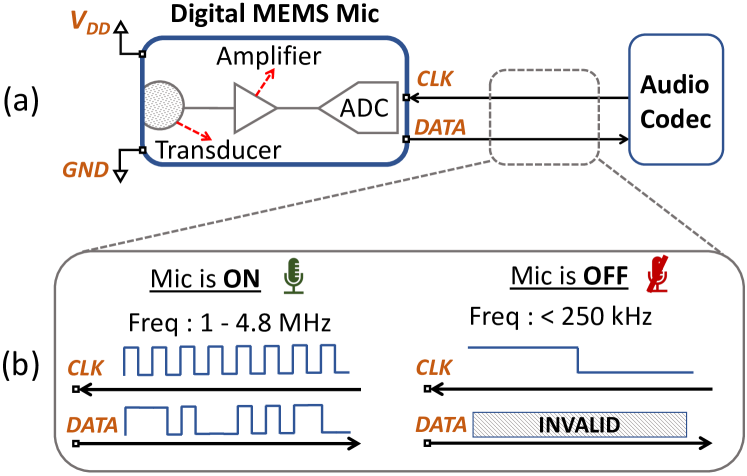
Laptops typically contain Micro-Electro-Mechanical systems (MEMS) mics mainly due to their compact form-factor and better noise performance (Hackster.io, 2020; Brooke, 2019). Amongst them, digital MEMS mics, which are immune to electromagnetic interference (EMI), are a preferred alternative. This is because in laptops, the long cables or PCB traces carrying mic data lines may run close to electromagnetic disturbances such as the laptop’s liquid crystal display (Tagliavini, 2018; Lewis, 2013). Digital mics sample the analog signal to output data in the form of discrete, high amplitude signals, alternating between the two extreme voltage levels – representing 0 and 1 respectively. As depicted in Figure 4(a), digital mics contain an analog-to-digital converter (ADC) within the mic housing, and the ADC’s operation is driven by an input clock signal. Furthermore, these mics support a wide range of operating clock frequencies from about 512 kHz to 4.8 MHz (Knowles, 2022a; InvenSense, 2022).
Role of Clock Signals in Mics
In digital MEMS mics, clock signals function as a control signal that can switch the mic between several power modes. As depicted in Figure 4(b), when the mic is provided with a clock signal in the frequency range around MHz, it enters active mode where it consumes about 0.5 mA of current, and hence is capable of capturing audio (Knowles, 2022b, c, d). On the other hand, when the mic is provided with clock signals whose frequencies are below 250 kHz, the mic enters sleep mode 111 Some mics also support a low-power mode for clock frequencies from 512 kHz to 1 MHz, suitable for wake-word detection in voice-enabled applications. in order to reduce power consumption ( ) (Infineon, 2018). In this work, we identify this difference in clock frequency when the mic is in active mode (i.e., the mic is on), and when in sleep mode (i.e., mic is off), from the EM leakage signals, in order to infer mic’s on/off status.
4.2. Clock Signals and their Detection
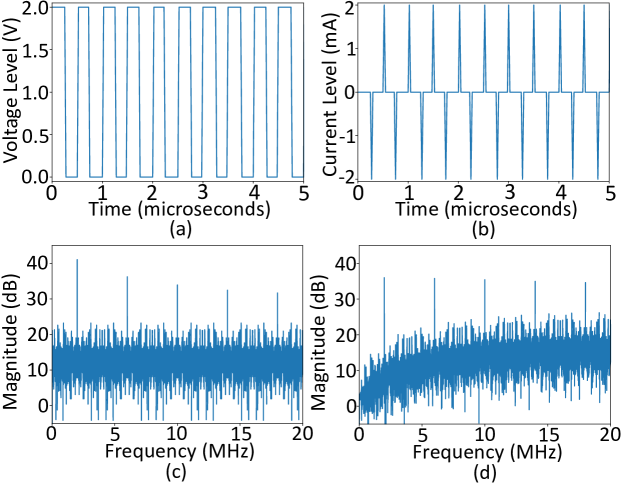
Clock signals, expressed as voltage in the time domain (Figure 5(a)), are periodic square waves with a fixed time period (denoted by T), and has a fundamental frequency, . When observed as current in the time domain (Figure 5(b)), clock signals are seen as a series of impulses, as the current flows only during a voltage change. Nevertheless, this signal has the same time period, T, and fundamental frequency, .
Due to their periodic nature, as well as the short rise-time for transition between voltage levels (sub-microseconds), clock signals concentrate their energy in the fundamental clock frequency, , as well as its odd harmonics (i.e., ) (see Figures 5(c) and 5(d)). Furthermore, if the clock signals spend unequal time in the high and low voltage states (i.e., if the clock duty cycle deviates from 50%), the radiated signal will additionally include even harmonics, i.e., , and so on, of the fundamental clock frequency, .
4.2.1. Detecting Clock Signals
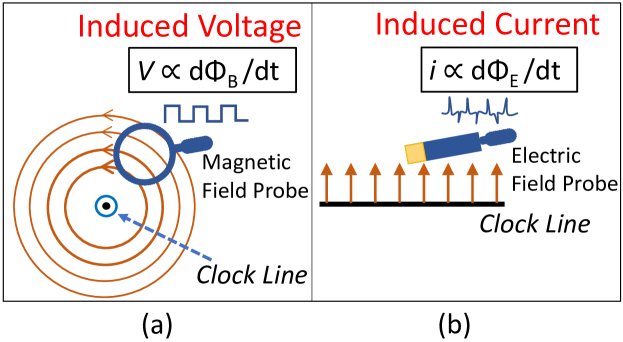
We utilize near-field probes, namely –- magnetic field (or H-field) and electric field (or E-field) probes, to capture the variations in the magnetic field and electric field due to clock signals respectively.
Electromagnetic (EM) signals exhibit different behavior in the near-field (i.e., region within about one wavelength of the leaked signal frequency) as compared to the far-field (those beyond one wavelength). In the near-field, the electric and magnetic fields exist independently, where one could dominate the other depending on the source of clock signal leakage. In the far-field, the two fields are coupled together to form the EM field. As EM signals significantly attenuate before reaching the far-field, especially for lower frequencies (in MHz), we perform our detection in the near-field.
A simplified view of how the probes work is depicted in Figure 6. The magnetic-field probe outputs a voltage proportional to the rate of change of magnetic flux passing through the loop (Figure 6(a)), while the electric-field probe has an induced current proportional to the change in electric-field experienced by the conductor at the probe’s tip (Figure 6(b)). In particular, for the magnetic-field probe, the loop size determines its sensitivity to weak EM signals, where a loop with larger radius is more sensitive.
4.3. Factors of Clock Signal Leakage
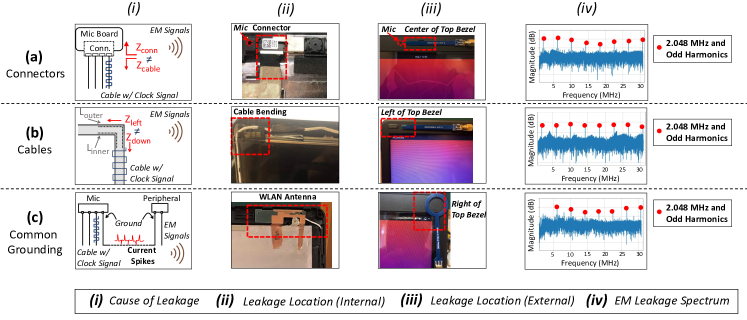
As depicted in Figure 7, we identify three potential factors, namely – (a) connectors, (b) cables, and (c) common grounding, that lead to EM leakage of clock signals. For each factor, we explain their causes of leakage based on theory (part (i) in figure), and identify the exact leakage location in a laptop that leaks due to the factor discussed (part (ii)). Subsequently, we capture EM traces from the exterior of the laptop (part (iii)), to finally obtain the EM leakage spectrum containing the mic clock signals (part (iv)). In order to capture the leaked EM signal, we place the near-field probe at the leakage location, and utilize the setup described in Section 5.1. We now explain each leakage factor in detail below.
4.3.1. Leakage (a) – Connectors
Impedance mismatch in connectors is a major contributor to EM emanation. As depicted in Figure 7(a), when the impedance values of two adjacent elements, e.g., a connector () and a cable carrying clock signals () are mismatched, part of the transmitted signal can be reflected and emitted as EM signals. The amount of reflection, or reflection ratio, can be approximated as: , where and refer to the impedance of the source element and the receiving element, respectively. This reflection ratio is directly proportional to the amount of EM emission. Such EM emission issues occur when circuit designers do not take into account the additional impedance that may be produced on cables while carrying high frequency signals.
In order to confirm the theory, we perform a teardown on Dell Latitude E5570 laptop where the connector is adjacent to the mic. As depicted in Figure 7(a)-(ii), we identify the connector’s location on the right side of the mic. Furthermore, by placing an E-field probe on the laptop’s exterior (Figure 7(a)-(iii)) at the same location, we obtain the EM spectrum with the clock frequency (2.048 MHz) and its harmonics as depicted in the figure (Figure 7(a)-(iv)), confirming that connectors indeed lead to EM leakage.
4.3.2. Leakage (b) – Cables
As depicted in Figure 7(b)-(i), sharp turns in cables and PCB traces change the impedance characteristic of the cables due to difference in the propagation delay resulting from unequal lengths between inner (i.e., ) and outer sides (i.e., ) of the PCB traces and cables. Consequently, these unaccounted impedance changes cause impedance mismatch between two sides of the cable (e.g., , and as depicted in the figure), leading to EM emissions. We confirm this source of leakage by performing a teardown of a Fujitsu Lifebook222Note that we utilize different laptops to demonstrate different leakage factors that may dominate in different laptops. in which the microphone cables bend along the top-left corner of the laptop (Figure 7(b)-(ii)). We identify the clock frequencies and their harmonics by placing the near-filed probe on the laptop’s exterior at the same location (Figure 7(b)-(iii),(iv)).
Similar to bending of cables, usage of flexible PCBs (or flex cables) for connecting mic board to the audio codec, can result in EM signal leakage due to their flexible nature. While adding grounding copper layers can shield flex PCBs from leakage, such additional makes the PCB rigid, hence ruining their utility (Yogendrappa, 2022).
4.3.3. Leakage (c) – Common Grounding
As clock signals have high current slew rate (i.e., high ), current spikes in mic ground lines lead to similar spikes in other peripherals with shared ground (Figure 7(c)-(i)) (Huang et al., 2003; Murata Manufacturing Co., 2022b). Consequently, this results in EM emissions of mic clock frequencies at locations distant from the mic clock lines. In particular, we observe this phenomenon at the location of the WLAN antenna in the top-right corner of the bezel of Dell Latitude E5570 laptop as depicted in Figure 7(c)-(ii).
5. Feasibility Study
By means of preliminary experiments, we demonstrate the feasibility of mic clock leakage signals serving as a proxy for mic status.
5.1. Feasibility Setup
Our setup (Figure 2) consists of – a test device (e.g., laptop), a near-field probe (E-field / H-field) that captures EM leakage signals, connected to a 27 dB wideband RF low-noise amplifier (with an input voltage of 10V DC) to amplify the weak EM signals, which is in-turn connected to an SDRPlay RSP-1A software defined radio (SDR) that captures and digitizes the signals in the frequency range of interest, and finally an RPi 4B, executing GNU Radio Companion software, that performs signal processing (”gnuradio”, 2021; Components, 2022; MiniCircuits, 2022; AliExpress, 2022a, b).
5.2. Clock Signals as Mic Status Indicators
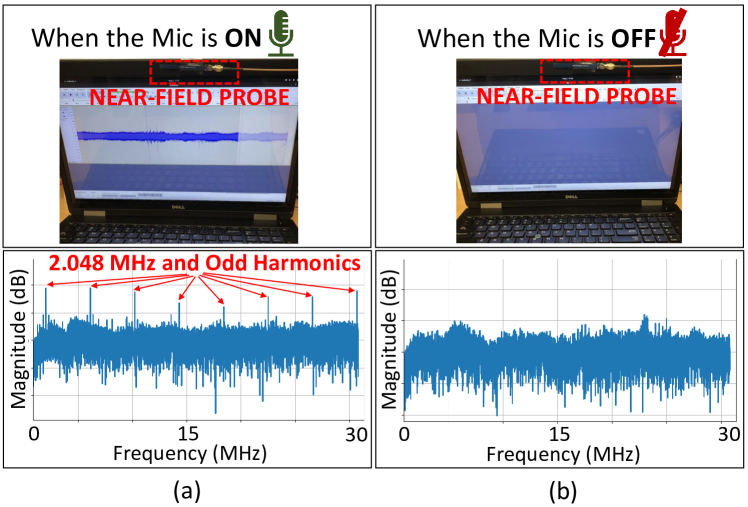
To confirm if the clock leakage signals can serve as a mic status indicator, we perform experiments on Dell Latitude E5570 laptop. We place the near-field probe (specifically, E-field) at a location of maximum leakage, i.e., near the connector for this laptop (from Section 4.3.1). As depicted in Figure 8, the mic clock frequencies, i.e., 2.048 MHz and odd harmonics, are present only when the mic is on (Figure 8(a)), and are absent otherwise (Figure 8(b)). This preliminary experiment suggests that presence/absence of clock signals can serve as proxy for indicating mic’s on/off status respectively. In the following sections, we elaborate on how we identify the mic clock frequency and leakage location, as well as perform comprehensive experiments to test the robustness of TickTock.
6. Design and Implementation
We now present the design and implementation of TickTock.
6.1. Design Overview
TickTock leverages mic clock signals from the leaked EM signals in order to serve as a mic on/off status indicator. Recall from §3 that TickTock’s design consist of two phases, namely bootstrapping and deployment phases. Bootstrapping is a one-time phase where we identify the mic clock frequency, , as well as the mic clock’s maximum leakage location, , of a certain device model. Subsequently in the deployment phase, a user with the same device model, utilizes the identified frequency, , and location, , in order to predict mic status of his/her device.
During bootstrapping (Figure 9(a)), we identify the mic clock frequency, , by performing two scans (Scans (a) and (b)), in the region near the mic (e.g., laptop’s top bezel) with a near-field probe – once when the mic is on, and the second time when the mic is off. A scan consists of probing multiple locations in a region (e.g., near the mic) and observing the EM signals at each location over multiple time periods. Following the scans, we identify as the frequency that occurs uniquely only in the EM signals when the mic is on, and has maximum occurrences compared to all other unique frequencies. Subsequently, in order to identify the maximum leakage location, , we perform a third scan (Scan (c)), by determining a location with maximum leakage score, which we compute based on the detection of the identified and its harmonics.
In the deployment phase (Figure 9(b)), a user places the near-field probe at location, , identified during bootstrapping, for mic status detection. TickTock predicts that the mic is on, only if the set of detected clock frequencies from the EM signals (i.e., the output of Clock Frequency Detection module in Figure 9), contains exactly one frequency which equals the mic clock frequency, . Hence, TickTock predicts that the mic is off even when is detected along with other spurious frequencies, in order to minimize false predictions. However, TickTock tolerates some error margin (i.e., kHz) around , while predicting that the mic is on.
In the following subsections, we address the three main challenges of TickTock: Challenge 1: Clock Frequency Detection (§6.2), Challenge 2: Mic Clock Frequency Identification (§6.3), and Challenge 3: Maximum Leakage Location Identification (§6.4).
6.2. Challenge 1: Clock Frequency Detection
One of the main challenges in robustly detecting clock frequencies is the presence of EM noise from neighbouring components or signal lines in the captured EM signals, leading to detection of spurious frequencies. We overcome this issue by detecting their harmonics, in addition to the fundamental frequency. Both Bootstrapping and Deployment phases utilize this module to take as input the EM leakage signals and output the set of detected clock frequencies.
Figure 10 depicts the module overview. We capture EM signals, or traces, across several frequency spans from the Software Defined Radio (SDR), and compute their spectrum (§6.2.1). Subsequently, we perform mean offset removal (§6.2.2), and identify the peaks in their frequency spectrum based on an amplitude threshold (§6.2.3). We leverage the detected peaks to identify a set of candidate clock frequencies based on the number of harmonics detected as peaks (§6.2.4). Finally, we input the candidate clock frequencies to a pruning stage and eliminate frequencies that are harmonically related to other more likely candidate clock frequencies (§6.2.5).
6.2.1. Signal Capture
In order to capture the EM trace from the SDR, we specify two parameters, namely – center frequency (), and bandwidth (). By doing so, we obtain the EM trace information within frequency span, . However, as the maximum bandwidth supported by many low-end SDRs may not be sufficient to detect the mic clock frequency and their first several harmonics, we sweep across several () adjacent frequency spans in order to obtain leakage signals with an overall larger bandwidth (). Subsequently, we compute the magnitude spectrum of each span (Figure 10(a)), and stitch all the spans together (here ), to obtain the overall spectrum of the leaked EM signals.
6.2.2. Mean Offset Removal
We observe that the noise floors of different spans may be different due to different gain values across spans. This is a result of implementation of automatic gain control feature in several SDRs. We perform span-wise mean-offset removal in order to equalise the noise floors across spans (see Figure 10(b)).
6.2.3. Peak Detection
We first obtain the magnitude spectrum of the entire EM trace, we compute a set of peaks in the frequency domain, namely, (see Figure 10(c)). The peaks satisfy a minimum amplitude cutoff, , and are separated in frequency at least by a distance, . The amplitude threshold, , varies across devices, depending on the level of leakage of the mic clock signals. However, the distance parameter, , is fixed across all devices for both phases ( kHz), which is less than the distance between any two harmonics for any mic clock frequency.
6.2.4. Candidate Clock Frequency ID
Given the set of frequency peaks, , we predict a list of candidate clock frequencies, , and their corresponding set of harmonics, . Recall from §4.2 that clock signals consist of a fundamental frequency (1x), and harmonics (2x, 3x, etc.), as peaks in the frequency domain. Hence, for their robust identification, we require detection of a minimum number (i.e., ) of their harmonics (inclusive of the fundamental frequency). By doing so, we prevent prediction of spurious clock signals.
This is straightforward if we assume that fundamental frequency is always detected as a peak. We can iteratively check the likelihood of each frequency peak, , to be a candidate clock frequency. For example, consider the peaks identified in Figure 10(d-1), where we compute the likelihood of the first peak (denoted by ), to be a clock frequency. We observe that it has a total of eight harmonics (1x, 3x, …, 15x), hence, frequency, , would be added to the set of candidate clock frequencies, (default value of threshold, ).
However, the aforementioned approach does not work if the fundamental frequency is missing (see Figure 10(d-2)). In fact, as we show later in §7.2, more than 60% of the EM traces have a missing fundamental frequencies. Hence, we check the likelihood of each peak to not only be the fundamental frequency, but also a harmonic of a potential clock frequency. For example, for the first peak (denoted by ) in Figure 10(d-2), we check for its likelihood to be a third harmonic. By doing so, we indirectly check for the likelihood of the missing fundamental () to be candidate clock frequency. In general, we check for each peak’s likelihood to be one of the first ‘H’ harmonics (), thereby handling the case of not just the missing fundamental, but also its several harmonics. Finally, this module outputs the set of candidate clock frequencies, , and their corresponding set of detected harmonics, .
6.2.5. Clock Frequency Pruning
We prune the set of candidate clock frequencies, , by leveraging their harmonics, , to obtain the final set of clock frequencies, , and their harmonics, . We identify frequency pairs, , both belonging to the candidate set, , such that – (1) the set of harmonics of one is a proper subset of the other (i.e., ); or (2) the set of harmonics is identical (i.e., ). In both these cases, we eliminate one of the two frequencies (i.e., or ). Figure 10(e) depicts an example for case (1), where the frequency pair consists of candidate frequencies, MHz, and MHz, where . Clearly, the harmonics of , are a subset of the harmonics of frequency, , hence we prune the frequency, , which is likely a spurious prediction. As an example for case (2), we consider frequencies, MHz, and MHz. All the harmonics of frequency, , are also harmonics of the frequency, as, (e.g., 3x of is 6x of ). We prune the smaller frequency, , as had it been the underlying clock frequency, we would expect to detect intermediate harmonics (e.g., 3.072 MHz) of frequency, MHz, that are not harmonics of frequency, MHz. Finally, after pruning the spurious frequencies, we output the retained clock frequencies, denoted by . Optionally, we also output the number of detected harmonics (), as required in §6.4.
6.3. Challenge 2: Mic Clock Frequency () ID
As part of the Bootstrapping phase, we identify the mic clock frequency, . The main challenge, however, is that its value is device dependent, particularly on the clock frequencies supported by the device audio hardware, hence is not known a priori. To circumvent this problem, we identify by taking as input the EM leakage signals captured from two scans – Scan (a) when the mic is on, and Scan (b) when the mic is off (see Figure 9(a)). Subsequently, we collect a total of and EM traces, respectively, across different locations around the mic (e.g., laptop’s top bezel). Although the scans are performed over the same region, the number of traces, and , can be different. We input each of these traces to the Clock Frequency Detection module (§6.2) to obtain the set of clock frequencies per trace. Note that the number of clock frequencies output can be zero or more, depending on the precise location where the EM trace is captured.
6.3.1. Frequency Aggregation
We now combine the frequencies obtained from all the traces of a particular scan, and output a set of tuples, containing the unique frequencies present and their number of occurrences (i.e., count). In particular, for Scan (a), we obtain the set of tuples, , consisting of – , where frequency, , indicates a distinct frequency, and the count, , indicates the total number of occurrences of the frequency, . Likewise, for Scan (b), we obtain the set of tuples, . Figure 11(a) depicts this with a toy example with three EM traces. Furthermore, among the tuples of a single scan, we merge frequencies that are within an error margin ( kHz) of each other into a single frequency, by summing up their individual count values.
6.3.2. Mic Frequency with Maximum Occurrence Identification
This module takes as input, the set of tuples, , and , obtained from Frequency Aggregation module, in order to output the mic clock frequency, . Figure 11(b) depicts how we first identify the frequencies that uniquely occur in set, (and hence absent in the set, ). Subsequently, we choose as the one with the maximum count value among all the unique frequencies (in cases with more than one unique frequency).
We also identify the average leakage amplitude, corresponding to , by computing the average amplitude of the mic clock signals (i.e., clock frequency and harmonics), in traces where is detected. The average leakage amplitude differs across devices, hence is leveraged as a threshold () for successful detection of in the Clock Frequency Detection module of all the subsequent stages (see §6.2.3).
At the end of this step, if we fail to identify any unique clock frequency across different scanning locations (e.g., top bezel, bottom bezel, and so on), we conclude that TickTock’s technique does not hold for such a device.
6.4. Challenge 3: Max Leakage Location () ID
This module which is part of the Bootstrapping phase, takes as input the EM signals along with their location information, in order to identify the maximum leakage location, , corresponding to the mic clock frequency, , and its harmonics.
The main challenge in identifying the EM leakage location is its dependence on the location of underlying leakage sources (e.g., connectors and cables), which in-turn depends on the device’s hardware layout. Additionally exacerbating the problem, the leakage region can be highly localized, i.e., to an area as small as a few .
In order to identify , we perform a third scan (Scan (c)), with the mic on, along the same scanning region as in Scans (a) and (b) (Figure 9(a)). We input each EM trace captured at each location, (loc to denote location ID step), to the Clock Frequency Detection module (§6.2), and obtain the set of clock frequencies, , as well as the number of harmonics detected per clock frequency, .
6.4.1. Leakage Score Computation
This module takes as input – detected clock frequencies, , their corresponding number of harmonics, , as well as the identified mic clock frequency, , to output a leakage score, . We compute the leakage score as the number of detected harmonics of obtained from the list, . Hence, a location with higher number of detected harmonics for frequency, , has a higher leakage score. However, if is not detected, or if it is detected in addition to other spurious frequencies, we output a leakage score of zero, to indicate the unsuitability of the location for reliable detection of .
6.4.2. Location with Maximum Score Identification
This module takes as input the set of location and leakage score tuples, i.e., , to output , with the maximum leakage score, as the best location for probe placement. In the current implementation of TickTock, this module is performed manually, where-in the person performing the Bootstrapping process decides the best location, by probing several locations, and identifying the location with maximum score as provided by our system (see Figure 11(c)). However, we highlight that this is a one-time effort, as the Bootstrapping phase is performed only once per device. We refer interested readers to – https://bit.ly/3w2QTDA for a video demo on how we user perform this scan.
In general, there could be more than one location with maximum leakage, in which case we choose any one of them as . On the flip side, if we encounter a device with no suitable locations (e.g., with a score of zero everywhere), this implies that we identified a spurious frequency as in the previous step (§6.3), and hence conclude that TickTock’s approach is inapplicable to such a device.
7. Evaluation
We evaluate TickTock comprehensively on several devices and for various differing conditions, to demonstrate its feasibility.
7.1. Experimental Setup
Apparatus. We utilize the same setup described in §5.1, consisting of the device to be tested (e.g., laptop), a near-field probe, RF amplifier, software defined radio (SDR) and an RPi 4B, for our experiments (see Figure 2). We test each laptop using both the near-field probes, namely the E-field and H-field probes. We also custom-design an amplifier with gain of 27 dB for its low power consumption (MiniCircuits, 2022). We leverage RSP-1A SDR (US) that captures signals covering a large portion of radio spectrum, from 1 kHz to 2 GHz, with a maximum bandwidth of 10 MHz (Components, 2022). During the detection process, we sweep across four (overlapping) frequency bands to obtain a total bandwidth of 30 MHz (from MHz) in order to detect mic clock frequencies and their harmonics.
Data Collection. We evaluate TickTock on a total of 30 laptops of popular brands including Lenovo, Dell, HP and Apple, all released in the last ten years (see Figures 12(a) and 12(b)). For consistency of experiments, we run Ubuntu 20.04 LTS with kernel version 5.11.0-27 on each of the laptops (except Macbooks that run Mac OS X). We record audio at 32-bit 48 kHz using the command-line tool, arecord, unless mentioned otherwise (Winkler, 2022). Furthermore, we ensure that the laptop is plugged into power source and that its screen is active throughout. Furthermore, as depicted in Figure 13, we evaluate TickTock’s performance across different mic (7.3.1) and non-mic applications (7.3.2), different audio driver implementations (7.3.3), its robustness to internal and external EM noise (7.3.4, 7.3.5), its real-time performance (7.3.6), the influence due to speaker-access (7.3.7), as well as the effect of varying sound levels (Appendix A.2). For the evaluation, we perform TickTock’s detection in an offline manner, i.e., we identify the clock signals after capturing all traces (except in §7.3.6). Furthermore, we determine the number of harmonics to be identified (i.e., parameter, ) to be three, based on the results from Appendix A.1.
Performance Metrics. We define the following three metrics to evaluate TickTock’s overall results. Device Hit Rate refers to the fraction of total devices tested in which TickTock identifies the mic clock frequency, . Furthermore, we leverage True Positive Rate (TPR) and True Negative Rate (TNR) to evaluate the performance of TickTock in predicting mic status (on vs off) in devices. We consider an EM trace to be a positive example, if TickTock detects as the only clock frequency from the EM trace (and negative example otherwise). Hence, we define TPR as the fraction of all traces that are identified to be positive examples, when the mic is on, and TNR as the fraction of all traces that are identified as negative examples, when the mic is off.
| Device Model |
|
|
A/D | Device Model |
|
|
A/D | Device Model |
|
|
A/D | ||||||||||||
| ASUS Strix | 2048 | ✓ | D | HP Probook 440 G1 | 2352 | ✓ | D | Lenovo X230 | 2048 | ✓ | D | ||||||||||||
| Asus X450v | 2048 | ✓ | D | HP Zbook Studio G5 | 3072 | ✓ | D | Lenovo X250 | 2048 | ✓ | U | ||||||||||||
| Dell Inspiron 13 | 3072 | ✓ | D | Lenovo P14s gen 1 | 2400 | ✓ | U | Lenovo X260 | 2048 | ✓ | D | ||||||||||||
| Dell Inspiron 5459 | 2048 | ✓ | D | Lenovo T430U | 2048 | ✓ | D | Razer RZ09-0102 | 2048 | ✓ | D | ||||||||||||
| Dell Inspiron 7572 | 2048 | ✓ | D | Lenovo T460s | 2048 | ✓ | U | Samsung Chronos | 2048 | ✓ | U | ||||||||||||
| Dell Latitude E5570 | 2048 | ✓ | U | Lenovo T470S | 3072 | ✓ | U | Terrans Force T5 | 2048 | ✓ | U | ||||||||||||
| Dell Latitude E7450 | 2048 | ✓ | U | Lenovo T590 | 2048 | ✓ | U | Toshiba Portege | 6144 | ✓ | U | ||||||||||||
| Dell XPS L321x | 2048 | ✓ | D | Lenovo X1 Carbon G7 | 2400 | ✓ | U | Mac Pro 2014 15” | – | ✗ | U | ||||||||||||
| Fujitsu Lifebook | 2048 | ✓ | D | Lenovo X1 Extreme G3 | 2400 | ✓ | U | Mac Pro 2017 13” | 2823 | U | |||||||||||||
| HP Envy 13 | 3072 | ✓ | D | Lenovo X13 Gen 2 | 2400 | ✓ | U | Mac Pro 2019 16” | – | ✗ | U |
7.2. TickTock Performance
We present TickTock’s overall performance by first presenting the results of bootstrapping followed by their performance in determining mic’s on/off status.
7.2.1. Bootstrapping Summary
In Table 1, we present 30 laptops we test, along with their detected , if any, from the bootstrapping phase. We achieve a device hit rate of 90%, as we successfully identify for 27 laptops, with ranging between MHz. Figure 14 depicts prominent leakage locations, , observed on laptops that have their mics located on either sides of the webcam on the top bezel.333We also present detailed evaluation results in Appendix B including information such as the leakage amplitude, performance due to each near-field probe and the harmonics detected per laptop. The leakage locations within regions annotated in yellow potentially correspond to locations of connectors (either top/bottom), while those annotated in blue represent potential locations of cable bends or presence of other peripherals (see §4.3).
Although our approach works well on 90% of the tested laptops, including all tested models from popular vendors such as Lenovo, Dell, HP and Asus, TickTock fails to detect the mic clock signals in three laptops, all of which are Apple Macbooks. On each of the tested Macbooks, the mics are located either on the left or right side of the keyboard (along the speaker vent), and are connected to the motherboard via short flex cables. We believe that the aluminium enclosure of Macbooks, along with the usage of short flex cables, result in significantly attenuating the leakage signal (YouTube, 2022a, b, c; PortableOne, 2015). Of the three laptops, we encounter a confounding case in Macbook Pro 2017 (13”), where a mic clock frequency ( MHz) with a low leakage amplitude is detected, although its detection fails to be consistent across different audio recording applications (i.e., clock frequency is absent for some audio recording apps but present for others). We tested ten additional Macbooks using a different setup consisting of a high gain amplifier and spectrum analyzer. However, TickTock is still unable to detect the clock signals consistently. The results are shown in the Appendix B.1.
7.2.2. Mic Activity Detection Efficacy
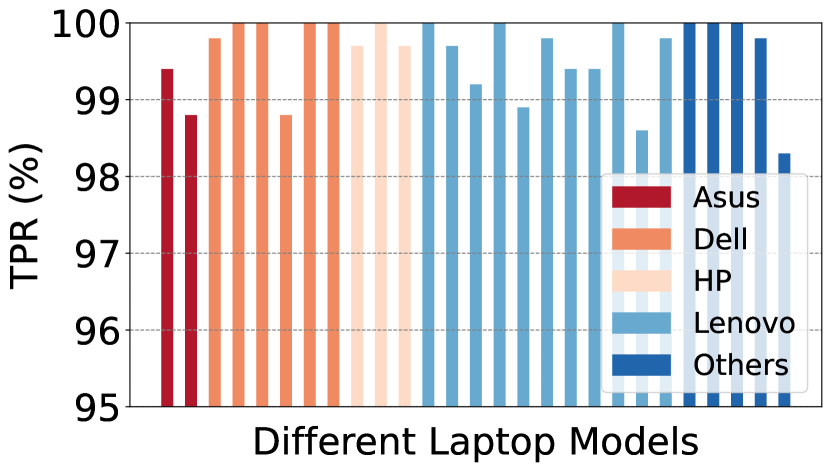
In order to verify how reliable the clock signals are in identifying mic activity, we collect EM traces for three minutes at an average rate of 3.6 traces per second (i.e., a total of 650 traces), while – (1) running an audio recording application (i.e., arecord); and (2) not running any audio recording application. We obtain a high true positive rate of 99.6% (i.e., ), and a 100% true negative rate (i.e., ) across the 27 successful laptops (see Figure 15(a)). Furthermore, the minimum true positive rate across all laptops is above 98% (see Figure 15(b)), depicting the reliability of TickTock as a mic activity indicator.
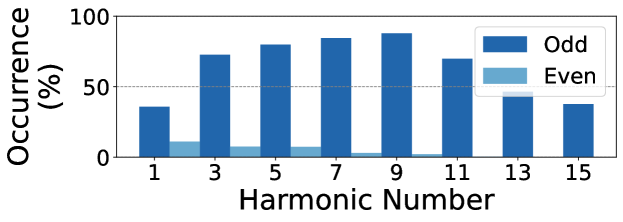
Recall from §6.2 that we detect clock frequencies by identifying their harmonics. Hence, in Figure 16, we plot the prominence of different harmonics in the detected clock signals, as a fraction of all traces with successful clock frequency detection (i.e., across traces). We observe that the odd harmonics are more prominent compared to even harmonics (as expected from Figure 5). Furthermore, we observe that less than of all successful cases contain the fundamental frequency (i.e., the first harmonic), hence validating our design that accounts for missing fundamentals (see §6.2.4).
7.3. Differing Experimental Conditions
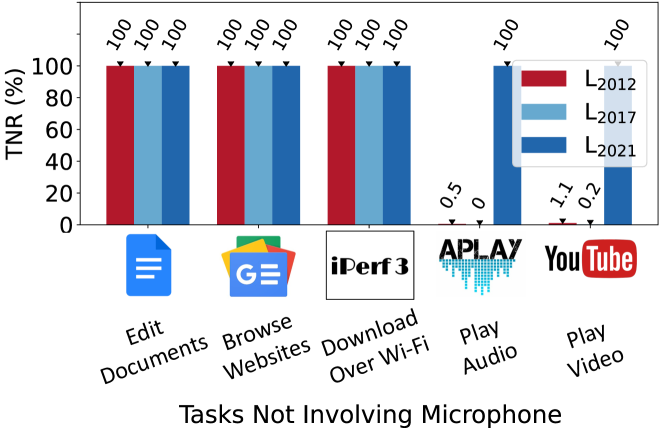
We evaluate TickTock’s performance over several factors. For this purpose, we choose three representative laptops, Lenovo Thinkpad T430U (), Lenovo Thinkpad T470s (), and Lenovo X1 Extreme Gen 3 (), released in 2012, 2017 and 2021, respectively. We report our results by capturing 650 EM traces over three minutes per device for each differing condition.
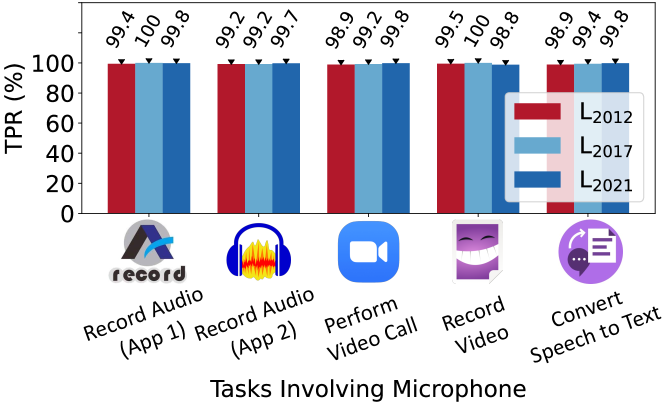
7.3.1. Running Mic-based Applications
To evaluate TickTock’s performance in detecting mic on status while capturing audio, we report the true positive rate (TPR) obtained on running five applications namely – Audacity and arecord (for recording audio), Zoom (for performing video calls), Cheese (for recording video), and browser-based IBM Watson Speech to Text Service (for transcribing audio). TickTock obtains high TPR for all applications over the three laptops, with a minimum TPR of 98.8% (i.e., ) obtained for recording video on laptop, (see Figure 17). These results represent the consistency of TickTock in identifying mic on status.
7.3.2. Running Non-mic based Applications
To evaluate false triggers during mic off state, we evaluate TickTock by performing everyday tasks (that do not involve the mic) such as taking notes, browsing news, downloading data at high speed (100 Mbps) over Wi-Fi, playing audio and playing video, using five representative applications/tools, namely, Google Docs, Google News, iPerf3, aplay, and YouTube, respectively. From Figure 18(a), we observe that, for the first three tasks, TickTock obtains a TNR of 100% across all laptops. However, for the last two applications involving access to speaker, although the newest laptop, , continues to achieve 100% TNR, the older laptops, i.e., and , obtain a TNR of less than 2%. We defer the explanation of this result to §7.3.7.
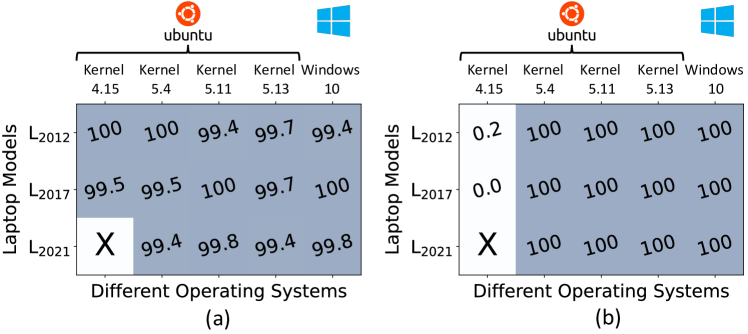
7.3.3. Effect of Different Audio Driver Implementations
We evaluate the effect of different audio driver implementations on TickTock’s performance. We consider drivers that are part of the OS – Ubuntu 16.04 (kernel v4.15), Ubuntu 18.04 (kernel v5.4), Ubuntu 20.04 (kernel v5.11 and v5.13), as well as the driver on Windows 10. We evaluate all laptop-OS combinations, with the exception of laptop, , with Ubuntu 16.04, due to lack of compatibility (depicted by a in the figure). As depicted in Figure 19, for all OSes except Ubuntu 16.04, the TPR and TNR are consistently above 99% across all laptops. However, in the case of Ubuntu 16.04, for laptops, , and , although the TPR is above 99%, the TNR is close to 0%. On further analysis, we infer that in this driver implementation, the clock signal is always provided to the mic, irrespective of whether the mic is on or off, resulting in a low TNR. We believe that the future Linux driver implementations’ retract clock signals in order to enhance security (i.e., prevent accidental audio capture), while conserving power in laptops. Hence, newer driver versions will likely follow suit, thereby improving TickTock’s accuracy.
7.3.4. Effect of Internal Electromagnetic Noise
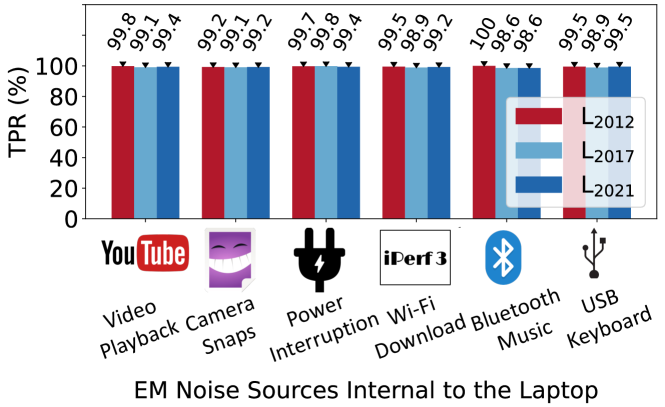
We evaluate the effect of electromagnetic noise arising from within the laptop, e.g., due to screen, camera and radio communication. As depicted in Figure 20, we evaluate TickTock’s performance when the mic is on in the background, along with the following six sources of EM interferences – (1) Video Playback: fluctuations in screen content due to high bit-rate video playback, (2) Camera Snaps: photo capture (once every five seconds) from a camera application, (3) Power Interruption: disruption in power (once every five seconds) due to plugging-in and plugging-out of the laptop charging cable, (4) Wi-Fi Download: data download over Wi-Fi at 100 Mbps using iPerf3, (5) Bluetooth Music: music playback via Bluetooth; and (6) USB Keyboard: serial communication via USB to capture keyboard input. As depicted, we obtain a TPR above 98% for all the three laptops across all scenarios. This good performance can be attributed to be the spatial specificity of the near-field probes to capture EM leakage in a highly localized region (i.e., within a few centimeters).
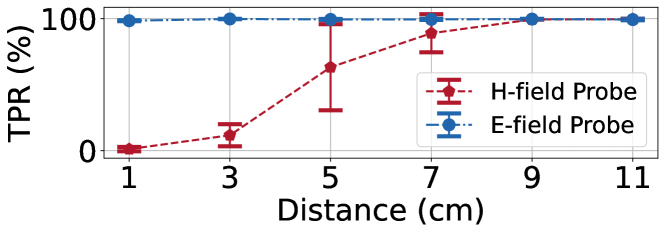
7.3.5. Effect of External Electromagnetic Noise
Recall that the mic clock frequencies and their harmonics are in the lower MHz range, i.e., from MHz. Hence, we evaluate TickTock in the presence of EM noise within our capture range, particularly from a radio frequency identification (RFID) reader, RFID-RC522, with a center frequency of 13.56 MHz. We test the effect on TickTock’s TPR by varying the distance of the reader from the near-field probes, i.e., the E-field probe or the H-field probe (with 5 mm loop diameter), placed on the laptops. For this experiment, we consider three laptops, namely Lenovo Thinkpad T430U, Dell Latitude E5570, and Lenovo X1 Extreme Gen 3, that are capable of detecting mic clock frequencies with both the above mentioned probes.
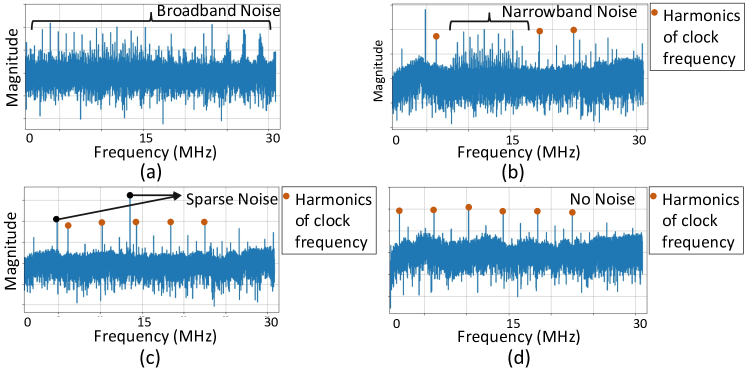
As depicted in Figure 21, we observe that the E-field probe remains unaffected in the presence of the RFID reader, by achieving an average TPR of 98.5% (across the three laptops) even at the closest distance of 1 cm. This is because the RFID readers create a magnetic field in the near-field region, and hence not influencing the E-field probe. On the other hand, we observe that the H-field probe is severely affected at close distances, with TickTock achieving an average TPR of 1.1% at a distance of 1 cm. However, we observe that the TPR increases with distance, hence at a distance of 9 cm, the average TPR increases to a high value of 99.43%. Figure 22 depicts the frequency spectrum of EM leakage for one of the laptops (i.e., Lenovo Thinkpad T430U) with the reader placed at distances of 1 cm, 5 cm, and 9 cm from the H-field probe. We observe that at the closest distance (i.e., 1 cm), the EM noise is broadband, i.e., covers a wide frequency band, and hence completely masks the underlying clock signals. However, as the distance increases, the frequency range of the noise decreases, leading to a more accurate detection of the harmonics of the mic clock frequency.
7.3.6. Real-time Performance
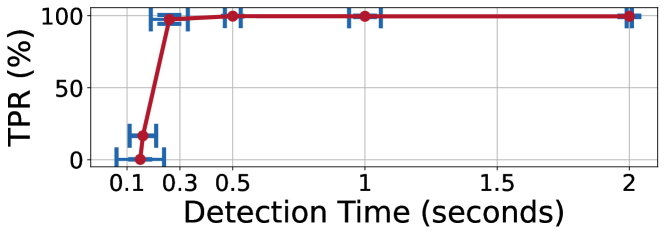
Recall that in the evaluations presented so far, we conduct TickTock’s detection in an offline manner, i.e., we compute the clock signals present in the trace, after all the EM traces are collected. In this evaluation, we test the practicality of TickTock by performing the detection in real-time. In particular, we compute the TPR by varying the detection time (i.e., time taken to output a prediction of mic status) from seconds. We vary this indirectly by varying the rate at which we read from the SDR. Furthermore, we report the average detection time as its value depends both on the frequency-switching rate of the SDR hardware as well as TickTock’s computation time, both of which may change.
As depicted in Figure 23, TickTock achieves a high TPR of 97.5% and 99.7%, for average detection times of 0.26 s and 0.5 s, respectively, demonstrating the feasibility of TickTock as a real-time mic status indicator. For average detection time lower than 0.26 s, the increase in data read-rate results in significant data overflows from the SDR, and hence results in reduction in the TPR to as low as 0.27%, for an average detection time of 0.15 seconds.
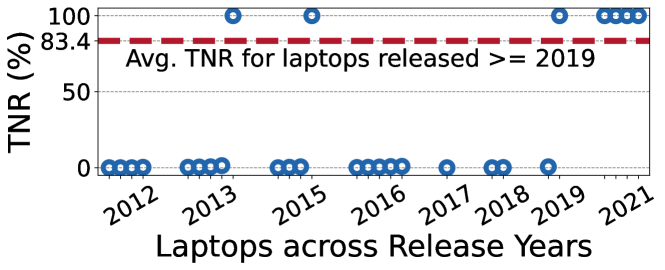
7.3.7. Influence due to Speaker Access
We also test for potential false triggers that may result in mic clock frequency detection when the speaker is on. This is because the mic’s ADC and speaker’s DAC clock lines may be shared, especially if they are both controlled by the same audio codec IC. As this property of sharing clock lines is hardware-dependent, we perform this evaluation on all the 27 laptops. In Figure 24, we depict the true negative rate (TNR) of all laptops, sorted chronologically by release year. We observe that in 20 out of the 27 laptops, access to speaker also triggers the same clock frequency, hence resulting in a low TNR of 26.2% on average across all laptops. However, we notice a significant increase in TNR, to an average of 83.4%, for all laptops released on or after 2019 (which includes 5 Lenovo and 1 HP laptops). This increase in TNR over the last three years seems promising, hence we believe TickTock has increased utility for laptops of the upcoming years.
8. Discussion
We present important points related to TickTock’s detection.
Mic Status Detection on Non-Laptop Devices. We evaluate TickTock on 40 non-laptop devices, including smartphones, tablets, smart speakers and USB web-cameras. Detailed findings are reported in Appendix C and Table 4. To summarize, we successfully detect mic clock frequency in 21 out of 40 devices. Of the successful devices, we observe an average TPR and TNR of 86.2% () and 100% (), respectively. We note three key reasons for TickTock’s lower detection performance on non-laptop devices:
-
•
Analog vs. Digital Mics: Some smartphone models contain analog mics instead of digital mics. We believe there are several reasons for future devices to transition to digital mics: Digital mics– (1) host an ADC, hence require fewer components to function, (2) are highly integrable into systems only containing general purpose ICs as they output digital data; and (3) are immune to EM interference compared to analog mics, hence robust to noise. Finally, (4) digital mics are known to be easier to design (Brooke, 2019; Tagliavini, 2018).
-
•
Devices without Power Constraints: Voice-enabled smart speaker devices (including Google Home and Echo Dot) do not have any power constraints as they are always plugged-in, and may not cut-off the clock frequency even when not recording. We observe such cases in four out of eight tested smart speakers.
-
•
Compact Form-Factor: Devices with compact form-factors, e.g., smartphones enclose shorter cables (compared to laptops), and likely cause reduced EM leakage in lower radio frequencies (Murata Manufacturing Co., 2022a).
Miniaturizing TickTock’s Form-Factor. Recall from Figure 2 that TickTock’s current prototype consists of a variety of components stacked to the side of the laptop, while our vision is a device with a small USB drive form-factor that can be placed in contact with the laptop’s exterior (Figure 1). One approach to reduce overall setup size is to leverage SDRs with smaller dimensions. Hence, we evaluate TickTock with different SDRs such as AirSpy HF+ (with small form-factor – mm), and achieve high TPR above 98% (refer to Appendix D). Another approach would be to redesign the whole setup into a single printed circuit board, consisting of the RF amplifier, a high sampling ADC (50-60 Msps), as well as the controller IC which runs TickTock’s logic (Instruments, 2022b, c, a; Technology, 2022).
Absence of Leakage due to Clock Signals. TickTock’s technique relies on the EM leakage from clock signals due to imperfection in hardware design including impedance mismatch at connectors, cables. Hardware designers are constantly improving the emissions from clock signals in their circuits, by incorporating techniques such as differential signaling, spread spectrum clocking, and reduction in trace length, in addition to physical methods such as shielding with metal (Lapiedra, 2009; Microsemi, 2015; Murata, 2022; Robin Getz, 1996). However, none of these approaches are foolproof, as they can only reduce the amount of leakage. As an example, metal shields around cables typically have slits to serve as heat vents, which can in-turn radiate EM signals in certain frequency ranges, subject to the dimensions of the slit.
9. Related Work
We now present closely related work with TickTock.
Eavesdropping Detection. Researchers have proposed hardware and software-based approaches to detect mic eavesdropping (Singh et al., 2021; Mitev et al., 2020; Valeros and Garcia, 2017; Mirzamohammadi et al., 2017; Farley and Wang, 2010; Sharma et al., 2022). One of the works utilizes SDRs to detect audio bugs in the environment based on their wireless transmissions (Valeros and Garcia, 2017). However, none of these approaches apply to detect eavesdropping mics in laptops. One representative work amongst the software-based approaches proposes a system for trustworthy mic-usage notification by inserting run-time checks in the kernel/hypervisor (Mirzamohammadi and Sani, 2018). However, unlike these approaches, TickTock is resistant to kernel/hypervisor compromise, and its detection can easily be extended to work on devices with different specifications, e.g., different OSes.
Acoustic Jamming. One line of work explores generation of audio jamming signals – both audible and inaudible, in order to prevent mics in commodity devices from capturing meaningful audio (Roy et al., 2017, 2018; Chen et al., 2020; Li et al., 2020; Zhu et al., 2021; Liu et al., 2021). In particular, one of the works engineered an ultrasound array in a wearable bracelet form-factor that produced inaudible jamming signals to prevent any attacker device from recording (Chen et al., 2020). Our work is complementary to these works in that TickTock detects eavesdropping mics, while they disable them.
Electromagnetic Side Channels. There are several attacks leveraging electromagnetic leakage signals to infer cryptographic keys, screen content, passcodes, USB data, neural network architecture, and even capture audio (Liu et al., 2020; Maia et al., 2021; Jin et al., 2021; Camurati et al., 2018; Su et al., 2017; Choi et al., 2020). However, unlike all the above, our work leverages the leaked EM signals for defense, rather than attack. One particular work utilises leaked electromagnetic signals from local oscillators to identify wireless eavesdroppers (Chaman et al., 2018). However, unlike this work that detects Wi-Fi receivers, our approach detects audio receivers, i.e., mics.
10. Conclusion
We present TickTock, a novel laptop mic on/off status detection, based on EM leakage of clock signals. We design and implement TickTock, as well as perform real-world evaluation on 30 popular laptops and observe mic detection in 27 laptops. Through this work, we explore a novel direction of utilizing EM side-channel information as part of a defense, rather than an attack. As part of future work, we hope to utilize TickTock to identify access to other sensors including cameras and inertial measurement unit (IMU) sensors.
11. Acknowledgements
We thank Wang Gucheng, Nitya Lakshmanan, Siddharth Rupavatharam and Niel Warren for valuable discussions and/or feedback on our paper. This work is supported by the Singapore Ministry of Education Academic Research Fund (R-252-000-B48-114), the Yonsei University Research Fund (2021-22-0337), the Institute of Information and Communications Technology Planning and Evaluation (IITP-2022-0-00420) grant funded by Ministry of Science and ICT (MSIT) in Korea, and the Google PhD Fellowship 2021.
References
- (1)
- AirSpy (2022) AirSpy. Accessed 2022. HF+ Discovery. https://airspy.com/airspy-hf-discovery/.
- AliExpress (2022a) AliExpress. Accessed 2022a. Near-field Probes. https://www.aliexpress.com/item/1005003981693117.html.
- AliExpress (2022b) AliExpress. Accessed 2022b. RF Low Noise Amplifier. https://www.aliexpress.com/item/32914316471.html.
- Anritsu (2022) Anritsu. Accessed 2022. MS2668C Spectrum Analyzer. https://www.anritsu.com/en-US/test-measurement/products/MS2668C.
- Audio (2022) Adam Audio. Accessed 2022. A3X Near-field Monitor. https://www.adam-audio.com/en/ax-series/a3x/.
- Brocker and Checkoway (2014) Matthew Brocker and Stephen Checkoway. 2014. iSeeYou: Disabling the MacBook Webcam Indicator LED. In 23rd USENIX Security Symposium (USENIX Security 14). USENIX Association, San Diego, CA, 337–352.
- Brooke (2019) Dave Brooke. 2019. MEMS microphones, why is digital best? https://www.cmlmicro.com/mems-microphones-why-is-digital-best/.
- Camurati et al. (2018) Giovanni Camurati, Sebastian Poeplau, Marius Muench, Tom Hayes, and Aurélien Francillon. 2018. Screaming Channels: When Electromagnetic Side Channels Meet Radio Transceivers. In Proceedings of the 2018 ACM SIGSAC Conference on Computer and Communications Security. Association for Computing Machinery, New York, NY, USA, 163–177.
- Chaman et al. (2018) Anadi Chaman, Jiaming Wang, Jiachen Sun, Haitham Hassanieh, and Romit Roy Choudhury. 2018. Ghostbuster: Detecting the presence of hidden eavesdroppers. In Proceedings of the 24th Annual International Conference on Mobile Computing and Networking. 337–351.
- Chen et al. (2020) Yuxin Chen, Huiying Li, Shan-Yuan Teng, Steven Nagels, Zhijing Li, Pedro Lopes, Ben Y Zhao, and Haitao Zheng. 2020. Wearable microphone jamming. In Proceedings of the 2020 chi conference on human factors in computing systems. 1–12.
- Choi et al. (2020) Jieun Choi, Hae-Yong Yang, and Dong-Ho Cho. 2020. Tempest comeback: A realistic audio eavesdropping threat on mixed-signal socs. In Proceedings of the 2020 ACM SIGSAC Conference on Computer and Communications Security. 1085–1101.
- Cimpanu (2018) Catalin Cimpanu. 2018. FBI solves mystery surrounding 15-year-old Fruitfly Mac malware. https://www.zdnet.com/article/fbi-solves-mystery-surrounding-15-year-old-fruitfly-mac-malware/.
- Components (2022) RS Components. Accessed 2022. Software Defined Radio SDRPlay RSP-1A. https://docs.rs-online.com/6f19/0900766b81707c72.pdf.
- Cook (2020) David Cook. 2020. Hackers can access your mobile and laptop cameras and record you – cover them up now. https://theconversation.com/hackers-can-access-your-mobile-and-laptop-cameras-and-record-you-cover-them-up-now-135933.
- eBay (2022) eBay. Accessed 2022. Lenovo Tablet M10 microphone flex cable. https://www.ebay.com/itm/165148464369.
- Everest (2022) Everest. Accessed 2022. ES7243 ADC Chip. http://www.everest-semi.com/pdf/ES7243%PB.pdf.
- Farley and Wang (2010) Ryan Farley and Xinyuan Wang. 2010. Roving bugnet: Distributed surveillance threat and mitigation. Computers & Security 29, 5 (2010), 592–602.
- ”gnuradio” (2021) ”gnuradio”. 2021. GNU Radio Open Software Radio Ecosystem. https://www.gnuradio.org/.
- Hackster.io (2020) Hackster.io. 2020. Why MEMS Microphones Are the Best Choice. https://www.hackster.io/news/why-mems-microphones-are-the-best-choice-for-your-project-fb4c3a61f33d.
- Heinzman (2019) Andrew Heinzman. 2019. What is RAT Malware, and Why Is It So Dangerous? https://www.howtogeek.com/410634/what-is-rat-malware-and-why-is-it-so-dangerous/.
- Henry (2021) Charlotte Henry. 2021. macOS Monterey Tells You Which App is Using Your Mac’s Microphone. https://www.macobserver.com/news/product-news/macos-monterey-tells-app-mac-microphone/.
- Hoffman (2019) Chris Hoffman. 2019. How to See Which Apps Are Using Your Microphone on Windows 10. https://www.howtogeek.com/424153/how-to-see-which-apps-are-using-your-microphone-on-windows-10/.
- Huang et al. (2003) Xudong Huang, Elton Pepa, Jih-Sheng Lai, AR Hefner, David W Berning, Shaotang Chen, and TW Nehl. 2003. EMI characterization with parasitic modeling for a permanent magnet motor drive. In 38th IAS Annual Meeting on Conference Record of the Industry Applications Conference, 2003., Vol. 1. IEEE, 416–423.
- Infineon (2018) Infineon. 2018. MEMS microphone electrical implementation. https://www.infineon.com/dgdl/Infineon-AN558_MEMS_Electrical_Implementation-AN-v01_00-EN.pdf.
- Instruments (2022a) Texas Instruments. Accessed 2022a. ADC32J4x Dual-Channel, 14-Bit, 50-MSPS to 160-MSPS, Analog-to-Digital Converters with JESD204B Interface Datasheet. https://www.ti.com/lit/ds/symlink/adc32j42.pdf.
- Instruments (2022b) Texas Instruments. Accessed 2022b. ADS41xx 14-, 12-Bit, 65-, 125-MSPS, Ultra-Low-Power ADC Datasheet. https://www.ti.com/lit/ds/symlink/ads4142.pdf.
- Instruments (2022c) Texas Instruments. Accessed 2022c. ADS42xx Dual-Channel, 14-/12-Bit, 160/125/65 MSPS Ultralow-Power ADC Datasheet. https://www.ti.com/lit/ds/symlink/ads4242.pdf.
- InvenSense (2022) InvenSense. Accessed 2022. Selecting PDM Microphone Clock Frequencies. https://invensense.tdk.com/download-pdf/an-000111-selecting-pdm-microphone-clock-frequencies-and-decimation-ratios/.
- Jin et al. (2021) Wenqiang Jin, Srinivasan Murali, Huadi Zhu, and Ming Li. 2021. Periscope: A Keystroke Inference Attack Using Human Coupled Electromagnetic Emanations. In Proceedings of the 2021 ACM SIGSAC Conference on Computer and Communications Security. 700–714.
- Knowles (2022a) Knowles. Accessed 2022a. Choosing the right Sisonic Microphone. https://www.knowles.com/docs/default-source/default-document-library/sisonic-design-guide.pdf?sfvrsn=ddda77b1_6.
- Knowles (2022b) Knowles. Accessed 2022b. Multimode I2S Mic Datasheet - SPH06. https://www.knowles.com/docs/default-source/default-document-library/sph0645lm4h-1-datasheet.pdf.
- Knowles (2022c) Knowles. Accessed 2022c. Multimode PDM Mic Datasheet - SPC18. https://www.knowles.com/docs/default-source/default-document-library/spc18p8lm4h-1_marina_datasheet-2.pdf.
- Knowles (2022d) Knowles. Accessed 2022d. Multimode PDM Mic Datasheet - SPG08. https://www.knowles.com/docs/default-source/default-document-library/spg08p4hm4h-1_baracus_datasheet68f91b731dff6ddbb37cff0000940c19.pdf.
- Lapiedra (2009) Justo Lapiedra. 2009. Spread Spectrum Clocking Using the CDCS502/503. https://www.ti.com/lit/an/scaa103/scaa103.pdf.
- Lewis (2013) Jerad Lewis. 2013. Analog and digital MEMS microphone design considerations. https://www.eenewsanalog.com/en/analog-and-digital-mems-microphone-design-considerations/.
- Li et al. (2020) Lingkun Li, Manni Liu, Yuguang Yao, Fan Dang, Zhichao Cao, and Yunhao Liu. 2020. Patronus: Preventing unauthorized speech recordings with support for selective unscrambling. In Proceedings of the 18th Conference on Embedded Networked Sensor Systems. 245–257.
- Liu et al. (2021) Yuchen Liu, Ziyu Xiang, Eun Ji Seong, Apu Kapadia, and Donald S Williamson. 2021. Defending Against Microphone-Based Attacks with Personalized Noise. Proc. Priv. Enhancing Technol. 2021, 2 (2021), 130–150.
- Liu et al. (2020) Zhuoran Liu, Niels Samwel, Léo Weissbart, Zhengyu Zhao, Dirk Lauret, Lejla Batina, and Martha Larson. 2020. Screen gleaning: A screen reading TEMPEST attack on mobile devices exploiting an electromagnetic side channel. arXiv preprint arXiv:2011.09877 (2020).
- Maia et al. (2021) Henrique Teles Maia, Chang Xiao, Dingzeyu Li, Eitan Grinspun, and Changxi Zheng. 2021. Can one hear the shape of a neural network?: Snooping the GPU via Magnetic Side Channel. arXiv preprint arXiv:2109.07395 (2021).
- Mayo (2019) Benjamin Mayo. 2019. Major iPhone FaceTime bug lets you hear the audio of the person you are calling before they pick up. https://9to5mac.com/2019/01/28/facetime-bug-hear-audio/.
- Microsemi (2015) Microsemi. 2015. Spread Spectrum Clocking. https://www.microsemi.com/document-portal/doc_download/135439-white-paper-spread-spectrum-clocking.
- MiniCircuits (2022) MiniCircuits. Accessed 2022. RF Low Noise Amplifier - PSA 8A+. https://www.minicircuits.com/pdfs/PSA-8A+.pdf.
- Mirzamohammadi et al. (2017) Saeed Mirzamohammadi, Justin A Chen, Ardalan Amiri Sani, Sharad Mehrotra, and Gene Tsudik. 2017. Ditio: Trustworthy auditing of sensor activities in mobile and IoT devices. In Proceedings of the 15th ACM Conference on Embedded Network Sensor Systems. 1–14.
- Mirzamohammadi and Sani (2018) Saeed Mirzamohammadi and Ardalan Amiri Sani. 2018. Viola: Trustworthy sensor notifications for enhanced privacy on mobile systems. IEEE Transactions on Mobile Computing 17, 11 (2018), 2689–2702.
- Mitev et al. (2020) Richard Mitev, Anna Pazii, Markus Miettinen, William Enck, and Ahmad-Reza Sadeghi. 2020. Leakypick: Iot audio spy detector. In Annual Computer Security Applications Conference. 694–705.
- Murata (2022) Murata. Accessed 2022. How to use shields and filters. https://www.murata.com/en-us/products/emc/emifil/library/knowhow/basic/chapter01-p1#04.
- Murata Manufacturing Co. (2022a) Ltd Murata Manufacturing Co. Accessed 2022a. Noise antenna. https://www.murata.com/en-sg/products/emc/emifil/library/knowhow/basic/chapter04-p2.
- Murata Manufacturing Co. (2022b) Ltd Murata Manufacturing Co. Accessed 2022b. Noise generated by digital circuit. https://www.murata.com/en-sg/products/emc/emifil/library/knowhow/basic/chapter02-p2.
- Nelson (2015) Steven Nelson. 2015. ’Tape Your Webcam’: Horrifying Malware Broadcasts You to the World. https://www.usnews.com/news/articles/2015/07/29/tape-your-webcam-horrifying-malware-broadcasts-you-to-the-world.
- Newman (2020) Lliy Hay Newman. 2020. A Facebook Messenger Flaw Could Have Let Hackers Listen In. https://www.wired.com/story/facebook-messenger-bug-bounty/.
- NooElec (2022) NooElec. Accessed 2022. Ham It Up Plus. https://nooelec.com/store/ham-it-up-plus.html.
- Norton (2022) Norton. Accessed 2022. Here’s the reason why people cover their webcam. https://us.norton.com/internetsecurity-privacy-reasons-why-people-cover-their-webcam.html.
- PortableOne (2015) PortableOne. 2015. Why are Apple MacBooks cased in aluminum? https://www.portableone.com/Tech-News/Why-are-Apple-MacBooks-cased-in-aluminum.
- Purism (2021a) Purism. Accessed 2021a. Hardware Kill Switches. https://puri.sm/learn/hardware-kill-switches/.
- Purism (2021b) Purism. Accessed 2021b. Lockdown Mode: Beyond Hardware Kill Switches. https://puri.sm/posts/lockdown-mode-on-the-librem-5-beyond-hardware-kill-switches/.
- Research (2022) Ettus Research. Accessed 2022. USRP B210 Board. https://www.ettus.com/all-products/ub210-kit/.
- Robin Getz (1996) Bob Moeckel Robin Getz. 1996. Understanding and Eliminating EMI in Microcontroller Applications. https://www.ti.com/lit/an/snoa382/snoa382.pdf.
- Roth (2022) Emma Roth. 2022. Update Zoom on Mac to fix a bug that keeps your mic on after meetings. https://www.theverge.com/2022/2/12/22930588/zoom-update-psa-macos-monterey-mic-indicator-light-bug.
- Roy et al. (2017) Nirupam Roy, Haitham Hassanieh, and Romit Roy Choudhury. 2017. Backdoor: Making microphones hear inaudible sounds. In Proceedings of the 15th Annual International Conference on Mobile Systems, Applications, and Services. 2–14.
- Roy et al. (2018) Nirupam Roy, Sheng Shen, Haitham Hassanieh, and Romit Roy Choudhury. 2018. Inaudible Voice Commands: The Long-Range Attack and Defense. In 15th USENIX Symposium on Networked Systems Design and Implementation (NSDI 18). 547–560.
- RTL-SDR (2022) RTL-SDR. Accessed 2022. RTL2832U Dongles v3. https://www.rtl-sdr.com/buy-rtl-sdr-dvb-t-dongles/.
- Schlesinger (2014) Jennifer Schlesinger. 2014. Inside Blackshades: Hackers are watching you on infected webcams. https://www.cnbc.com/2014/05/23/inside-blackshades-hackers-are-watching-you-on-infected-webcams.html.
- Schwab (2019) Katherine Schwab. 2019. The hardware trend Google and Apple are throwing their weight behind. https://www.fastcompany.com/90349731/the-hardware-trend-google-amazon-and-apple-are-throwing-their-weight-behind.
- Sharma et al. (2022) Rahul Anand Sharma, Elahe Soltanaghaei, Anthony Rowe, and Vyas Sekar. 2022. Lumos: Identifying and Localizing Diverse Hidden IoT Devices in an Unfamiliar Environment. In 31st USENIX Security Symposium (USENIX Security 22). 1095–1112.
- Singh et al. (2021) Akash Deep Singh, Luis Garcia, Joseph Noor, and Mani Srivastava. 2021. I Always Feel Like Somebody’s Sensing Me! A Framework to Detect, Identify, and Localize Clandestine Wireless Sensors. In 30th USENIX Security Symposium (USENIX Security 21). 1829–1846.
- Son (2018) Do Son. 2018. 14-year-old hacker developed Fruitfly backdoor surveillance. https://securityonline.info/14-year-old-hacker-developed-fruitfly-backdoor-surveillance-mac-users-over-13-years/.
- Sonoma (2022) Sonoma. Accessed 2022. Broadband Amplifier Datasheet. http://sonoma-instrument.com/pdf/sonoma-instrument-317.pdf.
- Su et al. (2017) Yang Su, Daniel Genkin, Damith Ranasinghe, and Yuval Yarom. 2017. USB snooping made easy: crosstalk leakage attacks on USB hubs. In 26th USENIX Security Symposium (USENIX Security 17). 1145–1161.
- Tagliavini (2018) Manuel Tagliavini. 2018. MEMS microphones generate new buzz, face resonant future. https://omdia.tech.informa.com/OM001889/MEMS-microphones-generate-new-buzz-face-resonant-future.
- Technology (2022) Linear Technology. Accessed 2022. LTC1744 14-Bit, 50Msps ADC Datasheet. https://www.analog.com/media/en/technical-documentation/data-sheets/1744f.pdf.
- Valeros and Garcia (2017) Veronica Valeros and Sebastian Garcia. 2017. Spy vs. spy: A modern study of microphone bugs operation and detection. Chaos Computer Club eV (2017).
- Vaughan-Nichols (2020) Steven Vaughan-Nichols. 2020. Dell enables Linux hardware privacy controls. https://www.zdnet.com/article/dell-enables-linux-hardware-privacy-controls/.
- Winkler (2022) Paul Winkler. Accessed 2022. Arecord Command Line Tool. https://linux.die.net/man/1/arecord.
- Y (2020) Fahmida Y. 2020. Enterprise Laptops Still Vulnerable to Memory Attacks. https://duo.com/decipher/enterprise-laptops-still-vulnerable-to-memory-attacks.
- Yogendrappa (2022) Milan Yogendrappa. Accessed 2022. Best EMI and RF Shielding Methods for Flex PCBs. https://www.protoexpress.com/blog/emi-rf-shielding-methods-flex-pcbs/.
- YouTube (2022a) YouTube. Accessed 2022a. Macbook Pro 2014 15” Teardown. https://www.youtube.com/watch?v=N8qZiJnrH1M.
- YouTube (2022b) YouTube. Accessed 2022b. Macbook Pro 2017 13” Teardown. https://www.youtube.com/watch?v=0oSPGzGnt-w.
- YouTube (2022c) YouTube. Accessed 2022c. Macbook Pro 2019 15” Teardown. https://www.youtube.com/watch?v=aYXYJpA0eEY.
- Zhu et al. (2021) Hongzi Zhu, Xiao Wang, Yi Jiang, Shan Chang, and Xudong Wang. 2021. Secure Voice Interactions with Smart Devices. IEEE Transactions on Mobile Computing (2021).
Appendix A Additional Evaluation
In this section, we elaborate on the choice of parameter values in our evaluation, as well as provide some additional results.
A.1. Parameter Selection
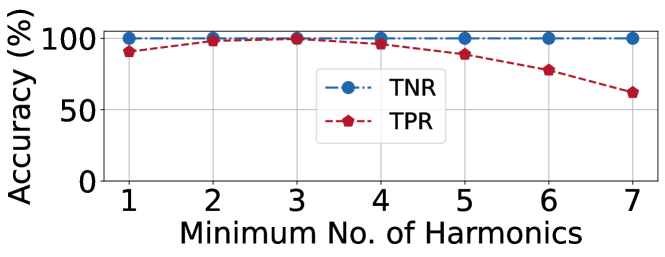
We present results to justify the value of parameter, , used in our experimental evaluation section (§7). Figure 25 depicts the overall TPR and TNR obtained on the laptops (see §7.2) for different values of the parameter, , ranging from . As illustrated in the figure, the TNR is almost 100% (i.e., above 99.99%) irrespective of the choice of the number of harmonics, highlighting TickTock’s robustness to false positives. However, the TPR varies with , where we achieve the best TPR of 99.6% (i.e., ) at the value, , and the second-best result of 98.2% (i.e., ), for . Hence, we set the value of minimum number of harmonics to three, i.e., .
A.2. TickTock’s Performance in the Presence of Audio of Varying Sound Levels
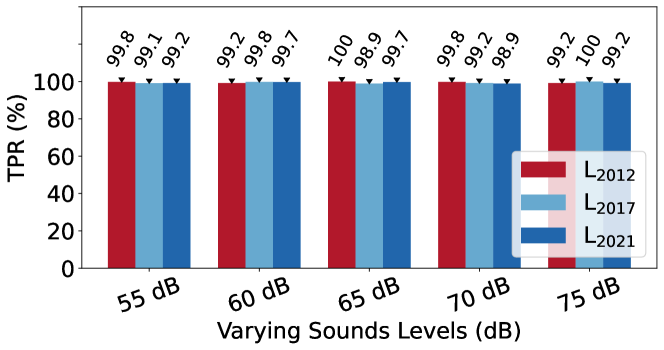
In Section 7.3.1, we evaluate TickTock’s performance in the presence of multiple mic-based applications. However, we do not control the incoming audio sound level which may additionally influence the EM leakage level. Hence, as a follow-up, we now evaluate the effect of the ambient sound levels as captured by the laptop mic on TickTock’s performance. Specifically, we perform experiments on the laptops, , , and (defined in Section 7.3). In order to produce audio with varying sound levels, we utilize an external speaker (Adam Audio A3X studio monitor (Audio, 2022)), which we place about centimeters away from the laptop, and play audio signals with varying loudness levels, ranging from dB and record sound from the laptop. In particular, we play white noise, consisting of uniform energies in all frequency bins from 0-24 kHz. As depicted in Figure 26, we obtain a TPR above 98% across all noise levels and laptops. Hence, we find that the varying ambient sound levels cast negligible influence on TickTock’s performance.
Appendix B Overall Laptop Results
| S.No | Device Model | Year |
|
|
|
|
O/E |
|
|
|||||||||||||||||
|---|---|---|---|---|---|---|---|---|---|---|---|---|---|---|---|---|---|---|---|---|---|---|---|---|---|---|
| 1 | ASUS Strix GL502VT | 2016 | 2048 | h-field | 646 | 27 | O | 531 | 646 | |||||||||||||||||
| 2 | Asus X450v | 2013 | 2048 | e-field | 642 | 31 | O | 642 | 641 | |||||||||||||||||
| 3 | Dell Inspiron 13 7359 | 2015 | 3072 | h-field | 649 | 36 | O | 648 | 649 | |||||||||||||||||
| 4 | Dell Inspiron 5459 | 2015 | 2048 | e-field | 650 | 25 | O | 650 | 648 | |||||||||||||||||
| 5 | Dell Inspiron 7572 | 2018 | 2048 | e-field | 650 | 27 | O | 650 | 641 | |||||||||||||||||
| 6 | Dell Latitude E5570 | 2016 | 2048 | e-field | 642 | 30 | O | 642 | 641 | |||||||||||||||||
| 7 | Dell Latitude E7450 | 2015 | 2048 | e-field | 650 | 26 | O | 650 | 649 | |||||||||||||||||
| 8 | Dell XPS L321x | 2012 | 2048 | h-field | 650 | 35 | O | 647 | 650 | |||||||||||||||||
| 9 | Fujitsu Lifebook SH772 | 2013 | 2048 | e-field | 650 | 35 | O | 650 | 648 | |||||||||||||||||
| 10 | HP Envy 13 | 2021 | 3072 | h-field | 648 | 23 | O | – | 648 | |||||||||||||||||
| 11 | HP Probook 440 G1 | 2013 | 2352 | e-field | 650 | 21 | O | 650 | 649 | |||||||||||||||||
| 12 | HP Zbook Studio G5 | 2018 | 3072 | h-field | 648 | 28 | O,E | 646 | 648 | |||||||||||||||||
| 13 | Lenovo P14s G1 | 2021 | 2400 | h-field | 650 | 24 | O | 649 | 650 | |||||||||||||||||
| 14 | Lenovo T430U | 2012 | 2048 | h-field | 648 | 34 | O | 646 | 648 | |||||||||||||||||
| 15 | Lenovo T460s | 2016 | 2048 | h-field | 645 | 25 | O | – | 645 | |||||||||||||||||
| 16 | Lenovo T470S | 2017 | 3072 | h-field | 650 | 25 | O | 647 | 650 | |||||||||||||||||
| 17 | Lenovo T590 | 2019 | 2048 | h-field | 643 | 23 | O | 633 | 643 | |||||||||||||||||
| 18 | Lenovo X1 Extreme G3 | 2021 | 2400 | h-field | 649 | 24 | O | 644 | 649 | |||||||||||||||||
| 19 | Lenovo X13 Gen 2 | 2021 | 2400 | h-field | 646 | 25 | O | – | 646 | |||||||||||||||||
| 20 | Lenovo X1 Carbon G7 | 2019 | 2400 | h-field | 646 | 22 | O,E | – | 646 | |||||||||||||||||
| 21 | Lenovo X230 | 2012 | 2048 | h-field | 650 | 31 | O | – | 650 | |||||||||||||||||
| 22 | Lenovo X250 | 2015 | 2048 | h-field | 641 | 24 | O | – | 641 | |||||||||||||||||
| 23 | Lenovo X260 | 2016 | 2048 | h-field | 649 | 21 | O | – | 649 | |||||||||||||||||
| 24 | Razer RZ09-0102 | 2013 | 2048 | h-field | 650 | 26 | O | 645 | 650 | |||||||||||||||||
| 25 | Samsung Chronos NP770Z5E | 2013 | 2048 | e-field | 650 | 28 | O | 650 | 646 | |||||||||||||||||
| 26 | Terrans Force T5 | 2016 | 2048 | h-field | 649 | 30 | O | 648 | 649 | |||||||||||||||||
| 27 | Toshiba Portege Z930 | 2012 | 6144 | h-field | 639 | 23 | O,E | – | 639 | |||||||||||||||||
| 28 | Macbook Pro 2017 13” | 2017 | 2823 | h-field | 642 | 18 | O | – | 642 | |||||||||||||||||
| 29 | Macbook Pro 2014 15” | 2014 | – | – | – | – | – | – | – | |||||||||||||||||
| 30 | Macbook Pro 2019 16” | 2019 | – | – | – | – | – | – | – |
This section presents the detailed results of the overall evaluation of 30 tested laptops. Table 2 depicts the results, including 27 successful laptops, one confounding case (Macbook Pro 2017), as well as the two unsuccessful cases. We tabulate the results obtained with each of the near-field probes, as well as the best results (which is reported in §7.2). We observe that the H-field probe successfully detects the microphone clock frequency, , across all laptops, while E-field probe successfully detects 19 out of 27 laptops. For the H-field probe, we leverage loops with diameter from 5 mm up to 20 mm, where larger loops has higher sensitivity and hence captures weaker signals. Furthermore, we observe that most laptops, (i.e., 24/27) have only odd harmonics of the microphone clock frequency observed prominently. By prominently, we mean more than 80% of all detected harmonics are odd. However, in the remaining three cases, both odd and even harmonics occur, which could be due to a deviation of clock duty cycle from 50% (§4.2).
|
|
|
|
|
|
||||||||||||||
|---|---|---|---|---|---|---|---|---|---|---|---|---|---|---|---|---|---|---|---|
| Pro 14 | 1384 | ✓ | Pro 19 | – | ✗ | ||||||||||||||
| Pro 15 | – | ✗ | Pro 20 | – | ✗ | ||||||||||||||
| Pro 16 | – | ✗ | Air 13 | 1613 | ✓ | ||||||||||||||
| Pro 17 | 2832 | ✓ | Air 15 | – | ✗ | ||||||||||||||
| Pro 18 | – | ✗ | Air 20 | 2314 | ✓ |
B.1. Macbook Performance
Recall from Section 7.2 that TickTock fails to detect the mic clock frequency, , in three Macbook models. Hence, we perform comprehensive evaluation on ten different Macbook models using a high-performance setup. The setup uses a Sonoma Broadband RF Amplifier, operating between 10 kHz - 2.5 GHz, with a 38 dB gain at 1 GHz, as well as an Anritsu MS2668C spectrum analyzer (Sonoma, 2022; Anritsu, 2022). On capturing the EM signals while recording using the Voice Memos application, we observe a unique clock frequency, in four out of the ten models (Table 3). However, these frequencies do not correspond to the commonly found mic clock frequencies in other devices (which are typically multiples of an audio sampling rate), and seem to vary across Macbook models. We conjecture two possible reasons for TickTock’s poor performance on Macbooks – (1) The clock signal of the mic itself is well shielded by the Macbook, and there is no significant signal leakage due to the mic in a majority of tested models (i.e., six out of ten). (2) Macbooks utilize custom-designed mics and/or codec that communicate over non-standard protocols. Hence, clock frequencies utilized deviate from the commonly used frequencies.
| Device Model |
|
|
A/D | Device Model |
|
|
A/D | Device Model |
|
|
A/D | ||||||||||||
| Smartphones | Samsung A01 Core | – | ✗ | A | Valore VM64 | 3072 | ✓ | D | |||||||||||||||
| Pixel 3XL | 1200 | ✓ | U | Samsung A52s | – | ✗ | A | Logitech C505 | – | ✗ | A | ||||||||||||
| Pixel 5a | 2048 | ✓ | U | Samsung A6+ | – | ✗ | A | Logitech C930E | – | ✗ | A | ||||||||||||
| Pixel 6 Pro | 3072 | ✓ | U | Tablets | Tecgear Sentinel | – | ✗ | A | |||||||||||||||
| Samsung A8+ | 3072 | ✓ | D | iPad Gen 3 | 3000 | ✓ | U | Xiaomi Xiaovv | – | ✗ | A | ||||||||||||
| Samsung A9 | 2400 | ✓ | D | Lenovo Chromebook | 3250 | ✓ | U | Voice-enabled Smart Speakers | |||||||||||||||
| Samsung Note 10+ | 3072 | ✓ | D | Surface Pro G1 | 2048 | ✓ | U | Facebook Portal Mini | 2400 | ✓ | U | ||||||||||||
| Samsung Note 20 U | 3072 | ✓ | D | Surface Pro G5 | 3000 | ✓ | U | Google Nest Hub G2 | 3072 | ✓ | U | ||||||||||||
| Samsung S20 U | 3072 | ✓ | D | Surface Pro G6 | 3000 | ✓ | U | Echo Show 5 G2 | – | ✗ | U | ||||||||||||
| Samsung S20+ | 3072 | ✓ | D | iPad Gen 8 | – | ✗ | U | Google Home Mini | 768 | D | |||||||||||||
| Samsung S21 | 3072 | ✓ | D | Lenovo M10 | – | ✗ | A | Google Nest Mini | – | ✗ | U | ||||||||||||
| Huawei P30 Pro | – | ✗ | U | USB Webcam | Homepod Mini | 2400 | U | ||||||||||||||||
| iPhone 8+ | – | U | Asus C3 | 3073 | ✓ | A | Lenovo Smart Clock | 3072 | U | ||||||||||||||
| One Plus Nord 10 | – | ✗ | U | Creative Live | 3072 | ✓ | D | Mi Smart Clock | 3250 | U | |||||||||||||
| One Plus Nord CE | – | ✗ | U | Hyso 1080p | 2048 | ✓ | U | ||||||||||||||||
Appendix C Performance of Non-Laptop Devices
Apart from laptops, we also evaluate TickTock on four consumer device categories, namely smartphones, tablets, USB web-cameras and voice-enabled devices to test the generalizability of the approach.
Smartphones
As depicted in Table 4, we evaluate TickTock on 17 smartphones, from popular manufacturers including Samsung, Google and One Plus. We capture traces when the primary mic (i.e., bottom mic) is on, as well as when the mic is off. The screen is kept active throughout data collection, except for phones, Pixel 3XL, Pixel 6 Pro and Samsung A8 Plus as their performance is affected by the screen’s EM disturbance. From the table, we observe that TickTock successfully identifies the mic clock frequency, , in 10 out of the 17 tested smartphones, including Samsung’s flagship S-series phones (e.g., Galaxy S20 and S21). Furthermore, as depicted in Figure 27, we achieve an average TPR of 76.9% (), and TNR of 100% across the 10 phones. Interestingly, we encounter a confounding case () with Apple iPhone 8 Plus, where we obtain inconsistent results across different audio recording applications. We conjecture that the reason is similar to the conjecture we make for Apple Macbooks (see Appendix B.1).
Tablets
We evaluate seven tablets, including iPad, Chromebook and Surface Pro, by capturing traces when the microphone is on, and off, with the screen active throughout the data collection. As depicted in Table 4, we identify the microphone clock frequency, , in 5 out of the 7 tablets. Of the two unsuccessful cases, we suspect that one of them houses an analog microphone (eBay, 2022). Furthermore, on the five working cases, TickTock achieves a average TPR and TNR of 91.0% () and 100% respectively, with the tablet, iPad 3 alone, achieving a low TPR around 62.2%.
USB Web-Cameras
We evaluate TickTock on eight USB web-cameras containing mics, of which we successfully identify the mic clock frequency, , in 4 of them. We perform device tear-downs and confirm that all the remaining four web cameras do not leak the clock frequencies as they enclose analog microphones. Furthermore, we encounter an interesting case where a web-cam containing analog mic (Asus C3) also leaks the mic clock frequency ( MHz). We confirm that this occurs due to the leakage of the clock signal directly from the ADC chip, ES7243, itself (rather than cables and connectors), due to the proximity of the ADC chip to the plastic exterior of the webcam (Everest, 2022). Finally, for the four successful webcams, we report a high average TPR and TNR of 99.8% () and 100% respectively (Figure 27).
Voice-enabled Smart Speakers
We evaluate TickTock on eight smart-speaker devices (Table 4). As these devices are always listening for a wake-word (e.g., “Hey Google”, “Alexa”), we capture EM traces during normal operation (i.e., unmuted idle mode), as well as when they are explicitly muted (by pressing the physical mute button), to represent the mic’s on and off phases, respectively. We observe that in two out of the eight tested devices, namely Portal Mini and Nest Hub G2, we obtain unique mic clock frequencies, , of 2400 kHz and 3072 kHz, respectively. Furthermore, as depicted in Figure 27, we achieve an average TPR and TNR of 94% () and 100% for the two smart speakers. Interestingly, we also find confounding cases () in four out of the eight devices – Google Home Mini, Homepod Mini, Lenovo Smart Clock, and Mi Smart Clock. Specifically, we detect a mic-like clock frequency, in both the muted as well as the unmuted phases (see the column in Table 4). In these devices, it is likely that the mute functionality is implemented in software, and hence the clock signal remains uninterrupted even during the mute phase. We believe that such an implementation is possible in devices such as smart speakers that do not have any power constraints (as they are always plugged-in to a power source).
| SDR | RTL-SDR |
|
|
|
||||||||||
|---|---|---|---|---|---|---|---|---|---|---|---|---|---|---|
|
40 | 140 | 169 | 1800 | ||||||||||
|
0.5 - 28.8 | 0.001 - 2000 | 0.0005 - 31 | 70 - 6000 | ||||||||||
|
2.4 | 10 | 0.66 | 56 | ||||||||||
|
Direct | I/Q | I/Q | I/Q | ||||||||||
|
14.4 | 30 | 23.76 | 30 | ||||||||||
|
490 | 650 | 115 | 2600 | ||||||||||
| TPR (%) | 67.6 | 99.7 | 98.8 | 94.1 | ||||||||||
|
|
|
|
|
Appendix D Performance due to Different Software Defined Radios
To verify TickTock’s generalizability across signal-capture hardware, we evaluate its performance on four different software-defined radios (SDRs), namely, RTL-SDR, SDRPlay RSP1A, AirSpy HF+, and USRP B210 (with NooElec upconverter) (NooElec, 2022; Research, 2022; Components, 2022; AirSpy, 2022; RTL-SDR, 2022). In Table 5, we enlist their features, i.e., their cost, supported frequency range, maximum available bandwidth (in a single sweep), as well as their sampling mode (direct vs I/Q).
As different SDRs may have different signal levels, we perform a short calibration for each SDR in order to compute a suitable amplitude threshold (), for detecting the microphone clock frequency, . Subsequently, we collect EM traces for three minutes from each SDR to report the obtained True Positive Rate. From the table, we observe that except for RTL-SDR, we obtain a TPR over 94% for all other SDRs depicting the generalizability of TickTock across different hardware. In RTL-SDR, as they utilize direct-sampling, aliasing occurs, which leads to false detection of additional clock frequencies, thereby lowering the overall TPR to 67.6%.