Pressure-induced superconductivity in the weak topological insulator Bi2TeI and the topological metal Bi3TeI
Abstract
We report a series of high-pressure electrical transport, magnetic susceptibility, and x-ray diffraction measurements on single crystals of the weak topological insulator Bi2TeI and the topological metal Bi3TeI. Room temperature x-ray diffraction measurements show that both materials go through a series of pressure-induced structural transitions and eventually adopt a disordered alloy structure at high pressure. A re-analysis of the published data on BiTeI indicates that this material also adopts a disordered structure at high pressure, in contrast to the previously suggested structure. We find that Bi2TeI and Bi3TeI become superconducting at and , respectively. The superconducting critical temperature of the phase reaches maximum values of and for Bi2TeI and Bi3TeI, respectively and in both cases. The results indicate that disordered alloy superconducting phases appear to be a universal feature of both the Bi-Te and Bi-Te-I systems at high pressure.
I Introduction
Several bismuth-based compounds have gained attention due to their diverse topologically nontrivial electronic properties Hasan and Kane (2010); Ando (2013); Qi and Zhang (2011); Wehling et al. (2014). Interest in the BiTe ( = Cl, Br, I) family of compounds first surged when it was discovered, via spin- and angle-resolved photoemission spectroscopy, that BiTeI displays an enormous Rashba-like spin splitting of the bulk electronic bands Ishizaka et al. (2011). This result was soon followed by similar observations in BiTeBr and BiTeCl Sakano et al. (2013); Landolt et al. (2013).
Compounds in the BiTe family have been shown to exhibit drastic changes in their physical properties when external pressure is applied. BiTeI and BiTeBr are believed to undergo pressure-driven topological quantum phase transitions Bahramy et al. (2012); Rusinov et al. (2016a); VanGennep et al. (2014); Xi et al. (2013); Park et al. (2015); Crassee et al. (2017), while all of the compounds have shown evidence of pressure-induced structural transitions Crassee et al. (2017); Chen et al. (2013); Sans et al. (2016) and pressure-induced superconductivity VanGennep et al. (2017); Qi et al. (2017); Jin et al. (2017a); Ying et al. (2016); Jin et al. (2017b). Compounds with the formula Bi2TeI Savilov et al. (2005); Babanly et al. (2009) and Bi3TeI Zeugner et al. (2017) have also been synthesized. These compounds incorporate Bi-bilayers in the van der Waals gap between layers of BiTeI Zeugner et al. (2017); Ryu et al. (2016); Tu et al. (2018); Aliev and Babanly (2008); Babanly et al. (2009); Savilov et al. (2005); Rusinov et al. (2016b). Single crystals of Bi2TeBr and Bi3TeBr have also been synthesized and have been shown to be isostructural with Bi2TeI and Bi3TeI, respectively Zeugner et al. (2018).
According to parity eigenvalues, bulk Bi2TeI has been shown to belong to the (0,001) class of 3D weak topological insulators (TIs) under ambient conditions, and consists of alternating stacks of quantum spin Hall layers and normal insulator (NI) layers Tang et al. (2014). This structure has been predicted to give rise to two fairly isotropic Dirac cones that exist on the side surfaces, perpendicular to the BiTeI planes. These 3D weak TIs have recently gained interest due to their potential application as high-performance thermoelectric materials, partially due to the possibility of achieving minimum lattice thermal conductivity. This minimum lattice thermal conductivity occurs when phonons have mean free paths on the order of one phonon wavelength. This has been experimentally observed in the 3D weak TI Bi14Rh3I9 and has been theoretically predicted in Bi2TeI Wei et al. (2016). Bi3TeI may also exhibit unusual topological properties. Previous work Zeugner et al. (2017) found evidence of band inversion when spin-orbit coupling is accounted for as well as an unconventional surface state that resides on various termination layers. However, the inverted gap does not occur at a time reversal invariant momentum point and should not create a topological surface state according to the Fu-Kane classification Kane and Mele (2005).
Many topological materials have been reported to exhibit pressure-induced superconductivity, though the superconducting phase typically emerges following a structural phase transition that modifies the topological properties Kirshenbaum et al. (2013); He et al. (2016); Kang et al. (2015); Qi et al. (2016). In this work, we report a series of electrical resistivity, magnetic susceptibility, and x-ray diffraction measurements on Bi2TeI and Bi3TeI to pressures as high as . We find that both compounds go through a series of pressure-induced structural transitions, with the high pressure phases exhibiting a disordered structure very similar to that previously observed for other Bi-Te compounds at high pressure Stillwell et al. (2016). In both compounds, the high pressure phase is superconducting, with a maximum value near . We observe near 100% flux expulsion in AC magnetic susceptibility measurements, consistent with bulk superconductivity.
II Methods
The synthesis of both Bi2TeI and Bi3TeI were guided by the results found in Ref. Zeugner et al. (2017). Polycrystalline Bi2TeI was initially grown by solid state reaction of stoichiometric amounts of the individual elements sealed under vacuum in a quartz tube, and annealed at for 6 days. Ambient pressure x-ray diffraction measurements of the polycrystalline material showed phase-pure Bi2TeI. The polycrystalline Bi2TeI was then ground into a fine powder, sealed under vacuum in a quartz tube, and subjected to a horizontal temperature gradient of for a period of 19 days. Single crystals of Bi2TeI nucleated on the source material in the hot zone. These crystals were hexagonal platelets, with typical dimensions of . The structure of the single crystals was confirmed via powder x-ray diffraction. Rietveld refinement with the space group (#12) yielded lattice constants of a = 7.58 Å, b = 4.38 Å, c = 17.74 Å, and = 98.20∘, which are consistent with values reported in the literature Aliev and Babanly (2008); Babanly et al. (2009); Zeugner et al. (2017); Rusinov et al. (2016b), although there are slight discrepancies in the literature about which space group should be assigned to this compound. Reference Rusinov et al. (2016b) noted that applying a crystallographic transformation matrix to the unit cell yields a reduced trigonal rhombohedral cell with a = b = 4.38 Å, c = 17.74 Å, = = 82.905∘, and = 60.002∘.
The Bi3TeI samples were grown in a Bi self-flux, following the method described in Ref. Zeugner et al. (2017). This resulted in cm-sized single crystals of Bi3TeI, and the structure was confirmed via both powder and single crystal x-ray diffraction. Rietveld refinement confirmed the polar noncentrosymmetric space group (#160) with lattice constants of a = b = 4.40 Å and c = 32.23 Å, which are consistent with those reported in the literature Zeugner et al. (2017).
Angle-dispersive x-ray diffraction (XRD) experiments on powdered samples were carried out at beamline 16-ID-B, Advanced Photon Source (APS), Argonne National Laboratory. The x-ray beam had dimensions of approximately and wavelength . Powdered CeO2 was used to calibrate the distance and tilting of the detector. For the x-ray diffraction measurements, high pressure was achieved in Mao-type symmetric DACs (diamond anvils cells) with c-BN seats to allow access to high diffraction angles. A mortar and pestle were used to powder each sample, which was then loaded into a Symmetric DAC alongside a piece of platinum foil and a ruby flake. During measurement, platinum and ruby were used to determine pressure within the cell. The cell containing the Bi2TeI sample used diamonds with a culet diameter of and a gasket made from SS 316 featuring a hole of approximate diameter . The cell used for measuring Bi3TeI contained diamonds with a culet diameter of . Its gasket was also made of SS 316, and had a diameter hole. In both cells, the gasket hole was filled with a pressure medium of 1:1 n-pentane isoamyl alcohol, and pressure was applied in-situ using a computer-controlled gearbox. The resulting diffraction patterns were processed into usable XRD patterns with Dioptas software Prescher and Prakapenka (2015) and analyzed with GSAS-II software Toby and Von Dreele (2013) to obtain lattice constants and structure.
Ambient pressure transport properties were measured in a Quantum Design Physical Property Measurement System (PPMS) with temperatures ranging from and magnetic fields up to . Additional measurements on \chBi3TeI were performed down to . For the resistivity measurements under pressure, single crystals with typical dimensions of were cut from larger crystals and loaded into an OmniDAC membrane-driven diamond anvil cell from Almax-EasyLab. This cell was placed inside of a custom continuous flow cryostat built by Oxford Instruments, which has an optical window at the bottom that allows for in-situ pressure measurement of the R1 fluorescence line of ruby Chijioke et al. (2005). One of the diamonds used was a designer-diamond anvil containing eight symmetrically arranged tungsten microprobes which are encapsulated in high-purity homoepitaxial diamond Weir et al. (2000). The opposing anvil had a culet size of . The gasket was made of 316 SS, and was preindented to an initial thickness of . Quasihydrostatic, soft, solid steatite was used as the pressure-transmitting medium. Resistance was measured in the Van der Pauw geometry with a current of .
For the ac susceptibility measurements, one sample of each material was measured in order to test whether the observed superconducting transitions are bulk in nature. The Bi2TeI sample had dimensions of and the Bi3TeI sample had dimensions of . The diamond anvil cell used for these measurements was an Almax-EasyLab ChicagoDAC, which is a membrane-driven diamond anvil cell that is made to fit inside the bore of a Quantum Design PPMS Feng et al. (2014). The ac magnetic susceptibility measurements were performed using a balanced primary/secondary coil system that has been described elsewhere Deemyad et al. (2001). Both of the diamonds had 800 m culets. The gasket was made of Berylco25 which was preindented to an initial thickness of 60 m. Samples were loaded into a gasket chamber of 300 m diameter along with small chips of ruby, and the pressure medium used was 1:1 n-pentane:isoamyl alcohol Torikachvili et al. (2015). An SR830 lock-in amplifier was used to measure the first harmonic of the ac magnetic susceptibility. The primary coil provides an excitation field of 3 Oe rms at 1 kHz. The detection coil is connected through a Stanford Research SR554 transformer/preamplifier. The fluorescence line from the ruby was again used for pressure determination, and was collected via optical fiber and a lens system which is mounted to the diamond anvil cell inside of the cryostat.
For samples labeled S1, pressure was applied at room temperature, then released while keeping the samples below . The samples that are labeled S2 were compressed at either 1.8 or , and then decompressed while keeping the samples below . Samples labeled S3 were slowly compressed and decompressed at room temperature. For the ac magnetic susceptibility measurements, pressure changes were carried out at room temperature, with the data sets measured during decompression.
III Ambient pressure transport
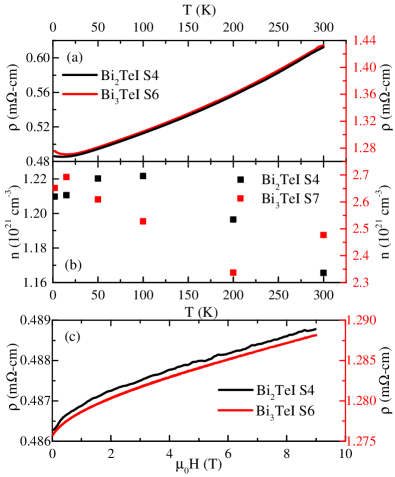
As shown in Fig. 1, the resistivities of the samples under ambient conditions were on the order of 0.5 -cm for Bi2TeI and 1 m-cm for Bi3TeI, each of which were weakly temperature dependent. In both samples, decreases upon cooling, followed by a slight upturn at low temperature. Hall data collected at ambient pressure showed that both samples were -type with carrier concentrations of 1.2x1021 cm-3 for Bi2TeI and 2.5x1021 cm-3 for Bi3TeI. The carrier concentrations were also weakly temperature dependent, and showed an increase upon cooling. Hall data for both samples up to showed no evidence of third order terms that would indicate multiple types of carriers. Magnetoresistivity measurements showed cusps at zero field which may come from weak anitlocalization effects, similar to those observed in the topologically nontrivial semimetal LuPdBi Xu et al. (2015). We see no evidence of superconductivity at ambient pressure above in \chBi2TeI and above in \chBi3TeI.
IV resistivity under pressure
Figure 2 show how the resistivity of Bi2TeI and Bi3TeI evolves as a function of pressure. Samples were compressed isothermally both at room temperature and low temperature (insets). The room temperature resistivity of both samples show multiple sharp drops as a function of pressure. The high pressure x-ray scattering results show that these changes in resistivity occur due to pressure-driven structural transitions, similar to what has been observed in BiTeI Chen et al. (2013); VanGennep et al. (2017); Jin et al. (2017a). We find significant changes in the resistivity of Bi2TeI occurring between and . In Bi3TeI, we find similar changes from and . The low temperature isothermal pressure sweeps shown in the insets demonstrate that Bi2TeI begins to superconduct above , while Bi3TeI begins to superconduct above . For both materials, we find that the onset of superconductivity appears to coincide with the second (higher pressure) set of features in the room temperature resistivity. The resistivity of both samples is roughly pressure-independent at pressures higher than the critical pressures needed to induce superconductivity.
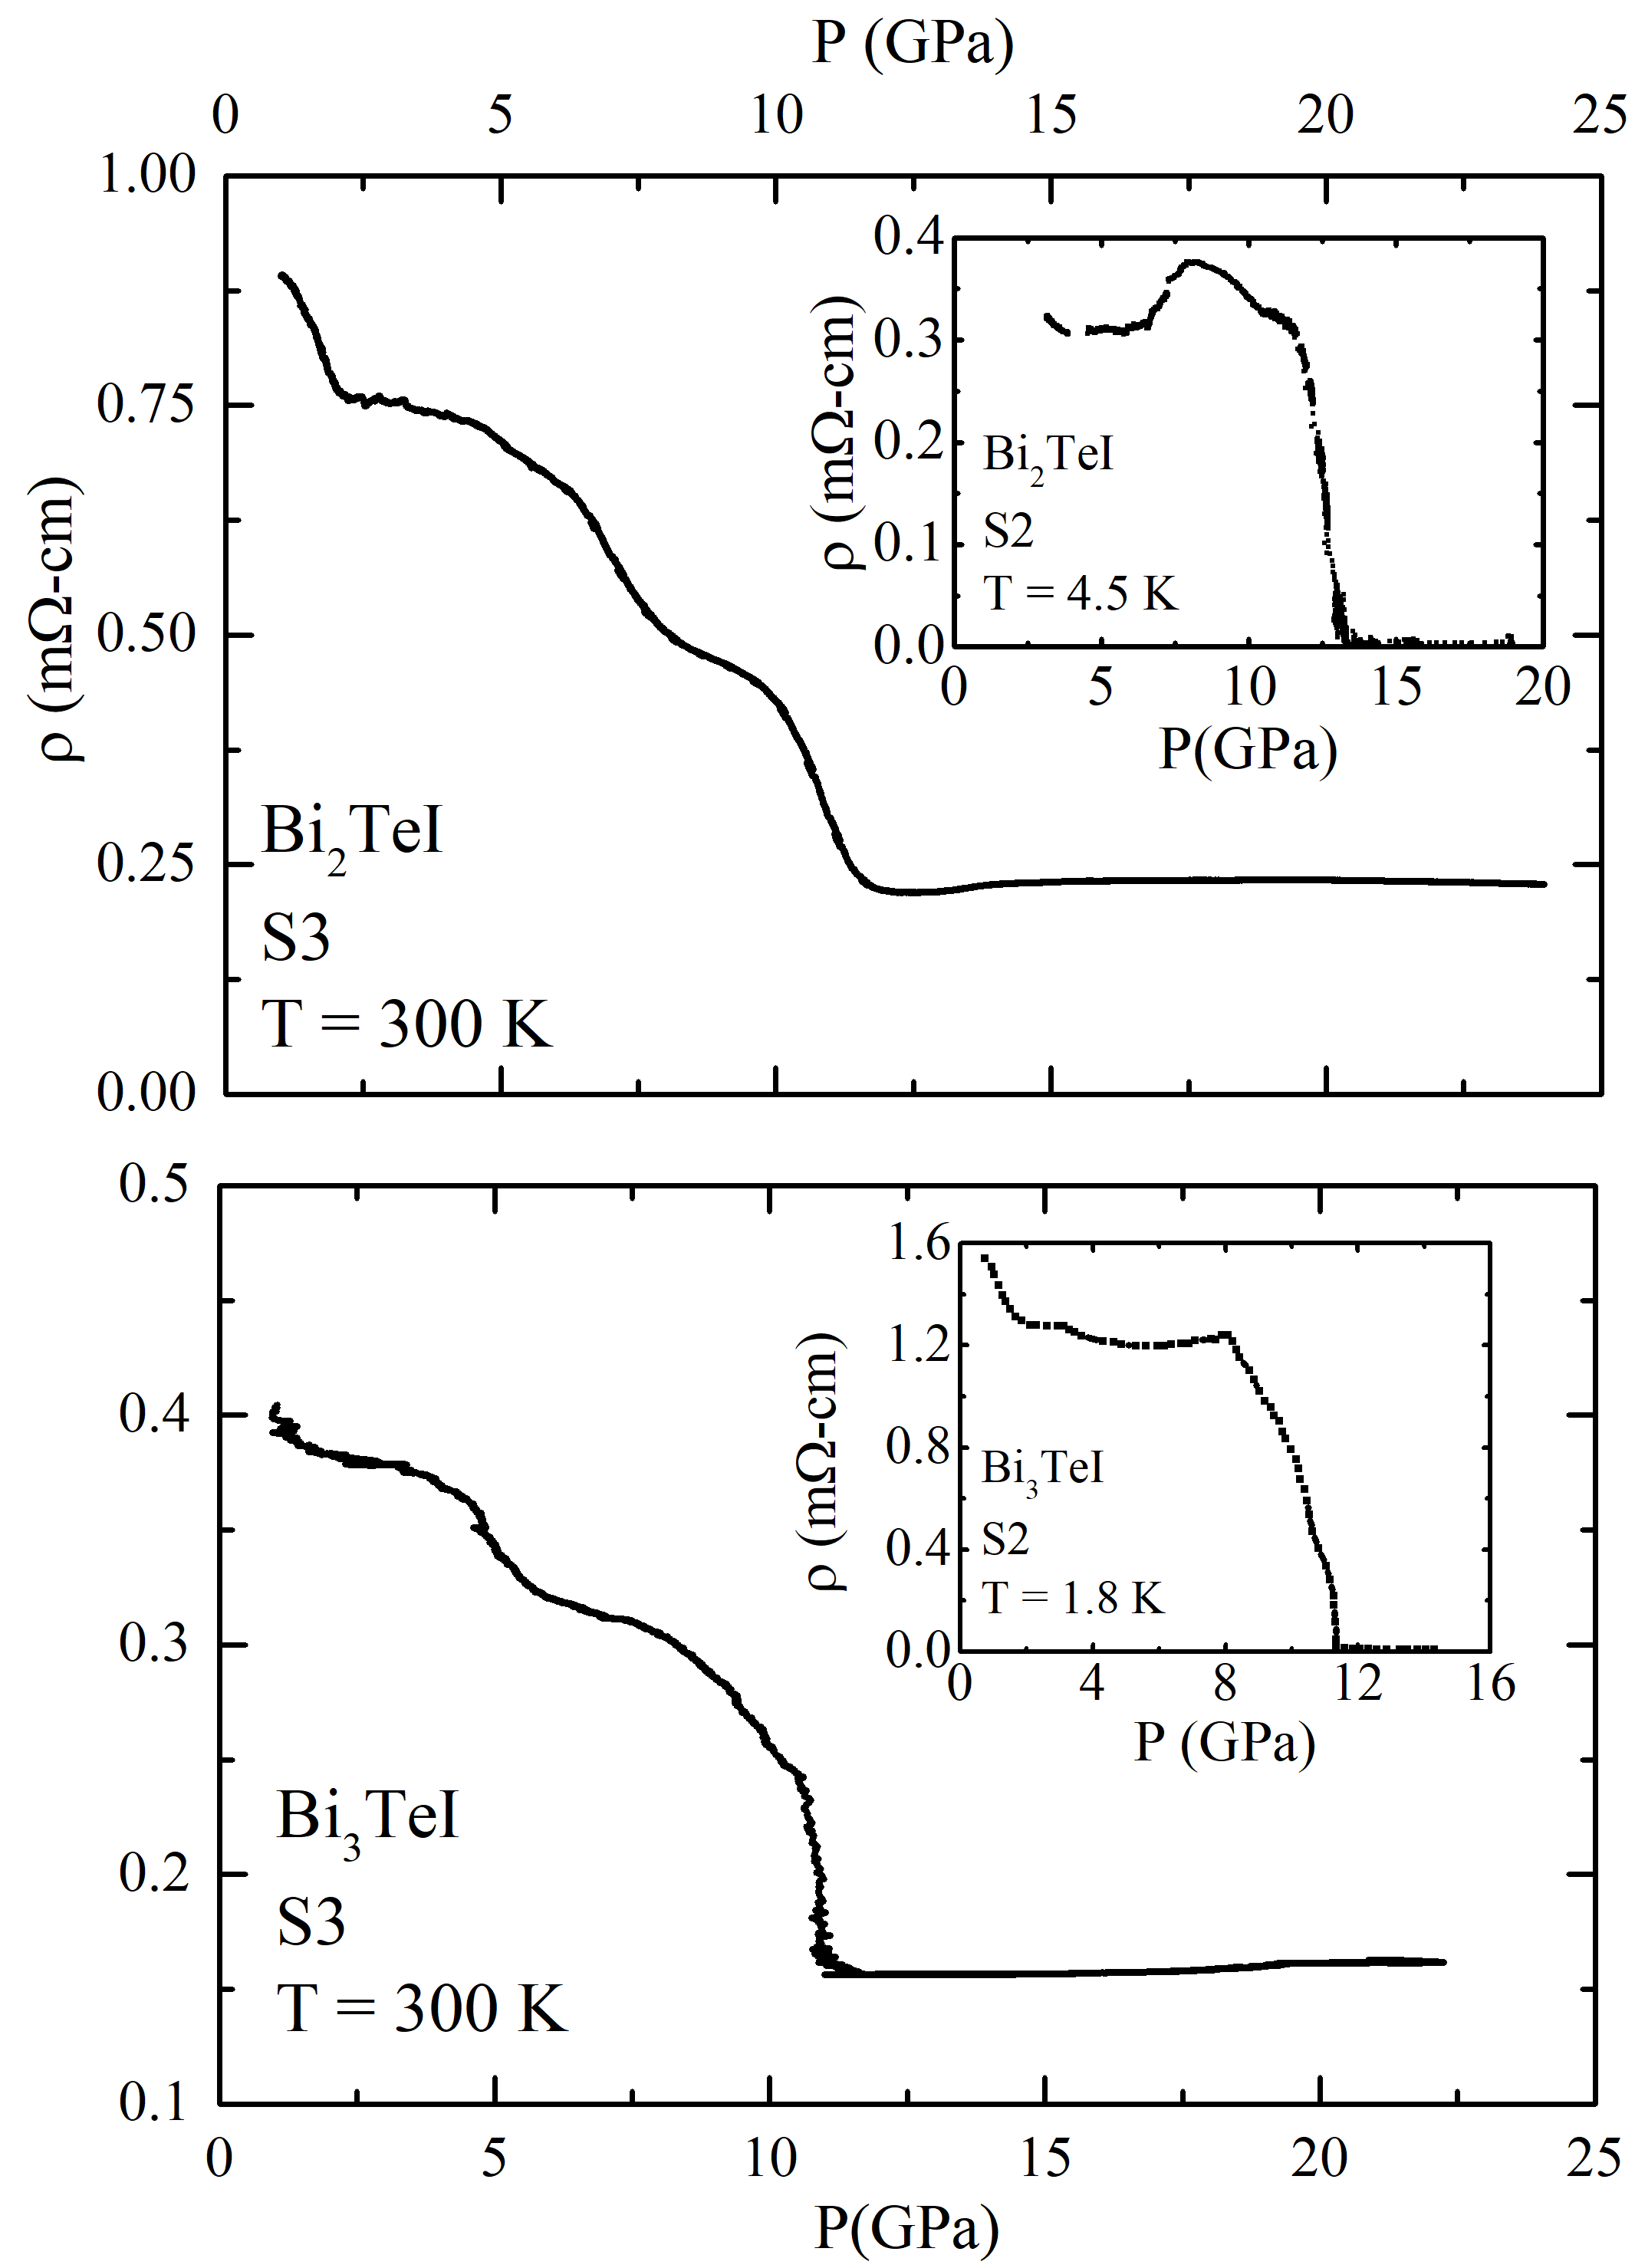
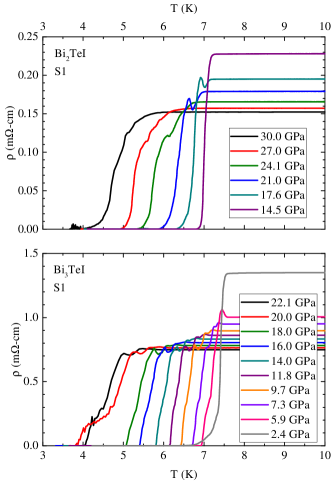
Figure 3 shows the temperature dependence of the resistivity for Bi2TeI and Bi3TeI at various pressures. These data sets were taken upon decompression at low temperature, in which the sample temperature was kept below . In both samples, we notice an increase in both the magnitude of the normal-state resistivity as well as an increase in Tc upon decompression. These features are also observed in BiTeI VanGennep et al. (2017).
V magnetic susceptibility
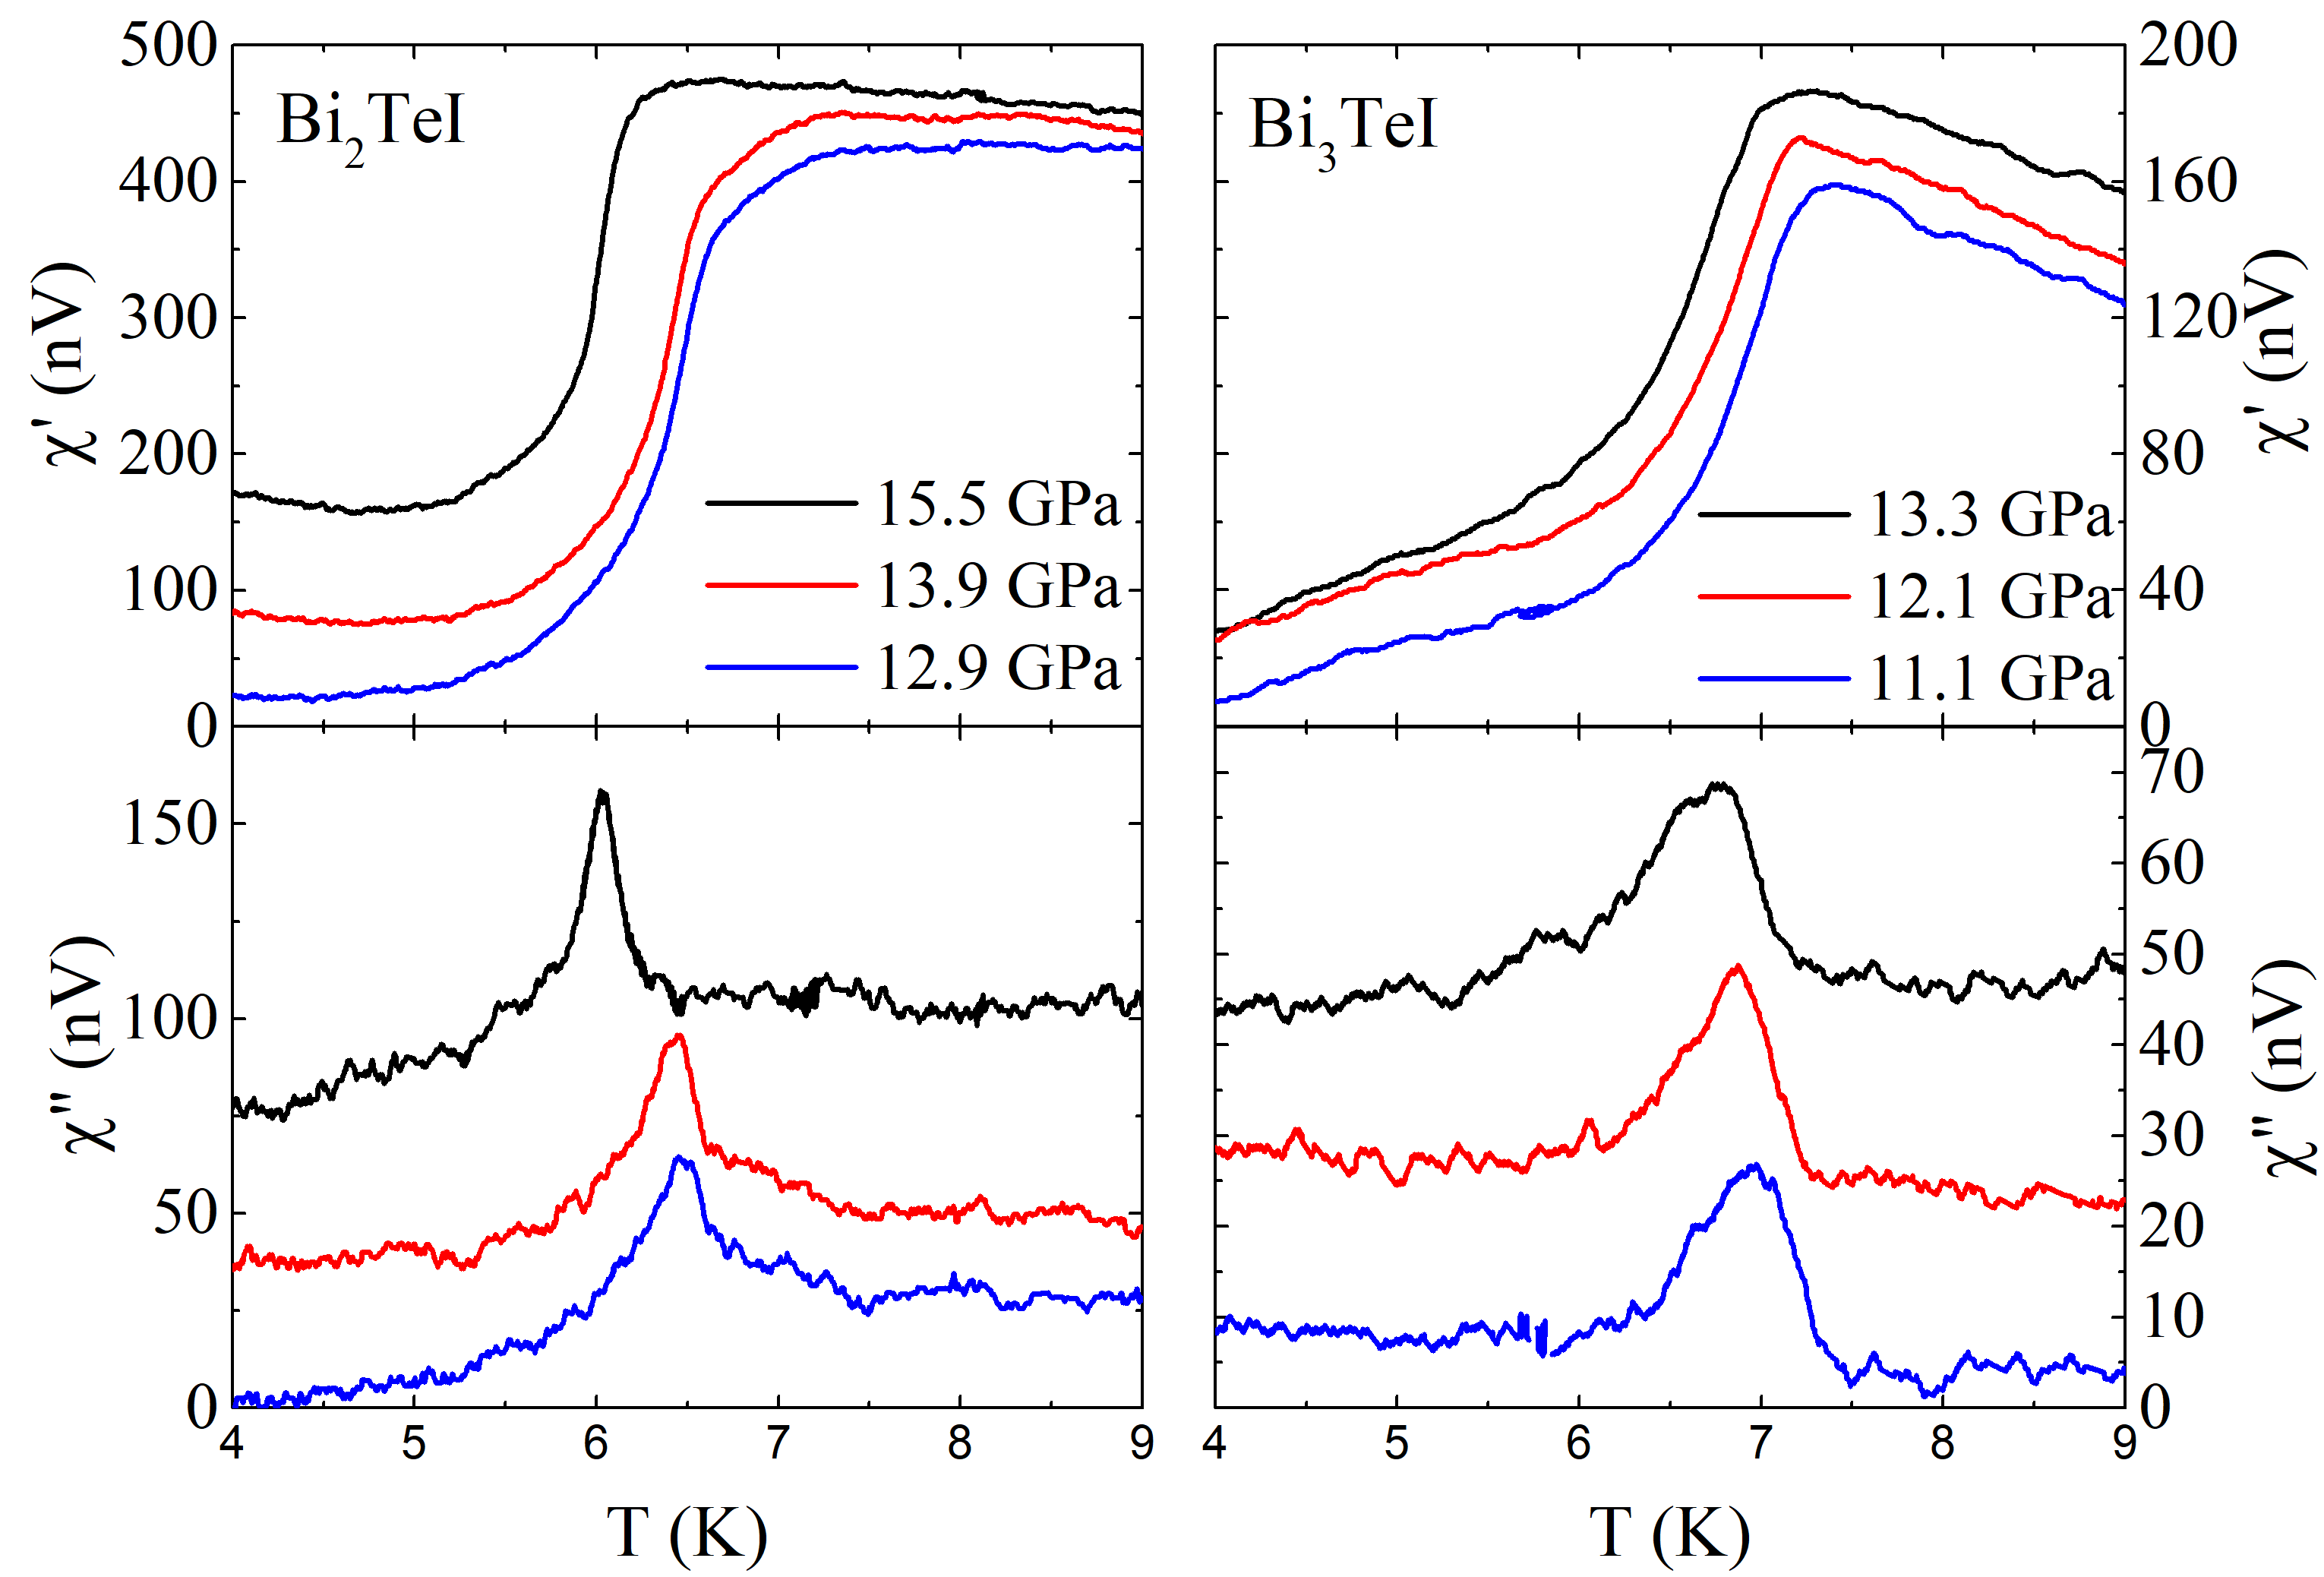
It is not uncommon to observe zero resistance in a sample due to small superconducting filaments that exists between voltage or current leads. Given that elemental Bi, Te, I Buzea and Robbie (2004); Hamlin (2015); Shimizu (2015), and a number of Bi-Te Stillwell et al. (2016); Jeffries et al. (2011) phases all become superconducting at high pressure we performed ac magnetic susceptibility measurements in order to determine whether or not the observed superconductivity is intrinsic or due to a small fraction of a minority phase. Figure 4 represents a summary of our ac susceptibility experiments. Upper panels show the temperature dependence of the real part of the susceptibility, ’, while the lower panels show peaks in the imaginary part of the susceptibility, ”. For both materials, the size of the drop in ’ agrees well with the expected value for full magnetic shielding Nikolo (1995). The negative values of measured via ac susceptibility are consistent with those measured via resistivity with similar slopes. For Bi2TeI, we observe that the resistance of sample S2 drops to zero around at , while we observe no hints of bulk superconductivity via ac susceptibility down to at roughly the same pressure. This leads us to conclude that the portions of the sample can persist in the high-pressure phases due to metastability or slow kinetics when pressure is released.
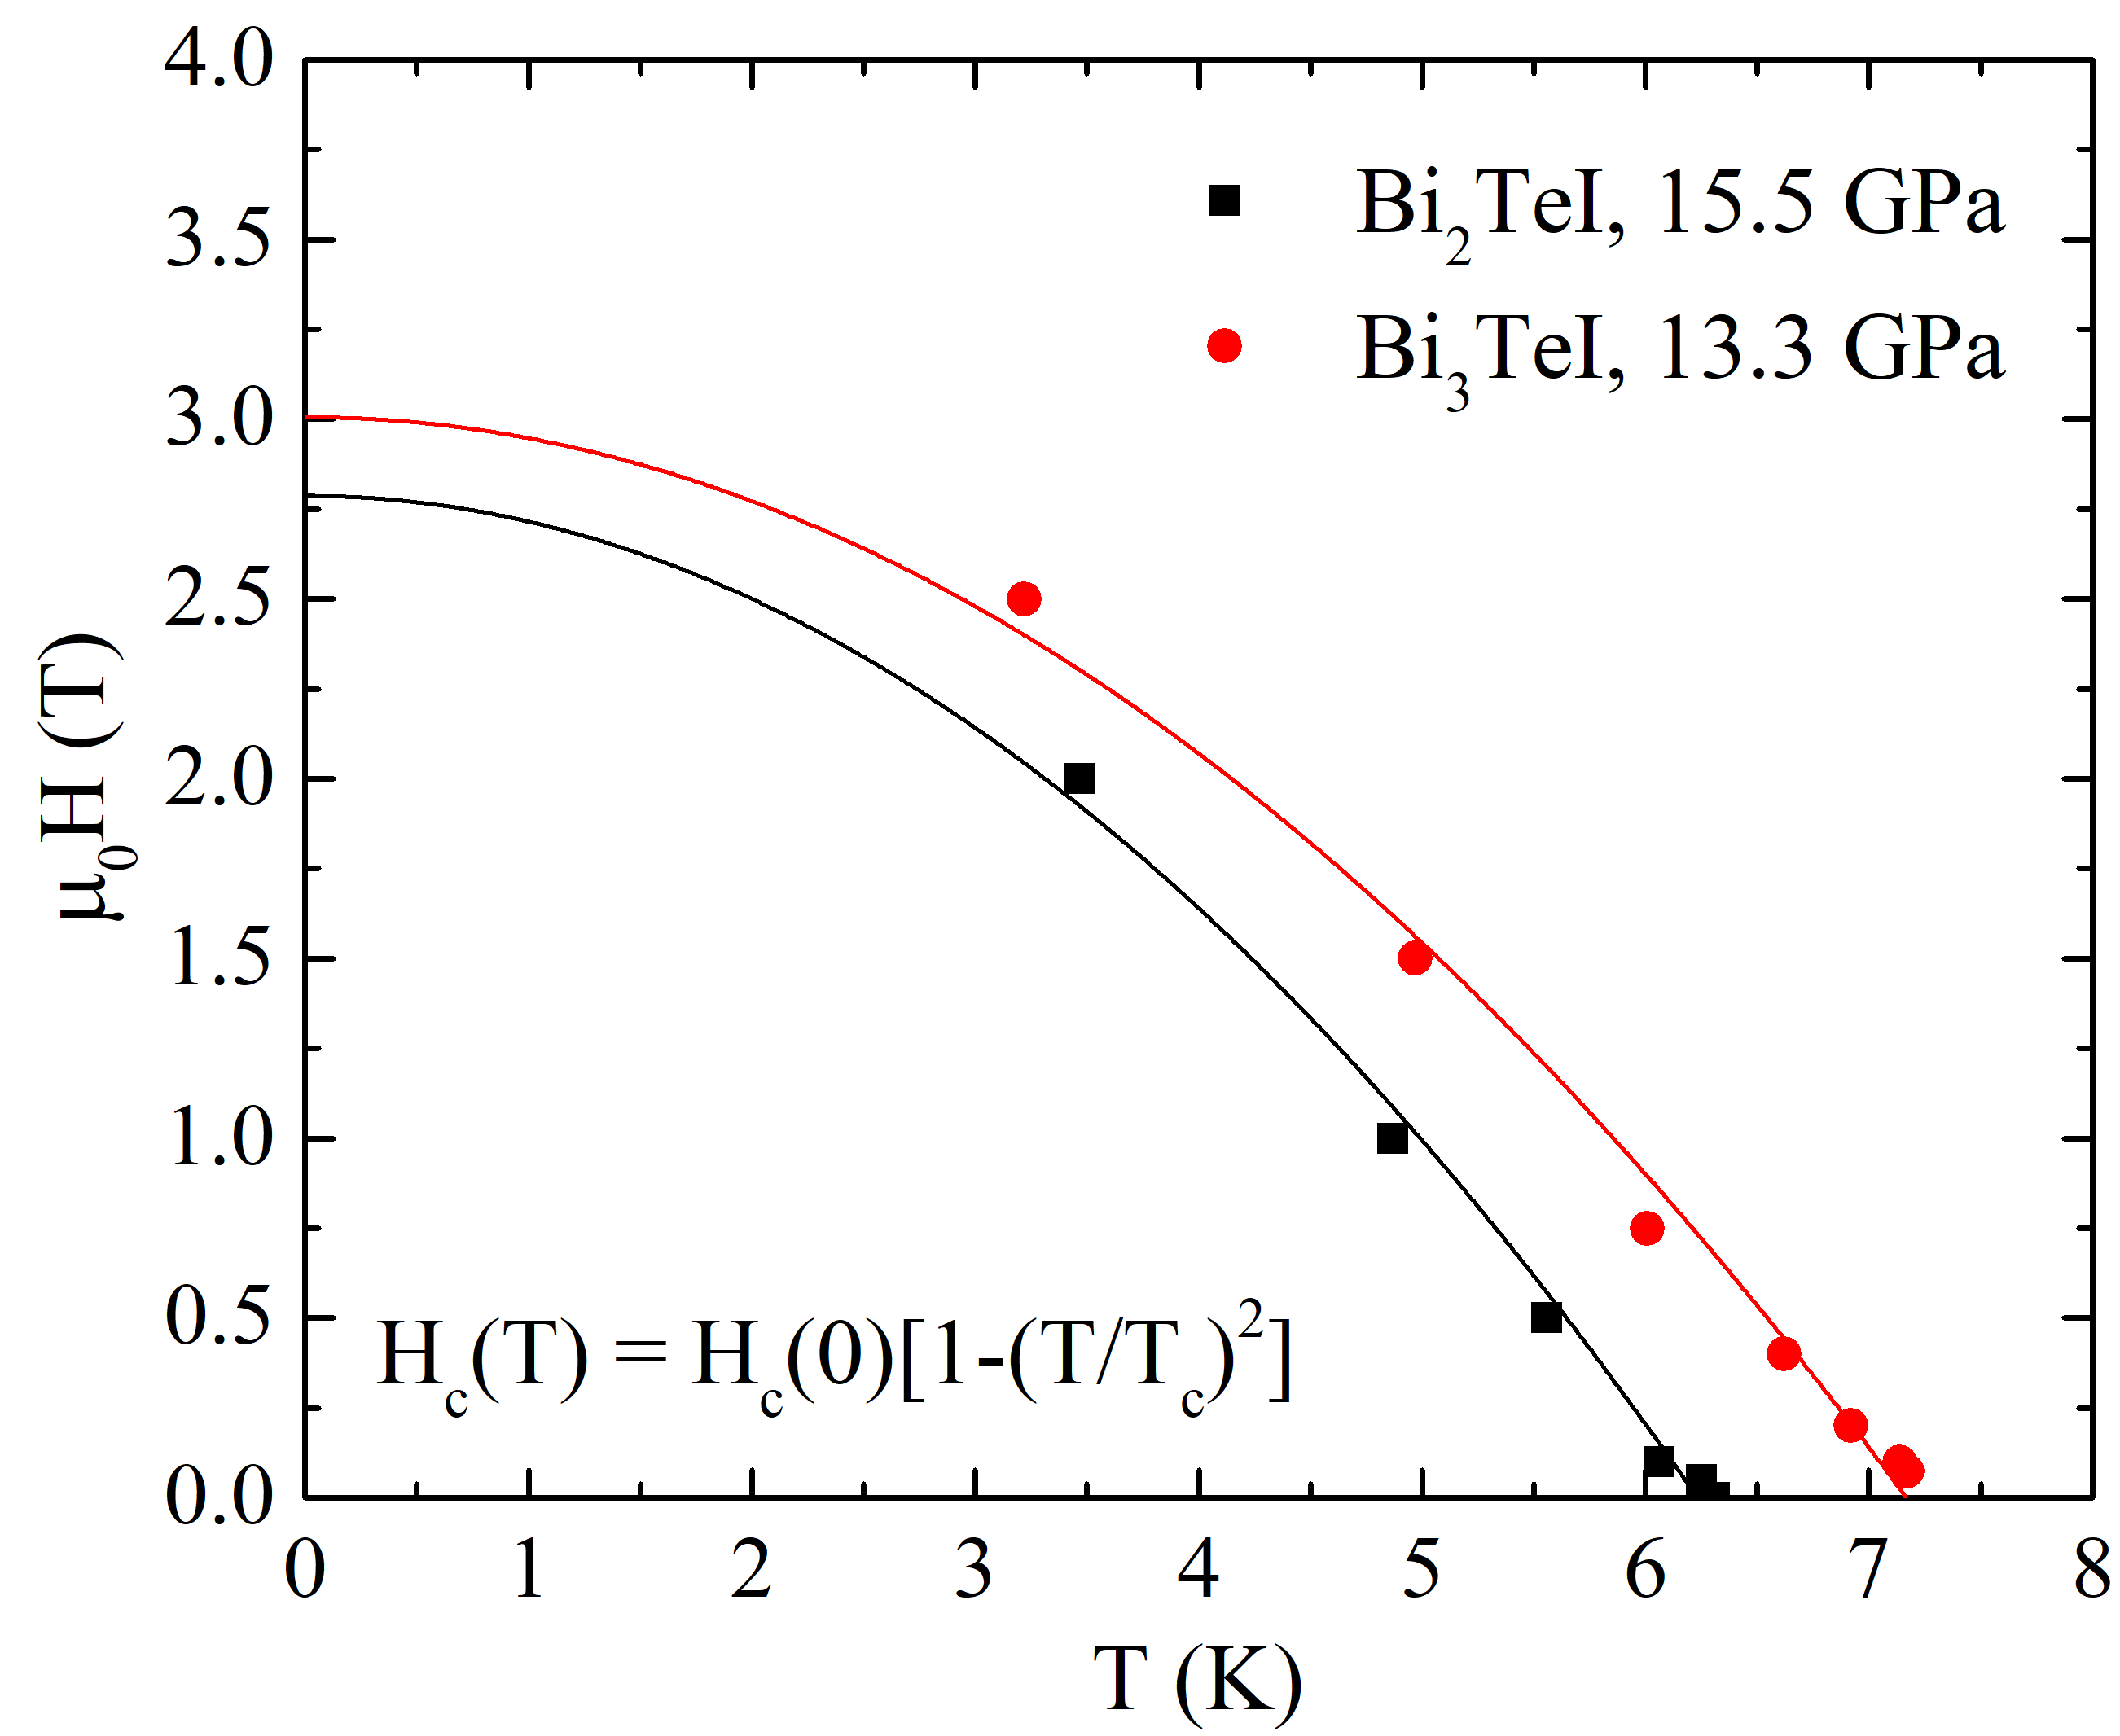
An external magnetic field was applied to the samples that were studied via ac magnetic susceptibility in order to investigate the critical fields of Bi2TeI and Bi3TeI (Fig. 5). Empirical parabolic fits yield Hc(0) = for Bi2TeI at , and Hc(0) = for Bi3TeI at . A Werthamer-Helfand-Hohenberg analysis yields a zero temperature critical field of for Bi2TeI at , and for Bi3TeI at Werthamer et al. (1966). The critical fields for these compounds are well below the weak coupling BCS paramagnetic limit, , which yields for Bi2TeI at , and for Bi3TeI at .
VI X-ray diffraction
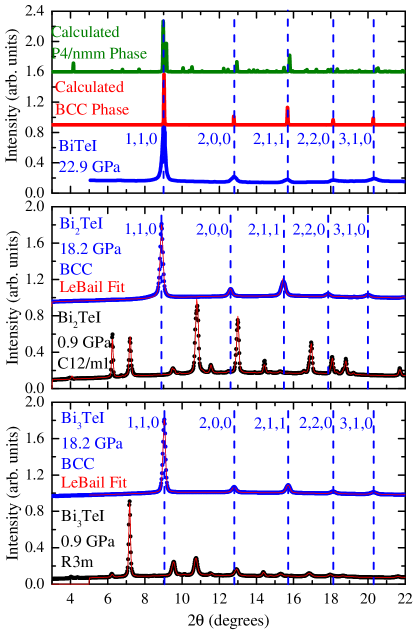
Figure 6 summarizes the results of the high pressure x-ray diffraction measurements for both compounds. As pressure increases from zero to , Bi2TeI passes through three distinct phases. At low pressure, it adopts a hexagonal structure (space group C12/m1), which transforms into an unidentified transitional phase at approximately . Above , a third phase appears, and this phase has a remarkably simple diffraction pattern. Bi3TeI behaves similarly under pressure. At low pressure, it possesses a trigonal structure (space group R3m), and the structure shifts into a transitional phase at around . Upon increasing pressure above about , Bi3TeI also transitions to a new phase with an extremely simple diffraction pattern.
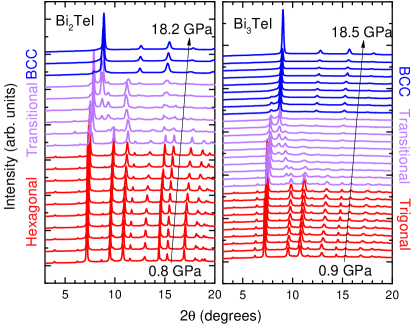
Attempts to index the high-pressure diffraction patterns of Bi2TeI and Bi3TeI yield unit cells that are too small to contain even a single formula unit. Small unit cells can occur for complex formula units if each lattice site hosts multiple types of atom - i.e. if the structure is disordered. We find that the high pressure phases of both Bi2TeI and Bi3TeI are well explained by a simple lattice where the the Bi, Te, I atoms are randomly distributed. The appearance of a disordered structure in both materials at high pressure is not entirely unexpected, given that the same kind of structure is known to appear in a variety of Bi-Te compounds Loa et al. (2016); Stillwell et al. (2016). When pressure was unloaded, this phase persisted until about .
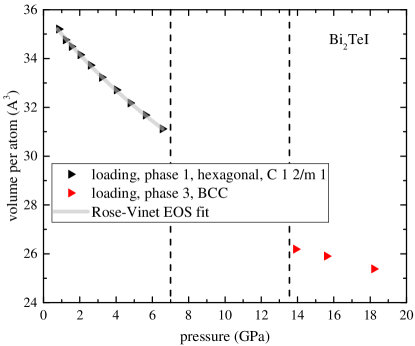
The structural changes are also illustrated in Figs. 7 and 8, which show the pressure dependent volume per atom of Bi2TeI and Bi3TeI, respectively. The grey line in Fig. 7 is a Rose-Vinet Equation of State (EOS) fit to the low pressure data, which gives the parameters B0 = , B = , and V0 = . The high pressure EOS was not fitted due to the small number of data points.
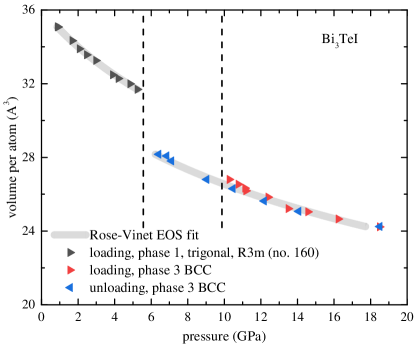
Two Rose-Vinet Equation of State fits were performed on the Bi3TeI data, one for each of the high and low pressure phases, and are indicated in Fig. 8 by light grey lines. In the fit to the low pressure data, V0 was fixed to based on the known value of the ambient pressure cell volume as reported in Zeugner et al. (2017). This fit gives the values B0 = and B = . At high pressure, there were not enough data points to obtain reasonable values from the Rose-Vinet fit on its own. In order to make a rough estimate of B0 and V0, B was fixed to 4.78, which is the value of B for the high pressure phase of Bi2Te, taken from Stillwell et al. (2016). The result of this fit gives B0 = .
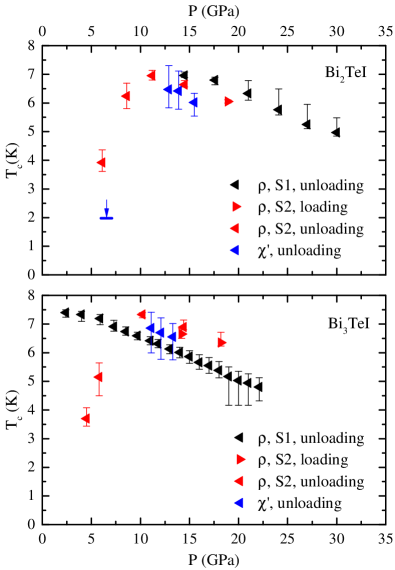
Phase diagrams for both compounds are presented in Fig. 9. The results show that the high pressure phase exhibits a negative . Upon pressure unloading, superconductivity persists, suggesting that the structure is metastable.
VII Discussion
Since Bi2TeI and Bi3TeI are composed of BiTeI layers with Bi-bilayers, we find it useful to compare our high-pressure results to those observed in BiTeI. In BiTeI, structural transitions occur near and at room temperature Chen et al. (2013). BiTeI begins to superconduct either in the high-pressure phase II or III VanGennep et al. (2017); Jin et al. (2017a); Qi et al. (2017). Though Chen et al. Chen et al. (2013) report that phase III of BiTeI exists in a P4/nmm structure, we find that a (Im3m) structure produces much better agreement with the observed high pressure diffraction peaks, as demonstrated in Fig. 11(a). This would also align with other works that suggest similar phases in other bismuth telluride compounds Loa et al. (2016). Our own x-ray diffraction measurements, shown in Fig. 11(b) and (c), demonstrate that Bi2TeI and Bi3TeI also assume this same structure in their high-pressure phases. In BiTeI, Tc reaches a maximum of near VanGennep et al. (2017) under decompression at low temperature. Bi2TeI achieves a maximum Tc of near upon decompression, and Bi3TeI achieves a maximum Tc of near 2 and , also upon decompression. The introduction of Bi layers into the BiTeI system tends to increase Tc, while Hc for these compounds are all roughly the same () VanGennep et al. (2017); Jin et al. (2017a); Qi et al. (2017). Our studies on Bi2TeI and Bi3TeI show systematic differences in Tc which are similar to those seen in the Bi2Te, Bi2Te3 and Bi4Te3 Jeffries et al. (2011); Stillwell et al. (2016), where the addition of Bi-bilayers increases Tc, and maximum values of Tc tend towards the maximum Tc value observed in elemental Bi () Lotter and Wittig (1988); Valladares et al. (2018).
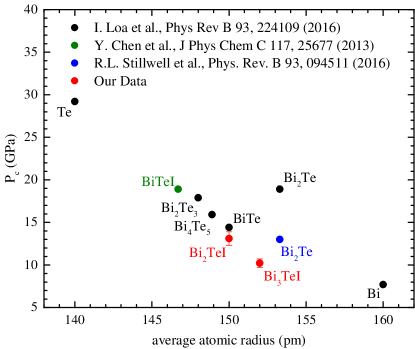
A comparison between the critical pressure for the transition to the disordered structure and the average atomic radius for several bismuth telluride compounds is presented in Fig. 10. Volumes were calculated from covalent atomic radii provided by J. C. Slater Slater (1964). Figure 10 includes data from I. Loa et al. Loa et al. (2016), and also includes BiTeI data from Y. Chen et al. Chen et al. (2013) (based on our fit of their diffraction data), Bi2Te data from R. L. Stillwell et al. Stillwell et al. (2016), and our own data on the compounds Bi2TeI and Bi3TeI. A clear trend is observed where the critical pressure for the transition to the disordered structure drops with increasing average atomic radius.
VIII Conclusion
We report electrical resistivity and magnetic susceptibility measurements on Bi2TeI and Bi3TeI to pressures as high as . Both samples exhibit pressure-induced structural transitions indicated by sharp drops in the resistivities as a function of pressure. X-ray diffraction measurements reveal a disordered structure emerges at high pressure in both compounds. Magnetic susceptibility measurements show features consistent with 100% superconducting shielding, and thus confirm the bulk nature of the observed superconductivity. The results indicate that Bi-Te and Bi-Te-I compounds, while structurally distinct at ambient pressure, eventually transform into a universal superconducting alloy phase at high pressure. Bi-Te-I compounds effectively become multi-principal element alloys (closely related HEA “high entropy alloys”) at high pressure and join a large family of such HEA-type superconducting materials Mizuguchi and Yamashita (2021).
Acknowledgments
Initial experiments supported by National Science Foundation (NSF) CAREER award DMR-1453752. Data analysis supported by NSF DMREF-2118718. High pressure technique development was partially supported by a National High Magnetic Field Laboratory User Collaboration Grant. The National High Magnetic Field Laboratory is supported by the NSF via Cooperative agreement No. DMR-1157490, the State of Florida, and the U.S. Department of Energy. RB was supported by NSF DMR-1904361. We thank Yue Meng for experimental assistance. Portions of this work were performed at HPCAT (Sector 16), Advanced Photon Source (APS), Argonne National Laboratory. HPCAT operations are supported by DOE-NNSA’s Office of Experimental Sciences. The Advanced Photon Source is a U.S. Department of Energy (DOE) Office of Science User Facility operated for the DOE Office of Science by Argonne National Laboratory under Contract No. DE-AC02-06CH11357.
References
- Hasan and Kane (2010) M. Z. Hasan and C. L. Kane, Reviews of Modern Physics 82, 3045 (2010).
- Ando (2013) Y. Ando, Journal of the Physical Society of Japan 82, 102001 (2013).
- Qi and Zhang (2011) X.-L. Qi and S.-C. Zhang, Reviews of Modern Physics 83, 1057 (2011).
- Wehling et al. (2014) T. Wehling, A. Black-Schaffer, and A. Balatsky, Advances in Physics 63, 1 (2014).
- Ishizaka et al. (2011) K. Ishizaka, M. S. Bahramy, H. Murakawa, M. Sakano, T. Shimojima, T. Sonobe, K. Koizumi, S. Shin, H. Miyahara, A. Kimura, K. Miyamoto, T. Okuda, H. Namatame, M. Taniguchi, R. Arita, N. Nagaosa, K. Kobayashi, Y. Murakami, R. Kumai, Y. Kaneko, Y. Onose, and Y. Tokura, Nature Materials 10, 521 (2011).
- Sakano et al. (2013) M. Sakano, M. S. Bahramy, A. Katayama, T. Shimojima, H. Murakawa, Y. Kaneko, W. Malaeb, S. Shin, K. Ono, H. Kumigashira, R. Arita, N. Nagaosa, H. Y. Hwang, Y. Tokura, and K. Ishizaka, Physical Review Letters 110 (2013), 10.1103/PhysRevLett.110.107204.
- Landolt et al. (2013) G. Landolt, S. V. Eremeev, O. E. Tereshchenko, S. Muff, B. Slomski, K. A. Kokh, M. Kobayashi, T. Schmitt, V. N. Strocov, J. Osterwalder, E. V. Chulkov, and J. Hugo Dil, New Journal of Physics 15, 085022 (2013).
- Bahramy et al. (2012) M. Bahramy, B.-J. Yang, R. Arita, and N. Nagaosa, Nature Communications 3 (2012), 10.1038/ncomms1679.
- Rusinov et al. (2016a) I. P. Rusinov, T. V. Menshchikova, I. Y. Sklyadneva, R. Heid, K.-P. Bohnen, and E. V. Chulkov, New Journal of Physics 18, 113003 (2016a).
- VanGennep et al. (2014) D. VanGennep, S. Maiti, D. Graf, S. W. Tozer, C. Martin, H. Berger, D. L. Maslov, and J. J. Hamlin, Journal of Physics: Condensed Matter 26, 342202 (2014).
- Xi et al. (2013) X. Xi, C. Ma, Z. Liu, Z. Chen, W. Ku, H. Berger, C. Martin, D. B. Tanner, and G. L. Carr, Physical Review Letters 111 (2013), 10.1103/PhysRevLett.111.155701.
- Park et al. (2015) J. Park, K.-H. Jin, Y. J. Jo, E. S. Choi, W. Kang, E. Kampert, J.-S. Rhyee, S.-H. Jhi, and J. S. Kim, Scientific Reports 5 (2015), 10.1038/srep15973.
- Crassee et al. (2017) I. Crassee, F. Borondics, M. K. Tran, G. Autès, A. Magrez, P. Bugnon, H. Berger, J. Teyssier, O. V. Yazyev, M. Orlita, and A. Akrap, Physical Review B 95 (2017), 10.1103/PhysRevB.95.045201.
- Chen et al. (2013) Y. Chen, X. Xi, W.-L. Yim, F. Peng, Y. Wang, H. Wang, Y. Ma, G. Liu, C. Sun, C. Ma, Z. Chen, and H. Berger, The Journal of Physical Chemistry C 117, 25677 (2013).
- Sans et al. (2016) J. A. Sans, F. J. Manjón, A. L. J. Pereira, R. Vilaplana, O. Gomis, A. Segura, A. Muñoz, P. Rodríguez-Hernández, C. Popescu, C. Drasar, and P. Ruleova, Physical Review B 93 (2016), 10.1103/PhysRevB.93.024110.
- VanGennep et al. (2017) D. VanGennep, A. Linscheid, D. E. Jackson, S. T. Weir, Y. K. Vohra, H. Berger, G. R. Stewart, R. G. Hennig, P. J. Hirschfeld, and J. J. Hamlin, Journal of Physics: Condensed Matter 29, 09LT02 (2017).
- Qi et al. (2017) Y. Qi, W. Shi, P. G. Naumov, N. Kumar, R. Sankar, W. Schnelle, C. Shekhar, F.-C. Chou, C. Felser, B. Yan, and S. A. Medvedev, Advanced Materials 29, 1605965 (2017).
- Jin et al. (2017a) M. L. Jin, F. Sun, L. Y. Xing, S. J. Zhang, S. M. Feng, P. P. Kong, W. M. Li, X. C. Wang, J. L. Zhu, Y. W. Long, H. Y. Bai, C. Z. Gu, R. C. Yu, W. G. Yang, G. Y. Shen, Y. S. Zhao, H. K. Mao, and C. Q. Jin, Scientific Reports 7 (2017a), 10.1038/srep39699.
- Ying et al. (2016) J.-J. Ying, V. V. Struzhkin, Z.-Y. Cao, A. F. Goncharov, H.-K. Mao, F. Chen, X.-H. Chen, A. G. Gavriliuk, and X.-J. Chen, Physical Review B 93 (2016), 10.1103/PhysRevB.93.100504.
- Jin et al. (2017b) M. Jin, S. Zhang, L. Xing, W. Li, G. Zhao, X. Wang, Y. Long, X. Li, H. Bai, C. Gu, and C. Jin, Journal of Physics and Chemistry of Solids (2017b), 10.1016/j.jpcs.2017.09.024.
- Savilov et al. (2005) S. V. Savilov, V. N. Khrustalev, A. N. Kuznetsov, B. A. Popovkin, and M. Y. Antipin, ChemInform 36 (2005), 10.1002/chin.200547022.
- Babanly et al. (2009) M. Babanly, J.-C. Tedenac, Z. Aliyev, and D. Balitsky, Journal of Alloys and Compounds 481, 349 (2009).
- Zeugner et al. (2017) A. Zeugner, M. Kaiser, P. Schmidt, T. V. Menshchikova, I. P. Rusinov, A. V. Markelov, W. Van den Broek, E. V. Chulkov, T. Doert, M. Ruck, and A. Isaeva, Chemistry of Materials 29, 1321 (2017).
- Ryu et al. (2016) G. Ryu, K. Son, and G. Schütz, Journal of Crystal Growth 440, 26 (2016).
- Tu et al. (2018) K. Tu, P. Wei, H. Zhou, X. Mu, W. Zhu, X. Nie, and W. Zhao, Energies 11 (2018), 10.3390/en11040891.
- Aliev and Babanly (2008) Z. S. Aliev and M. B. Babanly, Inorganic Materials 44, 1076 (2008).
- Rusinov et al. (2016b) I. P. Rusinov, T. V. Menshchikova, A. Isaeva, S. V. Eremeev, Y. M. Koroteev, M. G. Vergniory, P. M. Echenique, and E. V. Chulkov, Scientific Reports 6, 20734 (2016b).
- Zeugner et al. (2018) A. Zeugner, J. Teichert, M. Kaiser, T. V. Menshchikova, I. P. Rusinov, A. V. Markelov, E. V. Chulkov, T. Doert, M. Ruck, and A. Isaeva, Chemistry of Materials (2018), 10.1021/acs.chemmater.8b02005.
- Tang et al. (2014) P. Tang, B. Yan, W. Cao, S.-C. Wu, C. Felser, and W. Duan, Physical Review B 89 (2014), 10.1103/physrevb.89.041409.
- Wei et al. (2016) P. Wei, J. Yang, L. Guo, S. Wang, L. Wu, X. Xu, W. Zhao, Q. Zhang, W. Zhang, M. S. Dresselhaus, and J. Yang, Advanced Functional Materials 26, 5360 (2016).
- Kane and Mele (2005) C. L. Kane and E. J. Mele, Physical Review Letters 95 (2005), 10.1103/PhysRevLett.95.146802.
- Kirshenbaum et al. (2013) K. Kirshenbaum, P. S. Syers, A. P. Hope, N. P. Butch, J. R. Jeffries, S. T. Weir, J. J. Hamlin, M. B. Maple, Y. K. Vohra, and J. Paglione, Physical Review Letters 111, 087001 (2013).
- He et al. (2016) L. He, Y. Jia, S. Zhang, X. Hong, C. Jin, and S. Li, npj Quantum Materials 1, 1 (2016).
- Kang et al. (2015) D. Kang, Y. Zhou, W. Yi, C. Yang, J. Guo, Y. Shi, S. Zhang, Z. Wang, C. Zhang, S. Jiang, A. Li, K. Yang, Q. Wu, G. Zhang, L. Sun, and Z. Zhao, Nature Communications 6, 7804 (2015).
- Qi et al. (2016) Y. Qi, P. G. Naumov, M. N. Ali, C. R. Rajamathi, W. Schnelle, O. Barkalov, M. Hanfland, S.-C. Wu, C. Shekhar, Y. Sun, V. Süß, M. Schmidt, U. Schwarz, E. Pippel, P. Werner, R. Hillebrand, T. Förster, E. Kampert, S. Parkin, R. J. Cava, C. Felser, B. Yan, and S. A. Medvedev, Nature Communications 7, 11038 (2016).
- Stillwell et al. (2016) R. L. Stillwell, Z. Jenei, S. T. Weir, Y. K. Vohra, and J. R. Jeffries, Physical Review B 93 (2016), 10.1103/PhysRevB.93.094511.
- Prescher and Prakapenka (2015) C. Prescher and V. B. Prakapenka, High Pressure Research 35, 223 (2015).
- Toby and Von Dreele (2013) B. H. Toby and R. B. Von Dreele, Journal of Applied Crystallography 46, 544 (2013).
- Chijioke et al. (2005) A. D. Chijioke, W. J. Nellis, A. Soldatov, and I. F. Silvera, Journal of Applied Physics 98, 114905 (2005).
- Weir et al. (2000) S. T. Weir, J. Akella, C. Aracne-Ruddle, Y. K. Vohra, and S. A. Catledge, Applied Physics Letters 77, 3400 (2000).
- Feng et al. (2014) Y. Feng, D. M. Silevitch, and T. F. Rosenbaum, Review of Scientific Instruments 85, 033901 (2014).
- Deemyad et al. (2001) S. Deemyad, J. Schilling, J. Jorgensen, and D. Hinks, Physica C: Superconductivity 361, 227 (2001).
- Torikachvili et al. (2015) M. S. Torikachvili, S. K. Kim, E. Colombier, S. L. Bud’ko, and P. C. Canfield, Review of Scientific Instruments 86, 123904 (2015).
- Xu et al. (2015) G. Xu, W. Wang, X. Zhang, Y. Du, E. Liu, S. Wang, G. Wu, Z. Liu, and X. X. Zhang, Scientific Reports 4 (2015), 10.1038/srep05709.
- Buzea and Robbie (2004) C. Buzea and K. Robbie, Superconductor Science and Technology 18, R1 (2004).
- Hamlin (2015) J. J. Hamlin, Physica C: Superconductivity and its Applications Superconducting Materials: Conventional, Unconventional and Undetermined, 514, 59 (2015).
- Shimizu (2015) K. Shimizu, Physica C: Superconductivity and its Applications 514, 46 (2015).
- Jeffries et al. (2011) J. R. Jeffries, A. L. Lima Sharma, P. A. Sharma, C. D. Spataru, S. K. McCall, J. D. Sugar, S. T. Weir, and Y. K. Vohra, Physical Review B 84 (2011), 10.1103/PhysRevB.84.092505.
- Nikolo (1995) M. Nikolo, American Journal of Physics 63, 57 (1995).
- Werthamer et al. (1966) N. R. Werthamer, E. Helfand, and P. C. Hohenberg, Physical Review 147, 295 (1966).
- Loa et al. (2016) I. Loa, J.-W. G. Bos, R. A. Downie, and K. Syassen, Physical Review B 93 (2016), 10.1103/PhysRevB.93.224109.
- Lotter and Wittig (1988) N. Lotter and J. Wittig, Europhysics Letters (EPL) 6, 659 (1988).
- Valladares et al. (2018) A. A. Valladares, I. Rodríguez, D. Hinojosa-Romero, A. Valladares, and R. M. Valladares, Scientific Reports 8 (2018), 10.1038/s41598-018-24150-3.
- Slater (1964) J. C. Slater, The Journal of Chemical Physics 41, 3199 (1964).
- Mizuguchi and Yamashita (2021) Y. Mizuguchi and A. Yamashita, in Advances in High-Entropy Alloys - Materials Research, Exotic Properties and Applications (IntechOpen, 2021).