Observation of electromagnetic filamentary structures produced by the Weibel instability in laser-driven plasmas
Abstract
We present experimental observations of electron-scale structures in an expanding high-energy-density (HED) plasma generated with a modest intensity , laser. The observed structures have wavelengths (150-220 ) and growth rates (0.4-1.0 ) consistent with an electron-driven Weibel instability where the anisotropy in the electron distribution is small, . This instability is found to be a better match to the observed phenomena than other typical field-generation mechanisms found in HED plasmas, including counter-streaming ion Weibel and magnetothermal instabilities. These observations experimentally demonstrate for the first time that the electron Weibel instability must be considered alongside other magnetic field generation and amplification mechanisms in expanding ablation plasmas, which are ubiquitous in HED research. They also provide physics insight into the generation of magnetic fields in large-scale astrophysical plasmas. Additionally, inspection of the magnetic power spectrum shows a possible scaling match to analytic gyrokinetic predictions, , at scales below the electron Larmor radius.
Magnetic-field-generation mechanisms in plasmas are important in a broad array of fields, from inertial-confinement fusion to astrophysics [1, 2, 3, 4]. The Biermann battery is understood to be one of the plausible mechanisms for generating seed magnetic fields in interstellar plasmas; however it is hard to explain how these fields could have been amplified to observed levels, except through subsequent amplification over many orders of magnitude by turbulent dynamo [5]. The Weibel instability is another candidate for field generation and amplification [6, 7]. While saturated Biermann fields scale inversely with the scale length, [8], the Weibel-generated fields saturate at amplitudes independent of the system size, and thus can exceed the Biermann fields by many orders of magnitude for systems with large scale-lengths, as has been predicted by a variety of particle-in-cell (PIC) simulations [9, 10, 5, 11, 12, 13, 14].
Theoretical predictions show that anisotropies in the velocity distribution of plasma species are unstable to the Weibel instability [6]. The Weibel instability can have different scaling depending on which species is anisotropic, ions or electrons, and the form of the anisotropy [15]. In a bi-Maxwellian electron distribution function (different temperatures in different directions) the degree of temperature anisotropy between directions is linked to both the maximum growth rate and the dominant unstable wavenumber through separate formulae [15]:
| (1) | ||||
| (2) |
with the anisotropy defined as , where is the electron thermal velocity, and are the temperatures in the directions perpendicular and parallel to , respectively, and .
Previous laser-driven experiments have probed the Weibel instability in different regimes: fast interpenetrating flows of ions in counter-streaming ablated plasmas from long, modest intensity lasers which drive the instability through ion anisotropy (and seek to form ion Weibel instability-mediated "collisionless shocks") [16, 17, 18], while much higher intensity , lasers drive the electron population into a collisionless state with large anisotropies from return currents [19, 20]. In contrast, intensity lasers can drive a single ablation flow devoid of ion counterstreaming, where small electron anisotropies are driven by a number of possible mechanisms, chief of which is the collisions between hot electrons and the essentially free-expanding ion population of the ablating plasma. These collisions can redistribute electron momentum from the expansion direction to the transverse direction [21, 22]. Although simulations have addressed this free-expansion regime and some experiments [23, 24, 25] see filamentary structure that they attribute to a number of possible causes, there have been no experiments to our knowledge which systematically investigate the spatial structure and temporal dynamics of the filamentary structures in expanding laser-ablated plasmas to the extent where it is possible to draw conclusions on the underlying mechanism. These -duration, -energy pulses set up strong density and temperature gradients which support both the Biermann battery (as has been established by prior work [26, 27, 28, 29, 30]) and, as is demonstrated in this Letter, a thermal anisotropy which supports the electron Weibel instability.
In this Letter, we present the results of experiments on the OMEGA laser investigating the electron Weibel instability in this unexplored regime with intensity . The experiments shed light on the spatial structure and temporal evolution of Weibel-instability-generated magnetic fields, and show properties consistent with analytical predictions and PIC simulations of the electron Weibel instability in expanding plasmas.
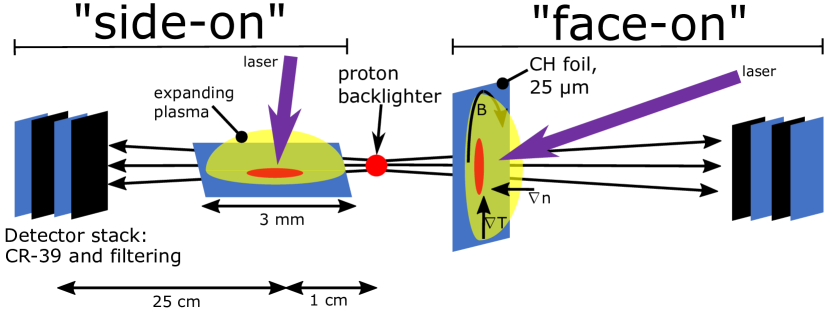
Shown in Fig. 1 is a diagram of the experiment. Two 25 thick polystyrene (CH) foils are driven in identical laser configurations simultaneously, each by 6 beams of the 351 nm OMEGA laser. The pulse is a 1 , 3 drive (6 beams at 0.5 and 1 each, staggered in time) with a super-Gaussian spot profile with a diameter of 716 . The laser ablates material from the foil and generates an expanding plasma bubble. Misaligned temperature and density gradients allow the Biermann battery mechanism to generate a large-scale magnetic field oriented circumferentially around the bubble. An implosion-based proton backlighter generates 14.7 MeV protons through the fusion of deuterium with helium-3 [31, 32], which stream in all directions; those that pass through the experiment are individually recorded on a CR-39 detector. The deflections the protons experience in the plasma as a result of magnetic and electric fields manifest as variations in the detected particle flux. The experiments are run with two diagnostic configurations: "side-on" with protons probing parallel to the surface of the foil, and "face-on" with protons passing through the face of the CH foil. In the face-on configuration the protons are sensitive to the largely perpendicular Biermann magnetic field, while in the side-on view the deflections from the Biermann fields are cancelled out [33]. In the side-on view, voids in the recorded proton flux appear near the foil corresponding to large-scale electric fields because the target foil has a net charge. This region is avoided in the reconstruction of fields from the proton radiographs.
Thomson scattering measurements provide a local measurement of electron temperature and density in the expanding plasma bubble. The probe beam and collection optics are focused on a small 100 50 cylinder offset 1 mm radially and 1 mm vertically from the center of the laser spot on the CH foil. The probe beam is a 45 J, 1 ns pulse of 527 nm light (frequency-doubled from the OMEGA driver’s 1053 nm wavelength). Light which scatters from the electron plasma wave (EPW) is recorded with spectral and temporal information resolved [34]. This data is fit with a model of EPW Thomson scattering spectra to extract key aspects of the plasma conditions: electron temperature and electron density, as a function of time [34]. After the very hot front of the bubble passes the measurement volume at 1 ns, the electron temperature and density are observed to be roughly constant at 900 eV and electrons per cubic centimeter.
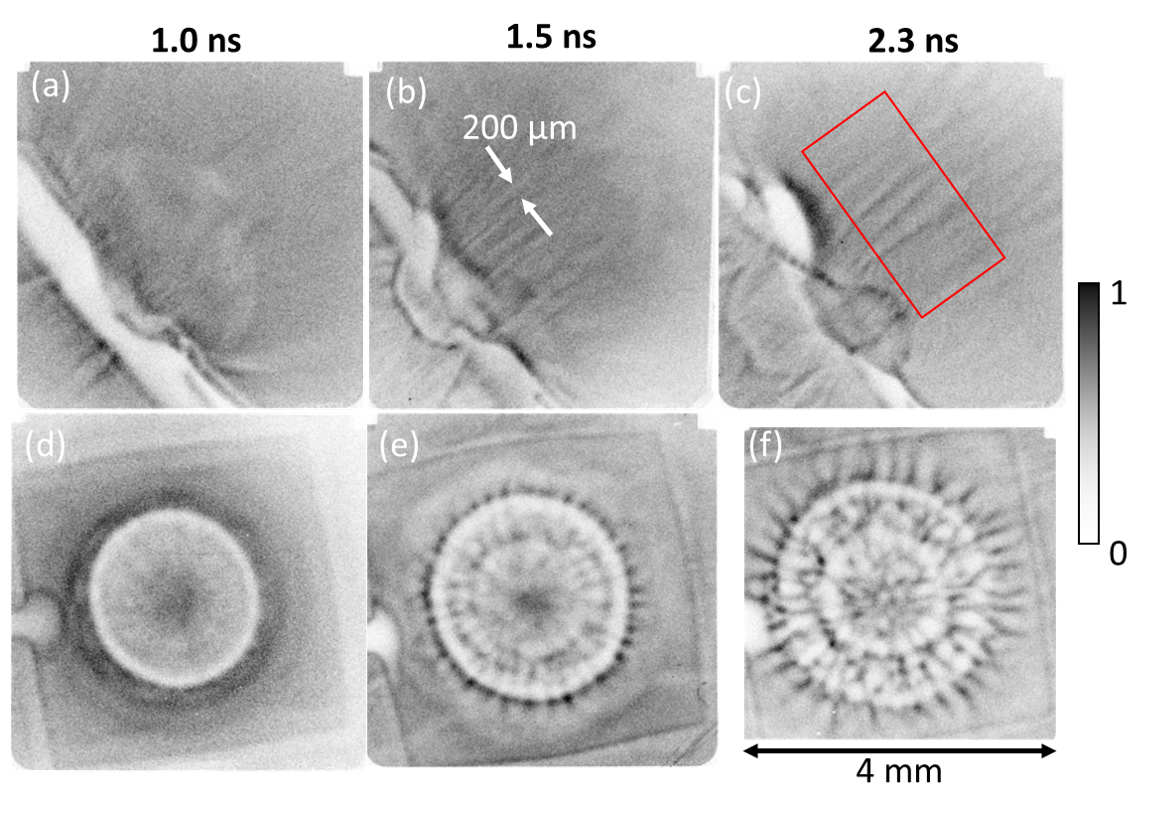
Proton radiographs record the spatial structure and temporal evolution of current filaments through the sensitivity of the protons to magnetic and electric fields. Shown in Fig. 2 are the two sets of radiographs.The time at which the protons probe the subject plasma is controlled by adjusting the proton backlighter laser drive relative to the subject laser drive in repeated experiments. The time it takes for protons to travel from the backlighter to the subject plasma is accounted for. The implosion of the backlighter creates a proton source of size 50 full-width-half-maximum, which is the limiting factor in spatial resolution for the radiographs [31]. Protons are released within a 100 ps window, which sets the temporal resolution of each individual radiograph [31, 32, 35]. At 1.0 , there are few filaments visible in the side-on configuration and none visible in face-on configuration (which is more sensitive to the larger Biermann fields [33] and subject to scattering in the foil material, which effectively adds 20 of spatial blur in the subject plasma coordinates). The faint outline of the bubble interface is visible, and indicates a bubble front expansion velocity of order 1000 km/s. Immediately afterwards, at the 1.5 , we see the emergence of 200 filaments extending largely perpendicularly from the foil. The face-on radiographs reveal that these filaments, superimposed upon the Biermann deflection pattern, have some radial component from the center of the plasma bubble. At 2.3 , the filaments are very prominent and have longer wavelengths. PIC simulations also show this behavior, as longer wavelengths take a longer time to grow [12]. Especially in the side-on configuration, we are sampling a "forest" of filaments: what is seen is the resulting particle flux from the line-integrated deflections experienced along their trajectory. Interpretation of this is simplified by recent simulation work which shows that feature sizes as measured on a radiograph in a similar geometry are directly related to the filament size (and not, for example, the filament spacing) [16, 36].
The strength and dynamics of the measured magnetic fields are inferred from the reconstruction of proton radiographs. We have used an “optimal transport” algorithm which infers the deflection field, , that must have been imparted on the probe protons in order to generate the distribution seen on the detector [37, 38]. The deflection field is converted to the path-integrated perpendicular magnetic field through the relation
| (3) |
where , , and are the mass, velocity, and charge of the probing proton. The value of is a multiplicative constant along each line of sight and is not important when evaluating the overall shape of spectra of the reconstructed magnetic field.
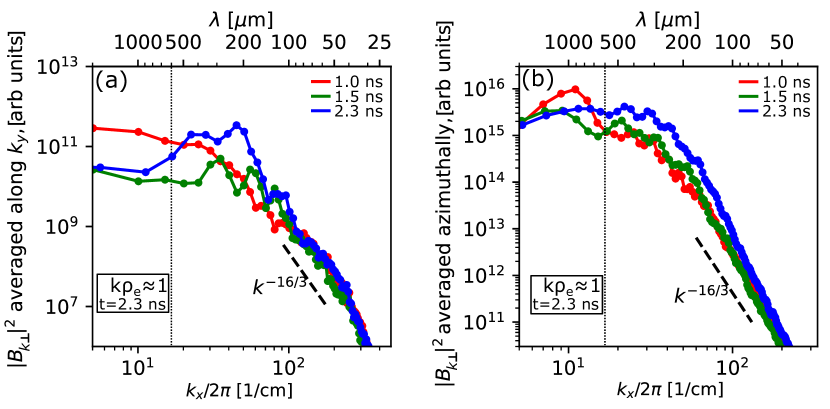
Fourier spectra of the reconstructed magnetic fields are computed and plotted in Fig. 3. For early times, the spectra are dominated by large-scale deflections (i.e. small ). Spectral content at high wavenumber (associated with filaments) develops with time and grows substantially by the latest recorded time. The amplitude of the magnetic field, particularly at the wavelengths matching the identified filaments (broadly, 150-220 ), are seen to grow as a function of time.
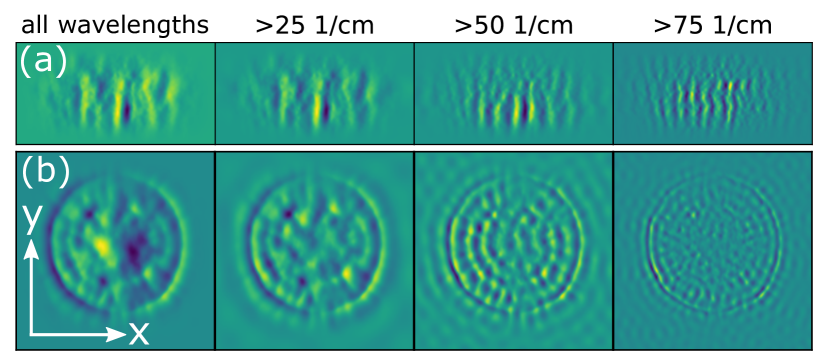
To assess what parts of the spectra are associated with what spatial features, a transverse-component of the reconstructed magnetic field, , is high-pass filtered at a variety of wavenumbers . These are plotted for time = 1.5 ns in Fig. 4, along with the original reconstruction and the orientation of the y-direction (plots for all times can be found in the supplemental material, [39]). For side-on radiographs, filamentary structures are present at a variety of wavenumbers. The face-on reconstructions are more complex: low-wavenumber features contain a great deal of circular Biermann-battery-related spatial features and therefore assessing the correct amplitude of the Weibel fields is difficult. The spatial gradients in in face-on reconstructions are sufficiently sharp such that all of the wavenumber bins contain some degree of Biermann-field spatial signature.
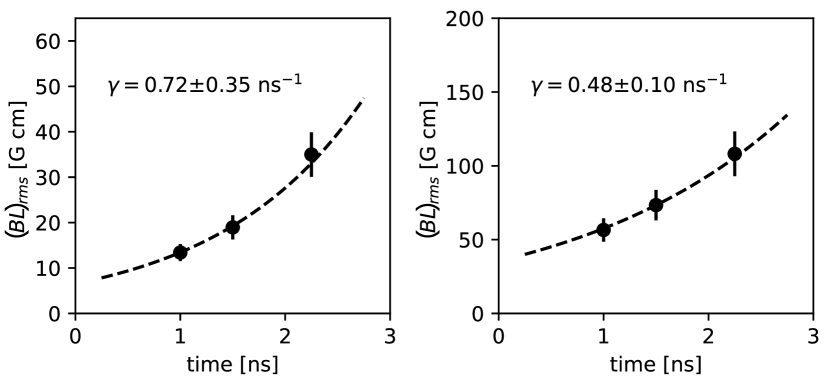
The magnitude of the fields associated with the filaments is quantified by calculating the root-mean-square (RMS) of the y-component of high-passed magnetic field reconstructions, , with high-pass cutoff wavenumber . The growth rate of the magnetic field is calculated using the values as a function of time using the relation for growth at a given :
| (4) |
The two measurements in the time intervals and are averaged to get the time-averaged growth rate . The quantities and are very sensitive to the choice of , which is somewhat arbitrary. A reasonable high-pass filter cut in would necessarily include a greater Biermann contribution at early times relative to later times. A sensible compromise seems to be somewhere around 50 cm-1, based on inspection of the structures in Fig. 3 and Fig. 4. The calculation of and is repeated for a variety of ’s, and are averaged with a Gaussian weighting function centered at 50 cm-1 with standard deviation 20 cm-1. The result is the Gaussian-weighted lumped growth rate . Similarly, the uncertainty in is the Gaussian-weighted standard deviation of the values. This process captures our assessment that the scale at which the Weibel features are sufficiently pronounced relative to Biermann features is typically at 50 cm-1, but includes the degree of uncertainty and arbitrariness of this assessment as an error in the measured RMS fields and growth rates . This choice of is the dominant source of error in the resulting and in the analysis; while experimental details of the proton radiography measurements contribute 10% error and the reconstruction (including choices made in preparing the data for reconstruction) contributes no more than 10% error to measured values, the error from the choice of is found to be larger than this.
The extracted for each time in the two configurations are plotted in Fig. 5. The error bars shown are the statistical error bars from experimental uncertainties in proton radiography system characteristics and reconstruction uncertainty, a combined 14% relative error in . The -related correlated error in is not shown. The growth rate for the side-on case is found to be 0.720.35 , while the face-on case measures 0.480.10 . The face-on case likely includes Biermann battery field content in its earlier-time measurements of , thus is expected to underestimate the true growth rate, explaining the difference seen in the measured .
Applying the bi-Maxwellian predicted wavenumber-anisotropy relation, eq. (1), the measured wavelengths (150-220 ) correspond to an anisotropy of and a growth rate of . Conversely, the measured growth rate (0.720.35 ) corresponds to an anisotropy of (using eq. (2)), and a peak wavelength of . The agreement of these two independent calculations of anisotropy shows that there is an internal consistency in the explanation that an anisotropy in the electron distribution function is driving the formation of current filaments through the Weibel instability. Based on the Thomson scattering measurements, electron-ion collisional mean-free-paths are 50 , smaller than the plasma system size 1000 . As suggested by previous work, interactions between ions and electrons through collisions, as well as acceleration/deceleration by ambipolar electric fields at large pressure gradient interfaces, can serve to generate anisotropy in the electron distribution [21, 22].
Other instabilities and mechanisms are considered and ruled out, as summarized in Table 1. First, the ion Weibel instability involves a hypothetical background plasma into which the ablation flow expands, or similarly a pre-plasma created by early energy delivered by the laser. Work that has addressed relevant conditions [40] predicts a requisite pre-plasma density of at least to achieve growing ion Weibel filaments. The OMEGA chamber has a number density on the order , too small to contribute. Similarly, the OMEGA laser’s temporal contrast is excellent and we utilized a well-tested pulse shape. Moreover, Ref. [40] shows the morphology of the growing filamentary fields, which occur at the interface of the ablation plume and background plasmas, as opposed to throughout the ablation plume as we observe in our radiographs (Fig. 2). Additionally, a formula from PIC simulations which predicts the onset time of Weibel instability suggests that the system should be stable to the ion Weibel instability until at least [22].
By using the formulae for maximum growth rate and wavelength of maximum growth rate of the magnetothermal instability (MTI) found in Ref. [25], applying the parameters measured by Thomson scattering, taking thermal and density gradients to be approximately (consistent with laser profile and Thomson measurements), and taking 3.5 (fully ionized 1:1 CH plasma), the peak growth wavelength is predicted to be 190-, similar to the observed structures. The growth rate, however, is substantially higher than what is observed: estimates put the lower bound on growth rate at . The growth rate being so fast relative to experimental time scales suggests that if the MTI were indeed present at the scales observed it should be able to dominate magnetic field production, but this is not seen. The saturation condition for MTI is the same as that for the electron Weibel instability: when the cyclotron radius of the electrons from the perturbed (instability-related) magnetic field becomes small enough to be on the scale of the transverse wavelength of the instability, . This is not achieved at any time for wavelengths associated with the filaments; the wavelength at which this condition holds for the final observed time in both side-on and face-on measurement configurations is (as seen in Fig. 3), much larger than the scale of the observed filaments.
Lastly, the electrothermal instability (ETI) is a potential source of magnetic field in laser-driven plasmas, but is restricted to regions where the mean free path of electrons is much smaller than the electron inertial length [8]. In the expanding ablation plasma the electron inertial length is 1 , much smaller than the 50 mean free path. The ETI is more significant in generating magnetic field closer to the ablation region, where densities are much higher and temperatures fall off towards the dense and cold bulk of the foil.
| Observation/Mechanism | Growth Rate (1/ns) | Wavelength () |
|---|---|---|
| Observed filaments | 0.4-1.0 | 150-220 |
| Electron Weibel (with A=0.002) | 0.5 | 170 |
| Ion Weibel | Relevant PIC simulations [40] show poor spatial and temporal match to data. | |
| Magnetothermal instability | 10 | 190-250 |
| Electrothermal instability | 0.04 | Very large |
A feature is seen at high wavenumbers which is of separate interest. The slope of the power spectrum at wavenumbers greater than the main Weibel-related peaks but below the resolution limit 200 cm-1 (corresponding to a 50 imaging resolution dictated by the backlighter source size) tends to a constant power law relation, , as indicated in Fig. 3. This scaling was predicted in gyrokinetic analysis of magnetized turbulence at sub-electron scales [41] and subsequently observed in 3D PIC simulations of laser-target interactions in a configuration that reasonably matches that of our experiment [12, 13]. This could be a promising subject of future investigation.
To conclude, electron-Weibel-instability-generated magnetic-field structures and dynamics have been measured and quantified in a laser-produced, expanding plasma for the first time. Thomson scattering is used to accurately characterize the plasma temperature and density. Time-resolved proton radiography reveals the structure and temporal evolution of the filaments. Reconstruction of the magnetic fields from radiographs quantifies the magnetic field and its growth. We have shown that the observed structures have a wavelength and growth rate consistent with PIC predictions of the electron Weibel instability [12, 13], validating this prior work. Another similarity between our observations and the PIC results is the theoretically-predicted [41] spectral shape at larger wavenumbers than the Weibel-related peaks, which prompts further investigation. Quantitative and qualitative arguments exclude the role of other instabilities in forming the measured filamentary structure and dynamics. This work demonstrates that the electron Weibel instability must be considered alongside other magnetic field generation and amplification mechanisms in expanding ablation plasmas, and legitimizes scenarios for magnetic field generation in astrophysical plasmas based on the electron Weibel instability.
This work was supported in part by U.S. Department of Energy NNSA MIT Center-of-Excellence (DE-NA0003868), NLUF (DE-NA0003938), and NSF CAREER award No. 1654168.
References
- Igumenshchev et al. [2014] I. Igumenshchev, A. Zylstra, C. K. Li, P. Nilson, V. Goncharov, and R. Petrasso, Physics of Plasmas 21, 062707 (2014).
- Farmer et al. [2017] W. Farmer, J. Koning, D. Strozzi, D. Hinkel, L. Berzak Hopkins, O. Jones, and M. Rosen, Physics of Plasmas 24, 052703 (2017).
- Li et al. [2009] C. K. Li, F. H. Séguin, J. A. Frenje, R. D. Petrasso, P. A. Amendt, R. P. J. Town, O. L. Landen, J. R. Rygg, R. Betti, J. P. Knauer, D. D. Meyerhofer, J. M. Soures, C. A. Back, J. D. Kilkenny, and A. Nikroo, Physical Review Letters 102, 205001 (2009).
- Zweibel and Heiles [1997] E. G. Zweibel and C. Heiles, Nature 385, 131 (1997).
- Kulsrud and Zweibel [2008] R. M. Kulsrud and E. G. Zweibel, Reports on Progress in Physics 71, 10.1088/0034-4885/71/4/046901 (2008).
- Weibel [1959] E. S. Weibel, Physical Review Letters 2, 83 (1959).
- Schlickeiser and Shukla [2003] R. Schlickeiser and P. K. Shukla, The Astrophysical Journal 599, L57 (2003).
- Haines [1997] M. Haines, Physical Review Letters 78, 254 (1997).
- Silva et al. [2003] L. Silva, R. Fonseca, J. Tonge, J. Dawson, W. Mori, and M. Medvedev, The Astrophysical Journal 596, L121 (2003).
- Medvedev et al. [2006] M. V. Medvedev, L. O. Silva, and M. Kamionkowski, The Astrophysical Journal 642, L1 (2006).
- Kato and Takabe [2008] T. N. Kato and H. Takabe, The Astrophysical Journal 681, L93 (2008).
- Schoeffler et al. [2014] K. M. Schoeffler, N. F. Loureiro, R. A. Fonseca, and L. O. Silva, Physical Review Letters 112, 175001 (2014).
- Schoeffler et al. [2016] K. M. Schoeffler, N. F. Loureiro, R. Fonseca, and L. Silva, Physics of Plasmas 23, 056304 (2016).
- Zhou et al. [2022] M. Zhou, V. Zhdankin, M. W. Kunz, N. F. Loureiro, and D. A. Uzdensky, Proceedings of the National Academy of Sciences 119, e2119831119 (2022).
- Davidson et al. [1972] R. C. Davidson, D. A. Hammer, I. Haber, and C. E. Wagner, The Physics of Fluids 15, 317 (1972), https://aip.scitation.org/doi/pdf/10.1063/1.1693910 .
- Huntington et al. [2015] C. Huntington, F. Fiuza, J. Ross, A. Zylstra, R. Drake, D. Froula, G. Gregori, N. Kugland, C. Kuranz, M. Levy, et al., Nature Physics 11, 173 (2015).
- Fiuza et al. [2020] F. Fiuza, G. Swadling, A. Grassi, H. Rinderknecht, D. Higginson, D. Ryutov, C. Bruulsema, R. Drake, S. Funk, S. Glenzer, et al., Nature Physics 16, 916 (2020).
- Li et al. [2019] C. K. Li, V. Tikhonchuk, Q. Moreno, H. Sio, E. d’Humieres, X. Ribeyre, P. Korneev, S. Atzeni, R. Betti, A. Birkel, et al., Physical Review Letters 123, 055002 (2019).
- Quinn et al. [2012] K. Quinn, L. Romagnani, B. Ramakrishna, G. Sarri, M. E. Dieckmann, P. A. Wilson, J. Fuchs, L. Lancia, A. Pipahl, T. Toncian, O. Willi, R. J. Clarke, M. Notley, A. Macchi, and M. Borghesi, Physical Review Letters 108, 135001 (2012).
- Ruyer et al. [2020] C. Ruyer, S. Bolaños, B. Albertazzi, S. Chen, P. Antici, J. Böker, V. Dervieux, L. Lancia, M. Nakatsutsumi, L. Romagnani, et al., Nature Physics 16, 983 (2020).
- Thaury et al. [2009] C. Thaury, P. Mora, J. Adam, and A. Héron, Physics of Plasmas 16, 093104 (2009).
- Thaury et al. [2010] C. Thaury, P. Mora, A. Héron, and J. C. Adam, Physical Review E 82, 016408 (2010).
- Rygg et al. [2008] J. Rygg, F. Séguin, C. K. Li, J. Frenje, M.-E. Manuel, R. Petrasso, R. Betti, J. Delettrez, O. Gotchev, J. Knauer, et al., Science 319, 1223 (2008).
- Gao et al. [2016] L. Gao, H. Ji, G. Fiksel, W. Fox, M. Evans, and N. Alfonso, Physics of Plasmas 23, 043106 (2016).
- Manuel et al. [2013] M. J.-E. Manuel, C. K. Li, F. H. Séguin, N. Sinenian, J. Frenje, D. Casey, R. Petrasso, J. Hager, R. Betti, S. Hu, et al., Physics of Plasmas 20, 056301 (2013).
- Stamper et al. [1971] J. Stamper, K. Papadopoulos, R. Sudan, S. Dean, E. McLean, and J. Dawson, Physical Review Letters 26, 1012 (1971).
- Sakagami et al. [1979] Y. Sakagami, H. Kawakami, S. Nagao, and C. Yamanaka, Physical Review Letters 42, 839 (1979).
- Nilson et al. [2006] P. Nilson, L. Willingale, M. Kaluza, C. Kamperidis, S. Minardi, M. Wei, P. Fernandes, M. Notley, S. Bandyopadhyay, M. Sherlock, et al., Physical Review Letters 97, 255001 (2006).
- Li et al. [2007] C. K. Li, F. H. Séguin, J. A. Frenje, J. R. Rygg, R. D. Petrasso, R. P. Town, O. L. Landen, J. P. Knauer, and V. A. Smalyuk, Physical Review Letters 99, 10.1103/PhysRevLett.99.055001 (2007).
- Sutcliffe et al. [2022] G. D. Sutcliffe, J. A. Pearcy, T. M. Johnson, P. J. Adrian, N. V. Kabadi, B. Pollock, J. D. Moody, R. D. Petrasso, and C. K. Li, Physical Review E 105, L063202 (2022).
- Li et al. [2006a] C. K. Li, F. Séguin, J. Frenje, J. Rygg, R. Petrasso, R. Town, P. Amendt, S. Hatchett, O. Landen, A. Mackinnon, et al., Review of Scientific Instruments 77, 10E725 (2006a).
- Li et al. [2006b] C. K. Li, F. Séguin, J. Frenje, J. Rygg, R. Petrasso, R. Town, P. Amendt, S. Hatchett, O. Landen, A. Mackinnon, et al., Physical Review Letters 97, 135003 (2006b).
- Petrasso et al. [2009] R. D. Petrasso, C. K. Li, F. H. Seguin, J. R. Rygg, J. A. Frenje, R. Betti, J. P. Knauer, D. D. Meyerhofer, P. A. Amendt, D. H. Froula, O. L. Landen, P. K. Patel, J. S. Ross, and R. P. J. Town, Physical Review Letters 103, 085001 (2009).
- Sheffield et al. [2010] J. Sheffield, D. Froula, S. H. Glenzer, and N. C. Luhmann Jr, Plasma scattering of electromagnetic radiation: theory and measurement techniques (Academic press, 2010).
- Johnson et al. [2021] T. Johnson, A. Birkel, H. Ramirez, G. Sutcliffe, P. Adrian, V. Y. Glebov, H. Sio, M. G. Johnson, J. Frenje, R. Petrasso, et al., Review of Scientific Instruments 92, 043551 (2021).
- Levesque et al. [2019] J. Levesque, C. Kuranz, T. Handy, M. Manuel, and F. Fiuza, Physics of Plasmas 26, 102303 (2019).
- Sulman et al. [2011] M. M. Sulman, J. Williams, and R. D. Russell, Applied Numerical Mathematics 61, 298 (2011).
- Bott et al. [2017] A. Bott, C. Graziani, P. Tzeferacos, T. White, D. Lamb, G. Gregori, and A. Schekochihin, Journal of Plasma Physics 83 (2017).
- [39] See Supplemental Material at [URL will be inserted by publisher] for plots of magnetic field reconstructions and high-pass filtered reconstructions for all recorded times.
- Matteucci et al. [2019] J. Matteucci, W. Fox, A. Bhattacharjee, D. B. Schaeffer, K. Lezhnin, K. Germaschewski, G. Fiksel, J. Peery, and S. X. Hu, Weibel instability drives large magnetic field generation in laser-driven single plume ablation (2019), arXiv:1912.11120 [physics.plasm-ph] .
- Schekochihin et al. [2009] A. Schekochihin, S. Cowley, W. Dorland, G. Hammett, G. G. Howes, E. Quataert, and T. Tatsuno, The Astrophysical Journal Supplement Series 182, 310 (2009).