thanks: * Co-first authors are in alphabetical order.thanks: Qi Wu is the corresponding author.11institutetext: School of Data Science, City University of Hong Kong, Hong Kong, China 11email: yiyhuang3-c@my.cityu.edu.hk, chleung87@cityu.edu.hk, qiwu55@cityu.edu.hk 22institutetext: Guangdong Provincial Key Laboratory of Interdisciplinary Research and Application for Data Science, BNU-HKBU United International College, Zhuhai, China
a 22email: shuminma@uic.edu.cn
33institutetext: JD Digits, Beijing, China
33email: wangdongdong9@jd.com, huangzhixiang@jd.com

Moderately-Balanced Representation Learning for Treatment Effects with Orthogonality Information

Yiyan Huang 11**    Cheuk Hang Leung 11**    Shumin Ma 22    Qi Wu 1(1())    Dongdong Wang 33    Zhixiang Huang 33
Abstract

Estimating the average treatment effect (ATE) from observational data is challenging due to selection bias. Existing works mainly tackle this challenge in two ways. Some researchers propose constructing a score function that satisfies the orthogonal condition, which guarantees that the established ATE estimator is “orthogonal" to be more robust. The others explore representation learning models to achieve a balanced representation between the treated and the controlled groups. However, existing studies fail to 1) discriminate treated units from controlled ones in the representation space to avoid the over-balanced issue; 2) fully utilize the “orthogonality information". In this paper, we propose a moderately-balanced representation learning (MBRL) framework based on recent covariates balanced representation learning methods and orthogonal machine learning theory. This framework protects the representation from being over-balanced via multi-task learning. Simultaneously, MBRL incorporates the noise orthogonality information in the training and validation stages to achieve a better ATE estimation. The comprehensive experiments on benchmark and simulated datasets show the superiority and robustness of our method on treatment effect estimations compared with existing state-of-the-art methods.

Keywords:
Treatment effects Causal inference Representation learning

1 Introduction

Causal inference has drawn a lot of attention across various research areas including statistics [25, 2], economics and finance [7, 3, 15] commercial social network applications [10, 5] and health care [8, 12]. One of the main tasks of causal inference is to estimate the average treatment effect (ATE). For example, a biotech company must know to what extent a newly developed vaccine can reduce the probability of infection for the whole population. The classical method to acquire the ATE is to conduct randomized controlled trials (RCTs), where the treatment is randomly assigned to the population but not selectively. Then the effect of the vaccine (treatment) on the infection (outcome) is measured by the difference between the average infection rate of the vaccinated group (treated group) and that of the unvaccinated group (controlled group). RCTs are regarded as the golden standard for treatment effect estimation, but conducting RCTs is costly and time-consuming [21, 9]. Thus, estimating the treatment effects in the observational study instead of RCTs becomes more and more tempting.

When it comes to estimating the ATE from the observational data, we need to handle the selection bias. The selection bias exists due to the non-random treatment assignment. The treatment assignment may be further influenced by the covariates that also directly affect the outcome. In the vaccine example, limited vaccines tend to be distributed to vulnerable individuals who are susceptible to infection. Such a non-random treatment assignment mechanism naturally results in a covariate shift phenomenon. That is, the covariates of the treated population can substantially differ from that of the controlled population.

Two classical methods are developed for adjusting the shifted covariates: inverse propensity weighting (IPW) and regression adjustment (see more details in [26]). IPW weights the instances based on the propensity scores to mimic the principle of RCTs to estimate ATE. Nevertheless, the IPW estimators are sensitive to the misspecification of the propensity score. Regression adjustment methods directly estimate the outcome model instead of propensity scores, whereas they would inevitably lead to biased ATE estimations due to overfitting and regularization bias [3]. Researchers improve classical methods from the perspectives of statistics and methodology.

The orthogonal score function proposed in [3] is a statistical correction by incorporating both the outcome model and the propensity score estimations. Since such a score function satisfies the orthogonal condition, the ATE estimator derived from the score function is consistent as long as one of the two underlying relations is correctly specified. This is also known as the doubly robust property. Recently, balanced representation learning techniques have attracted researchers’ attention. The intuitive idea is to construct a pair of “twins" in the representation space by minimizing the imbalance between the distributions of the treated and controlled groups [23]. However, such methods mainly focus on the balance but overlook the discrimination between treated and controlled units. If the distributions of the treated and controlled groups in the representation space are too similar to be distinguished, it would be difficult to infer the ATE accurately. Such a trade-off plays a crucial role in identifying the treatment effects [23]. The importance of the undiscriminating problem is also emphasized by [10].

In this paper, with the tool of orthogonal machine learning, we propose a moderately-balanced representation learning (MBRL) framework to estimate the treatment effects. MBRL trains in a multi-task framework and stops on a perturbation error metric to obtain a moderately-balanced representation. The merits of MBRL include i) preserving predictive information for inferring individual outcomes; ii) designing a multi-task learning framework to achieve a moderately-balanced rather than over-balanced representation; iii) fully utilizing the orthogonality information during the training and validation stages to achieve superior treatment effect estimations.

2 Preliminaries

Potential Outcome Framework.

Let 𝐙𝐙\mathbf{Z} be s𝑠s-dimensional covariates such that 𝐙Zs𝐙Zsuperscripts\mathbf{Z}\in\pazocal{Z}\subset\mathbb{R}^{s}, where ZZ\pazocal{Z} is the sample space of covariates. D{0,1}𝐷01D\in\{0,1\} denotes the treatment variable. Y(0),Y(1)𝑌0𝑌1Y(0),Y(1) represent the potential outcomes for the treatment D=0𝐷0D=0 and D=1𝐷1D=1 respectively such that Y(0),Y(1)Y𝑌0𝑌1YY(0),Y(1)\in\pazocal{Y}\subset\mathbb{R} with YY\pazocal{Y} being the sample space of outcome. We denote w=(𝐳,d,y)𝑤𝐳𝑑𝑦w=(\mathbf{z},d,y) as the realizations of the random variables W=(𝐙,D,Y)𝑊𝐙𝐷𝑌W=(\mathbf{Z},D,Y). If the observed treatment is d𝑑d, then the factual outcome YFsuperscript𝑌𝐹Y^{F} equals Y(d)𝑌𝑑Y(d). We suppose the observational dataset contains N𝑁N individuals and the mthsuperscript𝑚𝑡m^{th} individual is observed as (𝐳m,dm,ym)subscript𝐳𝑚subscript𝑑𝑚subscript𝑦𝑚(\mathbf{z}_{m},d_{m},y_{m}). The target quantity ATE τ𝜏\tau is defined as τ:=𝔼[Y(1)Y(0)]assign𝜏𝔼delimited-[]𝑌1𝑌0\tau:=\mathbb{E}\left[Y(1)-Y(0)\right].

Identifying the treatment effects under the potential outcome framework [22] requires some fundamental assumptions: Strong Ignorability, Overlap, Consistency and Stable Unit Treatment Value Assumption (SUTVA). These assumptions guarantee that treatment effects can be inferred if we specify the relation 𝔼[YD,𝐙]𝔼delimited-[]conditional𝑌𝐷𝐙\mathbb{E}\left[Y\mid D,\mathbf{Z}\right], which is equivalent to estimating g0(D,𝐙)subscript𝑔0𝐷𝐙g_{0}(D,\mathbf{Z}) in the following interactive model when the treatment variable takes a binary value [3]:

Y𝑌\displaystyle Y =g0(D,𝐙)+ξ,absentsubscript𝑔0𝐷𝐙𝜉\displaystyle=g_{0}(D,\mathbf{Z})+\xi, 𝔼[ξD,𝐙]=0,𝔼delimited-[]conditional𝜉𝐷𝐙0\displaystyle\mathbb{E}\left[\xi\mid D,\mathbf{Z}\right]=0, (1)
D𝐷\displaystyle D =m0(𝐙)+ν,absentsubscript𝑚0𝐙𝜈\displaystyle=m_{0}(\mathbf{Z})+\nu, 𝔼[ν𝐙]=0.𝔼delimited-[]conditional𝜈𝐙0\displaystyle\mathbb{E}\left[\nu\mid\mathbf{Z}\right]=0.

Here, g0subscript𝑔0g_{0} and m0subscript𝑚0m_{0} are the true nuisance functions. ξ𝜉\xi and ν𝜈\nu are the noise terms. m0(𝐙)=𝔼[D𝐙]subscript𝑚0𝐙𝔼delimited-[]conditional𝐷𝐙m_{0}(\mathbf{Z})=\mathbb{E}\left[D\mid\mathbf{Z}\right] is the propensity score. Let i𝑖i be an element of {0,1}01\{0,1\}. The true causal parameter θ0isuperscriptsubscript𝜃0𝑖\theta_{0}^{i} is defined as θ0i:=𝔼[Y(i)]=𝔼[g0(i,𝐙)]assignsuperscriptsubscript𝜃0𝑖𝔼delimited-[]𝑌𝑖𝔼delimited-[]subscript𝑔0𝑖𝐙\theta_{0}^{i}:=\mathbb{E}\left[Y(i)\right]=\mathbb{E}\left[g_{0}(i,\mathbf{Z})\right] for i{0,1}𝑖01i\in\{0,1\}, and the true ATE τ𝜏\tau is computed by τ=θ01θ00𝜏superscriptsubscript𝜃01superscriptsubscript𝜃00\tau=\theta_{0}^{1}-\theta_{0}^{0}. We denote the estimated (θ0i,g0,m0)subscriptsuperscript𝜃𝑖0subscript𝑔0subscript𝑚0(\theta^{i}_{0},g_{0},m_{0}) as (θ^i,g^,m^)superscript^𝜃𝑖^𝑔^𝑚(\hat{\theta}^{i},\hat{g},\hat{m}), and then the estimated ATE is computed by τ^=θ^1θ^0^𝜏superscript^𝜃1superscript^𝜃0\hat{\tau}=\hat{\theta}^{1}-\hat{\theta}^{0}.

Orthogonal Estimators.

We aim to estimate the true causal parameters θ01subscriptsuperscript𝜃10\theta^{1}_{0} and θ00subscriptsuperscript𝜃00\theta^{0}_{0} given N𝑁N i.i.d. samples {Wm=(𝐙m,Dm,Ym)}m=1Nsubscriptsuperscriptsubscript𝑊𝑚subscript𝐙𝑚subscript𝐷𝑚subscript𝑌𝑚𝑁𝑚1\{W_{m}=(\mathbf{Z}_{m},D_{m},Y_{m})\}^{N}_{m=1}. The standard procedure to acquire the estimated causal parameters θ^1superscript^𝜃1\hat{\theta}^{1} and θ^0superscript^𝜃0\hat{\theta}^{0} is: 1) getting the estimated nuisance functions ρ^^𝜌\hat{\rho}, e.g., ρ^=(g^,m^)^𝜌^𝑔^𝑚\hat{\rho}=(\hat{g},\hat{m}); 2) constructing a score function ψ(W,θi,ρ)𝜓𝑊superscript𝜃𝑖𝜌\psi(W,\theta^{i},\rho) such that we can derive the estimated causal parameter θ^isuperscript^𝜃𝑖\hat{\theta}^{i} by solving 𝔼[ψ(W,θi,ρ^)]=0𝔼delimited-[]𝜓𝑊superscript𝜃𝑖^𝜌0\mathbb{E}\left[\psi(W,\theta^{i},\hat{\rho})\right]=0, where θisuperscript𝜃𝑖\theta^{i} is a causal parameter that lies in the causal parameter space. According to [3], the estimator θ^isuperscript^𝜃𝑖\hat{\theta}^{i} solved from 𝔼[ψ(W,θi,ρ^)]=0𝔼delimited-[]𝜓𝑊superscript𝜃𝑖^𝜌0\mathbb{E}\left[\psi(W,\theta^{i},\hat{\rho})\right]=0 is robust to the estimated nuisance functions ρ^^𝜌\hat{\rho} if the corresponding score function ψ(W,θi,ρ)𝜓𝑊superscript𝜃𝑖𝜌\psi(W,\theta^{i},\rho) satisfies the orthogonal condition that is stated in Definition 1.

Definition 1 (Orthogonal Condition)

Let W=(𝐙,D,Y)𝑊𝐙𝐷𝑌W=(\mathbf{Z},D,Y), ρ0=(h0,1,,h0,γ)subscript𝜌0subscript01subscript0𝛾\rho_{0}=(h_{0,1},\dots,h_{0,\gamma}) be the true nuisance functions and θ0subscript𝜃0\theta_{0} be the true causal parameter with θ𝜃\theta being a causal parameter that lies in the causal parameter space. A score function ψ(W,θ,ρ)𝜓𝑊𝜃𝜌\psi(W,\theta,\rho) is said to satisfy the orthogonal condition with respect to ρ=(h1,,hγ)𝜌subscript1subscript𝛾\rho=(h_{1},...,h_{\gamma}) if

𝔼[hiψ(W,θ,ρ)ρ=ρ0,θ=θ0𝐙]=01iγ.𝔼delimited-[]conditionalevaluated-atsubscriptsubscript𝑖𝜓𝑊𝜃𝜌formulae-sequence𝜌subscript𝜌0𝜃subscript𝜃0𝐙0for-all1𝑖𝛾\displaystyle\mathbb{E}\left[\partial_{h_{i}}\psi(W,\theta,\rho)\mid_{\rho=\rho_{0},\theta=\theta_{0}}\mid\mathbf{Z}\right]=0\;\;\;\forall 1\leq i\leq\gamma.

Under the interactive model setup (1), the nuisance functions are (g,m)𝑔𝑚(g,m), and the true ones are (g0,m0)subscript𝑔0subscript𝑚0(g_{0},m_{0}). In this case, the orthogonal condition guarantees that the estimator is consistent if either one of the two nuisance functions, but unnecessarily both, is accurately estimated. This is well known as the doubly robust property. In this paper, we introduce two orthogonal estimators θ^1subscript^𝜃1\hat{\theta}_{1} [3] and θ^2subscript^𝜃2\hat{\theta}_{2} [14] in Proposition 1, and we can estimate ATE by plugging the learned nuisance functions into the orthogonal estimators.

Proposition 1 (Orthogonal Estimators)

Let the nuisance functions be ρ=(g,m)𝜌𝑔𝑚\rho=(g,m) and the causal parameter be θisuperscript𝜃𝑖\theta^{i} for i{0,1}𝑖01i\in\{0,1\}, the score functions ψ1(W,θi,ρ)subscript𝜓1𝑊superscript𝜃𝑖𝜌\psi_{1}(W,\theta^{i},\rho) and ψ2(W,θi,ρ)subscript𝜓2𝑊superscript𝜃𝑖𝜌\psi_{2}(W,\theta^{i},\rho) that satisfy the orthogonal condition (Definition 1) are:

ψ1(W,θi,ρ)=θig(i,𝐙)(Yg(i,𝐙))iD+(1i)(1D)im(𝐙)+(1i)(1m(𝐙));subscript𝜓1𝑊superscript𝜃𝑖𝜌superscript𝜃𝑖𝑔𝑖𝐙𝑌𝑔𝑖𝐙𝑖𝐷1𝑖1𝐷𝑖𝑚𝐙1𝑖1𝑚𝐙\displaystyle\psi_{1}(W,\theta^{i},\rho)=\theta^{i}-g(i,\mathbf{Z})-(Y-g(i,\mathbf{Z}))\frac{iD+(1-i)(1-D)}{im(\mathbf{Z})+(1-i)(1-m(\mathbf{Z}))}; (2)
ψ2(W,θi,ρ)=θig(i,𝐙)(Y(i)g(i,𝐙))((Dm(𝐙))𝔼[ν𝐙])2𝔼[ν2𝐙].subscript𝜓2𝑊superscript𝜃𝑖𝜌superscript𝜃𝑖𝑔𝑖𝐙𝑌𝑖𝑔𝑖𝐙superscript𝐷𝑚𝐙𝔼delimited-[]conditional𝜈𝐙2𝔼delimited-[]conditionalsuperscript𝜈2𝐙\displaystyle\psi_{2}(W,\theta^{i},\rho)=\theta^{i}-g(i,\mathbf{Z})-(Y(i)-g(i,\mathbf{Z}))\frac{\left((D-m(\mathbf{Z}))-\mathbb{E}\left[\nu\mid\mathbf{Z}\right]\right)^{2}}{\mathbb{E}\left[\nu^{2}\mid\mathbf{Z}\right]}. (3)

The corresponding orthogonal estimators are:

θ^1isolves1Nm=1Nψ1(Wm,θi,ρ^)=0;θ^2isolves1Nm=1Nψ2(Wm,θi,ρ^)=0.formulae-sequencesuperscriptsubscript^𝜃1𝑖solves1𝑁superscriptsubscript𝑚1𝑁subscript𝜓1subscript𝑊𝑚superscript𝜃𝑖^𝜌0superscriptsubscript^𝜃2𝑖solves1𝑁superscriptsubscript𝑚1𝑁subscript𝜓2subscript𝑊𝑚superscript𝜃𝑖^𝜌0\displaystyle\hat{\theta}_{1}^{i}\quad\text{solves}\quad\frac{1}{N}\sum\limits_{m=1}^{N}\psi_{1}(W_{m},\theta^{i},\hat{\rho})=0;\quad\hat{\theta}_{2}^{i}\quad\text{solves}\quad\frac{1}{N}\sum\limits_{m=1}^{N}\psi_{2}(W_{m},\theta^{i},\hat{\rho})=0.

3 Method

In this section, we first introduce the orthogonality information in Section 3.1. Then we present the network structure, objective function and model selection criterion of the proposed MBRL method based on the orthogonality information in Section 3.2.

3.1 Orthogonality Information

Recall that the ATE estimators θ^1isubscriptsuperscript^𝜃𝑖1\hat{\theta}^{i}_{1} and θ^2isubscriptsuperscript^𝜃𝑖2\hat{\theta}^{i}_{2} are doubly robust since they are orthogonal estimators. Still, they could be non-orthogonal once the model setup (1) relaxes the restrictions on the noise terms ξ𝜉\xi and ν𝜈\nu since the score functions ψ1subscript𝜓1\psi_{1} and ψ2subscript𝜓2\psi_{2} might violate the orthogonal condition. Hence, we propose the Noise Conditions, which would enforce the learned nuisance functions adapted to orthogonal estimators.

Proposition 2 (Noise Conditions)

Under the interactive model setup (1), the conditions on the noise terms ξ𝜉\xi and ν𝜈\nu, i.e., 𝔼[ξD,𝐙]=0𝔼delimited-[]conditional𝜉𝐷𝐙0\mathbb{E}\left[\xi\mid D,\mathbf{Z}\right]=0 and 𝔼[ν𝐙]=0𝔼delimited-[]conditional𝜈𝐙0\mathbb{E}\left[\nu\mid\mathbf{Z}\right]=0, are sufficient conditions for ψ1subscript𝜓1\psi_{1} and ψ2subscript𝜓2\psi_{2} being orthogonal score functions (θ^1isuperscriptsubscript^𝜃1𝑖\hat{\theta}_{1}^{i} and θ^2isuperscriptsubscript^𝜃2𝑖\hat{\theta}_{2}^{i} being orthogonal estimators).

Given the noise conditions, we can exploit an essential property, the noise orthogonality property.

Property 1 (Noise Orthogonality)

Under the interactive model setup (1) and the noise conditions, we have 𝔼[(Yg0(D,𝐙))(Dm0(𝐙))]=0𝔼delimited-[]𝑌subscript𝑔0𝐷𝐙𝐷subscript𝑚0𝐙0\mathbb{E}[(Y-g_{0}(D,\mathbf{Z}))(D-m_{0}(\mathbf{Z}))]=0.

The noise conditions are sufficient conditions for the estimators θ^1isuperscriptsubscript^𝜃1𝑖\hat{\theta}_{1}^{i} and θ^2isuperscriptsubscript^𝜃2𝑖\hat{\theta}_{2}^{i} being orthogonal, so noise conditions play an important role when we approximate the true nuisance functions (g0,m0)subscript𝑔0subscript𝑚0(g_{0},m_{0}) with estimated ones (g^,m^)^𝑔^𝑚(\hat{g},\hat{m}). Besides, under the noise conditions, the noise orthogonality can be utilized for our model selection. The decompositions similar to Noise Orthogonality also appeared in [3, 11].

3.2 The Proposed Framework

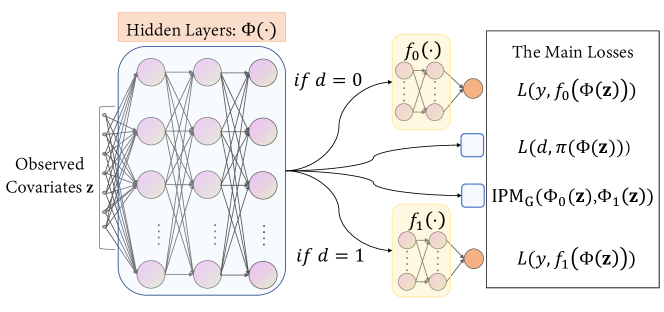
We propose a moderately-balanced representation learning (MBRL) framework to obtain (g^,m^)^𝑔^𝑚(\hat{g},\hat{m}) to estimate ATE, and the MBRL architecture is illustrated in Figure 1. The MBRL network maps the original covariates space to the representation space (i.e., Φ:ZR:ΦZR\Phi:\pazocal{Z}\rightarrow\pazocal{R}) such that 1) the representation preserves predictive information for outcomes; 2) the map makes the distributional discrepancy between the treated group and the controlled group small enough; 3) the domain (treated or controlled) of each individual is well discriminated; 4) the orthogonality information is involved.

Refer to caption
Figure 1: The MBRL network architecture.
Learning Representation of Covariates.

The distributions of the treated group and the controlled group are inherently disparate due to selection bias. Previous works handle this problem using a balanced representation learning method [16, 23], which forces the distributions of treatment and control groups to be similar enough in the representation space. Specifically, a representation is learned by minimizing the integral probability metrics (IPM), which measures the imbalance between the distributions of the treated population and the controlled population (see the details in [23]):

Limb=IPMG({Φ(𝐳m)}m:dm=1,{Φ(𝐳m)}m:dm=0).subscriptLimbIPMGsubscriptΦsubscript𝐳m:msubscriptdm1subscriptΦsubscript𝐳m:msubscriptdm0\displaystyle\pazocal{L}_{imb}=\text{IPM}{G}(\{\Phi(\mathbf{z}_{m})\}_{m:d_{m}=1},\{\Phi(\mathbf{z}_{m})\}_{m:d_{m}=0}). (4)
The Prediction of Outcome and Treatment.

MBRL predicts the outcome by the function f:{0,1}×RY:𝑓01RYf:\{0,1\}\times\pazocal{R}\rightarrow\pazocal{Y}, which is partitioned into two functions f0subscript𝑓0f_{0} and f1subscript𝑓1f_{1}:

f(dm,Φ(𝐳m))=dmf1(Φ(𝐳m))+(1dm)f0(Φ(𝐳m)).𝑓subscript𝑑𝑚Φsubscript𝐳𝑚subscript𝑑𝑚subscript𝑓1Φsubscript𝐳𝑚1subscript𝑑𝑚subscript𝑓0Φsubscript𝐳𝑚\displaystyle f(d_{m},\Phi(\mathbf{z}_{m}))=d_{m}f_{1}(\Phi(\mathbf{z}_{m}))+(1-d_{m})f_{0}(\Phi(\mathbf{z}_{m})). (5)

f1subscript𝑓1f_{1} and f0subscript𝑓0f_{0} are the output functions that map the representation to the potential outcomes for D=1𝐷1D=1 and D=0𝐷0D=0, respectively. f(dm,Φ(𝐳m))𝑓subscript𝑑𝑚Φsubscript𝐳𝑚f(d_{m},\Phi(\mathbf{z}_{m})) is the predicted factual outcome and we aim to minimize the factual outcome loss LfosubscriptLfo\pazocal{L}_{fo} such that

Lfo=1Nm=1N[ymf(dm,Φ(𝐳m))]2.subscriptLfo1Nsuperscriptsubscriptm1Nsuperscriptdelimited-[]subscriptymfsubscriptdmΦsubscript𝐳m2\displaystyle\pazocal{L}_{fo}=\frac{1}{N}\sum_{m=1}^{N}\left[y_{m}-f(d_{m},\Phi(\mathbf{z}_{m}))\right]^{2}. (6)

Here, g^(dm,𝐳m)=f(dm,Φ(𝐳m))^𝑔subscript𝑑𝑚subscript𝐳𝑚𝑓subscript𝑑𝑚Φsubscript𝐳𝑚\hat{g}(d_{m},\mathbf{z}_{m})=f(d_{m},\Phi(\mathbf{z}_{m})) is the estimated factual outcome of the mthsuperscript𝑚𝑡m^{th} unit. Aside from making a low-error prediction over factual outcomes with a small divergence between treated and controlled groups, the distinguishability of the treated units from the controlled ones is also non-negligible. Therefore, we propose to maximize the distinguishability loss LdissubscriptLdis\pazocal{L}_{dis} (measured by log-likelihood) such that

Ldis=1NsubscriptLdis1N\displaystyle\pazocal{L}_{dis}=\frac{1}{N} m=1N[dmlogπ(Φ(𝐳m))+(1dm)log(1π(Φ(𝐳m)))].superscriptsubscript𝑚1𝑁delimited-[]subscript𝑑𝑚𝜋Φsubscript𝐳𝑚1subscript𝑑𝑚1𝜋Φsubscript𝐳𝑚\displaystyle\sum_{m=1}^{N}\big{[}d_{m}\log\pi(\Phi(\mathbf{z}_{m}))+(1-d_{m})\log(1-\pi(\Phi(\mathbf{z}_{m})))\big{]}. (7)

Here, m^(𝐳m)=π(Φ(𝐳m))^𝑚subscript𝐳𝑚𝜋Φsubscript𝐳𝑚\hat{m}(\mathbf{z}_{m})=\pi(\Phi(\mathbf{z}_{m})) is the estimated probability of the mthsuperscript𝑚𝑡m^{th} unit being assigned the treatment D=1𝐷1D=1 (aka the estimated propensity score).

The Noise Regularizations.

Recall Proposition 2 that 𝔼[ξD,𝐙]=0𝔼delimited-[]conditional𝜉𝐷𝐙0\mathbb{E}\left[\xi\mid D,\mathbf{Z}\right]=0 and 𝔼[ν𝐙]=0𝔼delimited-[]conditional𝜈𝐙0\mathbb{E}\left[\nu\mid\mathbf{Z}\right]=0 are sufficient conditions for score functions ψ1subscript𝜓1\psi_{1} and ψ2subscript𝜓2\psi_{2} being orthogonal. Empirically, we want to involve the following constraints:

1Nm=1N[ymf(dm,Φ(𝐳m))]=0,1𝑁superscriptsubscript𝑚1𝑁delimited-[]subscript𝑦𝑚𝑓subscript𝑑𝑚Φsubscript𝐳𝑚0\displaystyle\frac{1}{N}\sum_{m=1}^{N}\left[y_{m}-f(d_{m},\Phi(\mathbf{z}_{m}))\right]=0, (8)
1Nm=1N[dmπ(Φ(𝐳m))]=0.1𝑁superscriptsubscript𝑚1𝑁delimited-[]subscript𝑑𝑚𝜋Φsubscript𝐳𝑚0\displaystyle\frac{1}{N}\sum_{m=1}^{N}\left[d_{m}-\pi(\Phi(\mathbf{z}_{m}))\right]=0.

This motivates us to formalize ΩysubscriptΩ𝑦\Omega_{y} and ΩdsubscriptΩ𝑑\Omega_{d} such that

Ωy=ϵy|1Nm=1N[ymf(dm,Φ(𝐳m))]|,subscriptΩ𝑦subscriptitalic-ϵ𝑦1𝑁superscriptsubscript𝑚1𝑁delimited-[]subscript𝑦𝑚𝑓subscript𝑑𝑚Φsubscript𝐳𝑚\displaystyle\Omega_{y}=\epsilon_{y}\big{|}\frac{1}{N}\sum_{m=1}^{N}[y_{m}-f(d_{m},\Phi(\mathbf{z}_{m}))]\big{|}, (9)
Ωd=ϵd|1Nm=1N[dmπ(Φ(𝐳m))]|.subscriptΩ𝑑subscriptitalic-ϵ𝑑1𝑁superscriptsubscript𝑚1𝑁delimited-[]subscript𝑑𝑚𝜋Φsubscript𝐳𝑚\displaystyle\Omega_{d}=\epsilon_{d}\big{|}\frac{1}{N}\sum_{m=1}^{N}[d_{m}-\pi(\Phi(\mathbf{z}_{m}))]\big{|}.

The partial derivative of ΩysubscriptΩ𝑦\Omega_{y} w.r.t. ϵysubscriptitalic-ϵ𝑦\epsilon_{y} (or ΩdsubscriptΩ𝑑\Omega_{d} w.r.t. ϵdsubscriptitalic-ϵ𝑑\epsilon_{d}) equaling 00 forces the learned nuisance functions to satisfy Eqn. (8). Therefore, minimizing the noise regularizations ΩysubscriptΩ𝑦\Omega_{y} and ΩdsubscriptΩ𝑑\Omega_{d} adapts the entire learning process to satisfy the orthogonal score function. This idea corresponds to the targeted regularizations (see more discussions in [24, 11]).

Multi-task Learning and Perturbation Error.

MBRL learns the nuisance functions through multi-task learning with following three tasks in each iteration:

Task 1:maxπ,ϵdLdisλ1ΩdTask 1:subscript𝜋subscriptitalic-ϵ𝑑subscriptLdissubscript𝜆1subscriptΩd\displaystyle\text{Task 1:}\;\;\;\;\;\;\;\;\;\max_{\pi,\epsilon_{d}}\;\;\;\pazocal{L}_{dis}-\lambda_{1}\Omega_{d} (10)
Task 2:minΦLimbTask 2:subscriptΦsubscriptLimb\displaystyle\text{Task 2:}\;\;\;\;\;\;\;\;\;\ \min_{\Phi}\;\;\;\pazocal{L}_{imb}
Task 3:minΦ,f,ϵyLfo+λ2ΩyTask 3:subscriptΦ𝑓subscriptitalic-ϵ𝑦subscriptLfosubscript𝜆2subscriptΩy\displaystyle\text{Task 3:}\;\;\;\;\;\;\;\;\;\min_{\Phi,f,\epsilon_{y}}\;\;\;\pazocal{L}_{fo}+\lambda_{2}\Omega_{y}

Instead of putting LimbsubscriptLimb\pazocal{L}_{imb} into Task 3 as a regularization, we let LimbsubscriptLimb\pazocal{L}_{imb} be one of the multiple tasks. To be specific, Task 1 updates π𝜋\pi to produce the propensity scores, and Task 2 achieves a balance between {Φ(𝐳m)}m:dm=1subscriptΦsubscript𝐳𝑚:𝑚subscript𝑑𝑚1\{\Phi(\mathbf{z}_{m})\}_{m:d_{m}=1} and {Φ(𝐳m)}m:dm=0subscriptΦsubscript𝐳𝑚:𝑚subscript𝑑𝑚0\{\Phi(\mathbf{z}_{m})\}_{m:d_{m}=0}. Additionally, MBRL incorporates a novel model selection criterion, the Perturbation Error, according to the noise orthogonality property. It takes advantage of the noise orthogonality information by perturbating the main evaluation metric. For example, if the final model is selected by the metric root-mean-square error (RMSE=1Nm=1N(ymy^m)2𝑅𝑀𝑆𝐸1𝑁superscriptsubscript𝑚1𝑁superscriptsubscript𝑦𝑚subscript^𝑦𝑚2RMSE=\sqrt{\frac{1}{N}\sum_{m=1}^{N}(y_{m}-\hat{y}_{m})^{2}}), then the perturbation error ϵpsubscriptitalic-ϵ𝑝\epsilon_{p} is defined as

ϵp=RMSE+β|1Nm=1N(ymy^m)(dmd^m)|.subscriptitalic-ϵ𝑝𝑅𝑀𝑆𝐸𝛽1𝑁superscriptsubscript𝑚1𝑁subscript𝑦𝑚subscript^𝑦𝑚subscript𝑑𝑚subscript^𝑑𝑚\displaystyle\epsilon_{p}=RMSE+\beta|\frac{1}{N}\sum_{m=1}^{N}(y_{m}-\hat{y}_{m})(d_{m}-\hat{d}_{m})|.

Here, β𝛽\beta is the perturbation coefficient which is a constant; y^msubscript^𝑦𝑚\hat{y}_{m} and d^msubscript^𝑑𝑚\hat{d}_{m} are the predicted values of f(dm,Φ(𝐳m))𝑓subscript𝑑𝑚Φsubscript𝐳𝑚f(d_{m},\Phi(\mathbf{z}_{m})) and π(Φ(𝐳m))𝜋Φsubscript𝐳𝑚\pi(\Phi(\mathbf{z}_{m})), respectively. The final model is selected on the validation set based on the minimum ϵpsubscriptitalic-ϵ𝑝\epsilon_{p}. If either outcome or propensity score is well specified (i.e., representations are moderately-balanced instead of over-balanced), the second term in ϵpsubscriptitalic-ϵ𝑝\epsilon_{p} would be small.

4 Experiments

In this section, we conduct comprehensive experiments on benchmark datasets to evaluate the performance produced by MBRL and other prevalent causal inference methods. We further test the effectiveness of MBRL on simulated datasets with different levels of selection bias. All the experiments are run on Dell 7920 with 1x 16-core Intel Xeon Gold 6250 3.90GHz CPU and 3x NVIDIA Quadro RTX 6000 GPU.

4.1 Dataset Description

Since the ground truth of treatment effects are inaccessible for real-world data, it is difficult to evaluate the performance of causal inference methods for ATE estimation. Previous causal inference literatures assess their methods on two prevalent semi-synthetic datasets: IHDP and Twins.

IHDP.

The IHDP dataset is a well-known benchmark dataset for causal inference introduced by [13]. It includes 747 samples with 25-dimensional covariates associated with the information of infants and their mothers, such as birth weight and mother’s age. These covariates are collected from a real-world randomized experiment. Our aim is to study the treatment effect of the specialist visits (binary treatment) on the cognitive scores (continuous-valued outcome). The outcome is generated using the NPCI package [6], and the selection bias is created by removing a subset of the treated population. We use the same 1000 IHDP datasets as the ones used in [23], where each dataset is split by the ratio of 63%/27%/10%percent63percent27percent1063\%/27\%/10\% as training/validation/test sets.

Twins.

The Twins dataset [19] collects twin births in the USA between 1989 and 1991 [1]. After the data processing, each unit has 30 covariates relevant to parents, pregnancy and birth [28]. The treatment D=1𝐷1D=1 indicates the heavier twin while D=0𝐷0D=0 indicates the lighter twin, and the outcome Y𝑌Y is a binary variable defined as the 1-year mortality. Similar to [28], we only select twins who have the same gender and both weigh less than 2 kg, which finally gives 114401144011440 pairs of twins whose mortality rate is 17.7%percent17.717.7\% for the lighter twin, and 16.1%percent16.116.1\% for the heavier twin. To create the selection bias, we selectively choose one of the two twins as the factual observation based on the covariates of mthsuperscript𝑚𝑡m^{th} individual: Dm|𝐙msimilar-toconditionalsubscript𝐷𝑚subscript𝐙𝑚absentD_{m}|\mathbf{Z}_{m}\sim Bernoulli(Sigmoid(𝐰T𝐙m+nsuperscript𝐰𝑇subscript𝐙𝑚𝑛\mathbf{w}^{T}\mathbf{Z}_{m}+n)), where 𝐰U((0.01,0.01)30×1)similar-to𝐰Usuperscript0.010.01301\mathbf{w}\sim\pazocal{U}((-0.01,0.01)^{30\times 1}) and nN(0,0.01)similar-to𝑛N00.01n\sim\pazocal{N}(0,0.01). We repeat the data generating process for 100100100 times, and the generated 100100100 Twins datasets are all split by the ratio of 56%/24%/20%percent56percent24percent2056\%/24\%/20\% as training/validation/test sets.

4.2 Performance Measurement and Experimental settings

Performance Measurement.

Generally, the comparisons are based on the absolute error in ATE: ϵATE=|ττ^|subscriptitalic-ϵ𝐴𝑇𝐸𝜏^𝜏\epsilon_{ATE}=|\tau-\hat{\tau}|. Additionally, we also test the performance of MBRL on individual treatment effect (ITE) estimations. For IHDP datasets, we adopt Precision in Estimation of Heterogeneous Effect (PEHE):

ϵPEHE=1Nm=1N([ym(1)ym(0)][y^m(1)y^m(0)])2.subscriptitalic-ϵ𝑃𝐸𝐻𝐸1𝑁superscriptsubscript𝑚1𝑁superscriptdelimited-[]subscript𝑦𝑚1subscript𝑦𝑚0delimited-[]subscript^𝑦𝑚1subscript^𝑦𝑚02\epsilon_{PEHE}=\frac{1}{N}\sum_{m=1}^{N}\left([y_{m}(1)-y_{m}(0)]-[\hat{y}_{m}(1)-\hat{y}_{m}(0)]\right)^{2}.

For Twins datasets, we follow [19] to adopt Area Under ROC Curve (AUC).

Baseline Models.

We compare our MBRL method with the following basline models: linear regression with the treatment as feature (OLS/LR1), separate linear regression for each treatment group (OLS/LR2), k-nearest neighbor (k-NN), bayesian additive regression trees (BART) [4], causal forest (CF) [25], balancing linear regression (BLR) [16], balancing neural network (BNN) [16], treatment-agnostic representation network (TARNet) [23], counterfactual regression with Wasserstein distance (CFR-WASS) [23], causal effect variational autoencoders (CEVAE) [19], local similarity preserved individual treatment effect (SITE) [27], generative adversarial networks for inference of treatment effect (GANITE) [28] and (Dragonnet) [24].

Experimental Details.

In our experiments, IPMGsubscriptIPMG\text{IPM}_{\pazocal{G}} is chosen as the Wasserstein distance. Let the empirical distribution of representation be P(Φ(𝐙))=P(Φ(𝐙)D=1)𝑃Φ𝐙𝑃conditionalΦ𝐙𝐷1P(\Phi(\mathbf{Z}))=P(\Phi(\mathbf{Z})\mid D=1) for the treated group and Q(Φ(𝐙))=Q(Φ(𝐙)D=0)𝑄Φ𝐙𝑄conditionalΦ𝐙𝐷0Q(\Phi(\mathbf{Z}))=Q(\Phi(\mathbf{Z})\mid D=0) for the controlled group. Assuming that GG\pazocal{G} is defined as the functional space of a family of 1-Lipschitz functions, we obtain the 1-Wasserstein distance for IPMGsubscriptIPMG\text{IPM}_{\pazocal{G}} [23]:

Wass(P,Q)=infkK𝐡{Φ(𝐙m)}m:Dm=1k(𝐡)𝐡P(𝐡)𝑑𝐡.𝑊𝑎𝑠𝑠𝑃𝑄subscriptinfimum𝑘Ksubscript𝐡subscriptΦsubscript𝐙𝑚:𝑚subscript𝐷𝑚1norm𝑘𝐡𝐡𝑃𝐡differential-d𝐡\displaystyle Wass(P,Q)=\inf_{k\in\pazocal{K}}\int_{\mathbf{h}\in\{\Phi(\mathbf{Z}_{m})\}_{m:D_{m}=1}}\|k(\mathbf{h})-\mathbf{h}\|P(\mathbf{h})d\mathbf{h}.

Here, K={kk:Q(k(Φ(𝐙)))=P(Φ(𝐙))}Kconditional-setk:kQkΦ𝐙PΦ𝐙\pazocal{K}=\{k\mid k:Q(k(\Phi(\mathbf{Z})))=P(\Phi(\mathbf{Z}))\} defines the set of push-forward functions that transform the representation distribution of the treated group P(Φ(𝐙))𝑃Φ𝐙P(\Phi(\mathbf{Z})) to that of the controlled group Q(Φ(𝐙))𝑄Φ𝐙Q(\Phi(\mathbf{Z})).

Table 1: Performance comparisons and ablation study with mean ±plus-or-minus\pm standard error on 1000 IHDP datasets. ϵATEsubscriptitalic-ϵ𝐴𝑇𝐸\epsilon_{ATE}: Lower is better. ϵPEHEsubscriptitalic-ϵ𝑃𝐸𝐻𝐸\sqrt{\epsilon_{PEHE}}: Lower is better.
Method In-sample Out-of-sample
ϵPEHEsubscriptitalic-ϵ𝑃𝐸𝐻𝐸\sqrt{\epsilon_{PEHE}} ϵATEsubscriptitalic-ϵ𝐴𝑇𝐸\epsilon_{ATE} ϵPEHEsubscriptitalic-ϵ𝑃𝐸𝐻𝐸\sqrt{\epsilon_{PEHE}} ϵATEsubscriptitalic-ϵ𝐴𝑇𝐸\epsilon_{ATE}
OLS/LR1 5.8±.3plus-or-minus5.8.35.8\pm.3 .73±.04plus-or-minus.73.04.73\pm.04 5.8±.3plus-or-minus5.8.35.8\pm.3 .94±.06plus-or-minus.94.06.94\pm.06
OLS/LR2 2.4±.1plus-or-minus2.4.12.4\pm.1 .14±.01plus-or-minus.14.01.14\pm.01 2.5±.1plus-or-minus2.5.12.5\pm.1 .31±.02plus-or-minus.31.02.31\pm.02
k-NN 2.1±.1plus-or-minus2.1.12.1\pm.1 .14±.01plus-or-minus.14.01.14\pm.01 4.1±.2plus-or-minus4.1.24.1\pm.2 .79±.05plus-or-minus.79.05.79\pm.05
BART 2.1±.1plus-or-minus2.1.12.1\pm.1 .23±.01plus-or-minus.23.01.23\pm.01 2.3±.1plus-or-minus2.3.12.3\pm.1 .34±.02plus-or-minus.34.02.34\pm.02
CF 3.8±.2plus-or-minus3.8.23.8\pm.2 .18±.01plus-or-minus.18.01.18\pm.01 3.8±.2plus-or-minus3.8.23.8\pm.2 .40±.03plus-or-minus.40.03.40\pm.03
CEVAE 2.7±.1plus-or-minus2.7.12.7\pm.1 .34±.01plus-or-minus.34.01.34\pm.01 2.6±.1plus-or-minus2.6.12.6\pm.1 .46±.02plus-or-minus.46.02.46\pm.02
SITE .69±.0plus-or-minus.69.0.69\pm.0 .22±.01plus-or-minus.22.01.22\pm.01 .75±.0plus-or-minus.75.0.75\pm.0 .24±.01plus-or-minus.24.01.24\pm.01
GANITE 1.9±.4plus-or-minus1.9.41.9\pm.4 .43±.05plus-or-minus.43.05.43\pm.05 2.4±.4plus-or-minus2.4.42.4\pm.4 .49±.05plus-or-minus.49.05.49\pm.05
BLR 5.8±.3plus-or-minus5.8.35.8\pm.3 .72±.04plus-or-minus.72.04.72\pm.04 5.8±.3plus-or-minus5.8.35.8\pm.3 .93±.05plus-or-minus.93.05.93\pm.05
BNN 2.2±.1plus-or-minus2.2.12.2\pm.1 .37±.03plus-or-minus.37.03.37\pm.03 2.1±.1plus-or-minus2.1.12.1\pm.1 .42±.03plus-or-minus.42.03.42\pm.03
TARNet .88±.0plus-or-minus.88.0.88\pm.0 .26±.01plus-or-minus.26.01.26\pm.01 .95±.0plus-or-minus.95.0.95\pm.0 .28±.01plus-or-minus.28.01.28\pm.01
CFR-WASS .71±.0plus-or-minus.71.0.71\pm.0 .25±.01plus-or-minus.25.01.25\pm.01 .76±.0plus-or-minus.76.0.76\pm.0 .27±.01plus-or-minus.27.01.27\pm.01
Dragonnet 1.3±.4plus-or-minus1.3.41.3\pm.4 .14±.01plus-or-minus.14.01.14\pm.01 1.3±.5plus-or-minus1.3.51.3\pm.5 .20±.05plus-or-minus.20.05.20\pm.05
MBRL .52±.0plus-or-minus.52.0.52\pm.0 .12±.01plus-or-minus.12.01.12\pm.01 .57±.0plus-or-minus.57.0.57\pm.0 .13±.01plus-or-minus.13.01.13\pm.01
MBRL + θ^1isubscriptsuperscript^𝜃𝑖1\hat{\theta}^{i}_{1} .52±.0plus-or-minus.52.0.52\pm.0 .10±.00plus-or-minus.10.00.10\pm.00 .57±.0plus-or-minus.57.0.57\pm.0 .17±.01plus-or-minus.17.01.17\pm.01
MBRL + θ^2isubscriptsuperscript^𝜃𝑖2\hat{\theta}^{i}_{2} .52±.0plus-or-minus.52.0.52\pm.0 .11±.00plus-or-minus.11.00.11\pm.00 .57±.0plus-or-minus.57.0.57\pm.0 .20±.01plus-or-minus.20.01.20\pm.01

In addition, we adopt ELU activation function and set 4 fully connected layers with 200 units for both the representation encoder network Φ()Φ\Phi(\cdot) and the discriminator π()𝜋\pi(\cdot), and 3 fully connected layers with 100 units for the outcome prediction networks f0()subscript𝑓0f_{0}(\cdot) and f1()subscript𝑓1f_{1}(\cdot). The optimizer is chosen as Adam [17], and the learning rate for the optimizer is set to be 1e31superscript𝑒31e^{-3}. We set (batch size, epoch) to be (100,1000)/(1000,250)10010001000250(100,1000)/(1000,250) for IHDP/Twins experiments, and the hyper parameters (λ1,λ2)subscript𝜆1subscript𝜆2(\lambda_{1},\lambda_{2}) to be (0.01,0.01)/(0.1,0.1)0.010.010.10.1(0.01,0.01)/(0.1,0.1) for IHDP/Twins experiments. The final model early stops on the metric ϵpsubscriptitalic-ϵ𝑝\epsilon_{p}, and we choose β𝛽\beta in ϵpsubscriptitalic-ϵ𝑝\epsilon_{p} as 0.10.10.1 and 100100100 for IHDP experiments and Twins experiments, respectively.

For the baseline models, we follow the same settings of hyperparameters as in their published paper and code. For our MBRL network, the optimal hyperparameters are chosen in the same way as [23]. The searching ranges are reported in Table 4.

Table 2: Performance comparisons with mean ±plus-or-minus\pm standard error on 100 Twins datasets. ϵATEsubscriptitalic-ϵ𝐴𝑇𝐸\epsilon_{ATE}: Lower is better. AUC: Higher is better.
Method In-sample Out-of-sample
AUC ϵATEsubscriptitalic-ϵ𝐴𝑇𝐸\epsilon_{ATE} AUC ϵATEsubscriptitalic-ϵ𝐴𝑇𝐸\epsilon_{ATE}
OLS/LR1 .660±.005plus-or-minus.660.005.660\pm.005 .004±.003plus-or-minus.004.003.004\pm.003 .500±.028plus-or-minus.500.028.500\pm.028 .007±.006plus-or-minus.007.006.007\pm.006
OLS/LR2 .660±.004plus-or-minus.660.004.660\pm.004 .004±.003plus-or-minus.004.003.004\pm.003 .500±.016plus-or-minus.500.016.500\pm.016 .007±.006plus-or-minus.007.006.007\pm.006
k-NN .609±.010plus-or-minus.609.010.609\pm.010 .003±.002plus-or-minus.003.002.003\pm.002 .492±.012plus-or-minus.492.012.492\pm.012 .005±.004plus-or-minus.005.004.005\pm.004
BART .506±.014plus-or-minus.506.014.506\pm.014 .121±.024plus-or-minus.121.024.121\pm.024 .500±.011plus-or-minus.500.011.500\pm.011 .127±.024plus-or-minus.127.024.127\pm.024
CEVAE .845±.003plus-or-minus.845.003.845\pm.003 .022±.002plus-or-minus.022.002.022\pm.002 .841±.004plus-or-minus.841.004.841\pm.004 .032±.003plus-or-minus.032.003.032\pm.003
SITE .862±.002plus-or-minus.862.002.862\pm.002 .016±.001plus-or-minus.016.001.016\pm.001 .853±.006plus-or-minus.853.006.853\pm.006 .020±.002plus-or-minus.020.002.020\pm.002
BLR .611±.009plus-or-minus.611.009.611\pm.009 .006±.004plus-or-minus.006.004.006\pm.004 .510±.018plus-or-minus.510.018.510\pm.018 .033±.009plus-or-minus.033.009.033\pm.009
BNN .690±.008plus-or-minus.690.008.690\pm.008 .006±.003plus-or-minus.006.003.006\pm.003 .676±.008plus-or-minus.676.008.676\pm.008 .020±.007plus-or-minus.020.007.020\pm.007
TARNet .849±.002plus-or-minus.849.002.849\pm.002 .011±.002plus-or-minus.011.002.011\pm.002 .840±.006plus-or-minus.840.006.840\pm.006 .015±.002plus-or-minus.015.002.015\pm.002
CFR-WASS .850±.002plus-or-minus.850.002.850\pm.002 .011±.002plus-or-minus.011.002.011\pm.002 .842±.005plus-or-minus.842.005.842\pm.005 .028±.003plus-or-minus.028.003.028\pm.003
MBRL .879±.000plus-or-minus.879.000.879\pm.000 .003±.000plus-or-minus.003.000.003\pm.000 .874±.001plus-or-minus.874.001.874\pm.001 .007±.001plus-or-minus.007.001.007\pm.001
MBRL + θ^1isubscriptsuperscript^𝜃𝑖1\hat{\theta}^{i}_{1} .879±.000plus-or-minus.879.000.879\pm.000 .003±.000plus-or-minus.003.000.003\pm.000 .874±.001plus-or-minus.874.001.874\pm.001 .008±.000plus-or-minus.008.000.008\pm.000
MBRL + θ^2isubscriptsuperscript^𝜃𝑖2\hat{\theta}^{i}_{2} .879±.000plus-or-minus.879.000.879\pm.000 .003±.000plus-or-minus.003.000.003\pm.000 .874±.001plus-or-minus.874.001.874\pm.001 .006±.001plus-or-minus.006.001.006\pm.001

4.3 Results Analysis

Table 1 and Table 2 report part of the performances of baseline methods and MBRL on IHDP and Twins datasets. We present the average values and standard errors of ϵATEsubscriptitalic-ϵ𝐴𝑇𝐸\epsilon_{ATE}, ϵPEHEsubscriptitalic-ϵ𝑃𝐸𝐻𝐸\epsilon_{PEHE} and AUC (mean ±plus-or-minus\pm std). The lower ϵATEsubscriptitalic-ϵ𝐴𝑇𝐸\epsilon_{ATE} and ϵPEHEsubscriptitalic-ϵ𝑃𝐸𝐻𝐸\epsilon_{PEHE} or the higher AUC, the better. Bold indicates the best method for each dataset.

As stated in Table 1 and Table 2, we have the following observations. 1) MBRL achieves significant improvements in both ITE and ATE estimations across all datasets compared to the baseline models. 2) The advanced representation learning methods that focus on estimating ITE (such as SITE, TARNet and CFR-WASS) show their inapplicability to ATE estimations. By contrast, MBRL not only significantly outperforms these representation learning methods in ITE estimations but also remains among the best ATE results. 3) The state-of-the-art ATE estimation method, Dragonnet, achieves superior ATE estimations across all the baseline models but yields a substantial error in ITE estimations. Although Dragonnet shares a similar basic network architecture to MBRL, MBRL can obtain a substantially lower ϵATEsubscriptitalic-ϵ𝐴𝑇𝐸\epsilon_{ATE} than Dragonnet owing to the multi-task learning framework and the utilization for orthogonality information. These observations indicate that the proposed MBRL method is extremely effective for estimating treatment effects.

We further conduct an ablation study on IHDP datasets to test if orthogonality information is practical in real applications. The relevant results are reported in Table 4. We let MBRL* denote MBRL without perturbation error ϵpsubscriptitalic-ϵ𝑝\epsilon_{p}, and MBRL** denote MBRL without any orthogonality information (ϵpsubscriptitalic-ϵ𝑝\epsilon_{p}, ΩdsubscriptΩ𝑑\Omega_{d} and ΩysubscriptΩ𝑦\Omega_{y}). We find that incorporating orthogonality information will enhance the power of estimating treatment effects, whether with or without orthogonal estimators. This enhancement is pronounced especially when orthogonal estimators are plugged in for in-sample data.

Table 3: Ablation study on IHDP datasets.
Method In-sample Out-of-sample
ϵPEHEsubscriptitalic-ϵ𝑃𝐸𝐻𝐸\sqrt{\epsilon_{PEHE}} ϵATEsubscriptitalic-ϵ𝐴𝑇𝐸\epsilon_{ATE} ϵPEHEsubscriptitalic-ϵ𝑃𝐸𝐻𝐸\sqrt{\epsilon_{PEHE}} ϵATEsubscriptitalic-ϵ𝐴𝑇𝐸\epsilon_{ATE}
MBRL** .523±.006plus-or-minus.523.006.523\pm.006 .129±.005plus-or-minus.129.005.129\pm.005 .568±.009plus-or-minus.568.009.568\pm.009 .141±.006plus-or-minus.141.006.141\pm.006
MBRL* .522±.006plus-or-minus.522.006.522\pm.006 .128±.005plus-or-minus.128.005.128\pm.005 .567±.009plus-or-minus.567.009.567\pm.009 .139±.006plus-or-minus.139.006.139\pm.006
MBRL .522±.007plus-or-minus.522.007.522\pm.007 .121±.005plus-or-minus.121.005.121\pm.005 .565±.008plus-or-minus.565.008.565\pm.008 .133±.005plus-or-minus.133.005.133\pm.005
MBRL** + θ1isubscriptsuperscript𝜃𝑖1\theta^{i}_{1} .523±.006plus-or-minus.523.006.523\pm.006 .101±.004plus-or-minus.101.004.101\pm.004 .568±.009plus-or-minus.568.009.568\pm.009 .171±.007plus-or-minus.171.007.171\pm.007
MBRL* + θ1isubscriptsuperscript𝜃𝑖1\theta^{i}_{1} .523±.006plus-or-minus.523.006.523\pm.006 .102±.004plus-or-minus.102.004.102\pm.004 .567±.009plus-or-minus.567.009.567\pm.009 .170±.007plus-or-minus.170.007.170\pm.007
MBRL + θ1isubscriptsuperscript𝜃𝑖1\theta^{i}_{1} .522±.007plus-or-minus.522.007.522\pm.007 .102±.004plus-or-minus.102.004.102\pm.004 .565±.008plus-or-minus.565.008.565\pm.008 .166±.007plus-or-minus.166.007.166\pm.007
MBRL** + θ2isubscriptsuperscript𝜃𝑖2\theta^{i}_{2} .523±.006plus-or-minus.523.006.523\pm.006 .122±.005plus-or-minus.122.005.122\pm.005 .568±.009plus-or-minus.568.009.568\pm.009 .210±.008plus-or-minus.210.008.210\pm.008
MBRL* + θ2isubscriptsuperscript𝜃𝑖2\theta^{i}_{2} .523±.006plus-or-minus.523.006.523\pm.006 .121±.005plus-or-minus.121.005.121\pm.005 .567±.009plus-or-minus.567.009.567\pm.009 .208±.008plus-or-minus.208.008.208\pm.008
MBRL + θ2isubscriptsuperscript𝜃𝑖2\theta^{i}_{2} .522±.007plus-or-minus.522.007.522\pm.007 .114±.005plus-or-minus.114.005.114\pm.005 .565±.008plus-or-minus.565.008.565\pm.008 .204±.008plus-or-minus.204.008.204\pm.008
Table 4: The searching ranges of hyperparameters.
H   yperparameters IHDP Twins
λ1,λ2subscript𝜆1subscript𝜆2\lambda_{1},\lambda_{2} 0.01,0.1,10.010.110.01,0.1,1 0.01,0.1,10.010.110.01,0.1,1
Depth of ΦΦ\Phi 2,3,42342,3,4 2,3,42342,3,4
Dim of ΦΦ\Phi 100,200100200100,200 100,200100200100,200
Depth of π𝜋\pi 2,3,42342,3,4 2,3,42342,3,4
Dim of π𝜋\pi 100,200100200100,200 100,200100200100,200
Depth of f0subscript𝑓0f_{0}, f1subscript𝑓1f_{1} 2,3,42342,3,4 2,3,42342,3,4
Dim of f0subscript𝑓0f_{0}, f1subscript𝑓1f_{1} 100,200100200100,200 100,200100200100,200
Batch size 100,300100300100,300 500,10005001000500,1000
Epoch 500,10005001000500,1000 250,500250500250,500

4.4 Simulation Study

In this part, we mainly investigate two questions. Q1. Does MBRL perform more stably to the level of selection bias than the state-of-the-art model Dragonnet? Q2. Can the noise orthogonality information, the perturbation error ϵpsubscriptitalic-ϵ𝑝\epsilon_{p}, improve ATE estimations regardless of different models/estimators/selection bias levels?

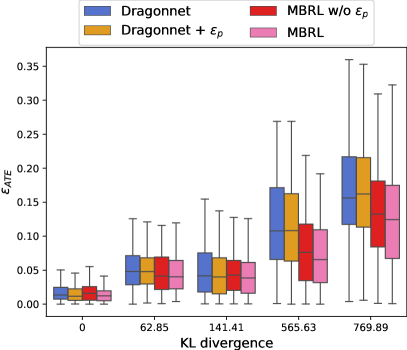
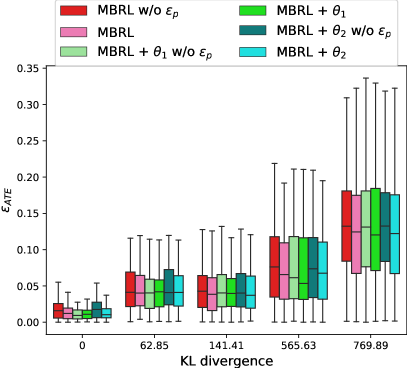
We generate 2500 treated samples whose covariates 𝐙1N(𝝁1,0.5×ΣΣT)similar-tosuperscript𝐙1Nsuperscript𝝁10.5ΣsuperscriptΣT\mathbf{Z}^{1}\sim\pazocal{N}(\bm{\mu}^{1},0.5\times\Sigma\Sigma^{T}), and 5000 controlled whose covariates 𝐙0N(𝝁0,0.5×ΣΣT)similar-tosuperscript𝐙0Nsuperscript𝝁00.5ΣsuperscriptΣT\mathbf{Z}^{0}\sim\pazocal{N}(\bm{\mu}^{0},0.5\times\Sigma\Sigma^{T}), where 𝝁1superscript𝝁1\bm{\mu}^{1} and 𝝁0superscript𝝁0\bm{\mu}^{0} are both 10-dimensional vector and ΣU((1,1)10×10)similar-toΣUsuperscript111010\Sigma\sim\pazocal{U}((-1,1)^{10\times 10}). The level of selection bias, measured by KL divergence of 𝝁1superscript𝝁1\bm{\mu}^{1} with respect to 𝝁0superscript𝝁0\bm{\mu}^{0}, would vary by fixing 𝝁0superscript𝝁0\bm{\mu}^{0} and adjusting 𝝁1superscript𝝁1\bm{\mu}^{1}. The potential outcomes of mthsuperscript𝑚𝑡m^{th} individual are generated as Y(1)𝐙m(𝐰1T𝐙m+n1)similar-toconditional𝑌1subscript𝐙𝑚superscriptsubscript𝐰1𝑇subscript𝐙𝑚subscript𝑛1Y(1)\mid\mathbf{Z}_{m}\sim(\mathbf{w}_{1}^{T}\mathbf{Z}_{m}+n_{1}), Y(0)𝐙m(𝐰0T𝐙m+n0)similar-toconditional𝑌0subscript𝐙𝑚superscriptsubscript𝐰0𝑇subscript𝐙𝑚subscript𝑛0Y(0)\mid\mathbf{Z}_{m}\sim(\mathbf{w}_{0}^{T}\mathbf{Z}_{m}+n_{0}), where 𝐰1U((1,1)10×1)similar-tosubscript𝐰1Usuperscript11101\mathbf{w}_{1}\sim\pazocal{U}((-1,1)^{10\times 1}), 𝐰0U((1,1)10×1)similar-tosubscript𝐰0Usuperscript11101\mathbf{w}_{0}\sim\pazocal{U}((-1,1)^{10\times 1}), n1N(0,0.1)similar-tosubscript𝑛1N00.1n_{1}\sim\pazocal{N}(0,0.1), n0N(0,0.1)similar-tosubscript𝑛0N00.1n_{0}\sim\pazocal{N}(0,0.1). By adjusting 𝝁1superscript𝝁1\bm{\mu}^{1} and fixing 𝝁0superscript𝝁0\bm{\mu}^{0}, we obtain five datasets with different levels of KL divergence in {0, 62.85, 141.41, 565.63, 769.89}062.85141.41565.63769.89\{0,\ 62.85,\ 141.41,\ 565.63,\ 769.89\}. We run experiments on each dataset 100 times and draw box plots with regard to ϵATEsubscriptitalic-ϵ𝐴𝑇𝐸\epsilon_{ATE} on the test set in Figure 2.

In Figure 2(a), we first find that MBRL shows stronger robustness and achieves significantly better ATE estimations with regard to different selection bias levels compared with Dragonnet. In addition, it is noticable that choosing the perturbation error ϵpsubscriptitalic-ϵ𝑝\epsilon_{p} as the model selection metric would yield smaller ϵATEsubscriptitalic-ϵ𝐴𝑇𝐸\epsilon_{ATE} for any model (Dragonnet or MBRL). Particularly, ϵpsubscriptitalic-ϵ𝑝\epsilon_{p} corrects more errors for MBRL than Dragonnet, which indicates that ϵpsubscriptitalic-ϵ𝑝\epsilon_{p} works better if a model utilizes the orthogonality information in the training stage. In Figure 2(b), we have two main observations: i) the criterion ϵpsubscriptitalic-ϵ𝑝\epsilon_{p} improves ATE estimations for all estimators across different selection bias levels; ii) the improvement brought by ϵpsubscriptitalic-ϵ𝑝\epsilon_{p} becomes more substantial when selection bias increases.

Refer to caption
(a) MBRL vs. Dragonnet
Refer to caption
(b) MBRL vs. MBRL with θ1subscript𝜃1\theta_{1} and θ2subscript𝜃2\theta_{2} plugged in.
Figure 2: Comparisons between models with and without ϵpsubscriptitalic-ϵ𝑝\epsilon_{p} w.r.t. varying levels of selection bias.

5 Related Work

Representation Learning.

Our work has a strong connection with the balanced representation learning methods proposed in [16, 23], where they mainly focus on minimizing the imbalance between the different treatment groups in the representation space but overlook maximizing the discrimination of each unit’s treatment domain. IGNITE framework is proposed in [10] to infer individual treatment effects from networked data, where they achieve a balanced representation that captures patterns of hidden confounders predictive of treatment assignments. This inspires us to study treatment effects by training a moderately-balanced representation via multi-task learning. Other works relevant to representation learning include [18, 19, 27, 28, 24] and references therein.

Orthogonal Score Function.

[3] develop the theory of double/debiased machine learning (DML) from [20]. They define the notion of orthogonal condition, which allows their DML estimator to be doubly robust. Based on the theory of [3], another orthogonal estimator is proposed by [14], aiming to overcome the high variance issue suffered by DML due to the misspecified propensity score. Despite the success of orthogonal estimators, the establishment of them requires the noise conditions to guarantee the corresponding score functions satisfying the orthogonal condition. None of the existing literature emphasizes the critical role of noise conditions or utilizes the orthogonality information for the model selection.

6 Conclusion

This paper proposes an effective representation learning method, MBRL, to study the treatment effects. Specifically, MBRL avoids the over-balanced issue by leveraging treatment domains of the representations via multi-task learning. MBRL further takes advantage of the orthogonality information and involves it in the training and validation stages. The extensive experiments show that 1) MBRL has strong predictability for the potential outcomes, distinguishability for the treatment assignment, applicability to orthogonal estimators, and robustness to the selection bias; 2) MRBL achieves substantial improvements on treatment effect estimations compared with existing state-of-the-art methods.

6.0.1 Acknowledgements

Qi Wu acknowledges the support from the Hong Kong Research Grants Council [General Research Fund 14206117, 11219420, and 11200219], CityU SRG-Fd fund 7005300, and the support from the CityU-JD Digits Laboratory in Financial Technology and Engineering, HK Institute of Data Science. The work described in this paper was partially supported by the InnoHK initiative, The Government of the HKSAR, and the Laboratory for AI-Powered Financial Technologies.

Appendix 0.A Experiments

The final full results for 1000 IHDP and 100 Twins experiments are reported in Table 5. The mark * indicates that the baseline models did not report relevant results.

As a supplementary note, the outcome takes a binary value for Twins experiments. So the factual outcome loss in Eqn (6) will be

Lfo=1Nm=1N[ymlogf(Φ(𝐳m))+(1ym)log(1f(Φ(𝐳m)))].subscriptLfo1Nsuperscriptsubscriptm1Ndelimited-[]subscriptymfΦsubscript𝐳m1subscriptym1fΦsubscript𝐳m\displaystyle\pazocal{L}_{fo}=-\frac{1}{N}\sum_{m=1}^{N}[y_{m}\log f(\Phi(\mathbf{z}_{m}))+(1-y_{m})\log(1-f(\Phi(\mathbf{z}_{m})))].
Table 5: The full results of 1000 IHDP and 100 Twins experiments.
Method IHDP In-sample IHDP Out-of-sample Twins In-sample Twins Out-of-sample
ϵPEHEsubscriptitalic-ϵ𝑃𝐸𝐻𝐸\sqrt{\epsilon_{PEHE}} ϵATEsubscriptitalic-ϵ𝐴𝑇𝐸\epsilon_{ATE} ϵPEHEsubscriptitalic-ϵ𝑃𝐸𝐻𝐸\sqrt{\epsilon_{PEHE}} ϵATEsubscriptitalic-ϵ𝐴𝑇𝐸\epsilon_{ATE} AUC ϵATEsubscriptitalic-ϵ𝐴𝑇𝐸\epsilon_{ATE} AUC ϵATEsubscriptitalic-ϵ𝐴𝑇𝐸\epsilon_{ATE}
OLS/LR1 5.8±.3plus-or-minus5.8.35.8\pm.3 .73±.04plus-or-minus.73.04.73\pm.04 5.8±.3plus-or-minus5.8.35.8\pm.3 .94±.06plus-or-minus.94.06.94\pm.06 .660±.005plus-or-minus.660.005.660\pm.005 .004±.003plus-or-minus.004.003.004\pm.003 .500±.028plus-or-minus.500.028.500\pm.028 .007±.006plus-or-minus.007.006.007\pm.006
OLS/LR2 2.4±.1plus-or-minus2.4.12.4\pm.1 .14±.01plus-or-minus.14.01.14\pm.01 2.5±.1plus-or-minus2.5.12.5\pm.1 .31±.02plus-or-minus.31.02.31\pm.02 .660±.004plus-or-minus.660.004.660\pm.004 .004±.003plus-or-minus.004.003.004\pm.003 .500±.016plus-or-minus.500.016.500\pm.016 .007±.006plus-or-minus.007.006.007\pm.006
k-NN 2.1±.1plus-or-minus2.1.12.1\pm.1 .14±.01plus-or-minus.14.01.14\pm.01 4.1±.2plus-or-minus4.1.24.1\pm.2 .79±.05plus-or-minus.79.05.79\pm.05 .609±.010plus-or-minus.609.010.609\pm.010 .003±.002plus-or-minus.003.002.003\pm.002 .492±.012plus-or-minus.492.012.492\pm.012 .005±.004plus-or-minus.005.004.005\pm.004
BART 2.1±.1plus-or-minus2.1.12.1\pm.1 .23±.01plus-or-minus.23.01.23\pm.01 2.3±.1plus-or-minus2.3.12.3\pm.1 .34±.02plus-or-minus.34.02.34\pm.02 .506±.014plus-or-minus.506.014.506\pm.014 .121±.024plus-or-minus.121.024.121\pm.024 .500±.011plus-or-minus.500.011.500\pm.011 .127±.024plus-or-minus.127.024.127\pm.024
CF 3.8±.2plus-or-minus3.8.23.8\pm.2 .18±.01plus-or-minus.18.01.18\pm.01 3.8±.2plus-or-minus3.8.23.8\pm.2 .40±.03plus-or-minus.40.03.40\pm.03 * .029±.004plus-or-minus.029.004.029\pm.004 * .034±.008plus-or-minus.034.008.034\pm.008
CEVAE 2.7±.1plus-or-minus2.7.12.7\pm.1 .34±.01plus-or-minus.34.01.34\pm.01 2.6±.1plus-or-minus2.6.12.6\pm.1 .46±.02plus-or-minus.46.02.46\pm.02 .845±.003plus-or-minus.845.003.845\pm.003 .022±.002plus-or-minus.022.002.022\pm.002 .841±.004plus-or-minus.841.004.841\pm.004 .032±.003plus-or-minus.032.003.032\pm.003
SITE .69±.0plus-or-minus.69.0.69\pm.0 .22±.01plus-or-minus.22.01.22\pm.01 .75±.0plus-or-minus.75.0.75\pm.0 .24±.01plus-or-minus.24.01.24\pm.01 .862±.002plus-or-minus.862.002.862\pm.002 .016±.001plus-or-minus.016.001.016\pm.001 .853±.006plus-or-minus.853.006.853\pm.006 .020±.002plus-or-minus.020.002.020\pm.002
GANITE 1.9±.4plus-or-minus1.9.41.9\pm.4 .43±.05plus-or-minus.43.05.43\pm.05 2.4±.4plus-or-minus2.4.42.4\pm.4 .49±.05plus-or-minus.49.05.49\pm.05 * .006±.002plus-or-minus.006.002.006\pm.002 * .009±.008plus-or-minus.009.008.009\pm.008
BLR 5.8±.3plus-or-minus5.8.35.8\pm.3 .72±.04plus-or-minus.72.04.72\pm.04 5.8±.3plus-or-minus5.8.35.8\pm.3 .93±.05plus-or-minus.93.05.93\pm.05 .611±.009plus-or-minus.611.009.611\pm.009 .006±.004plus-or-minus.006.004.006\pm.004 .510±.018plus-or-minus.510.018.510\pm.018 .033±.009plus-or-minus.033.009.033\pm.009
BNN 2.2±.1plus-or-minus2.2.12.2\pm.1 .37±.03plus-or-minus.37.03.37\pm.03 2.1±.1plus-or-minus2.1.12.1\pm.1 .42±.03plus-or-minus.42.03.42\pm.03 .690±.008plus-or-minus.690.008.690\pm.008 .006±.003plus-or-minus.006.003.006\pm.003 .676±.008plus-or-minus.676.008.676\pm.008 .020±.007plus-or-minus.020.007.020\pm.007
TARNet .88±.0plus-or-minus.88.0.88\pm.0 .26±.01plus-or-minus.26.01.26\pm.01 .95±.0plus-or-minus.95.0.95\pm.0 .28±.01plus-or-minus.28.01.28\pm.01 .849±.002plus-or-minus.849.002.849\pm.002 .011±.002plus-or-minus.011.002.011\pm.002 .840±.006plus-or-minus.840.006.840\pm.006 .015±.002plus-or-minus.015.002.015\pm.002
CFR-WASS .71±.0plus-or-minus.71.0.71\pm.0 .25±.01plus-or-minus.25.01.25\pm.01 .76±.0plus-or-minus.76.0.76\pm.0 .27±.01plus-or-minus.27.01.27\pm.01 .850±.002plus-or-minus.850.002.850\pm.002 .011±.002plus-or-minus.011.002.011\pm.002 .842±.005plus-or-minus.842.005.842\pm.005 .028±.003plus-or-minus.028.003.028\pm.003
Dragonnet 1.3±.4plus-or-minus1.3.41.3\pm.4 .14±.01plus-or-minus.14.01.14\pm.01 1.3±.5plus-or-minus1.3.51.3\pm.5 .20±.05plus-or-minus.20.05.20\pm.05 * .006±.005plus-or-minus.006.005.006\pm.005 * .006±.005plus-or-minus.006.005.006\pm.005
MBRL .522±.007plus-or-minus.522.007.522\pm.007 .121±.005plus-or-minus.121.005.121\pm.005 .565±.008plus-or-minus.565.008.565\pm.008 .133±.005plus-or-minus.133.005.133\pm.005 .879±.000plus-or-minus.879.000.879\pm.000 .003±.000plus-or-minus.003.000.003\pm.000 .874±.001plus-or-minus.874.001.874\pm.001 .007±.001plus-or-minus.007.001.007\pm.001
MBRL+θ1isubscriptsuperscript𝜃𝑖1\theta^{i}_{1} .522±.007plus-or-minus.522.007.522\pm.007 .102±.004plus-or-minus.102.004.102\pm.004 .565±.008plus-or-minus.565.008.565\pm.008 .166±.007plus-or-minus.166.007.166\pm.007 .879±.000plus-or-minus.879.000.879\pm.000 .003±.000plus-or-minus.003.000.003\pm.000 .874±.001plus-or-minus.874.001.874\pm.001 .008±.000plus-or-minus.008.000.008\pm.000
MBRL+θ2isubscriptsuperscript𝜃𝑖2\theta^{i}_{2} .522±.007plus-or-minus.522.007.522\pm.007 .114±.005plus-or-minus.114.005.114\pm.005 .565±.008plus-or-minus.565.008.565\pm.008 .204±.008plus-or-minus.204.008.204\pm.008 .879±.000plus-or-minus.879.000.879\pm.000 .003±.000plus-or-minus.003.000.003\pm.000 .874±.001plus-or-minus.874.001.874\pm.001 .006±.001plus-or-minus.006.001.006\pm.001

Appendix 0.B Assumptions

Assumption 1 (SUTVA)

The potential outcomes for any individual are not affected by the treatment assignment of other individuals.

Assumption 2 (Strong Ignorability)

Given the covariates 𝐙𝐙\mathbf{Z}, the potential outcomes are independent of the treatment assignment D𝐷D: (Y(0),Y(1))D𝐙\left(Y(0),Y(1)\right)\perp\!\!\!\perp D\;\mid\;\mathbf{Z}.

Assumption 3 (Overlap)

The probability of treatment assignment for any unit is positive: 0<Pr(D=d𝐙=𝐳)<1,0𝑃𝑟𝐷conditional𝑑𝐙𝐳10<Pr(D=d\mid\mathbf{Z}=\mathbf{z})<1, for-all\forall d{0,1}𝑑01d\in\{0,1\} and 𝐳Z𝐳Z\mathbf{z}\in\pazocal{Z}.

Assumption 4 (Consistency)

The potential outcome for treatment d𝑑d of each unit is equal to the observed factual outcome if the actual treatment is d𝑑d: (Y(d)=YF)D=d,conditional𝑌𝑑superscript𝑌𝐹𝐷𝑑(Y(d)=Y^{F})\mid D=d, for-all\forall d{0,1}𝑑01d\in\{0,1\}.

Appendix 0.C Proofs

We skip the proofs of Proposition 1 since it can be seen in [3]. In the following, we prove Proposition 2 and Property 1.

0.C.1 Proof of Proposition 2

Proof

The score functions stated in the Eqn. (2) and Eqn. (3) in the main paper are

ψ1(W,θi,ρ)=θig(i,𝐙)(Yg(i,𝐙))iD+(1i)(1D)im(𝐙)+(1i)(1m(𝐙));subscript𝜓1𝑊superscript𝜃𝑖𝜌superscript𝜃𝑖𝑔𝑖𝐙𝑌𝑔𝑖𝐙𝑖𝐷1𝑖1𝐷𝑖𝑚𝐙1𝑖1𝑚𝐙\displaystyle\psi_{1}(W,\theta^{i},\rho)=\theta^{i}-g(i,\mathbf{Z})-(Y-g(i,\mathbf{Z}))\frac{iD+(1-i)(1-D)}{im(\mathbf{Z})+(1-i)(1-m(\mathbf{Z}))};
ψ2(W,θi,ρ)=θig(i,𝐙)(Y(i)g(i,𝐙))((Dm(𝐙))𝔼[ν𝐙])2𝔼[ν2𝐙].subscript𝜓2𝑊superscript𝜃𝑖𝜌superscript𝜃𝑖𝑔𝑖𝐙𝑌𝑖𝑔𝑖𝐙superscript𝐷𝑚𝐙𝔼delimited-[]conditional𝜈𝐙2𝔼delimited-[]conditionalsuperscript𝜈2𝐙\displaystyle\psi_{2}(W,\theta^{i},\rho)=\theta^{i}-g(i,\mathbf{Z})-(Y(i)-g(i,\mathbf{Z}))\frac{\left((D-m(\mathbf{Z}))-\mathbb{E}\left[\nu\mid\mathbf{Z}\right]\right)^{2}}{\mathbb{E}\left[\nu^{2}\mid\mathbf{Z}\right]}.

We then check if the orthogonal condition (Definition 1) holds for ψ1(W,θi,ρ)subscript𝜓1𝑊superscript𝜃𝑖𝜌\psi_{1}(W,\theta^{i},\rho).

gψ1(W,θi,ρ)=1+iD+(1i)(1D)im(𝐙)+(1i)(1m(𝐙));subscript𝑔subscript𝜓1𝑊superscript𝜃𝑖𝜌1𝑖𝐷1𝑖1𝐷𝑖𝑚𝐙1𝑖1𝑚𝐙\displaystyle\partial_{g}\psi_{1}(W,\theta^{i},\rho)=-1+\frac{iD+(1-i)(1-D)}{im(\mathbf{Z})+(1-i)(1-m(\mathbf{Z}))};
mψ1(W,θi,ρ)=(Yg(i,𝐙))Dm(𝐙)2,ifi=1;formulae-sequencesubscript𝑚subscript𝜓1𝑊superscript𝜃𝑖𝜌𝑌𝑔𝑖𝐙𝐷𝑚superscript𝐙2𝑖𝑓𝑖1\displaystyle\partial_{m}\psi_{1}(W,\theta^{i},\rho)=(Y-g(i,\mathbf{Z}))\frac{D}{m(\mathbf{Z})^{2}},\;if\;i=1;
mψ1(W,θi,ρ)=(Yg(i,𝐙))1D(1m(𝐙))2,ifi=0.formulae-sequencesubscript𝑚subscript𝜓1𝑊superscript𝜃𝑖𝜌𝑌𝑔𝑖𝐙1𝐷superscript1𝑚𝐙2𝑖𝑓𝑖0\displaystyle\partial_{m}\psi_{1}(W,\theta^{i},\rho)=-(Y-g(i,\mathbf{Z}))\frac{1-D}{(1-m(\mathbf{Z}))^{2}},\;if\;i=0.

If i=1𝑖1i=1 and under the noise conditions 𝔼[ν𝐙]=0𝔼delimited-[]conditional𝜈𝐙0\mathbb{E}\left[\nu\mid\mathbf{Z}\right]=0 and 𝔼[ξD,𝐙]=0𝔼delimited-[]conditional𝜉𝐷𝐙0\mathbb{E}\left[\xi\mid D,\mathbf{Z}\right]=0, then we have

𝔼[gψ1(W,θ1,ρ)𝐙](g,m)=(g0,m0),θ1=θ01evaluated-at𝔼delimited-[]conditionalsubscript𝑔subscript𝜓1𝑊superscript𝜃1𝜌𝐙formulae-sequence𝑔𝑚subscript𝑔0subscript𝑚0superscript𝜃1subscriptsuperscript𝜃10\displaystyle\mathbb{E}\left[\partial_{g}\psi_{1}(W,\theta^{1},\rho)\mid\mathbf{Z}\right]\mid_{(g,m)=(g_{0},m_{0}),\theta^{1}=\theta^{1}_{0}}
=1+𝔼[Dm0(𝐙)𝐙]absent1𝔼delimited-[]conditional𝐷subscript𝑚0𝐙𝐙\displaystyle=-1+\mathbb{E}\left[\frac{D}{m_{0}(\mathbf{Z})}\mid\mathbf{Z}\right]
=1+𝔼[Dm0(𝐙)+m0(𝐙)m0(𝐙)𝐙]absent1𝔼delimited-[]conditional𝐷subscript𝑚0𝐙subscript𝑚0𝐙subscript𝑚0𝐙𝐙\displaystyle=-1+\mathbb{E}\left[\frac{D-m_{0}(\mathbf{Z})+m_{0}(\mathbf{Z})}{m_{0}(\mathbf{Z})}\mid\mathbf{Z}\right]
=1+𝔼[ν+m0(𝐙)m0(𝐙)𝐙]absent1𝔼delimited-[]conditional𝜈subscript𝑚0𝐙subscript𝑚0𝐙𝐙\displaystyle=-1+\mathbb{E}\left[\frac{\nu+m_{0}(\mathbf{Z})}{m_{0}(\mathbf{Z})}\mid\mathbf{Z}\right]
=1+𝔼[ν𝐙]m0(𝐙)+1absent1𝔼delimited-[]conditional𝜈𝐙subscript𝑚0𝐙1\displaystyle=-1+\frac{\mathbb{E}\left[\nu\mid\mathbf{Z}\right]}{m_{0}(\mathbf{Z})}+1
=0.absent0\displaystyle=0.
𝔼[mψ1(W,θ1,ρ)𝐙](g,m)=(g0,m0),θ1=θ01evaluated-at𝔼delimited-[]conditionalsubscript𝑚subscript𝜓1𝑊superscript𝜃1𝜌𝐙formulae-sequence𝑔𝑚subscript𝑔0subscript𝑚0superscript𝜃1subscriptsuperscript𝜃10\displaystyle\mathbb{E}\left[\partial_{m}\psi_{1}(W,\theta^{1},\rho)\mid\mathbf{Z}\right]\mid_{(g,m)=(g_{0},m_{0}),\theta^{1}=\theta^{1}_{0}}
=𝔼[(Yg0(i,𝐙))Dm0(𝐙)2𝐙]absent𝔼delimited-[]conditional𝑌subscript𝑔0𝑖𝐙𝐷subscript𝑚0superscript𝐙2𝐙\displaystyle=\mathbb{E}\left[(Y-g_{0}(i,\mathbf{Z}))\frac{D}{m_{0}(\mathbf{Z})^{2}}\mid\mathbf{Z}\right]
=𝔼[𝔼[(Yg0(i,𝐙))Dm0(𝐙)2D,𝐙]𝐙]absent𝔼delimited-[]conditional𝔼delimited-[]conditional𝑌subscript𝑔0𝑖𝐙𝐷subscript𝑚0superscript𝐙2𝐷𝐙𝐙\displaystyle=\mathbb{E}\left[\mathbb{E}\left[(Y-g_{0}(i,\mathbf{Z}))\frac{D}{m_{0}(\mathbf{Z})^{2}}\mid D,\mathbf{Z}\right]\mid\mathbf{Z}\right]
=𝔼[𝔼[ξDm0(𝐙)2D,𝐙]𝐙]absent𝔼delimited-[]conditional𝔼delimited-[]conditional𝜉𝐷subscript𝑚0superscript𝐙2𝐷𝐙𝐙\displaystyle=\mathbb{E}\left[\mathbb{E}\left[\xi\frac{D}{m_{0}(\mathbf{Z})^{2}}\mid D,\mathbf{Z}\right]\mid\mathbf{Z}\right]
=𝔼[𝔼[ξD,𝐙]Dm0(𝐙)2𝐙]absent𝔼delimited-[]conditional𝔼delimited-[]conditional𝜉𝐷𝐙𝐷subscript𝑚0superscript𝐙2𝐙\displaystyle=\mathbb{E}\left[\mathbb{E}\left[\xi\mid D,\mathbf{Z}\right]\frac{D}{m_{0}(\mathbf{Z})^{2}}\mid\mathbf{Z}\right]
=0.absent0\displaystyle=0.

If i=0𝑖0i=0 and under the noise conditions 𝔼[ν𝐙]=0𝔼delimited-[]conditional𝜈𝐙0\mathbb{E}\left[\nu\mid\mathbf{Z}\right]=0 and 𝔼[ξD,𝐙]=0𝔼delimited-[]conditional𝜉𝐷𝐙0\mathbb{E}\left[\xi\mid D,\mathbf{Z}\right]=0, then we have

𝔼[gψ1(W,θ0,ρ)𝐙](g,m)=(g0,m0),θ0=θ00evaluated-at𝔼delimited-[]conditionalsubscript𝑔subscript𝜓1𝑊superscript𝜃0𝜌𝐙formulae-sequence𝑔𝑚subscript𝑔0subscript𝑚0superscript𝜃0subscriptsuperscript𝜃00\displaystyle\mathbb{E}\left[\partial_{g}\psi_{1}(W,\theta^{0},\rho)\mid\mathbf{Z}\right]\mid_{(g,m)=(g_{0},m_{0}),\theta^{0}=\theta^{0}_{0}}
=1+𝔼[1D1m0(𝐙)𝐙]absent1𝔼delimited-[]conditional1𝐷1subscript𝑚0𝐙𝐙\displaystyle=-1+\mathbb{E}\left[\frac{1-D}{1-m_{0}(\mathbf{Z})}\mid\mathbf{Z}\right]
=1+𝔼[1Dm0(𝐙)+m0(𝐙)1m0(𝐙)𝐙]absent1𝔼delimited-[]conditional1𝐷subscript𝑚0𝐙subscript𝑚0𝐙1subscript𝑚0𝐙𝐙\displaystyle=-1+\mathbb{E}\left[\frac{1-D-m_{0}(\mathbf{Z})+m_{0}(\mathbf{Z})}{1-m_{0}(\mathbf{Z})}\mid\mathbf{Z}\right]
=1+𝔼[ν+1m0(𝐙)1m0(𝐙)𝐙]absent1𝔼delimited-[]conditional𝜈1subscript𝑚0𝐙1subscript𝑚0𝐙𝐙\displaystyle=-1+\mathbb{E}\left[\frac{-\nu+1-m_{0}(\mathbf{Z})}{1-m_{0}(\mathbf{Z})}\mid\mathbf{Z}\right]
=1𝔼[ν𝐙]1m0(𝐙)+1absent1𝔼delimited-[]conditional𝜈𝐙1subscript𝑚0𝐙1\displaystyle=-1-\frac{\mathbb{E}\left[\nu\mid\mathbf{Z}\right]}{1-m_{0}(\mathbf{Z})}+1
=0.absent0\displaystyle=0.
𝔼[mψ1(W,θ0,ρ)𝐙](g,m)=(g0,m0),θ0=θ00evaluated-at𝔼delimited-[]conditionalsubscript𝑚subscript𝜓1𝑊superscript𝜃0𝜌𝐙formulae-sequence𝑔𝑚subscript𝑔0subscript𝑚0superscript𝜃0subscriptsuperscript𝜃00\displaystyle\mathbb{E}\left[\partial_{m}\psi_{1}(W,\theta^{0},\rho)\mid\mathbf{Z}\right]\mid_{(g,m)=(g_{0},m_{0}),\theta^{0}=\theta^{0}_{0}}
=𝔼[(Yg0(i,𝐙))1D(1m0(𝐙))2𝐙]absent𝔼delimited-[]conditional𝑌subscript𝑔0𝑖𝐙1𝐷superscript1subscript𝑚0𝐙2𝐙\displaystyle=\mathbb{E}\left[-(Y-g_{0}(i,\mathbf{Z}))\frac{1-D}{(1-m_{0}(\mathbf{Z}))^{2}}\mid\mathbf{Z}\right]
=𝔼[𝔼[(Yg0(i,𝐙))1D(1m0(𝐙))2D,𝐙]𝐙]absent𝔼delimited-[]conditional𝔼delimited-[]conditional𝑌subscript𝑔0𝑖𝐙1𝐷superscript1subscript𝑚0𝐙2𝐷𝐙𝐙\displaystyle=\mathbb{E}\left[\mathbb{E}\left[-(Y-g_{0}(i,\mathbf{Z}))\frac{1-D}{(1-m_{0}(\mathbf{Z}))^{2}}\mid D,\mathbf{Z}\right]\mid\mathbf{Z}\right]
=𝔼[𝔼[ξ1D(1m0(𝐙))2D,𝐙]𝐙]absent𝔼delimited-[]conditional𝔼delimited-[]conditional𝜉1𝐷superscript1subscript𝑚0𝐙2𝐷𝐙𝐙\displaystyle=\mathbb{E}\left[\mathbb{E}\left[-\xi\frac{1-D}{(1-m_{0}(\mathbf{Z}))^{2}}\mid D,\mathbf{Z}\right]\mid\mathbf{Z}\right]
=𝔼[𝔼[ξD,𝐙]1D(1m0(𝐙))2𝐙]absent𝔼delimited-[]conditional𝔼delimited-[]conditional𝜉𝐷𝐙1𝐷superscript1subscript𝑚0𝐙2𝐙\displaystyle=\mathbb{E}\left[-\mathbb{E}\left[\xi\mid D,\mathbf{Z}\right]\frac{1-D}{(1-m_{0}(\mathbf{Z}))^{2}}\mid\mathbf{Z}\right]
=0.absent0\displaystyle=0.

We then check if the orthogonal condition (Definition 1) holds for ψ2(W,θi,ρ)subscript𝜓2𝑊superscript𝜃𝑖𝜌\psi_{2}(W,\theta^{i},\rho).

mψ2(W,θi,ρ)=(Y(i)g(i,𝐙))2((Dm(𝐙))𝔼[ν𝐙])𝔼[ν2𝐙]subscript𝑚subscript𝜓2𝑊superscript𝜃𝑖𝜌𝑌𝑖𝑔𝑖𝐙2𝐷𝑚𝐙𝔼delimited-[]conditional𝜈𝐙𝔼delimited-[]conditionalsuperscript𝜈2𝐙\displaystyle\partial_{m}\psi_{2}(W,\theta^{i},\rho)=(Y(i)-g(i,\mathbf{Z}))\frac{2((D-m(\mathbf{Z}))-\mathbb{E}\left[\nu\mid\mathbf{Z}\right])}{\mathbb{E}\left[\nu^{2}\mid\mathbf{Z}\right]}
gψ2(W,θi,ρ)=1+((Dm(𝐙))𝔼[ν𝐙])2𝔼[ν2𝐙]subscript𝑔subscript𝜓2𝑊superscript𝜃𝑖𝜌1superscript𝐷𝑚𝐙𝔼delimited-[]conditional𝜈𝐙2𝔼delimited-[]conditionalsuperscript𝜈2𝐙\displaystyle\partial_{g}\psi_{2}(W,\theta^{i},\rho)=-1+\frac{\left((D-m(\mathbf{Z}))-\mathbb{E}\left[\nu\mid\mathbf{Z}\right]\right)^{2}}{\mathbb{E}\left[\nu^{2}\mid\mathbf{Z}\right]}

Using the noise condition 𝔼[ν𝐙]=0𝔼delimited-[]conditional𝜈𝐙0\mathbb{E}\left[\nu\mid\mathbf{Z}\right]=0, we have

𝔼[gψ2(W,θi,ρ)𝐙](g,m)=(g0,m0),θi=θ0ievaluated-at𝔼delimited-[]conditionalsubscript𝑔subscript𝜓2𝑊superscript𝜃𝑖𝜌𝐙formulae-sequence𝑔𝑚subscript𝑔0subscript𝑚0superscript𝜃𝑖subscriptsuperscript𝜃𝑖0\displaystyle\mathbb{E}\left[\partial_{g}\psi_{2}(W,\theta^{i},\rho)\mid\mathbf{Z}\right]\mid_{(g,m)=(g_{0},m_{0}),\theta^{i}=\theta^{i}_{0}}
=1+𝔼[((Dm0(𝐙))𝔼[ν𝐙])2𝔼[ν2𝐙]𝐙]absent1𝔼delimited-[]conditionalsuperscript𝐷subscript𝑚0𝐙𝔼delimited-[]conditional𝜈𝐙2𝔼delimited-[]conditionalsuperscript𝜈2𝐙𝐙\displaystyle=-1+\mathbb{E}\left[\frac{\left((D-m_{0}(\mathbf{Z}))-\mathbb{E}\left[\nu\mid\mathbf{Z}\right]\right)^{2}}{\mathbb{E}\left[\nu^{2}\mid\mathbf{Z}\right]}\mid\mathbf{Z}\right]
=1+1𝔼[ν2𝐙]𝔼[((Dm0(𝐙))𝔼[ν𝐙])2𝐙]absent11𝔼delimited-[]conditionalsuperscript𝜈2𝐙𝔼delimited-[]conditionalsuperscript𝐷subscript𝑚0𝐙𝔼delimited-[]conditional𝜈𝐙2𝐙\displaystyle=-1+\frac{1}{\mathbb{E}\left[\nu^{2}\mid\mathbf{Z}\right]}\mathbb{E}\left[\left((D-m_{0}(\mathbf{Z}))-\mathbb{E}\left[\nu\mid\mathbf{Z}\right]\right)^{2}\mid\mathbf{Z}\right]
=1+1𝔼[ν2𝐙]𝔼[(Dm0(𝐙))2+(𝔼[ν𝐙])22(Dm0(𝐙))𝔼[ν𝐙]𝐙]absent11𝔼delimited-[]conditionalsuperscript𝜈2𝐙𝔼delimited-[]superscript𝐷subscript𝑚0𝐙2superscript𝔼delimited-[]conditional𝜈𝐙2conditional2𝐷subscript𝑚0𝐙𝔼delimited-[]conditional𝜈𝐙𝐙\displaystyle=-1+\frac{1}{\mathbb{E}\left[\nu^{2}\mid\mathbf{Z}\right]}\mathbb{E}[(D-m_{0}(\mathbf{Z}))^{2}+(\mathbb{E}\left[\nu\mid\mathbf{Z}\right])^{2}-2(D-m_{0}(\mathbf{Z}))\mathbb{E}\left[\nu\mid\mathbf{Z}\right]\mid\mathbf{Z}]
=1+1𝔼[ν2𝐙][𝔼[ν2𝐙]+(𝔼[ν𝐙])22(𝔼[ν𝐙])2]absent11𝔼delimited-[]conditionalsuperscript𝜈2𝐙delimited-[]𝔼delimited-[]conditionalsuperscript𝜈2𝐙superscript𝔼delimited-[]conditional𝜈𝐙22superscript𝔼delimited-[]conditional𝜈𝐙2\displaystyle=-1+\frac{1}{\mathbb{E}\left[\nu^{2}\mid\mathbf{Z}\right]}\left[\mathbb{E}\left[\nu^{2}\mid\mathbf{Z}\right]+(\mathbb{E}\left[\nu\mid\mathbf{Z}\right])^{2}-2(\mathbb{E}\left[\nu\mid\mathbf{Z}\right])^{2}\right]
=1+1𝔼[ν2𝐙][𝔼[ν2𝐙](𝔼[ν𝐙])2]absent11𝔼delimited-[]conditionalsuperscript𝜈2𝐙delimited-[]𝔼delimited-[]conditionalsuperscript𝜈2𝐙superscript𝔼delimited-[]conditional𝜈𝐙2\displaystyle=-1+\frac{1}{\mathbb{E}\left[\nu^{2}\mid\mathbf{Z}\right]}\left[\mathbb{E}\left[\nu^{2}\mid\mathbf{Z}\right]-(\mathbb{E}\left[\nu\mid\mathbf{Z}\right])^{2}\right]
=1+𝔼[ν2𝐙]𝔼[ν2𝐙]=0.absent1𝔼delimited-[]conditionalsuperscript𝜈2𝐙𝔼delimited-[]conditionalsuperscript𝜈2𝐙0\displaystyle=-1+\frac{\mathbb{E}\left[\nu^{2}\mid\mathbf{Z}\right]}{\mathbb{E}\left[\nu^{2}\mid\mathbf{Z}\right]}=0.

By the model setup Y=g0(D,𝐙)+ξ𝑌subscript𝑔0𝐷𝐙𝜉Y=g_{0}(D,\mathbf{Z})+\xi, we have the underlying relation for the potential outcome Y(i)𝑌𝑖Y(i) that Y(i)=g0(i,𝐙)+ξ𝑌𝑖subscript𝑔0𝑖𝐙𝜉Y(i)=g_{0}(i,\mathbf{Z})+\xi. Using the noise condition 𝔼[ξD,𝐙]=0𝔼delimited-[]conditional𝜉𝐷𝐙0\mathbb{E}\left[\xi\mid D,\mathbf{Z}\right]=0, we have

𝔼[mψ2(W,θi,ρ)𝐙](g,m)=(g0,m0),θi=θ0ievaluated-at𝔼delimited-[]conditionalsubscript𝑚subscript𝜓2𝑊superscript𝜃𝑖𝜌𝐙formulae-sequence𝑔𝑚subscript𝑔0subscript𝑚0superscript𝜃𝑖subscriptsuperscript𝜃𝑖0\displaystyle\mathbb{E}\left[\partial_{m}\psi_{2}(W,\theta^{i},\rho)\mid\mathbf{Z}\right]\mid_{(g,m)=(g_{0},m_{0}),\theta^{i}=\theta^{i}_{0}}
=𝔼[𝔼[ξ2((Dm0(𝐙))𝔼[ν𝐙])𝔼[ν2𝐙]D,𝐙]𝐙]absent𝔼delimited-[]conditional𝔼delimited-[]conditional𝜉2𝐷subscript𝑚0𝐙𝔼delimited-[]conditional𝜈𝐙𝔼delimited-[]conditionalsuperscript𝜈2𝐙𝐷𝐙𝐙\displaystyle=\mathbb{E}\left[\mathbb{E}\left[\xi\frac{2((D-m_{0}(\mathbf{Z}))-\mathbb{E}\left[\nu\mid\mathbf{Z}\right])}{\mathbb{E}\left[\nu^{2}\mid\mathbf{Z}\right]}\mid D,\mathbf{Z}\right]\mid\mathbf{Z}\right]
=𝔼[2((Dm0(𝐙))𝔼[ν𝐙])𝔼[ν2𝐙]𝔼[ξD,𝐙]𝐙]absent𝔼delimited-[]conditional2𝐷subscript𝑚0𝐙𝔼delimited-[]conditional𝜈𝐙𝔼delimited-[]conditionalsuperscript𝜈2𝐙𝔼delimited-[]conditional𝜉𝐷𝐙𝐙\displaystyle=\mathbb{E}\left[\frac{2((D-m_{0}(\mathbf{Z}))-\mathbb{E}\left[\nu\mid\mathbf{Z}\right])}{\mathbb{E}\left[\nu^{2}\mid\mathbf{Z}\right]}\mathbb{E}\left[\xi\mid D,\mathbf{Z}\right]\mid\mathbf{Z}\right]
=0.absent0\displaystyle=0.

Therefore, the noise conditions 𝔼[ξD,𝐙]=0𝔼delimited-[]conditional𝜉𝐷𝐙0\mathbb{E}\left[\xi\mid D,\mathbf{Z}\right]=0 and 𝔼[ν𝐙]=0𝔼delimited-[]conditional𝜈𝐙0\mathbb{E}\left[\nu\mid\mathbf{Z}\right]=0 are sufficient for the score functions ψ1subscript𝜓1\psi_{1} and ψ2subscript𝜓2\psi_{2} satisfying the orthogonal condition.

0.C.2 Proof of Property 1

Proof

Using the noise condition 𝔼[ξD,𝐙]=0𝔼delimited-[]conditional𝜉𝐷𝐙0\mathbb{E}\left[\xi\mid D,\mathbf{Z}\right]=0, we have

𝔼[(Yg0(D,𝐙))(Dm0(𝐙))]𝔼delimited-[]𝑌subscript𝑔0𝐷𝐙𝐷subscript𝑚0𝐙\displaystyle\mathbb{E}\left[(Y-g_{0}(D,\mathbf{Z}))(D-m_{0}(\mathbf{Z}))\right]
=\displaystyle= 𝔼[𝔼[(Yg0(D,𝐙))(Dm0(𝐙))D,𝐙]]𝔼delimited-[]𝔼delimited-[]conditional𝑌subscript𝑔0𝐷𝐙𝐷subscript𝑚0𝐙𝐷𝐙\displaystyle\mathbb{E}\left[\mathbb{E}\left[(Y-g_{0}(D,\mathbf{Z}))(D-m_{0}(\mathbf{Z}))\mid D,\mathbf{Z}\right]\right]
=\displaystyle= 𝔼[(Dm0(𝐙))𝔼[(Yg0(D,𝐙))D,𝐙]]𝔼delimited-[]𝐷subscript𝑚0𝐙𝔼delimited-[]conditional𝑌subscript𝑔0𝐷𝐙𝐷𝐙\displaystyle\mathbb{E}\left[(D-m_{0}(\mathbf{Z}))\mathbb{E}\left[(Y-g_{0}(D,\mathbf{Z}))\mid D,\mathbf{Z}\right]\right]
=\displaystyle= 𝔼[(Dm0(𝐙))𝔼[ξD,𝐙]]𝔼delimited-[]𝐷subscript𝑚0𝐙𝔼delimited-[]conditional𝜉𝐷𝐙\displaystyle\mathbb{E}\left[(D-m_{0}(\mathbf{Z}))\mathbb{E}\left[\xi\mid D,\mathbf{Z}\right]\right]
=\displaystyle= 0.0\displaystyle 0.

References

  • [1] Almond, D., Chay, K.Y., Lee, D.S.: The costs of low birth weight. The Quarterly Journal of Economics 120(3), 1031–1083 (2005)
  • [2] Athey, S., Wager, S.: Estimating treatment effects with causal forests: An application. Observational Studies 5(2), 37–51 (2019)
  • [3] Chernozhukov, V., Chetverikov, D., Demirer, M., Duflo, E., Hansen, C., Newey, W., Robins, J.: Double/debiased machine learning for treatment and structural parameters. The Econometrics Journal 21(1), C1–C68 (2018)
  • [4] Chipman, H.A., George, E.I., McCulloch, R.E.: Bart: Bayesian additive regression trees. The Annals of Applied Statistics 4(1), 266–298 (2010)
  • [5] Chu, Z., Rathbun, S.L., Li, S.: Graph infomax adversarial learning for treatment effect estimation with networked observational data. In: KDD. pp. 176–184 (2021), https://doi.org/10.1145/3447548.3467302
  • [6] Dorie, V.: Nonparametric methods for causal inference. https://github.com/vdorie/npci (2021)
  • [7] Farrell, M.H.: Robust inference on average treatment effects with possibly more covariates than observations. Journal of Econometrics 189(1), 1–23 (2015)
  • [8] Glass, T.A., Goodman, S.N., Hernán, M.A., Samet, J.M.: Causal inference in public health. Annual review of public health 34, 61–75 (2013)
  • [9] Guo, R., Cheng, L., Li, J., Hahn, P.R., Liu, H.: A survey of learning causality with data: Problems and methods. ACM Computing Surveys (CSUR) 53(4), 1–37 (2020)
  • [10] Guo, R., Li, J., Li, Y., Candan, K.S., Raglin, A., Liu, H.: Ignite: A minimax game toward learning individual treatment effects from networked observational data. In: IJCAI. pp. 4534–4540 (2020)
  • [11] Hatt, T., Feuerriegel, S.: Estimating Average Treatment Effects via Orthogonal Regularization, p. 680–689. Association for Computing Machinery, New York, NY, USA (2021), https://doi.org/10.1145/3459637.3482339
  • [12] Hill, J., Su, Y.S.: Assessing lack of common support in causal inference using bayesian nonparametrics: Implications for evaluating the effect of breastfeeding on children’s cognitive outcomes. The Annals of Applied Statistics pp. 1386–1420 (2013)
  • [13] Hill, J.L.: Bayesian nonparametric modeling for causal inference. Journal of Computational and Graphical Statistics 20(1), 217–240 (2011)
  • [14] Huang, Y., Leung, C.H., Yan, X., Wu, Q.: Higher-order orthogonal causal learning for treatment effect. arXiv preprint arXiv:2103.11869 (2021)
  • [15] Huang, Y., Leung, C.H., Yan, X., Wu, Q., Peng, N., Wang, D., Huang, Z.: The causal learning of retail delinquency. In: Proceedings of the AAAI Conference on Artificial Intelligence. vol. 35, pp. 204–212 (2021)
  • [16] Johansson, F., Shalit, U., Sontag, D.: Learning representations for counterfactual inference. In: International conference on machine learning. pp. 3020–3029. PMLR (2016)
  • [17] Kingma, D.P., Ba, J.: Adam: A method for stochastic optimization. arXiv preprint arXiv:1412.6980 (2014)
  • [18] Li, S., Fu, Y.: Matching on balanced nonlinear representations for treatment effects estimation. In: NIPS (2017)
  • [19] Louizos, C., Shalit, U., Mooij, J., Sontag, D., Zemel, R., Welling, M.: Causal effect inference with deep latent-variable models. In: Proceedings of the 31st International Conference on Neural Information Processing Systems. pp. 6449–6459 (2017)
  • [20] Neyman, J.: C (α𝛼\alpha) tests and their use. Sankhyā: The Indian Journal of Statistics, Series A pp. 1–21 (1979)
  • [21] Pearl, J.: Causal inference in statistics: An overview. Statistics surveys 3, 96–146 (2009)
  • [22] Rubin, D.B.: Causal inference using potential outcomes: Design, modeling, decisions. Journal of the American Statistical Association 100(469), 322–331 (2005)
  • [23] Shalit, U., Johansson, F.D., Sontag, D.: Estimating individual treatment effect: generalization bounds and algorithms. In: International Conference on Machine Learning. pp. 3076–3085. PMLR (2017)
  • [24] Shi, C., Blei, D., Veitch, V.: Adapting neural networks for the estimation of treatment effects. In: Advances in Neural Information Processing Systems. pp. 2503–2513 (2019)
  • [25] Wager, S., Athey, S.: Estimation and inference of heterogeneous treatment effects using random forests. Journal of the American Statistical Association 113(523), 1228–1242 (2018)
  • [26] Yao, L., Chu, Z., Li, S., Li, Y., Gao, J., Zhang, A.: A survey on causal inference. ACM Trans. Knowl. Discov. Data 15(5) (May 2021). https://doi.org/10.1145/3444944, https://doi.org/10.1145/3444944
  • [27] Yao, L., Li, S., Li, Y., Huai, M., Gao, J., Zhang, A.: Representation learning for treatment effect estimation from observational data. Advances in Neural Information Processing Systems 31 (2018)
  • [28] Yoon, J., Jordon, J., Van Der Schaar, M.: Ganite: Estimation of individualized treatment effects using generative adversarial nets. In: International Conference on Learning Representations (2018)