Source counts at 7.7 to 21 m in CEERS field with James Webb Space Telescope
Abstract
Source counts — the number density of sources as a function of flux density — represent one of the fundamental metrics in observational cosmology due to their straightforward and simple nature. It is an important tool that provides information on galaxy formation and evolution. Source counting is a direct measurement. Compared to advanced analyzes that require more observational input such as luminosity/mass functions, it is less affected by any cosmological parameter assumptions or any errors propagated from luminosities. In this study, we present source counts at the six mid-infrared bands, i.e., 7.7, 10, 12.8, 15, 18, and 21 m from the MIR instrument of the James Webb Space Telescope (JWST). Contrasted with the infrared source counts achieved by prior generations of infrared space telescopes, our source counts delve up to 100 times deeper, showcasing the exceptional sensitivity of the JWST, and aligning with the model predictions based on preceding observations. In a follow-up study, we utilize our source counts to establish a new IR galaxy population evolutionary model that provides a physical interpretation.
keywords:
galaxies: evolution – infrared: galaxies1 Introduction
With the successful launch of the James Webb Space Telescope (Gardner et al., 2006; Kalirai, 2018, JWST) in 2021, observational cosmology has started to benefit from unprecedented sensitivity gains in the infrared (IR). This highly advanced telescope is now leading us to explore the faintest IR populations not only near our Galaxy but also in the distant Universe. Previous space missions for IR observations, such as the Infrared Astronomical Satellite (IRAS, Neugebauer et al., 1984), ISO (Kessler et al., 1996), AKARI (Murakami et al., 2007), Spitzer (Werner et al., 2004), and Herschel (Pilbratt et al., 2010) have revealed a variety of IR populations and their evolutionary properties, as seen through the luminosity functions (LFs) (e.g., Saunders et al., 1990; Rowan-Robinson et al., 1997; Elbaz et al., 2002; Caputi et al., 2007; Goto et al., 2010; Gruppioni et al., 2010; Gruppioni et al., 2011). Additionally, in the era of Spitzer, deep-field surveys were carried out to analyze the faint IR populations. In the extreme deep field, e.g., S-CANDELS, SEDS, Ashby et al. (2015) has already reached sub-uJy levels at 4.5m. The JWST is set to continue and extend the work of its precursors to longer wavelengths and even more sensitive deep field surveys.
Astronomers rely on dusty and star-bursting galaxies to explain the observed cosmic infrared background. These galaxies re-radiate a substantial amount of their bolometric energy, primarily in the IR wavelength. In particular, the spectral energy distribution (SEDs) of mid-IR (MIR) galaxies can identify emissions from star-forming (SF) activities and active galactic nuclei (AGNs, including type 1 and 2). Based on the emission characteristics of galaxies, they can be broadly classified into four categories: star-forming (SF) galaxies, AGNs, a mixture of the two, and quiescent galaxies. SF and AGN characteristics are thought to be key to the evolving population of source counts in the MIR. Therefore, observing the number density of both AGNs and SF galaxies can help decipher the critical aspects of cosmic galaxy evolution history.
The source counts of bright, IR galaxies have been obtained in ISO bands (e.g., Pearson, 2005), Spitzer bands (e.g., Pearson, 2005), and AKARI bands (e.g., Wada et al., 2008; Pearson et al., 2010, 2014; Takagi et al., 2012). Nevertheless, at the faint end of the MIR source counts, luminosity functions (LFs), and evolution models reaching down to the sub-Jy levels remain partially unexplored in the pre-JWST era, with these aspects having been only predicted by several studies (e.g., Gruppioni et al., 2011; Cowley et al., 2018).
The latest source counts using JWST data (Ling et al., 2022) focused on the extra fields surrounding Stephan’s Quintet, which are less contaminated by foreground objects such as Galactic stars. However, due to the lack of IR spectral observations from JWST in the current Stephan’s Quintet field, Ling et al. (2022) were unable to provide any quantitative remarks on potential contamination/noise from the foreground. Ling et al. (2022) had to manually mask out and exclude contaminants or unnecessary objects/regions from their work, potentially resulting in a shallower flux limit. Compared to Stephan’s Quintet field studied by Ling et al. (2022), the Cosmic Evolution Early Release Science Survey (Finkelstein et al. in prep., hereafter CEERS) provides a much broader and cleaner field for extra-galactic studies, suffering less from the foreground contaminants. Therefore, we utilize a clean field to obtain continuous MIR source counts with CEERS, hoping that it will provide us with crucial early insights into the evolutionary properties of MIR-selected galaxies.
In this work, we only focus on the two pointings having full MIRI coverage from 7.7 to 21.0 m of the first early MIRI data release on Jul. 14, 2022. The CEERS survey will cover about 100 sq. arcmin in the future, taking some parts of the Extended Groth Strip (EGS) field using NIRCam, MIRI, and NIRSpec. More details of the observational strategy can be found on the official website of CEERS Survey 111https://ceers.github.io/obs.html.
This paper is organized as follows: In 2 we present the basic properties of JWST CEERS data, source extraction, and the completeness of our source detection. In 3, we discuss our observed source count results with the model predictions from the literature. Finally, our conclusion is given in §4. We follow Cowley et al. (2018), whose models we compare with, adopting the Planck15 cosmology (Planck Collaboration et al., 2016), i.e., cold dark matter cosmology with (, , ,)=(0.307, 0.693, 0.0486, 0.677).
2 Data Analysis
We used data from one of the Early Release Science programs, dedicated to the Cosmic Evolution Early Release Science (CEERS; PID 1345) Survey (Finkelstein et al., 2017) by JWST. We did not perform any further map/flux calibration for the level-3 image products from the MAST archive. The level-3 image products have gone through the JWST general calibration pipeline version 1.8.2, which was released on October 19th, 2022. Furthermore, as documented in the early calibration caveat, some of the MIRI images produced via early pipeline would still suffer from the so-called “shower artifacts” produced by cosmic rays. The artifact would affect the data quality and further impact the scientific analysis. Fortunately, shower artifacts are not present in the CEERS fields used in this work. Therefore, no additional major calibration is needed. We selected the fields that are covered by all the broadband filters centered at 7.7 m, 10.0 m, 12.8 m, 15.0 m, 18.0 m, and 21.0 m as shown in Fig.1. The IDs of the two fields are jw01345-o001_t021 and jw01345-o002_t022, respectively. Hereafter, for simplicity and clarity, we use the notations ’o001’ and ’o002’ for jw01345-o001_t021 and jw01345-o002_t022, respectively.
2.1 Source extraction & Photometry
In each CEERS field, due to the higher noise along the edge of the images, we masked the edges from each image frame with the green polygon shown in Fig. 1 for data analysis in this work. The noise mainly comes from the less dithering frames in the stacking procedure. The remaining areas in o001 and o002 field are 7127.45 arcsec2 ( arcmin2), and 14254.9 arcsec2 ( arcmin2) in total. The pixel scale is 0.1109 arcsec/pixel in all filters.
While checking the public catalogue available on the JWST archive, we noticed that some sources close to the detection limits are missing. Since we aim to include faint sources in the MIR bands, we performed our own source extraction using the Source-Extractor V2.19.5 (Bertin & Arnouts, 1996, hereafter SE). We have followed the photometry of the previous work Ling et al. (2022) and improved it for accuracy with Photutils. Photutils is a Python package that could be used to handle basic astronomical image processing and analysis, which is also used in JWST pipeline. Both Photutils (Bradley et al., 2022) and SE are involved in performing the photometry in this work, whereas Ling et al. (2022) relied only on SE.
In this work, Photoutils is used for background estimation and subtraction, and SE is used for source extraction, because we found that Photoutils performs better than SE in background estimation on these images. In SE, the background estimation sometimes erroneously includes the fluxes from the sources. This could lead to significant flux loss for the bright extended sources. However, Photoutils uses a smoother background estimation approach that does not confuse sources as a background. As a result, we perform background subtraction on each MIRI image using Photoutils.
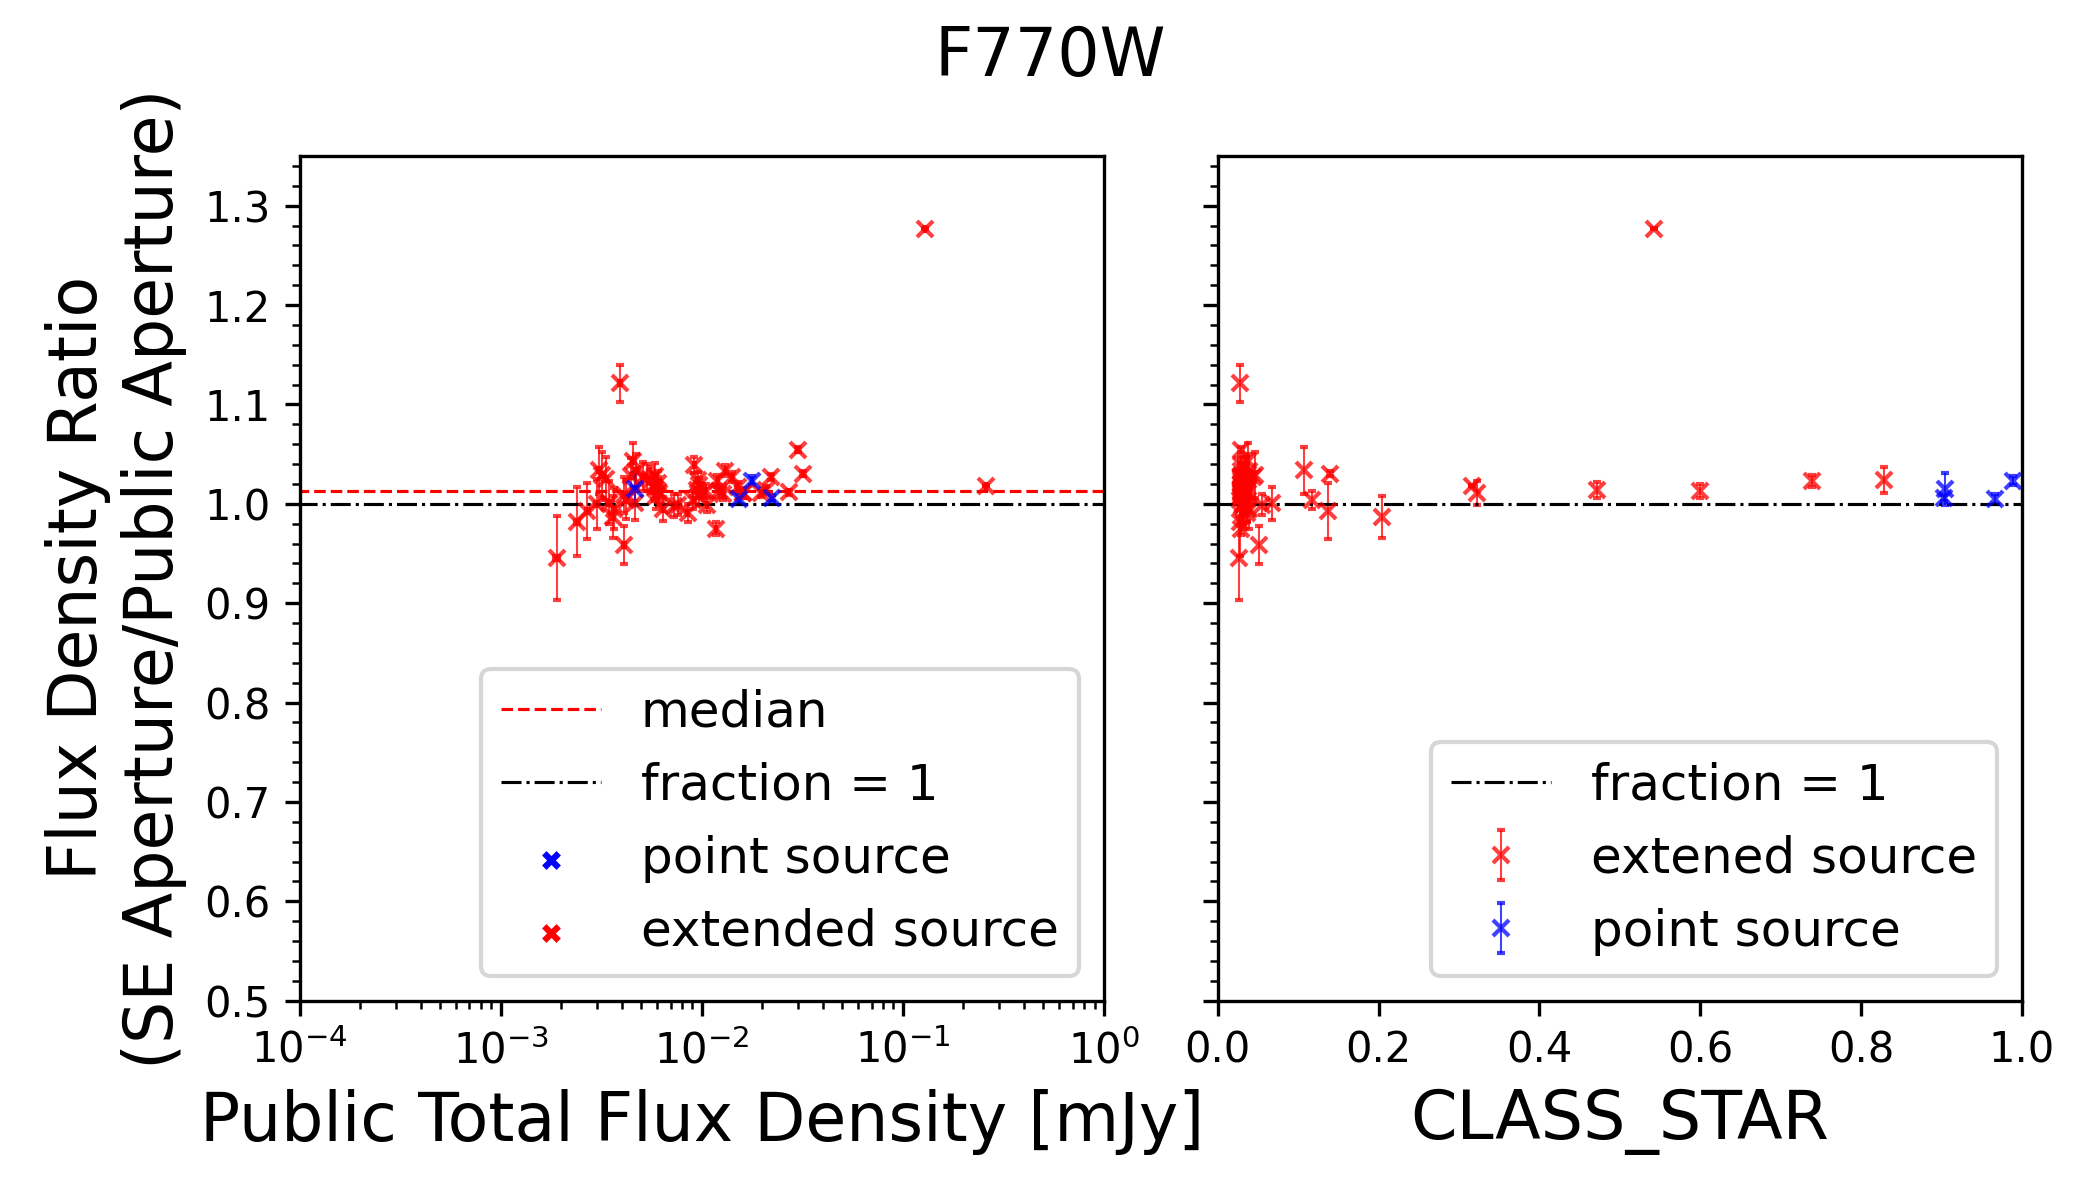
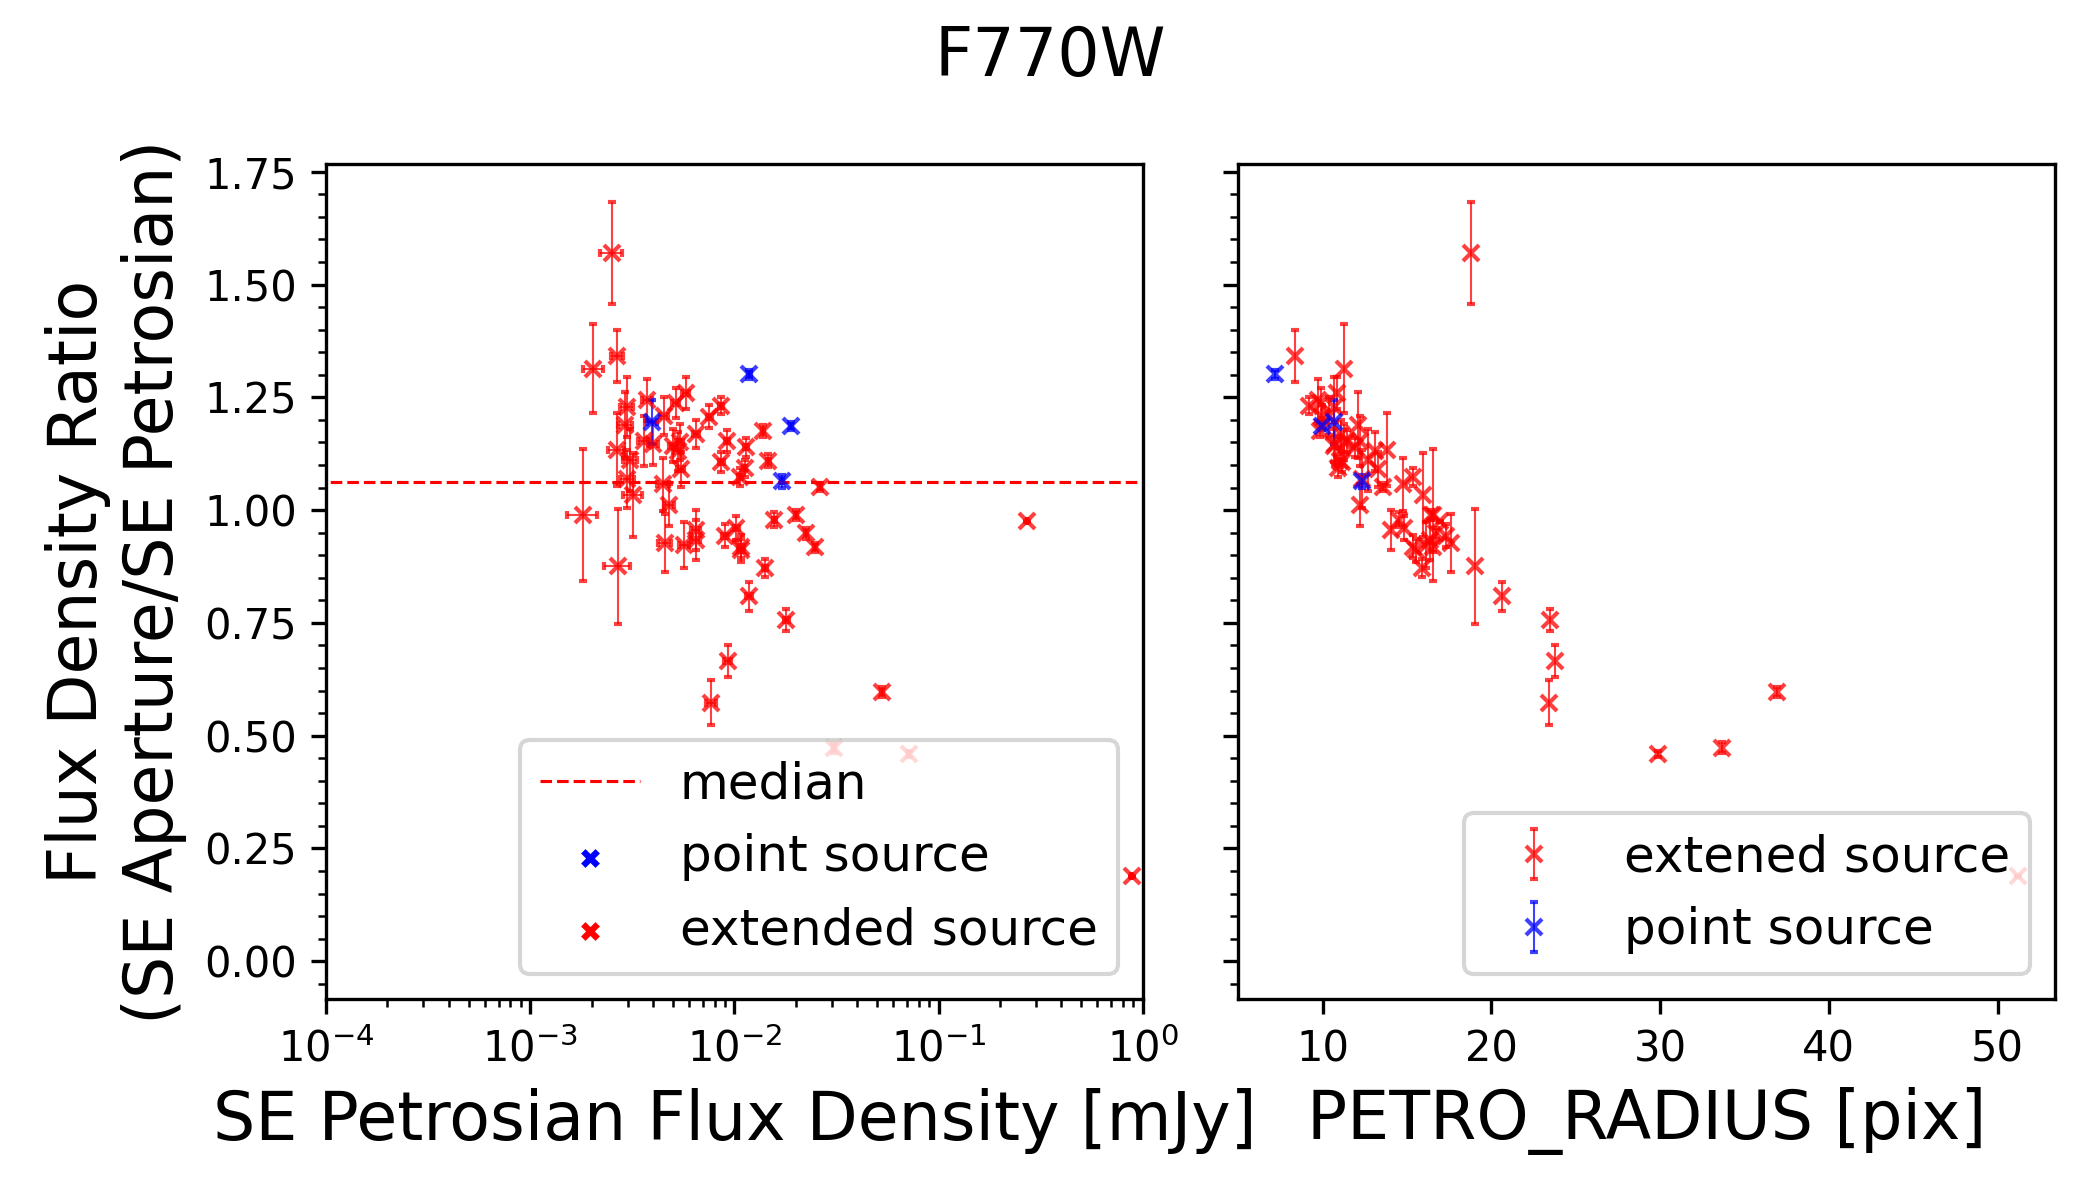
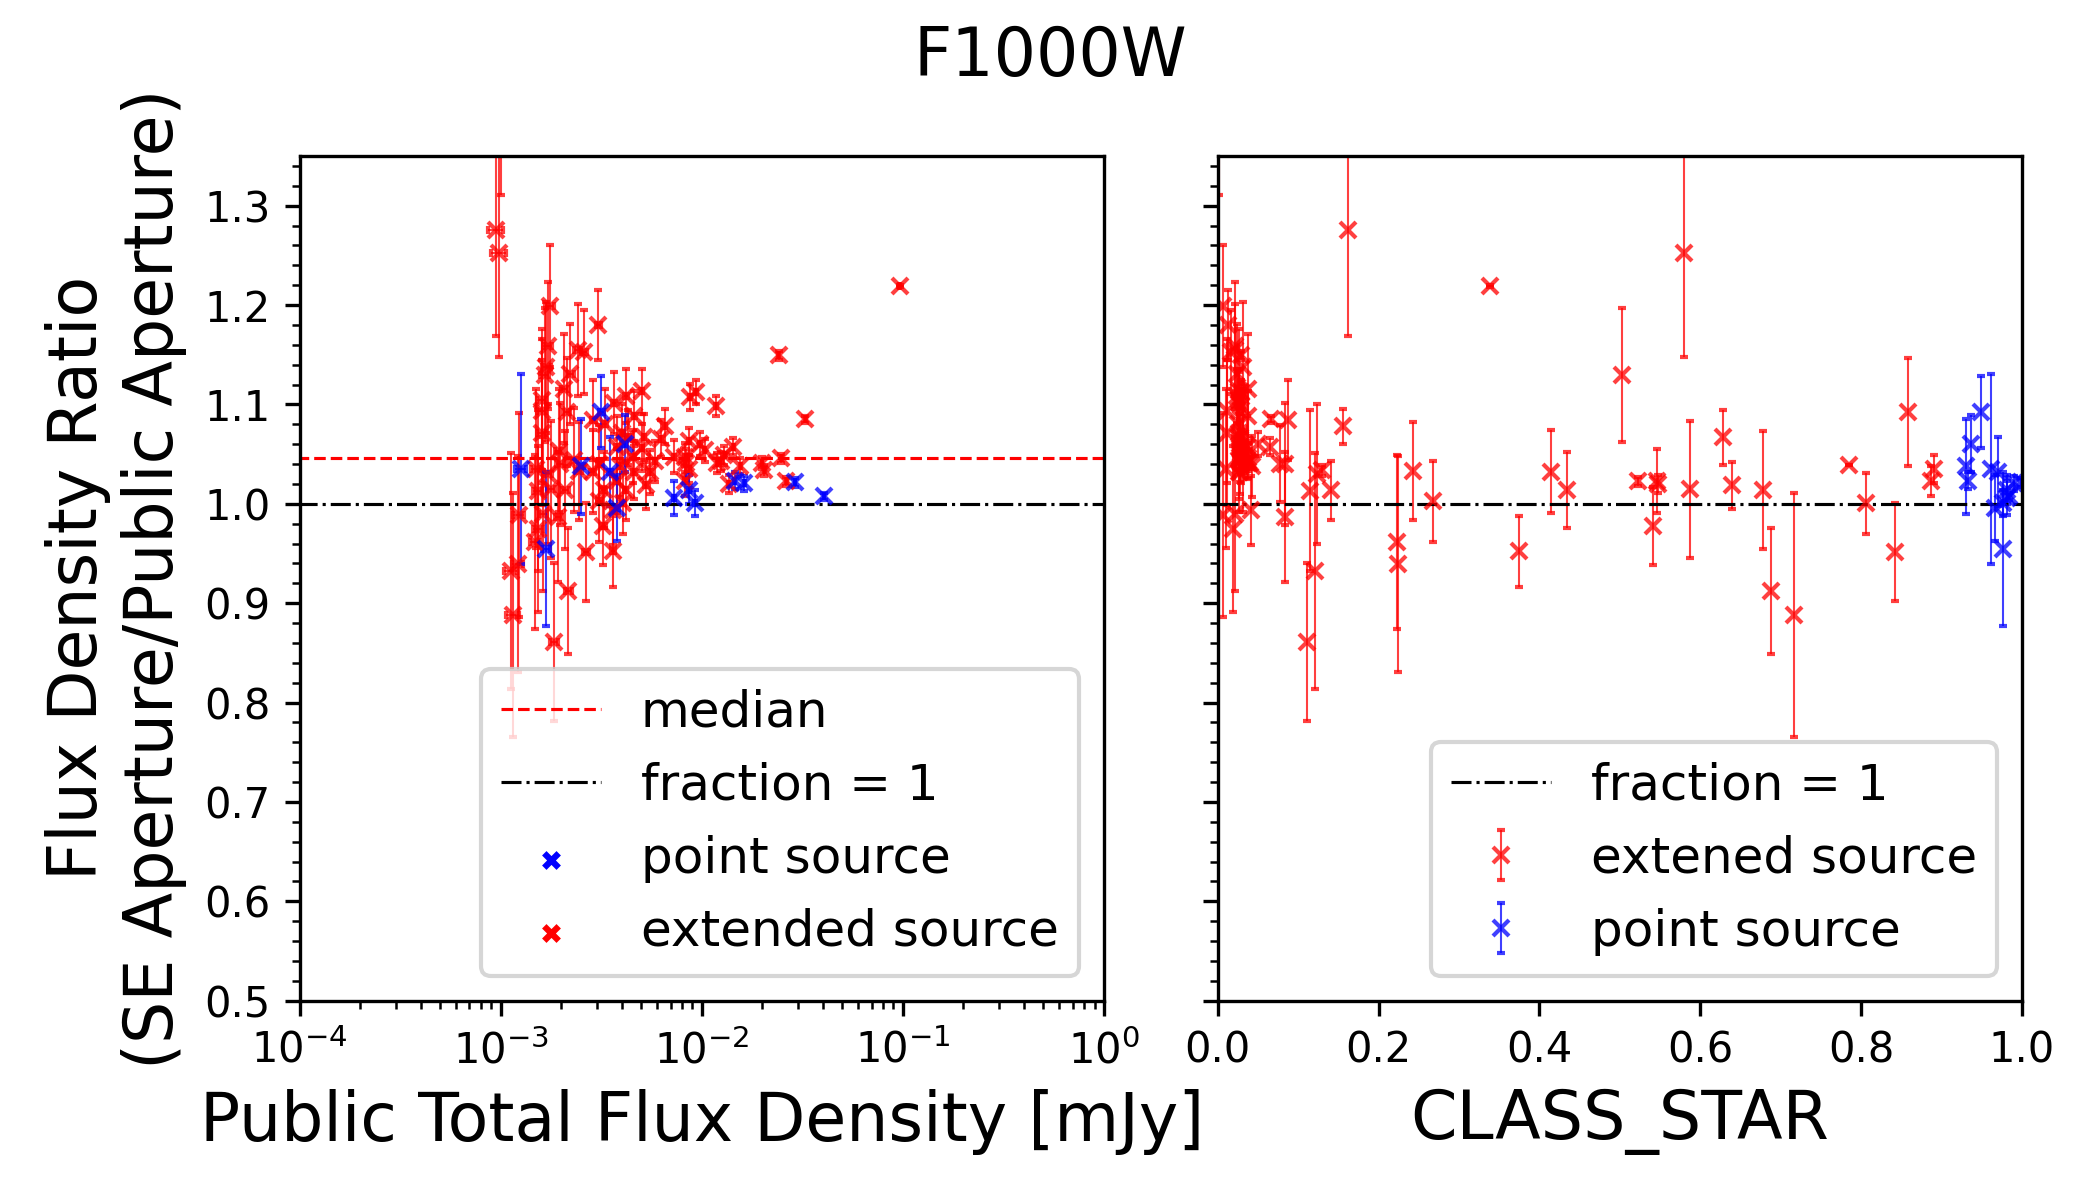
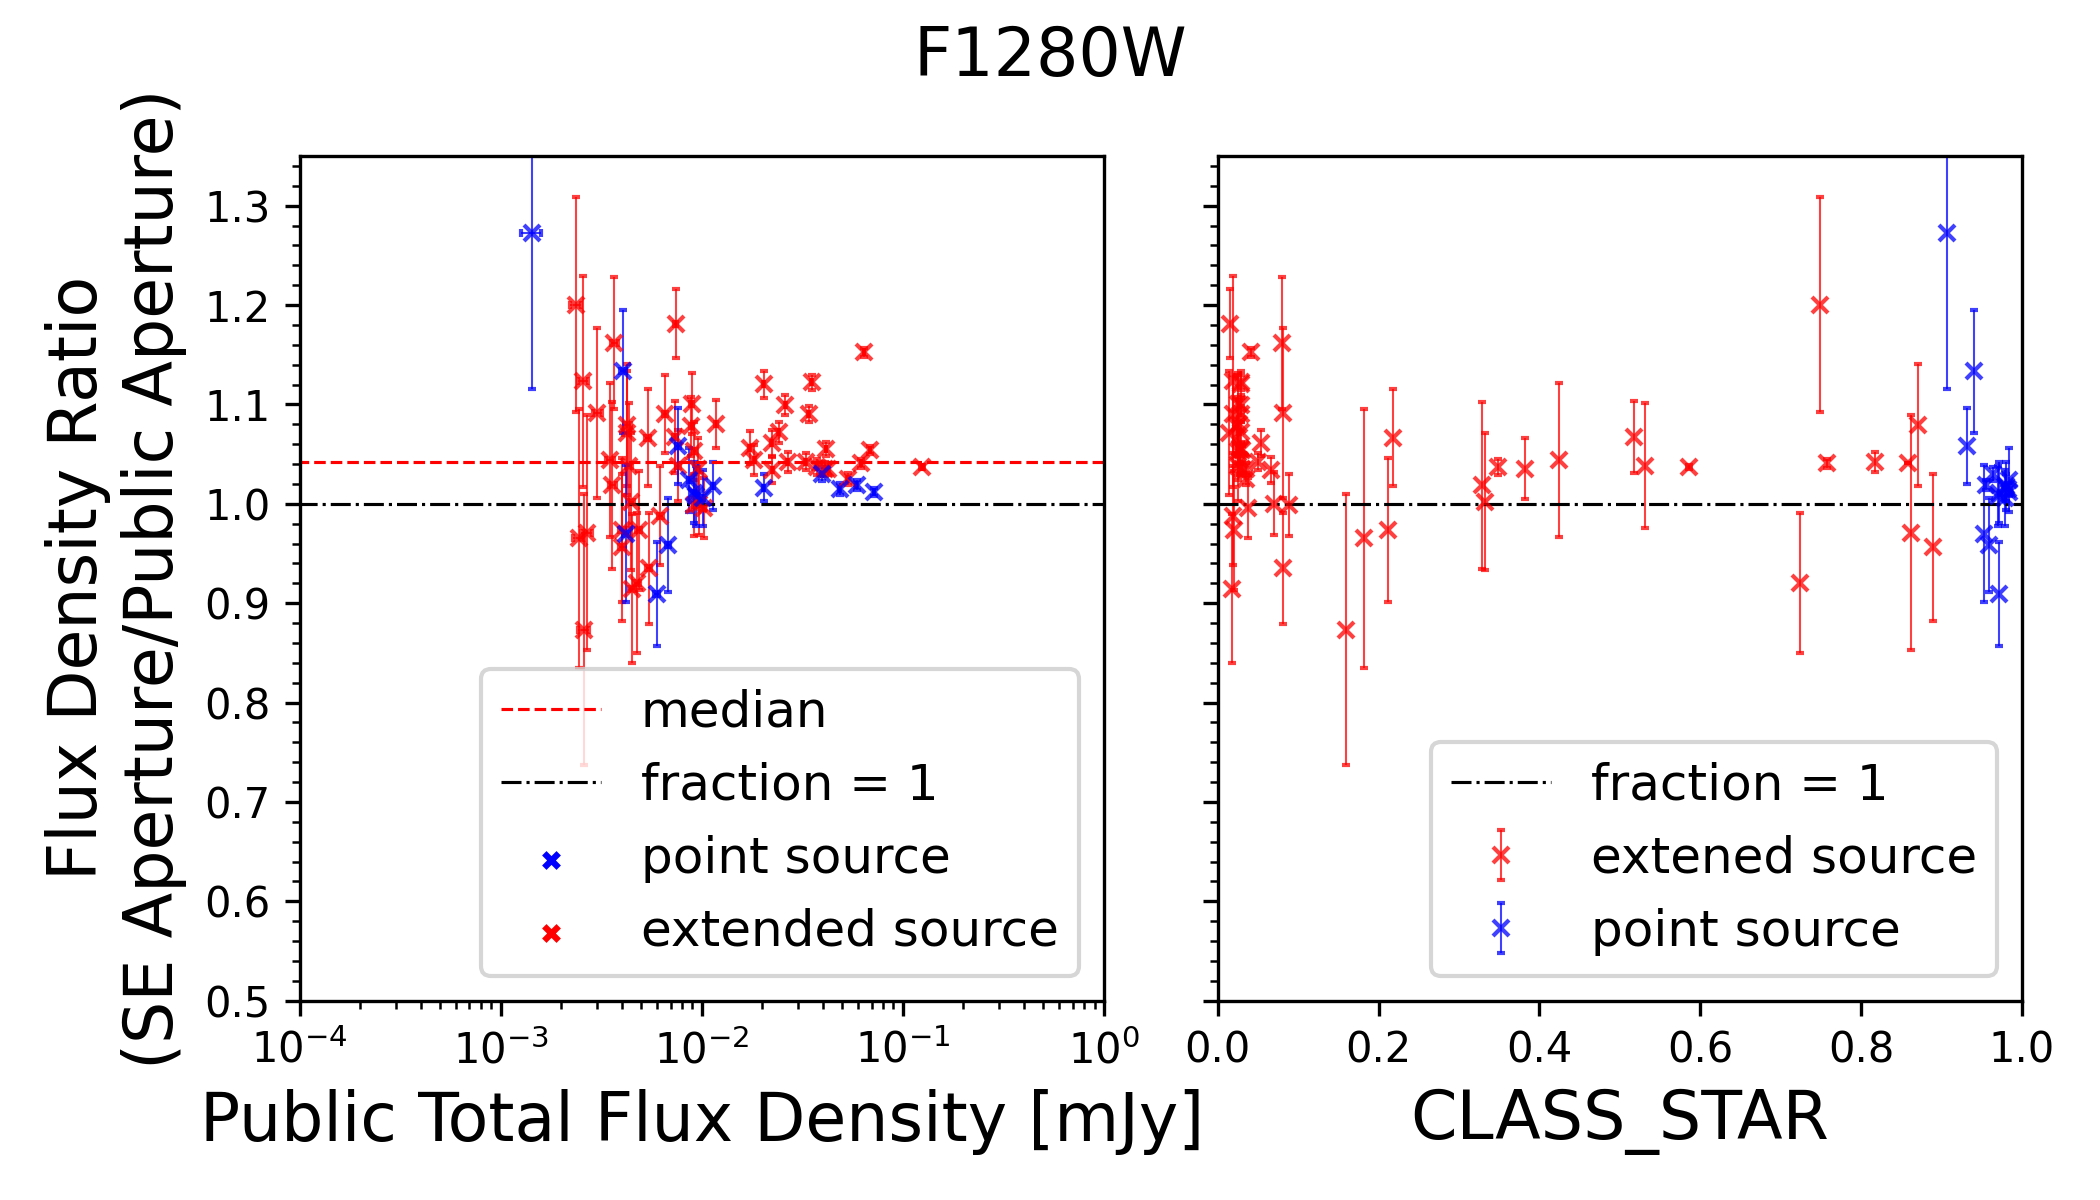
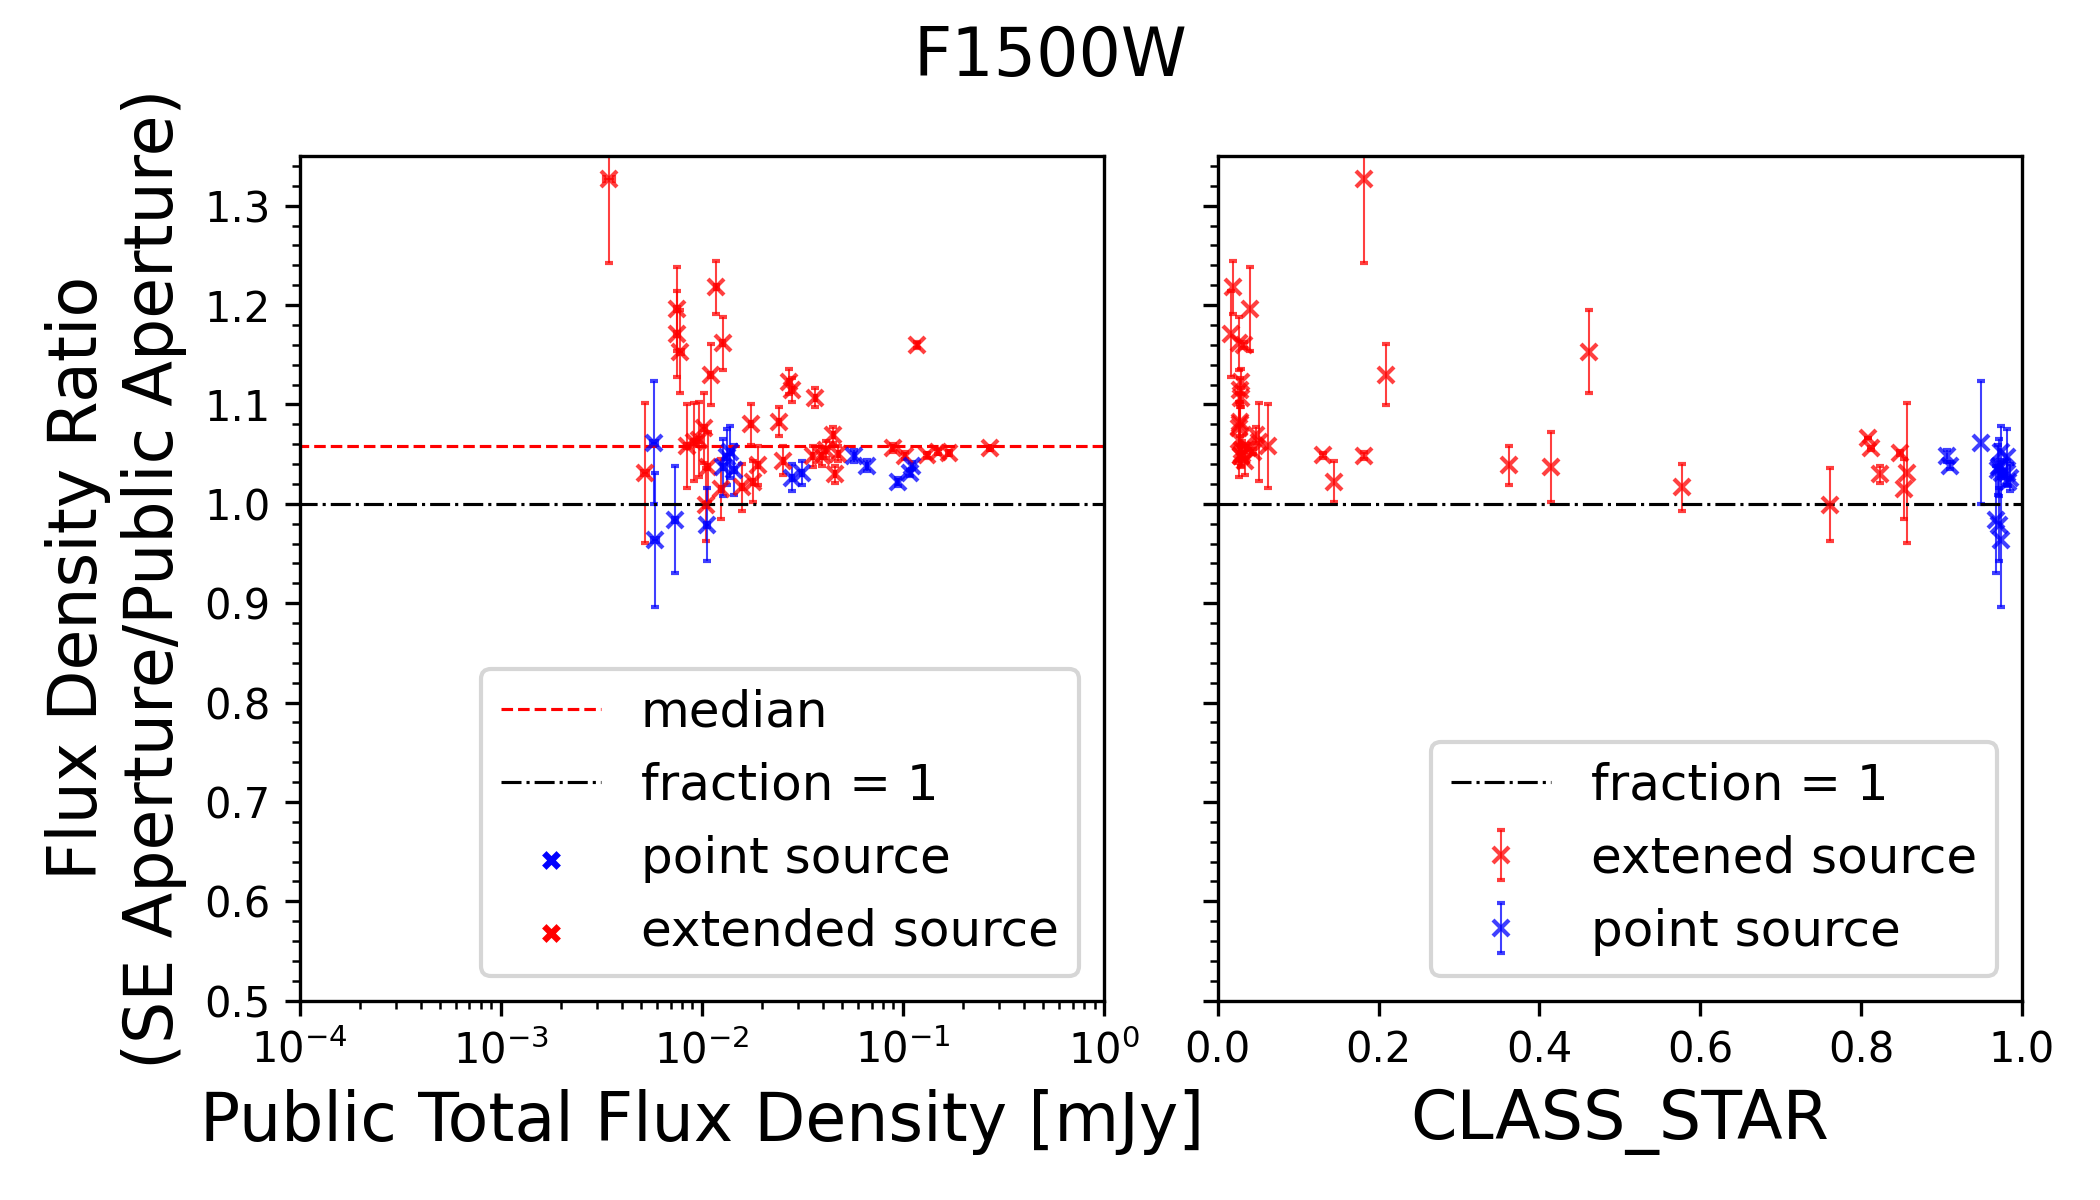
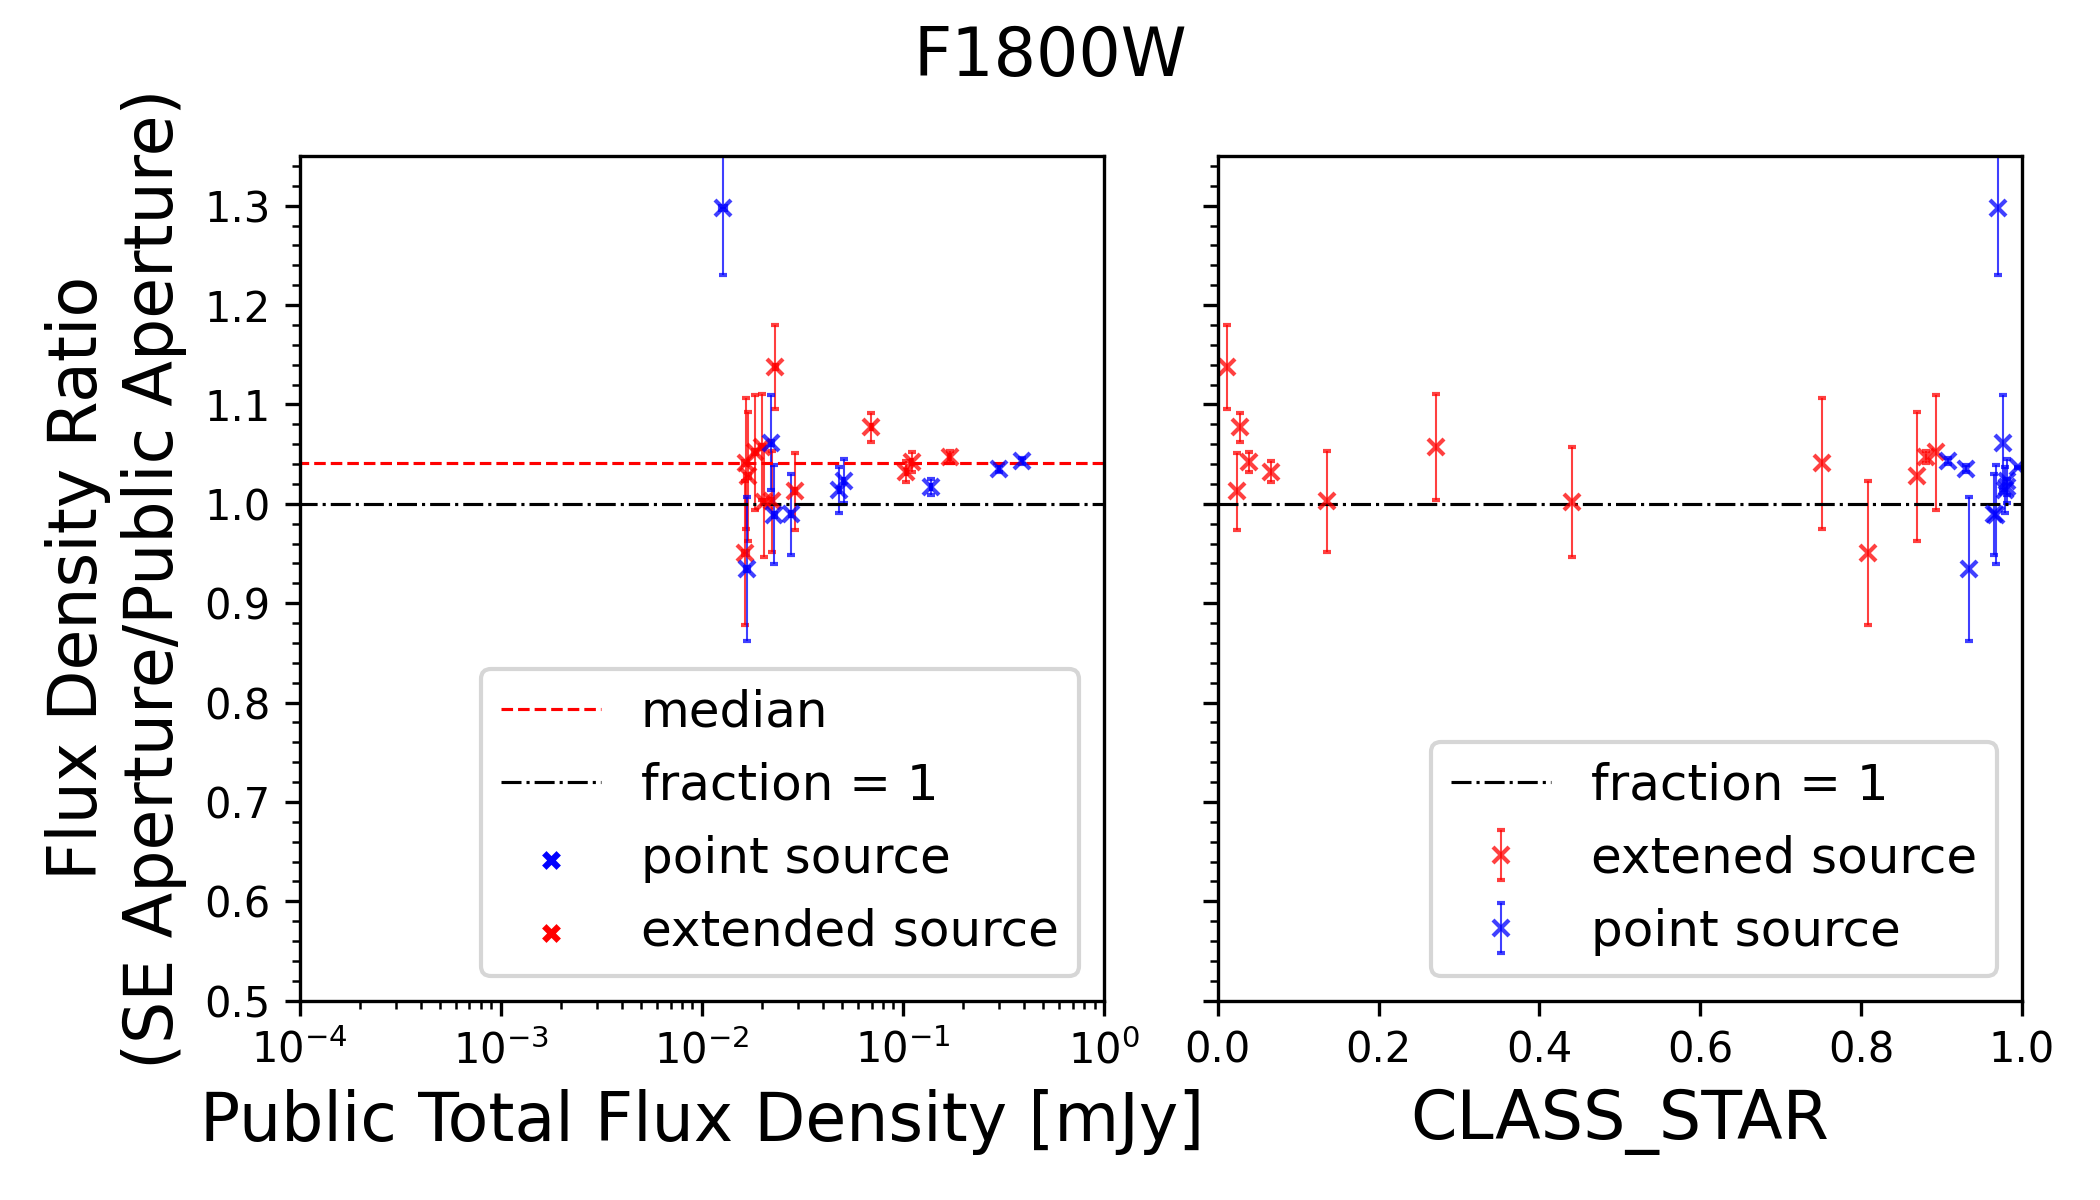
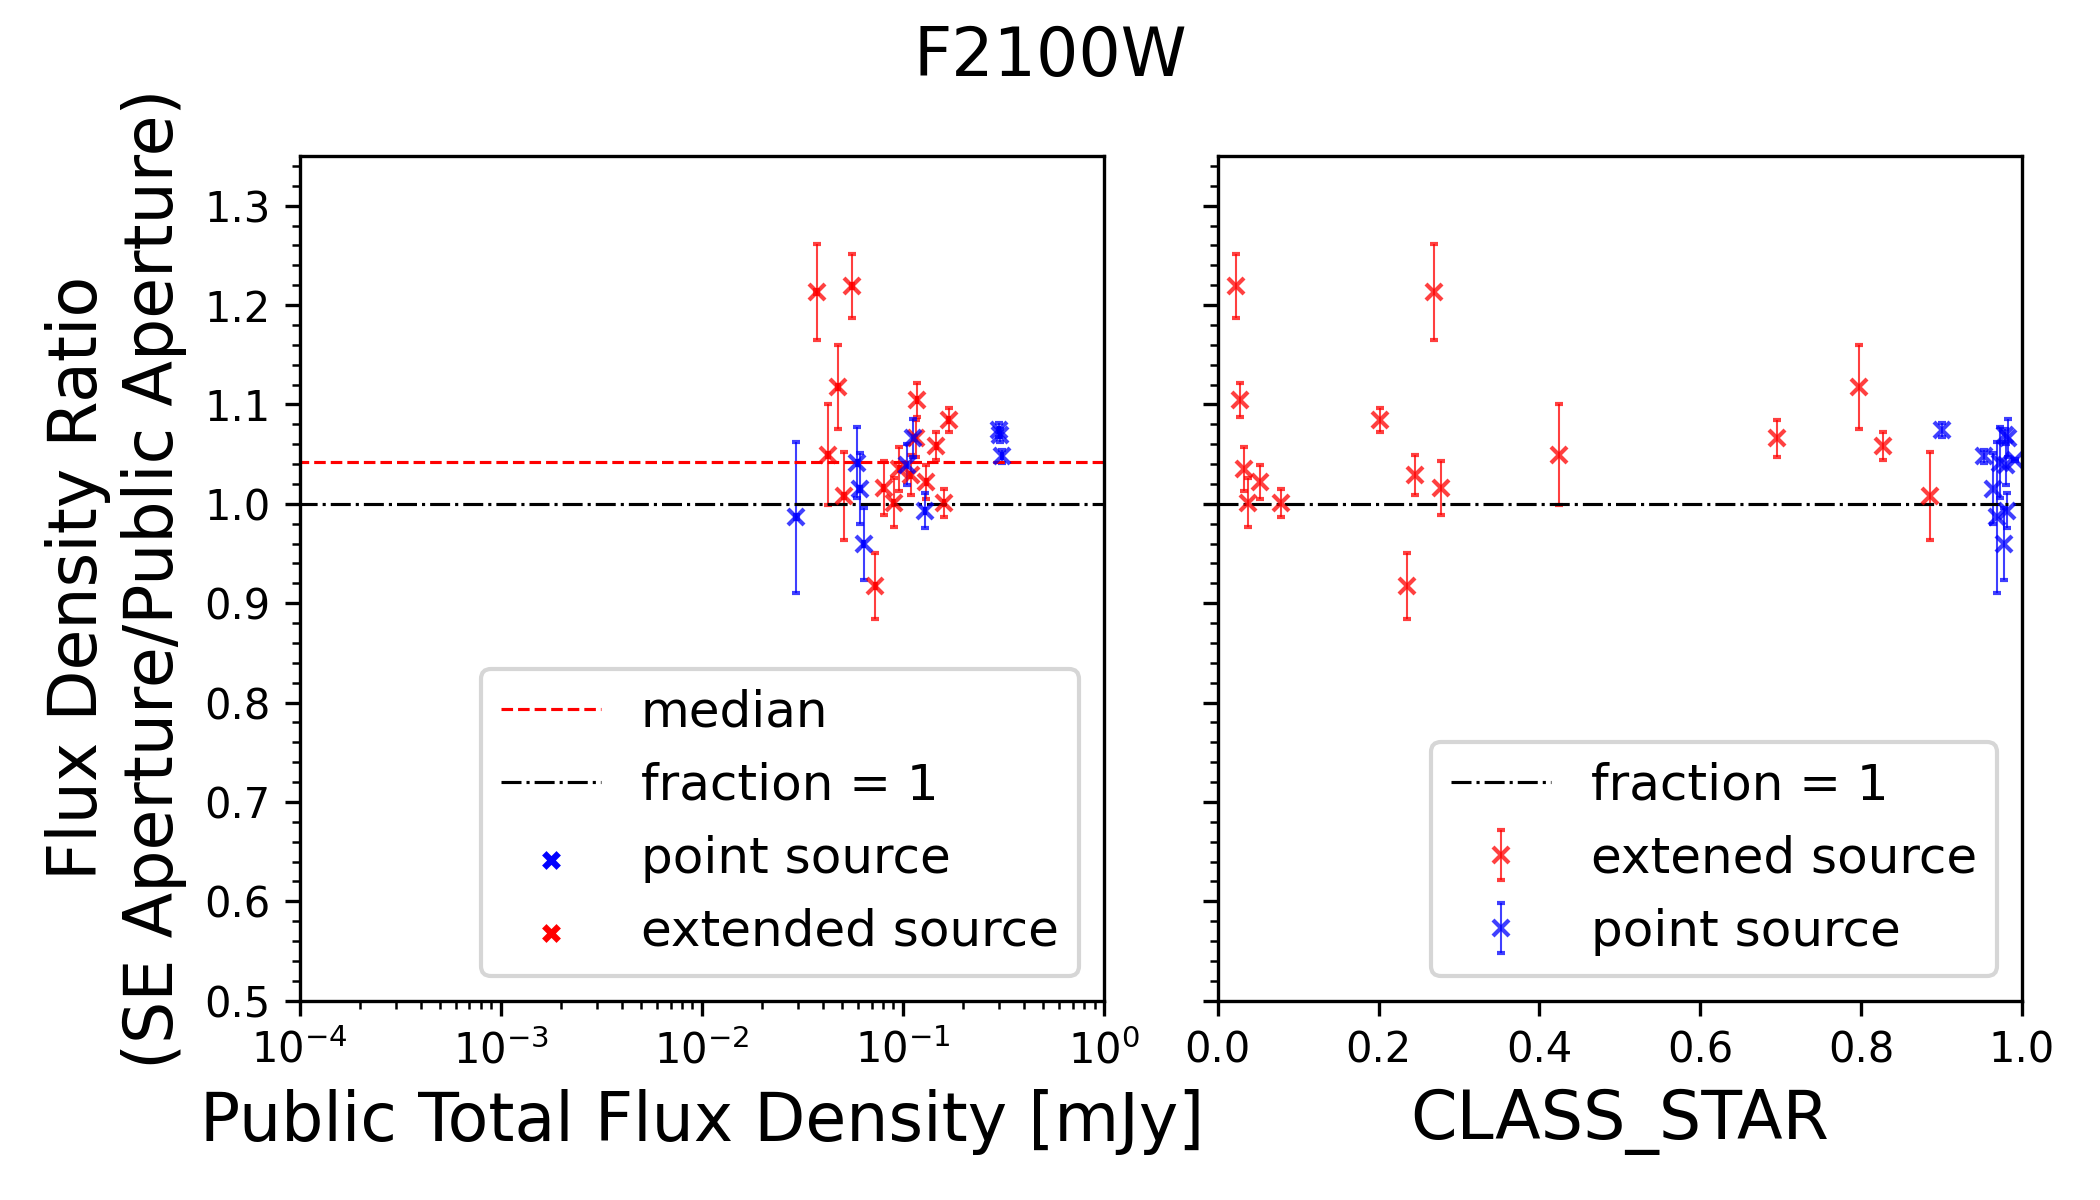
To illustrate the effectiveness of performing photometry with SE, we compared the aperture-corrected flux measurements obtained from the 70% enclosed energy apertures, which is used for the public catalog, with the total flux values provided in the public catalog (Fig. 2-7). The aperture sizes are documented in the JWST Calibration Reference Data System (CRDS 222https://jwst-crds.stsci.edu/). The flux ratio between our photometry and the public catalog is shown in the upper-left panel of Fig. 2-7. The resulting flux measurements have a median (horizontal dashed lines) that agrees well within 1.3%, 4.5%, 4.2%, 5.8%, 4.0%, 4.2% flux excess/loss in F770W, F1000W, F1280W, F1500W, F1800W, F2100W filters, respectively. The ratio begins to diverge as the fluxes approach the detection limit, that is, the 1-sigma deviation is smaller for the brighter sources. In the upper-right panel, we plot the flux ratio as a function of the CLASSSTAR parameter derived by SE, where the extended sources are selected by CLASSSTAR 0.9, and the remaining sources are considered as point sources. With 70% enclosed energy aperture photometry, the majority of the samples show no clear deviation from the public catalog for either extended or point sources.
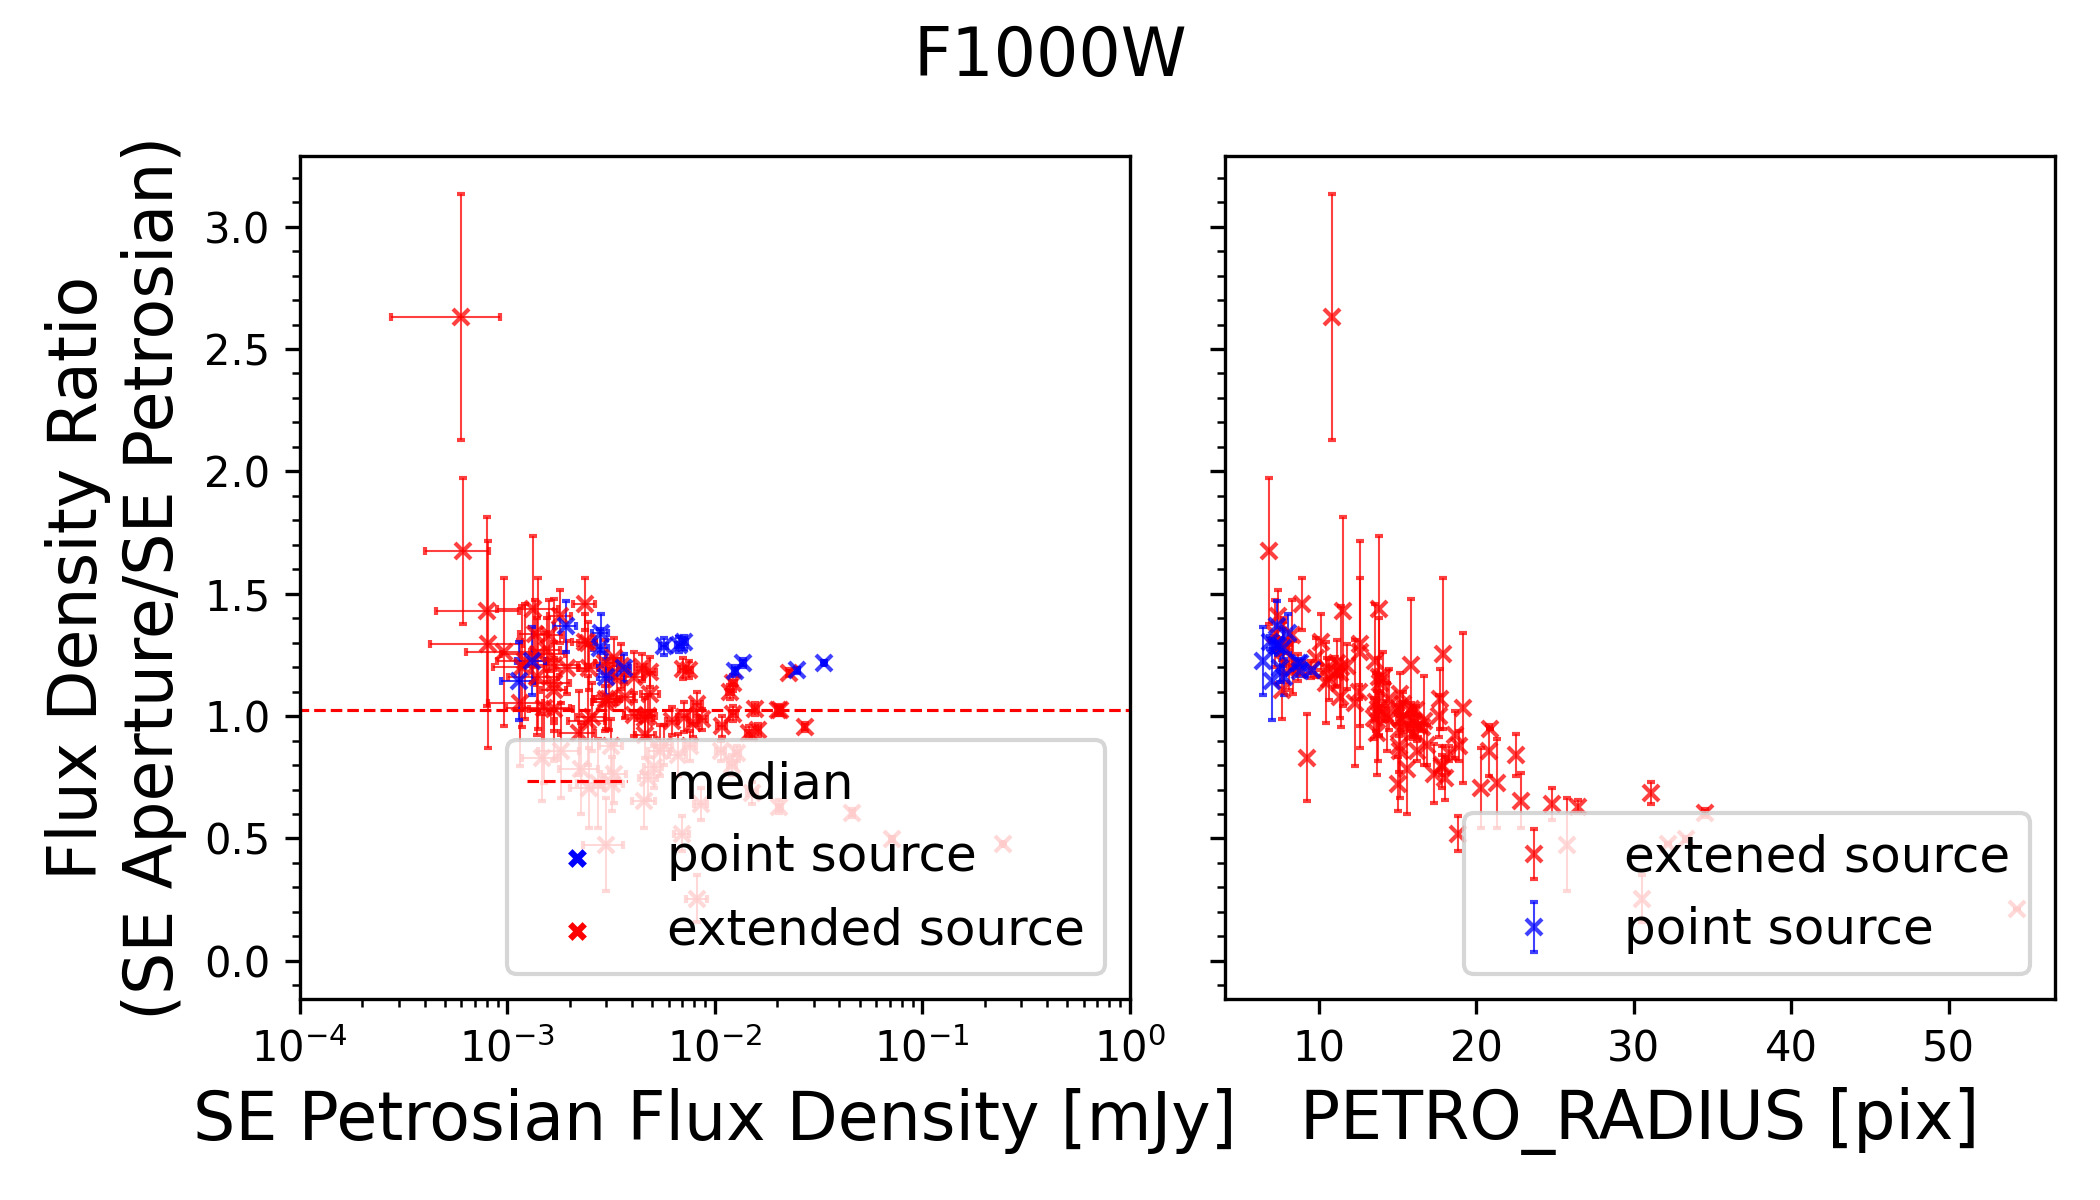
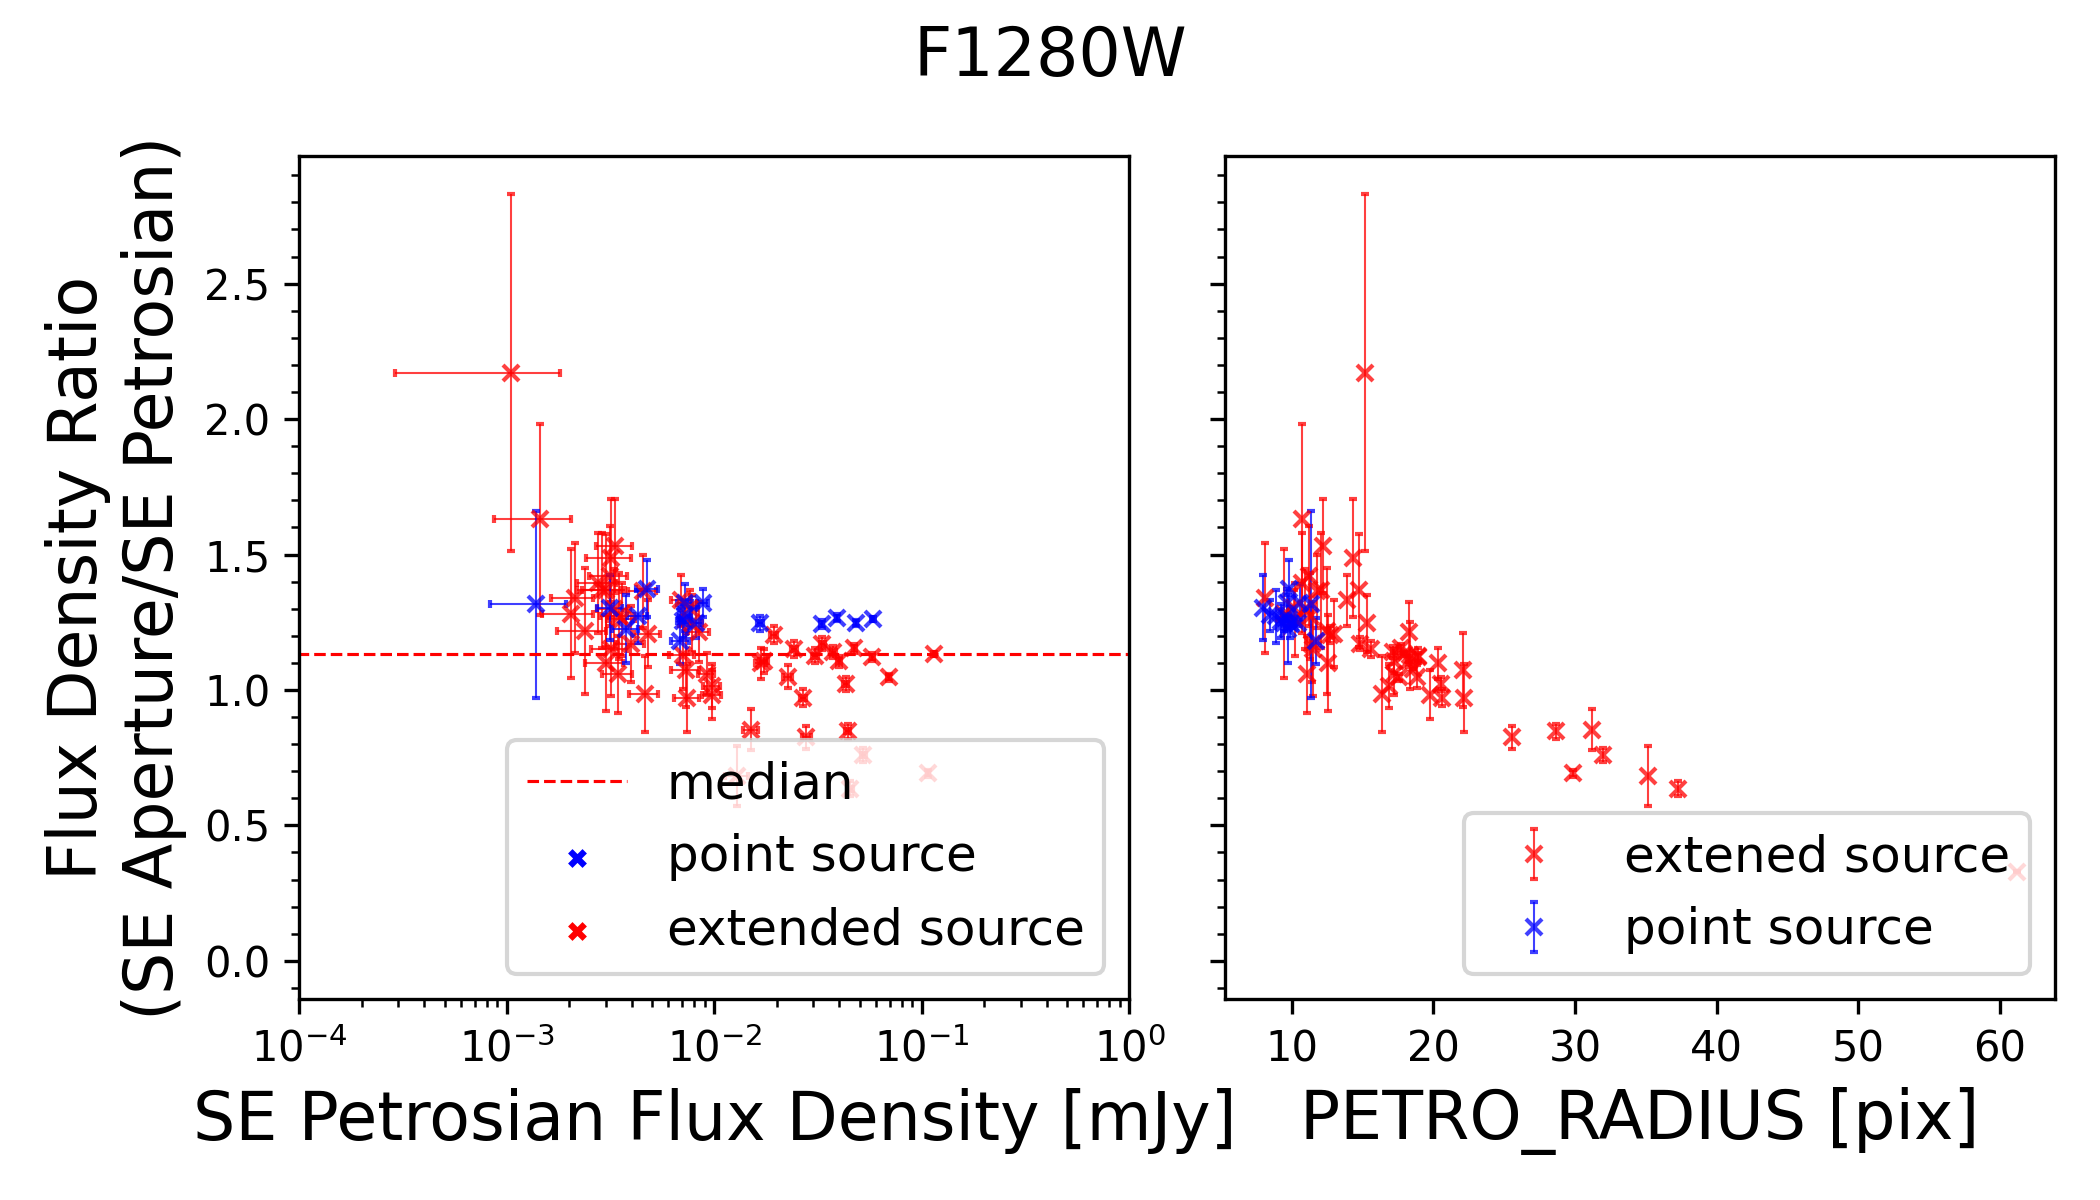
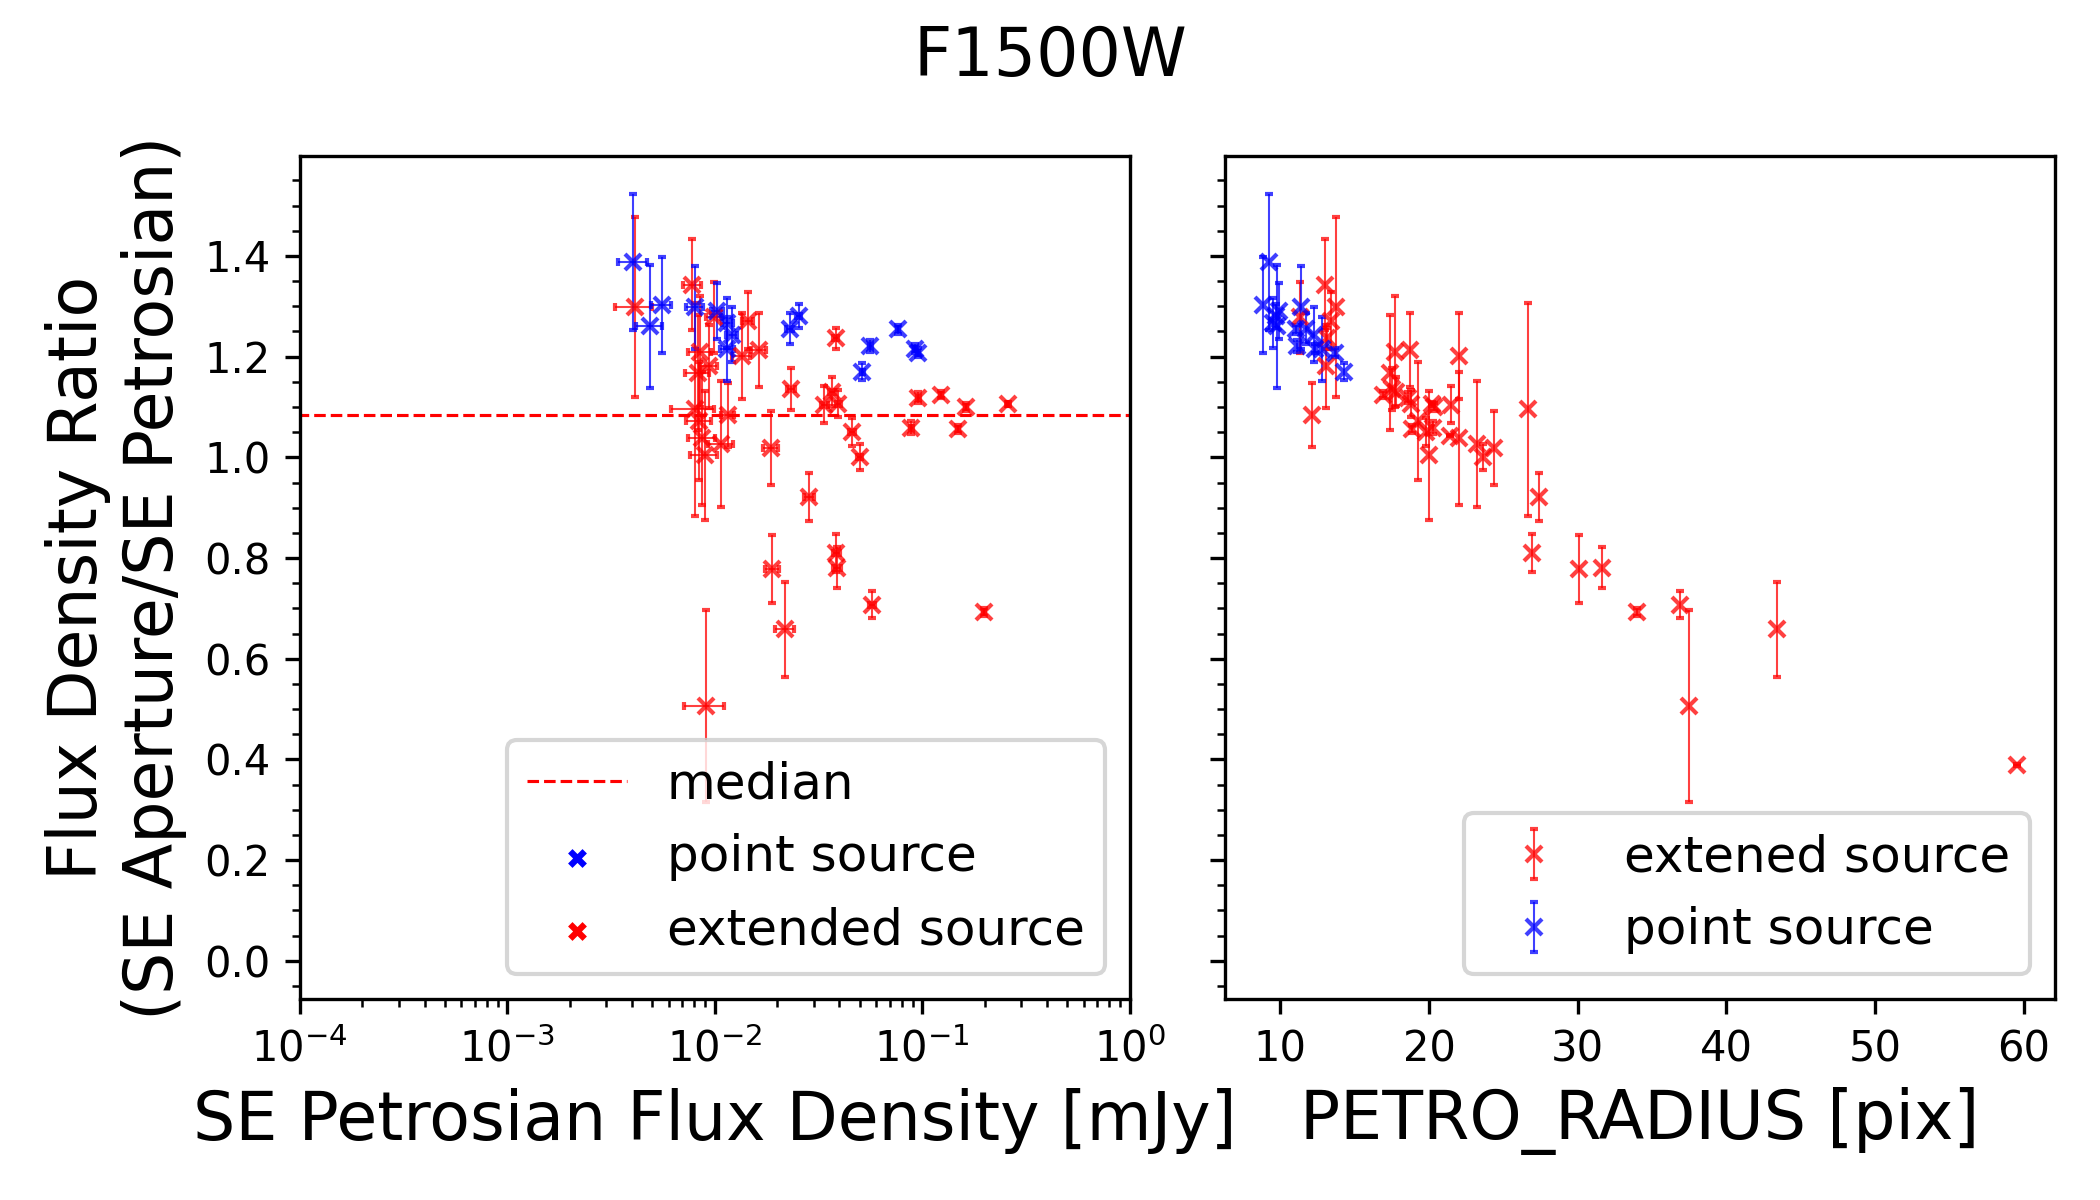
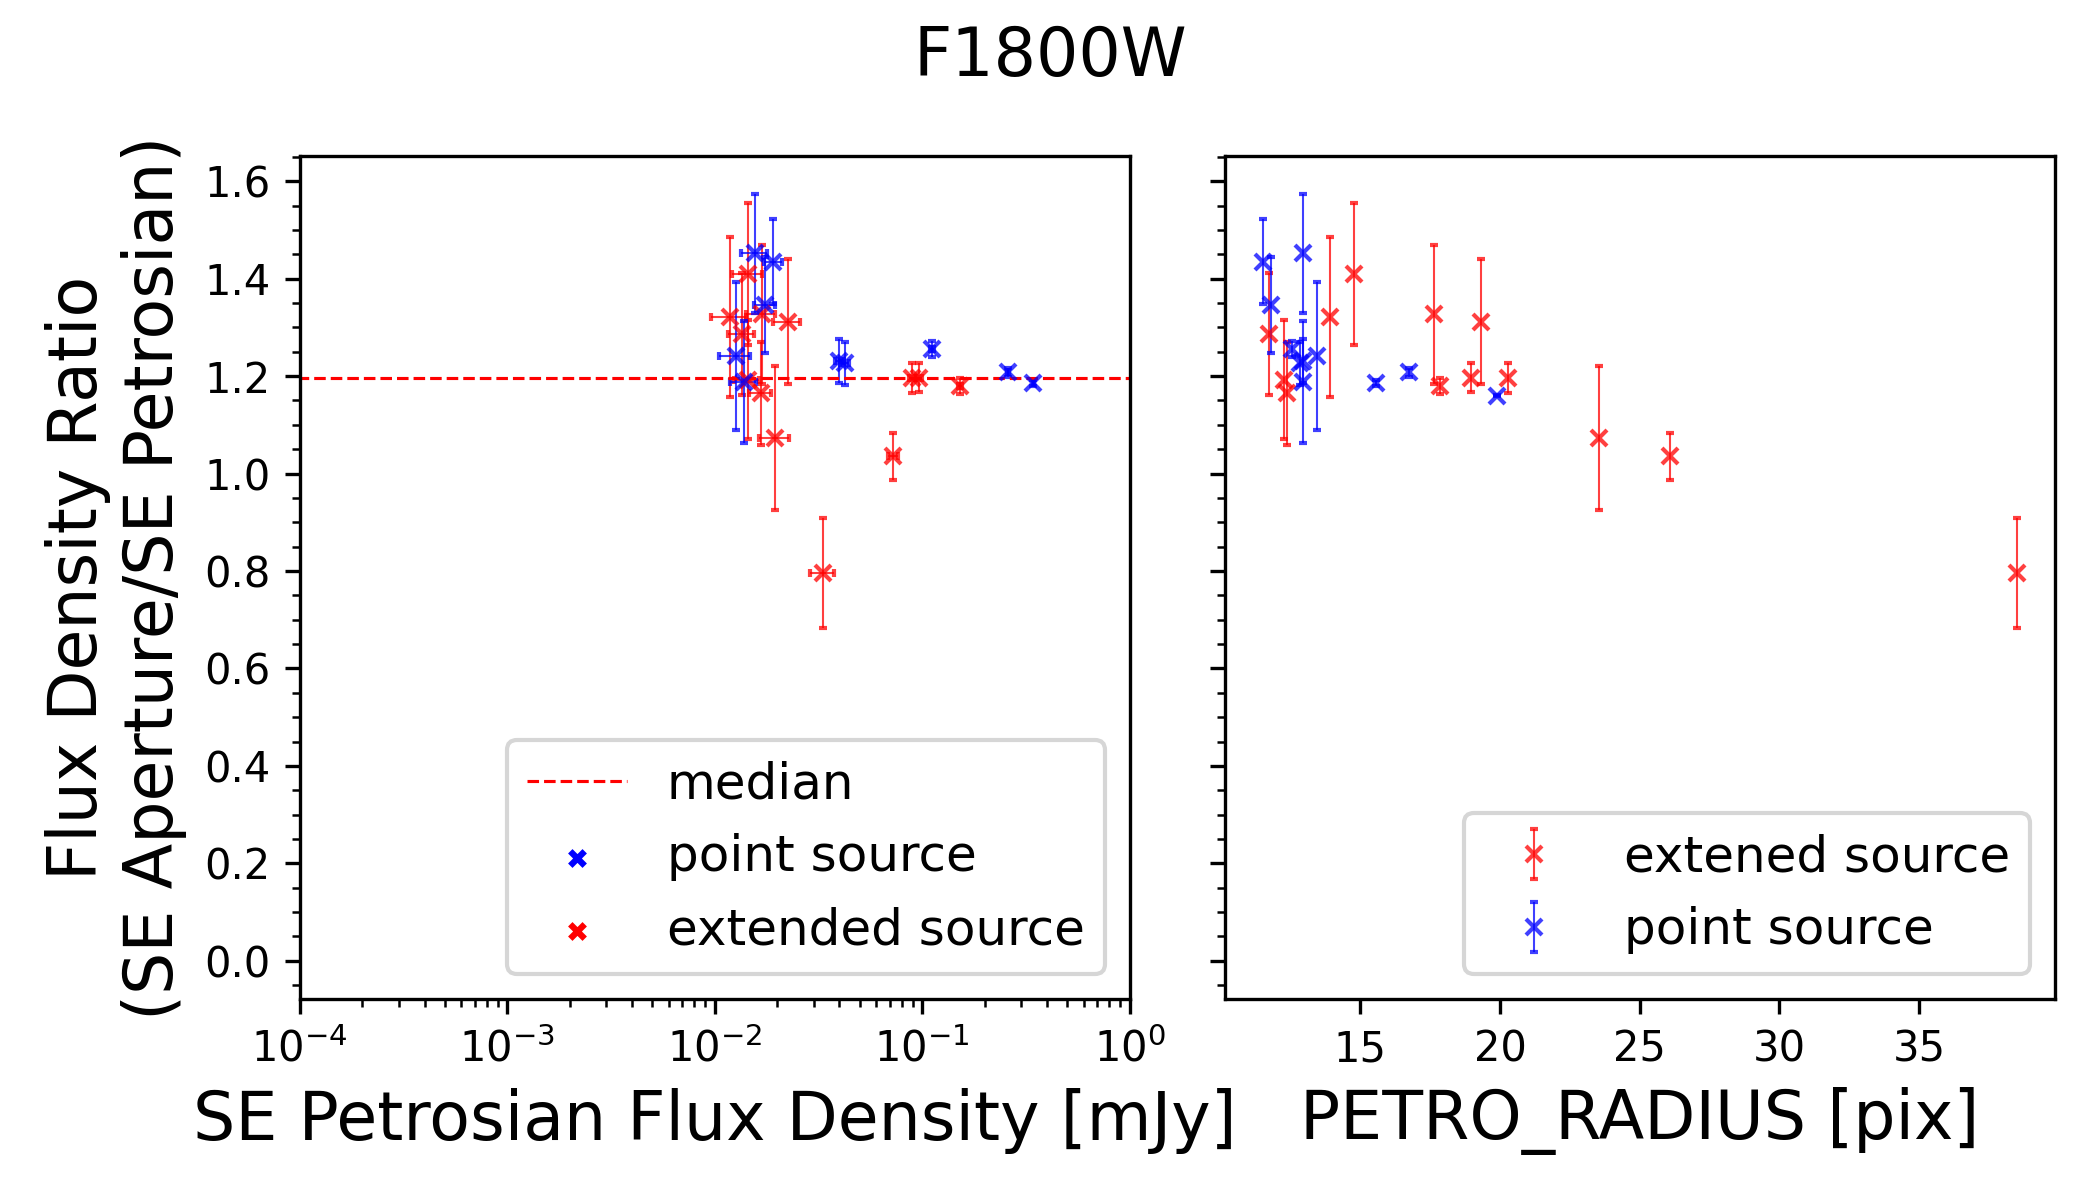
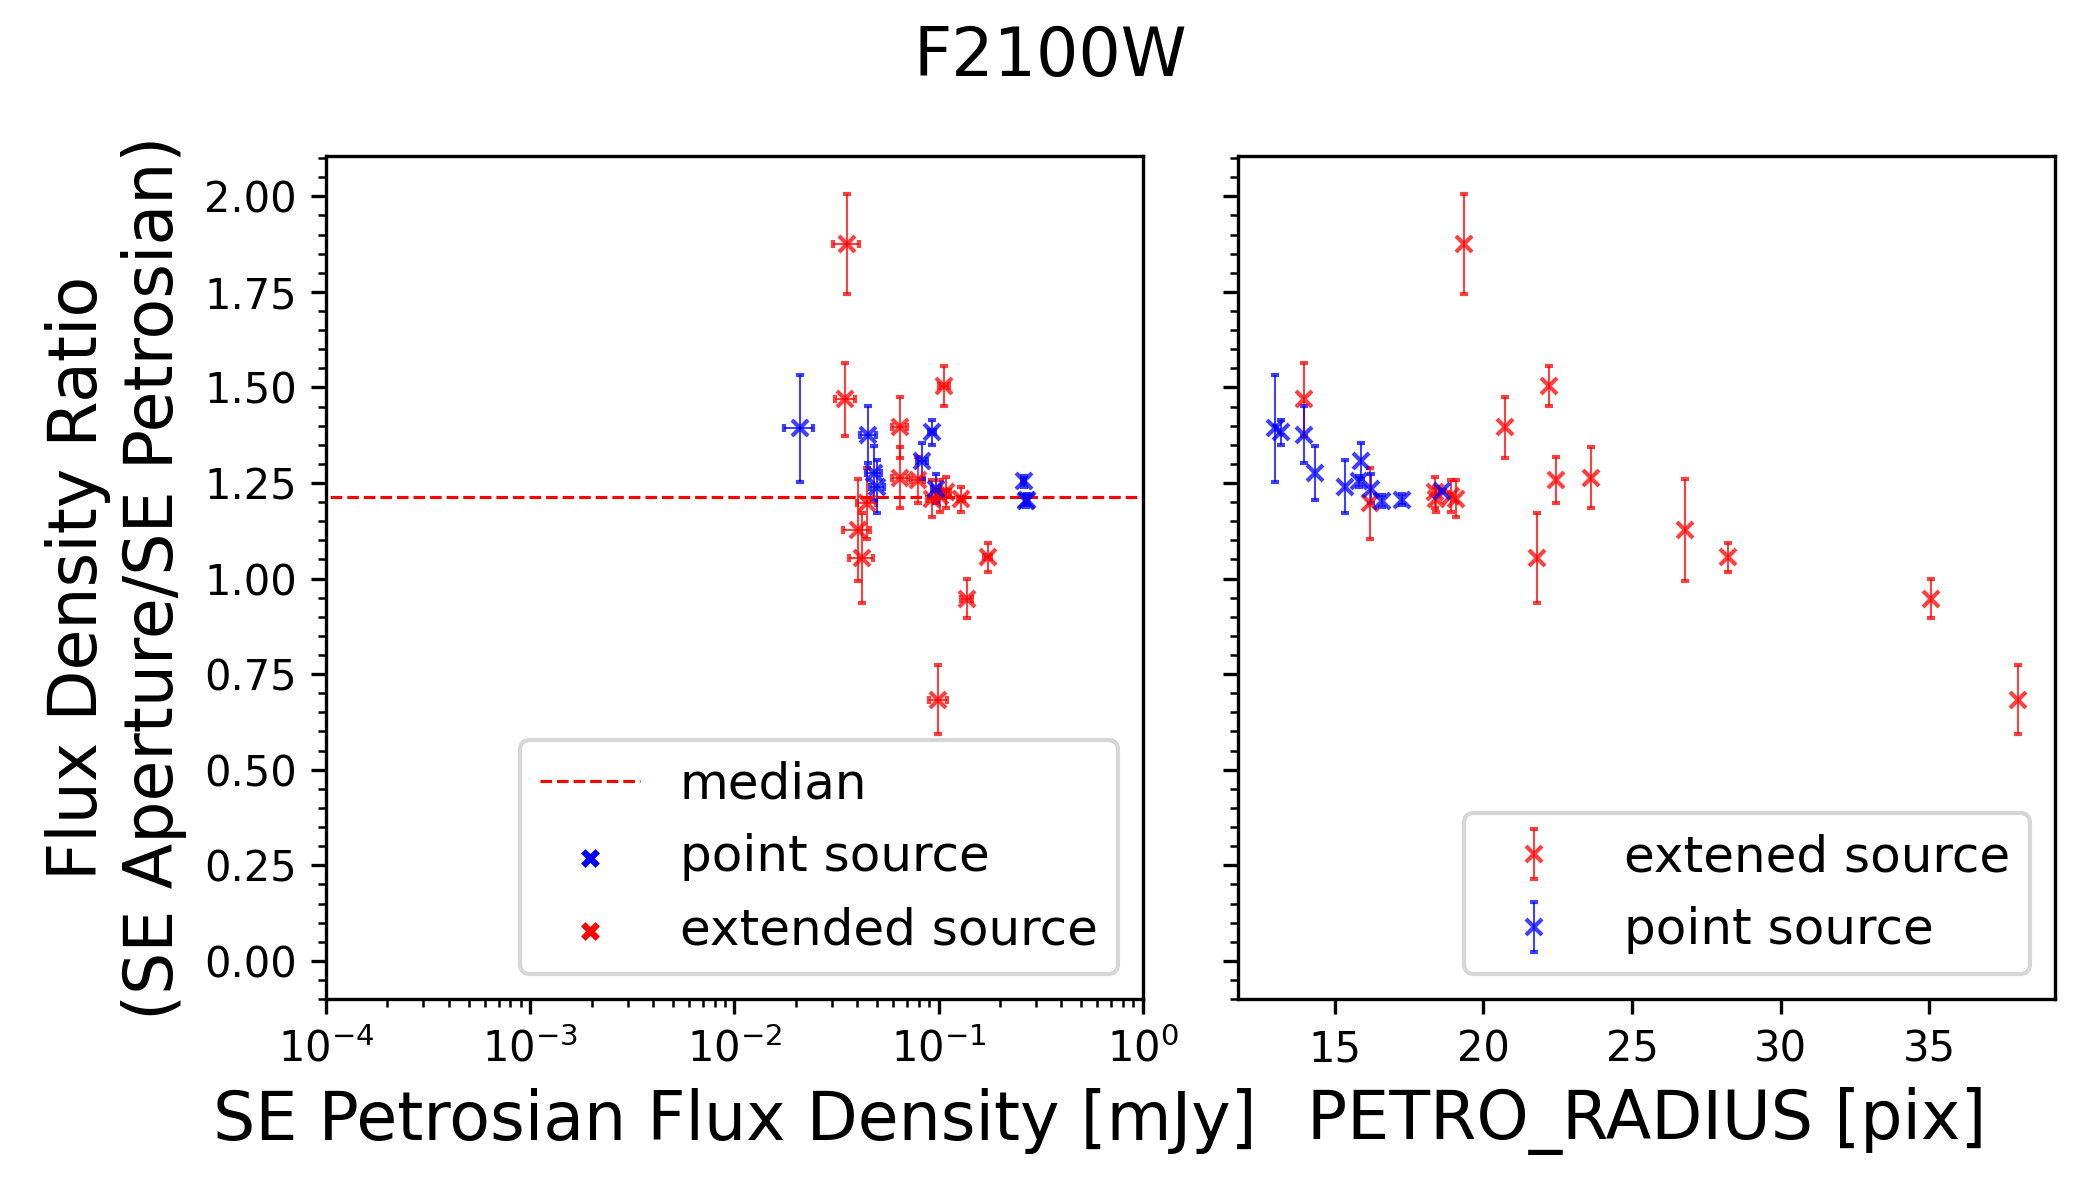
Nevertheless, the fixed aperture size may be too small to recover all the flux for some spatially extended sources, since both SE and Photoutils use the same fixed aperture size. To investigate this further, in the lower left panel we compare the fixed aperture flux with the Petrosian flux, also measured by SE, which uses an adaptive aperture. The lower value on the y-axis indicates that the fixed aperture photometry underestimates the fluxes. In addition, the bottom-right panel shows the ratio between the Petrosian radius and the flux ratio between the two photometry methods, as the Petrosian aperture includes more flux for extended sources. The flux ratio between the fixed aperture and Petrosian decreases with increasing source size (PETRORADIUS), also indicating that the aperture size is inadequate for extended sources. To avoid the loss of flux from extended sources, we decided to use the Petrosian aperture measured with SE for further analysis throughout this paper.
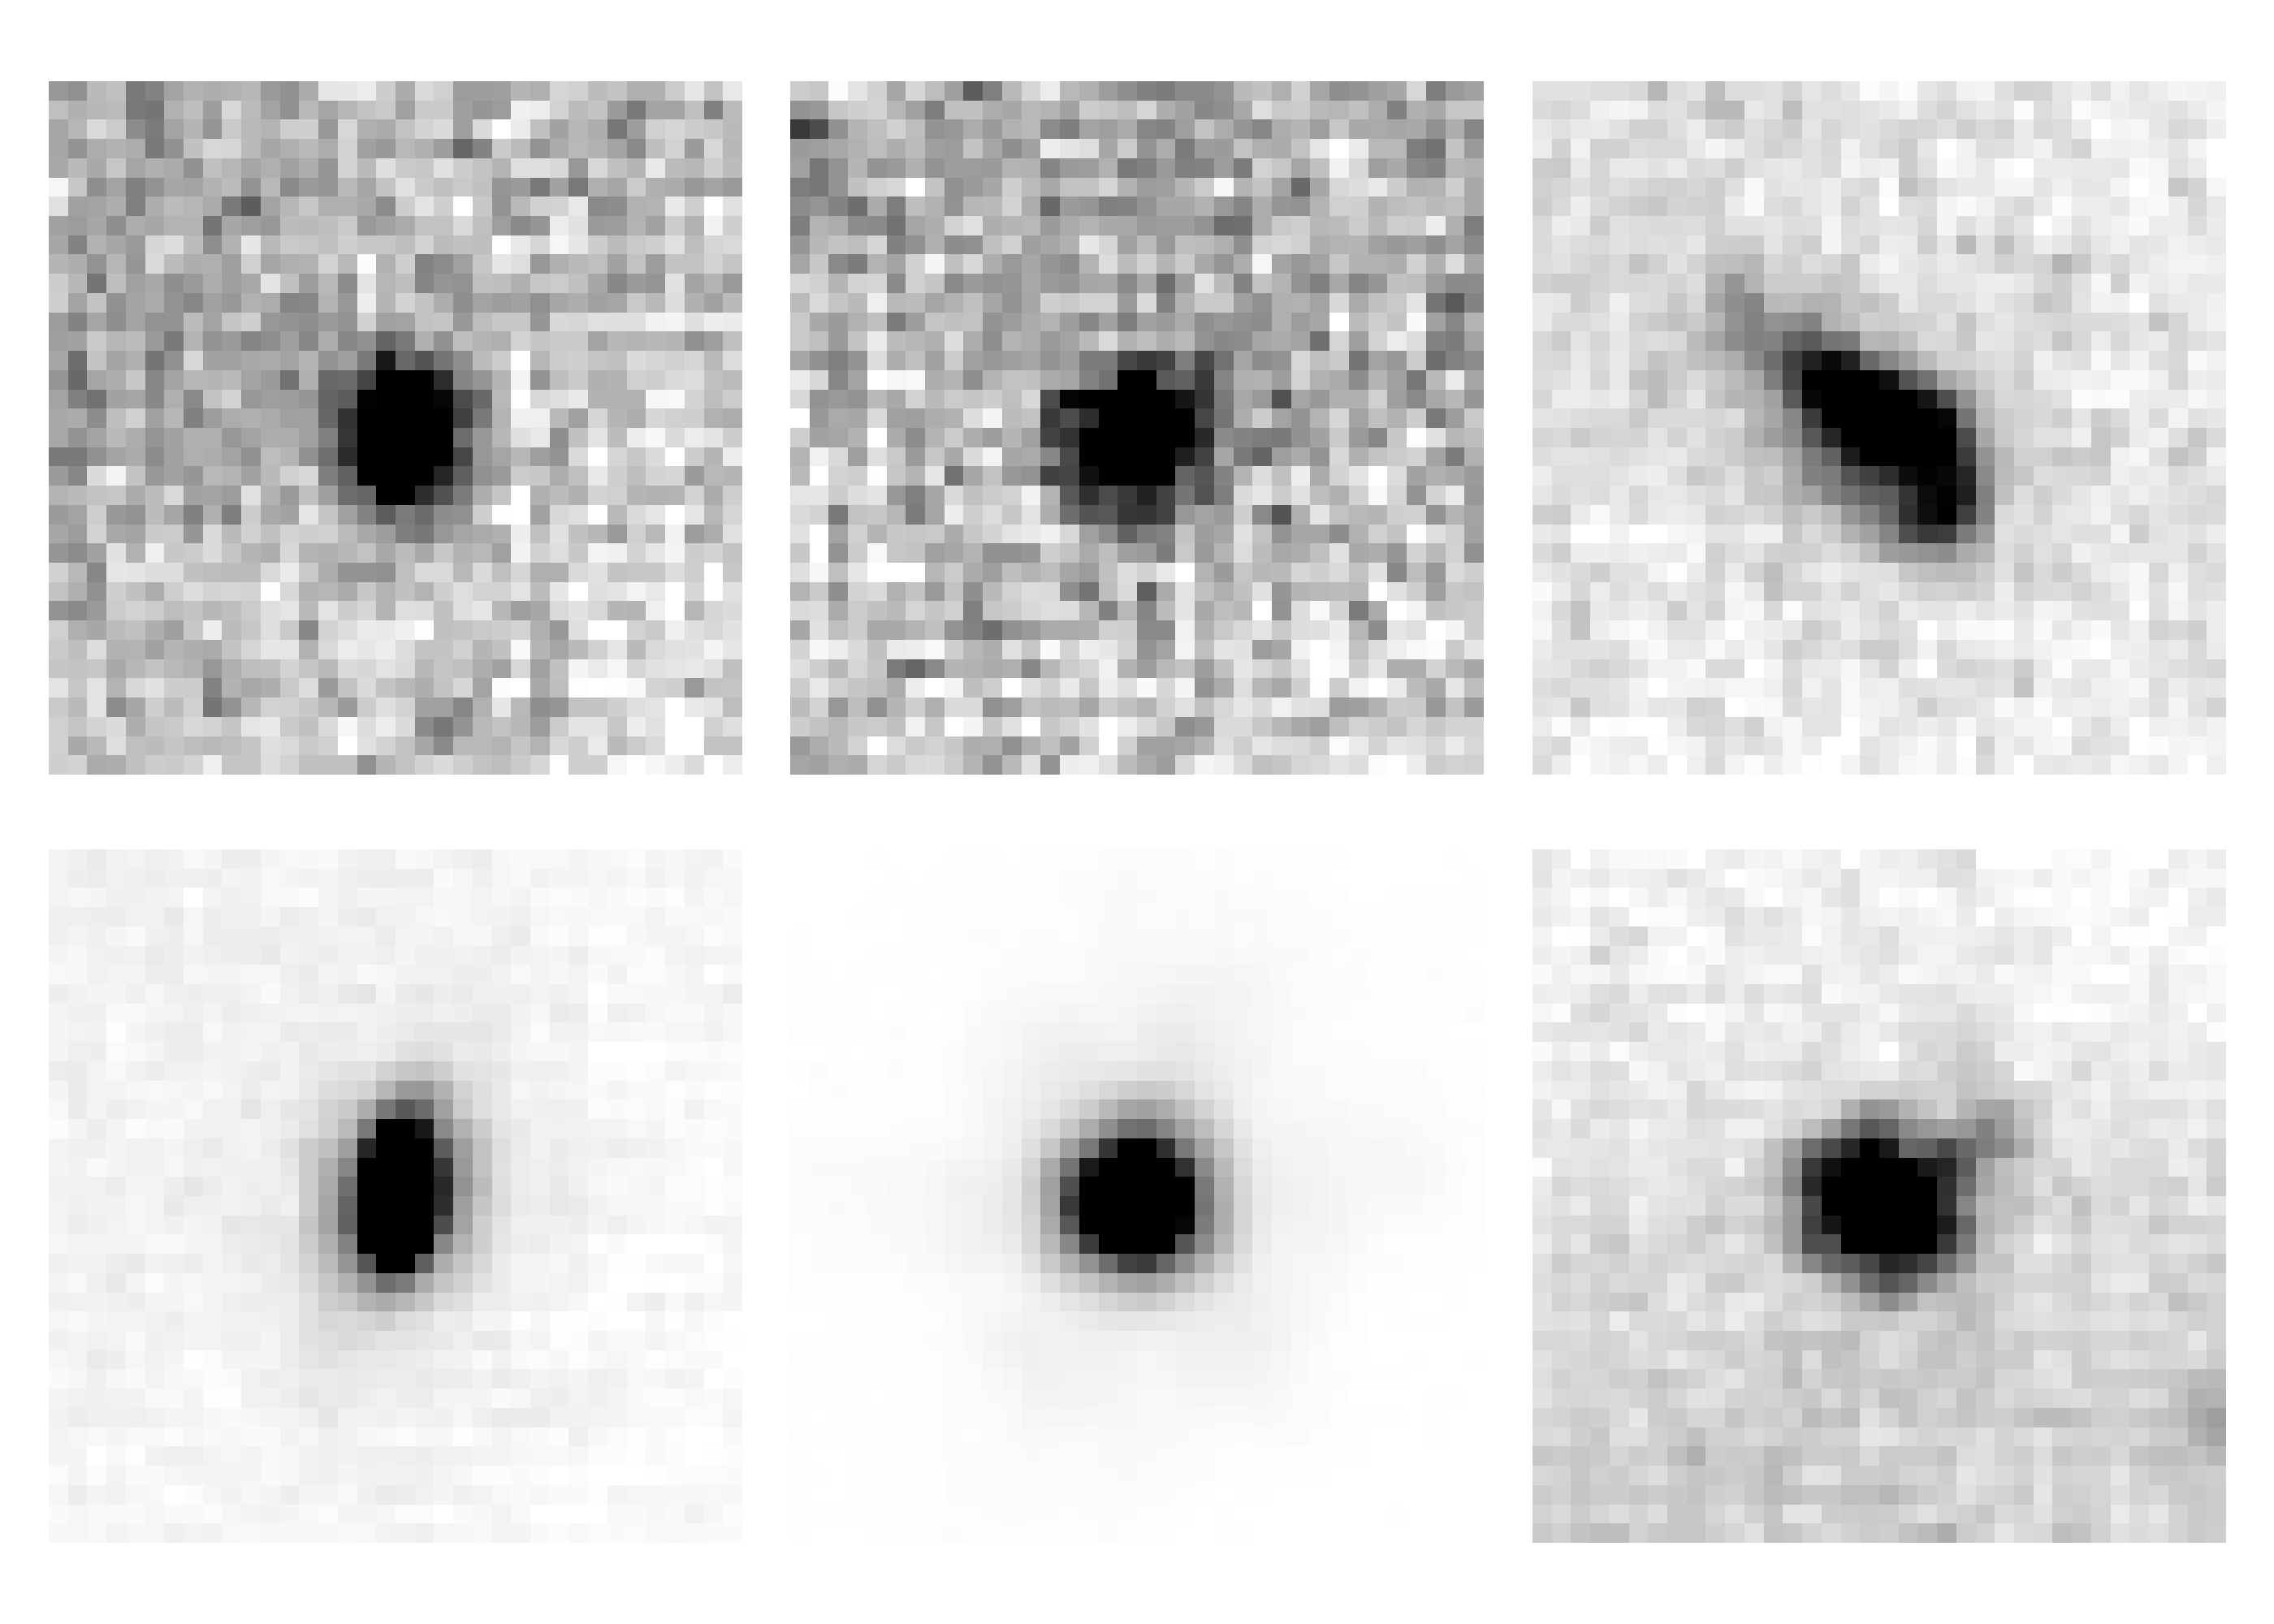
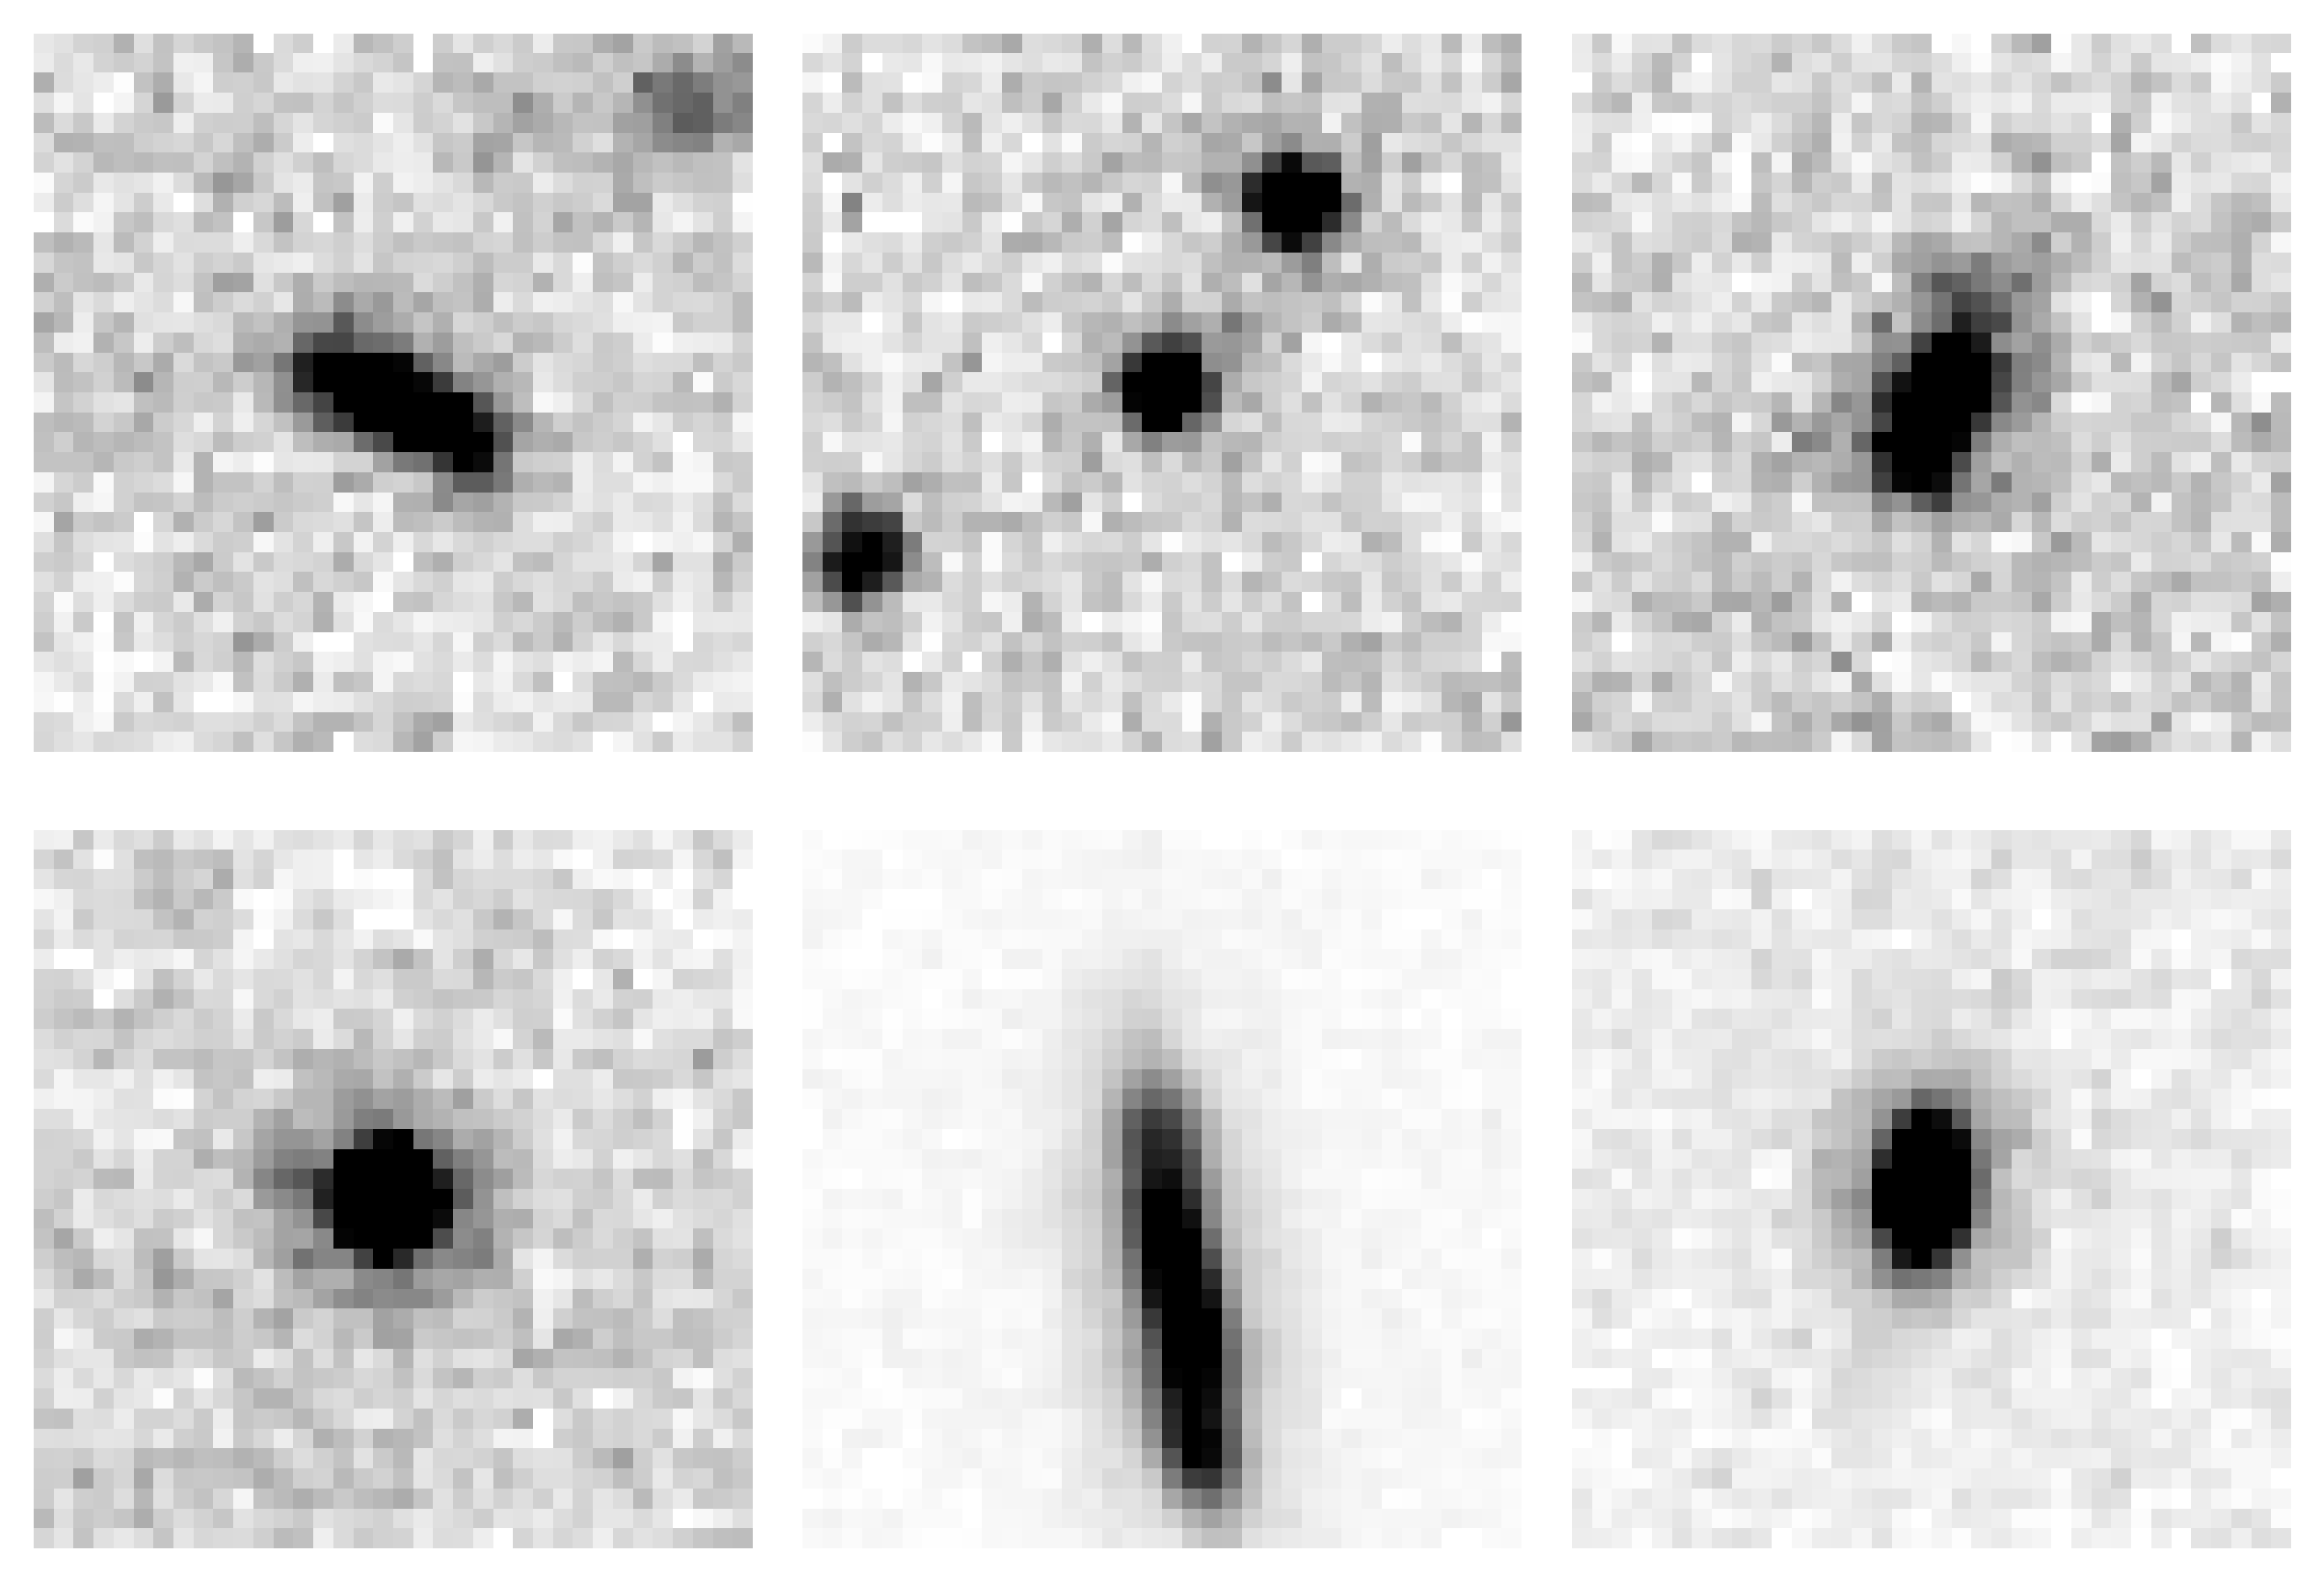
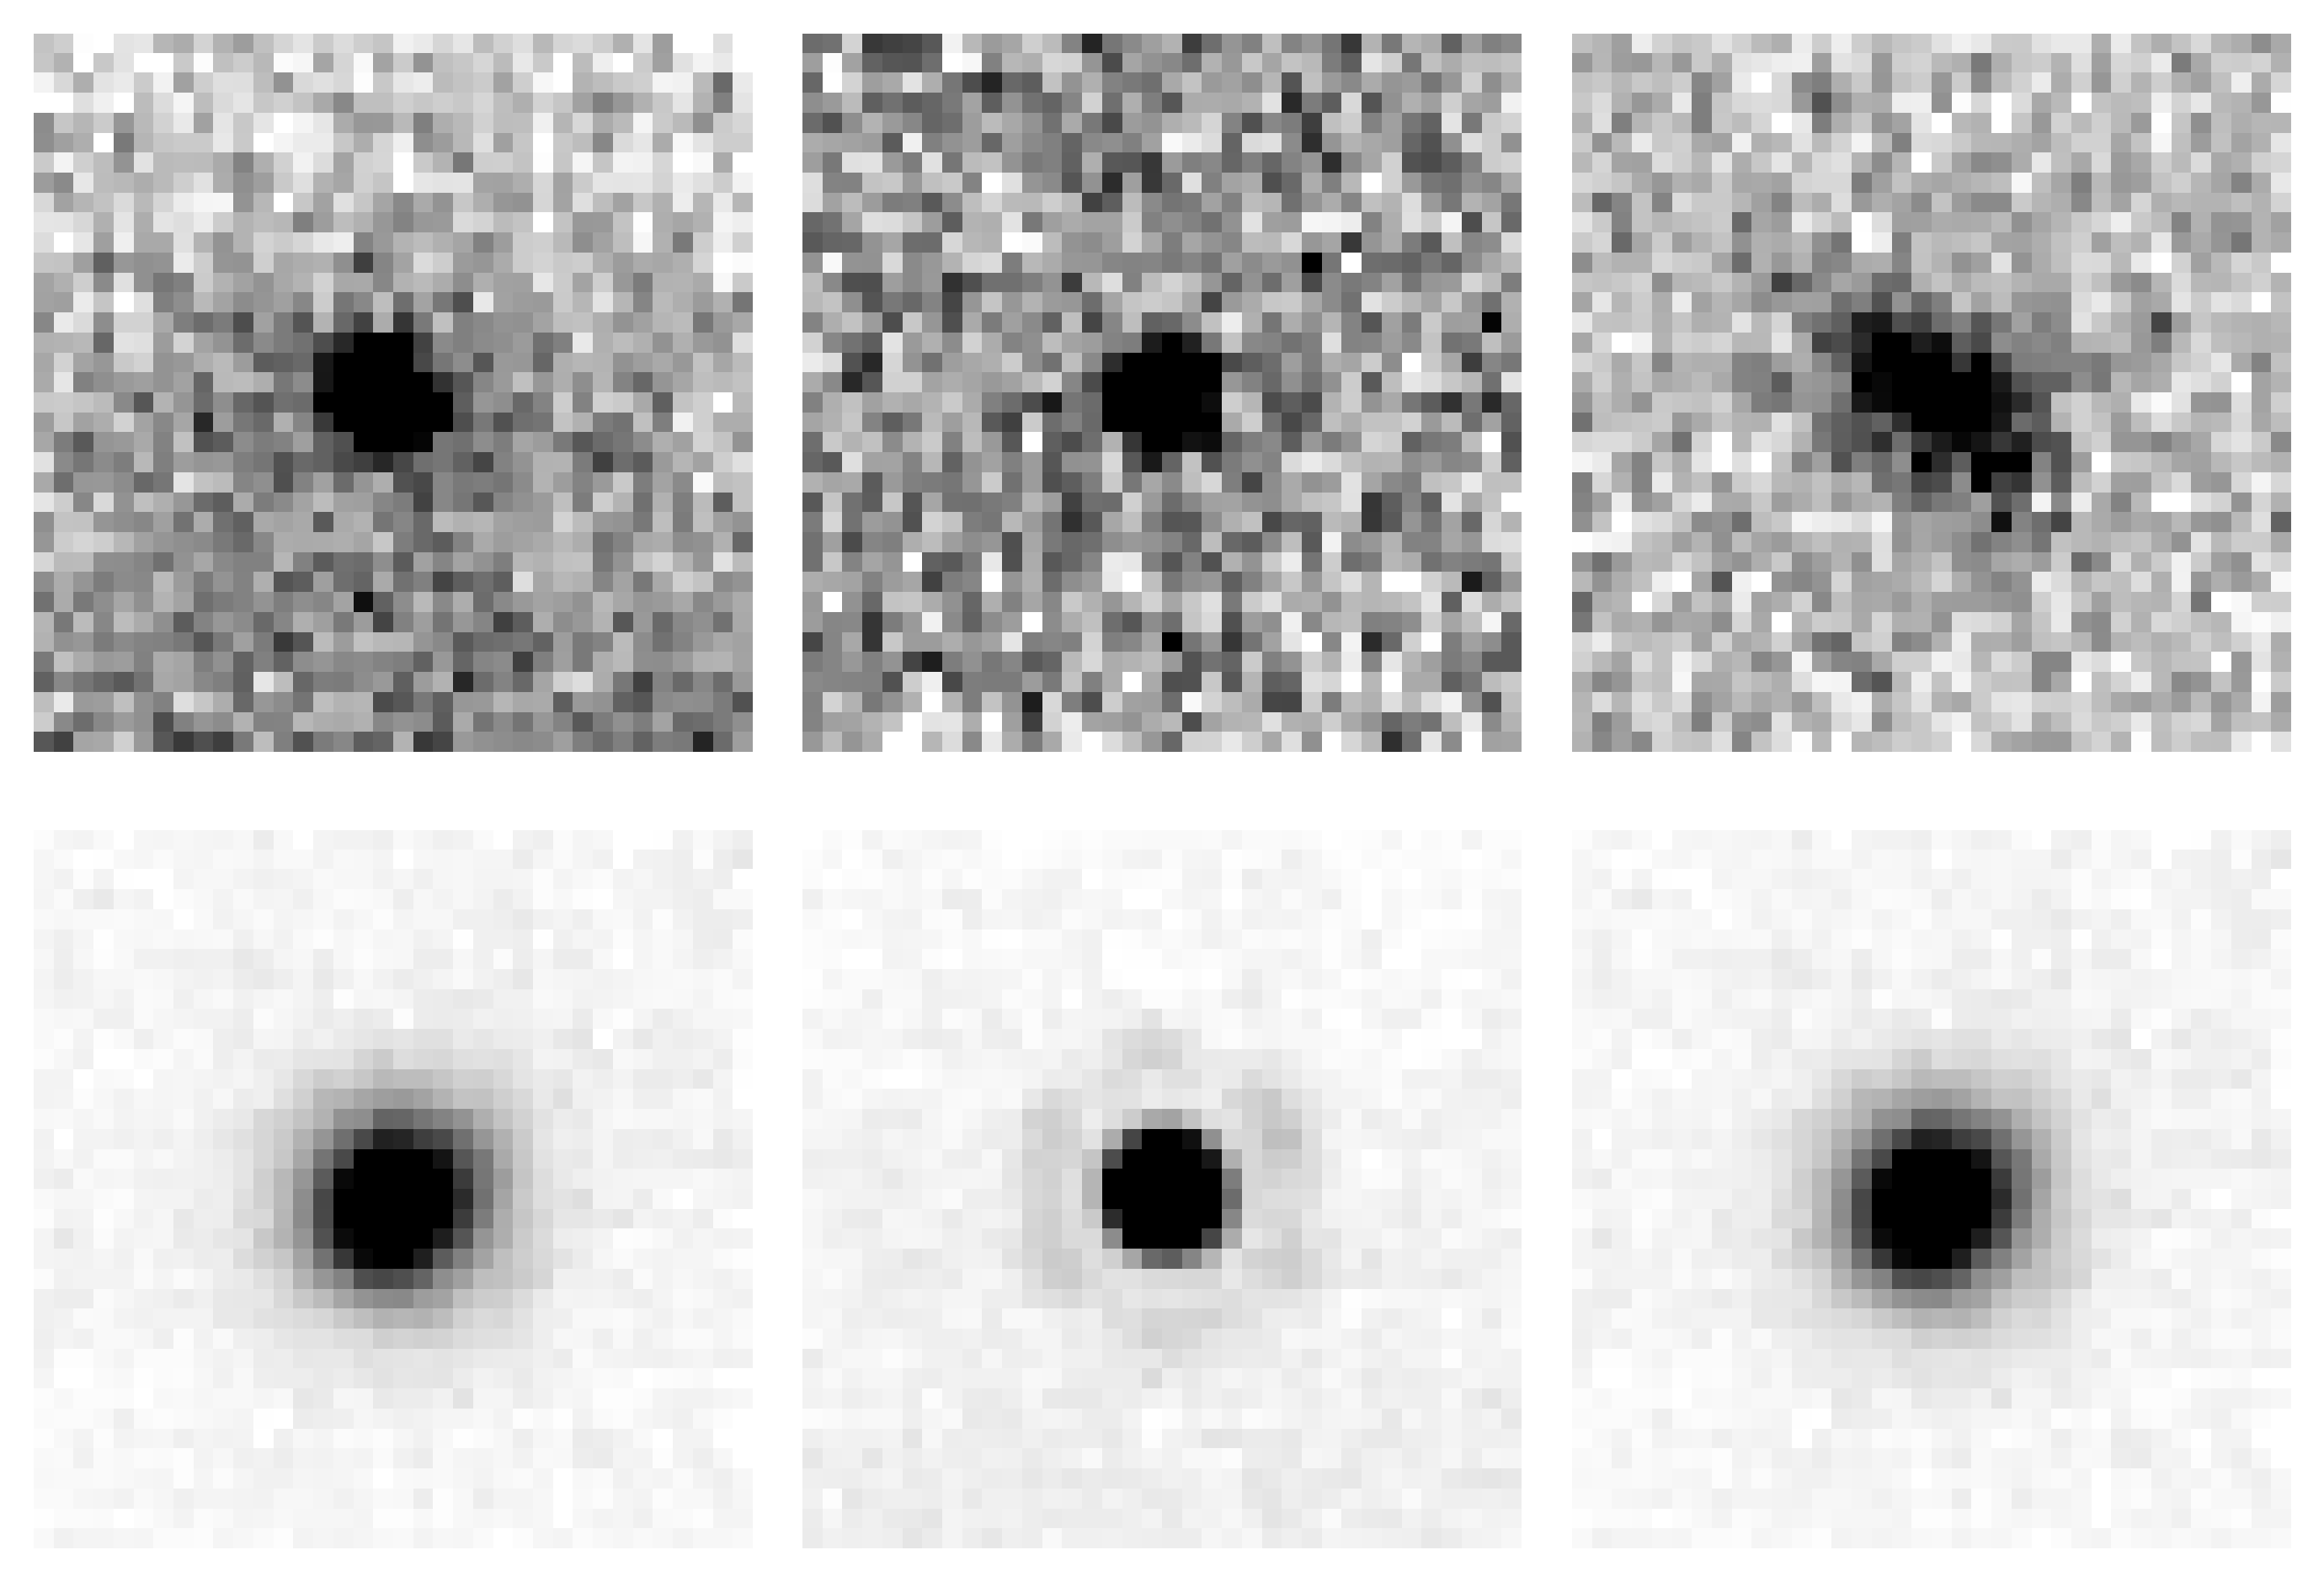
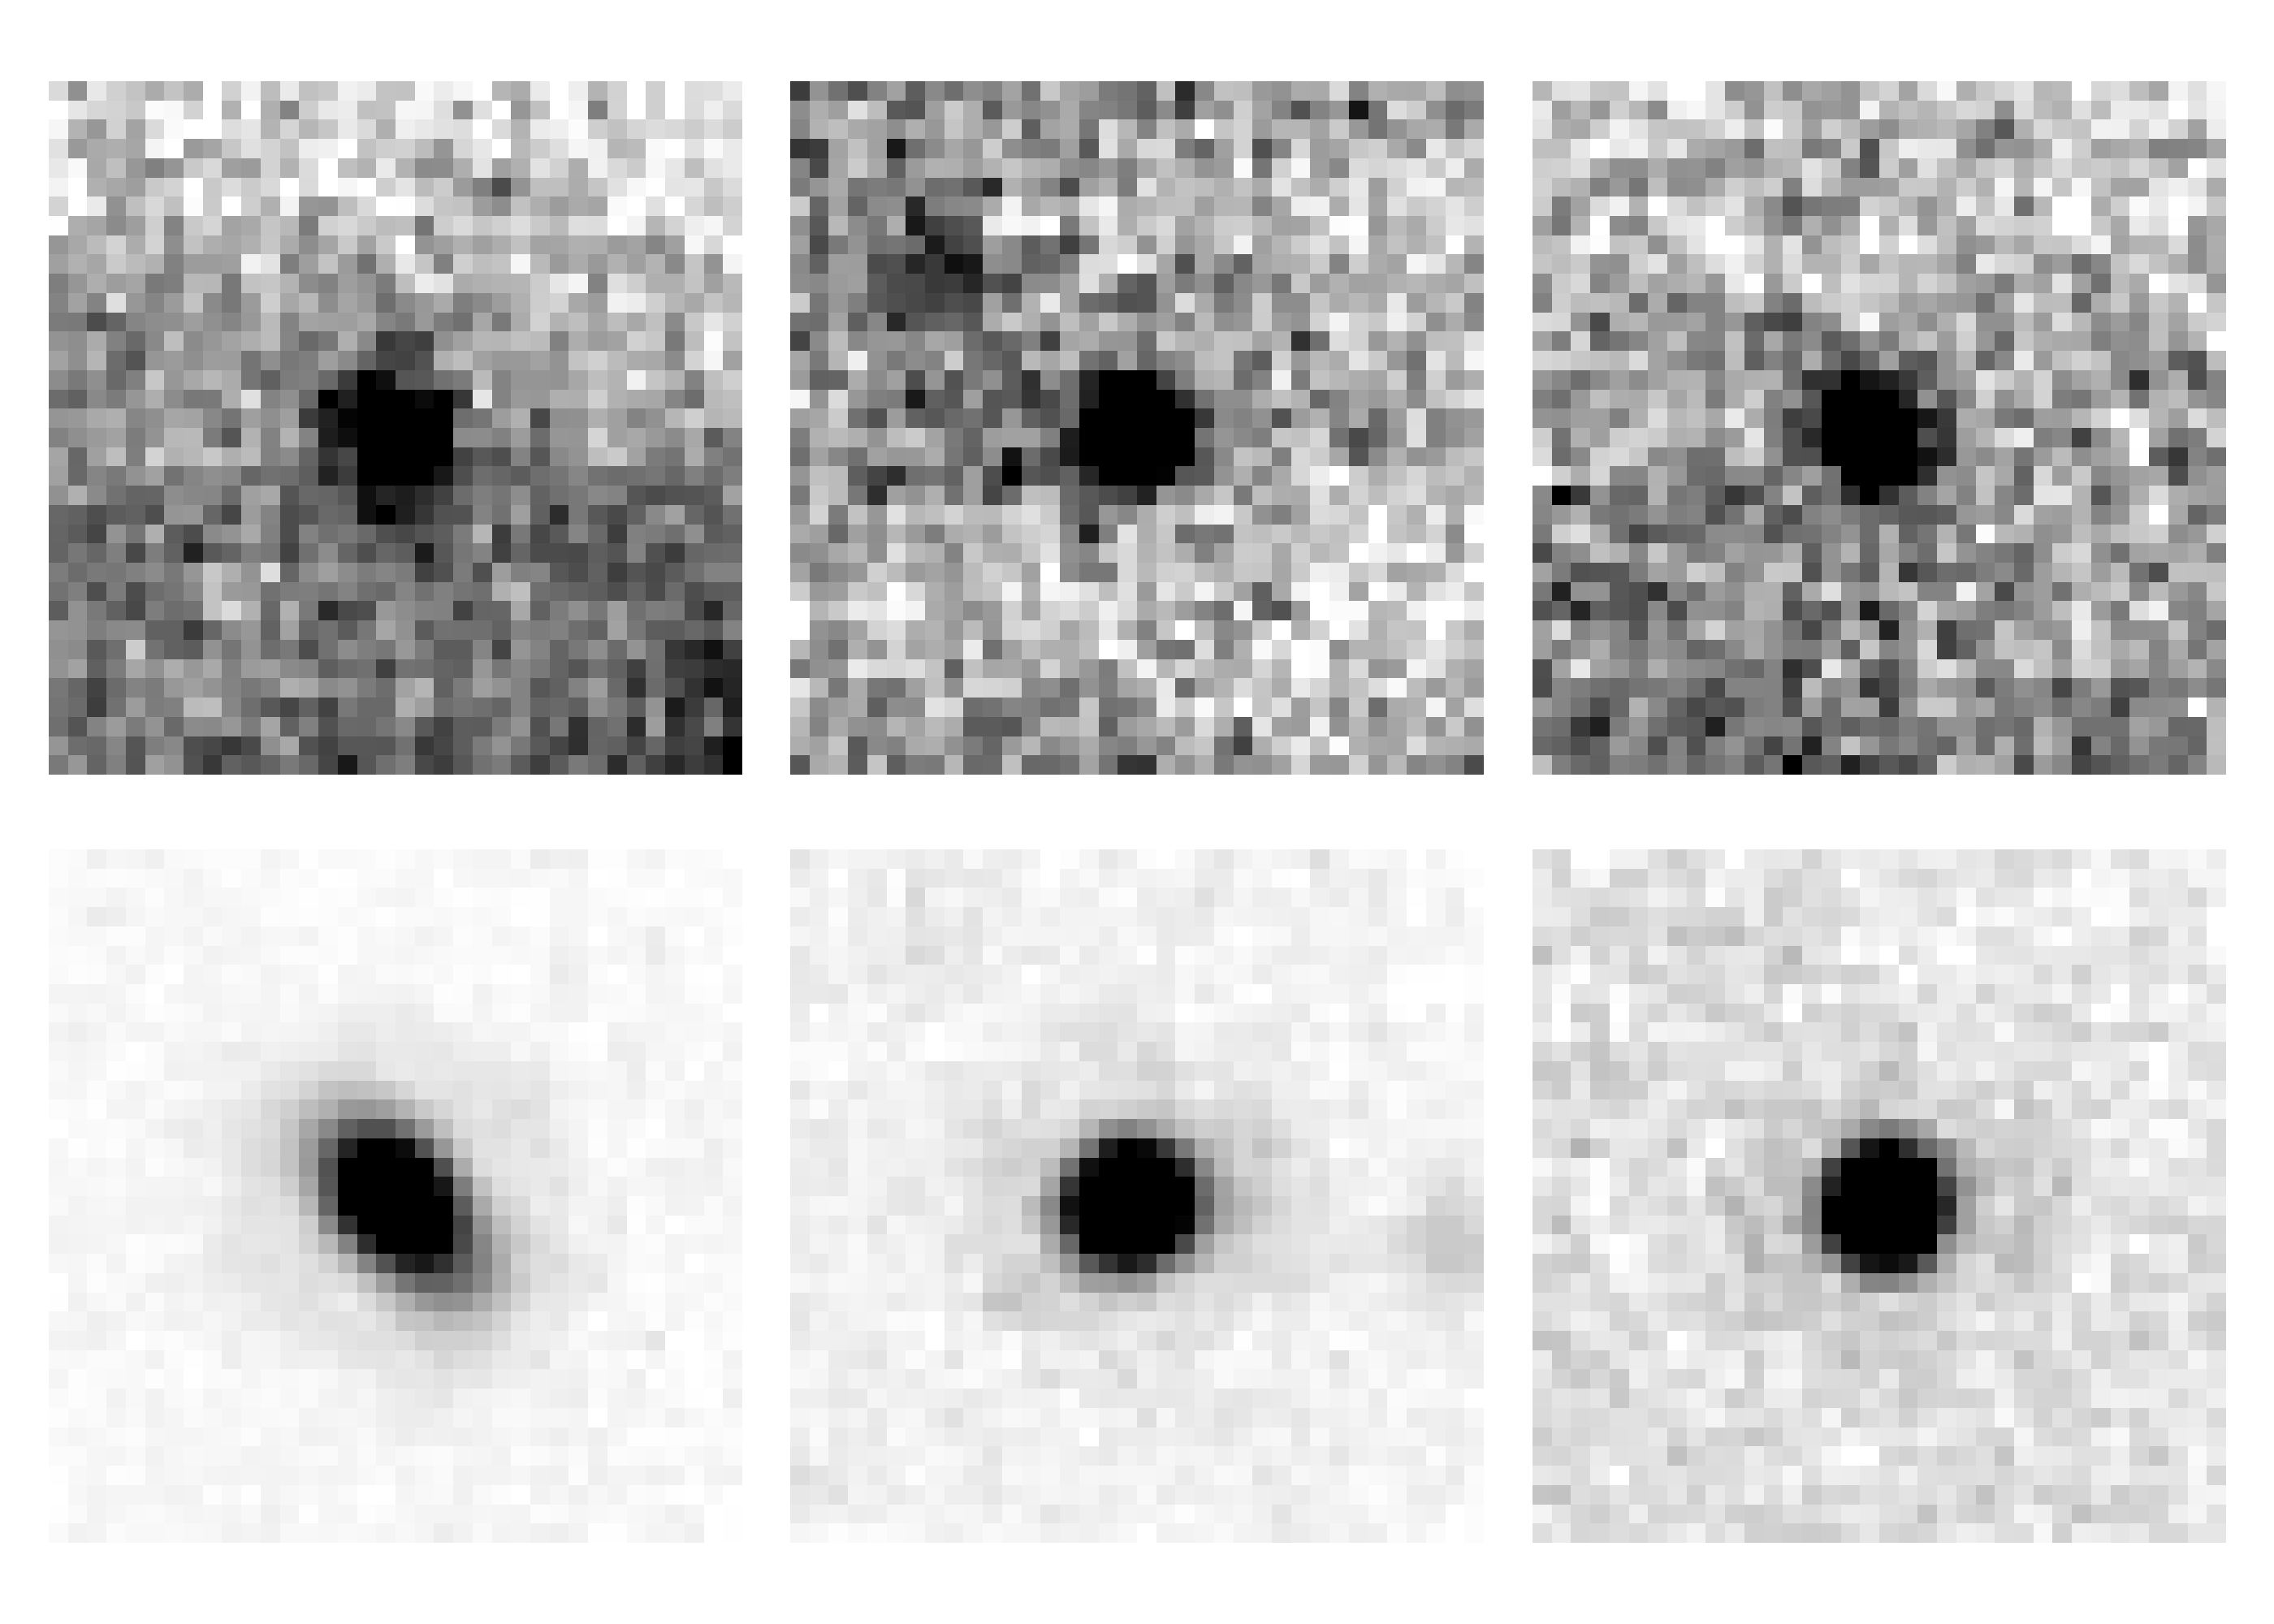
We summarise the parameters specified in SE and Photutils in Table 1. The parameters in Table 1 have been optimized for the source detection of the faintest sources in all six MIRI bands. Other parameters (DETECT_MAX/MINAREA, etc.) not listed in Table 1 remain the default value of SE. We also show examples of extracted sources with SE in each filter in the image o001 in the appendix A.
| Parameter Name | Common to the all filters | ||
|---|---|---|---|
| DEBLENDNTHRESH | 48 | ||
| DEBLENDMINCONT | 0.0008 |
| F770W | F1000W | F1280W | F1500W | F1800W | F2100W | |
|---|---|---|---|---|---|---|
| SN DETECTTHRESH [mag/arcsec2] | 1.5 | 1.5 | 1.5 | 1.3 | 1.2 | 1.0 |
| FILTERNAME | gauss2.555.conv | gauss3.077.conv | gauss4.077.conv | gauss5.099.conv |
2.2 Completeness
To accurately measure the source counts, it is important to correct them for completeness of source detection at each band. Therefore, we estimated completeness as a function of flux density. The final source counts have been corrected for the completeness of our source extraction.
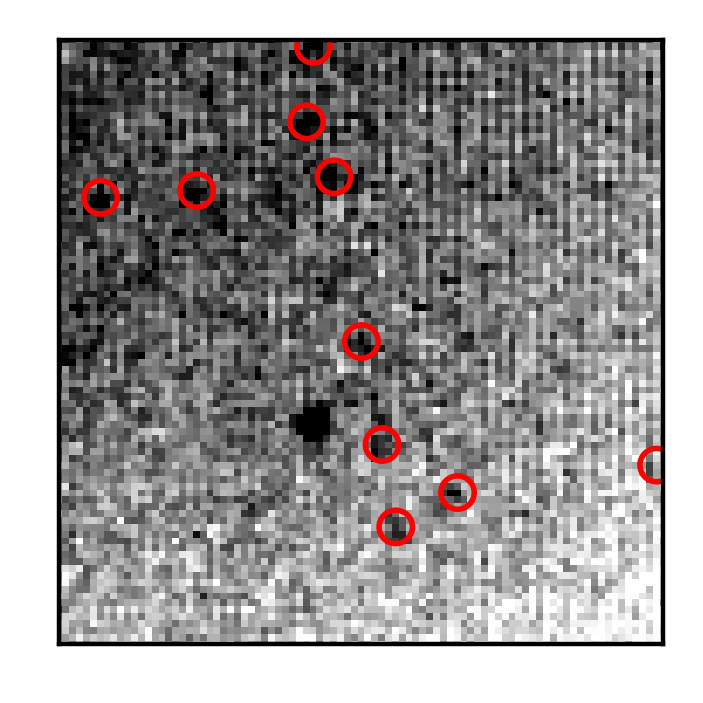
We added the artificial sources with a certain range of flux densities to the images and examined if they are detected with the same method as we detect the real astronomical sources, as described in Takagi et al. (2012). Each image consists of 20 randomly distributed artificial point sources generated from simulated JWST MIRI PSF. All the sources are placed avoiding the edges of the image. Fig. 8 shows the example of our artificial sources inserted into the image. After inserting, we re-run SE with the same set of parameters as the source detection and measure the percentage of artificial sources recovered from the image. This process is repeated 500 times with varying the flux range from 0.01 Jy to 100 Jy by an increment of 0.1 dex. In each image, in total, 500,000 artificial sources were examined. We here assume a flat number distribution for each filter.
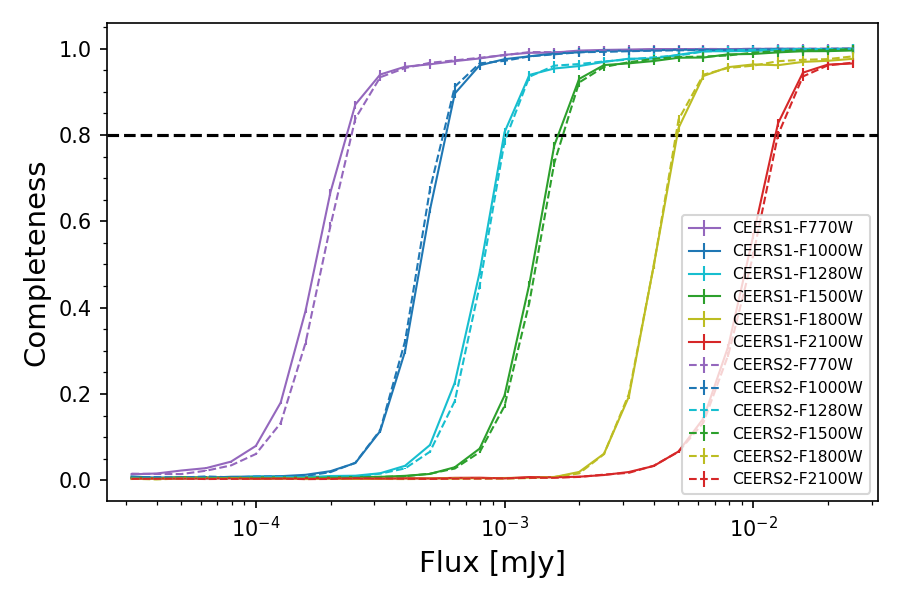
In Figure 9, we show the derived completeness for CEERS o001 and o002 fields. The completenesses of the two fields are matched well across all six filters.
In the o001 (o002) fields, the 80 percent completeness limit reaches 0.25 (0.25), 0.63 (0.63), 1.26 (1.26), 2.0 (2.0), 5.0 (5.0), and 13 (16) Jy in F770W, F1000W, F1280W, F1500W, F1800W, and F2100W filters, respectively.
For comparison, we have scaled the sensitivity of the point source detection limits (SNR=10) from the MIRI instrument Handbook333http://web.physics.ucsb.edu/~cmartin/data/4clm/MIRI._Cycle1.pdf to the effective exposure time of both fields. The exposure time for each wavelength is 1648.4, 1673.3, 1673.3, 1673.3, 1698.3, and 4811.9 seconds, in F770W, F1000W, F1280W, F1500W, F1800W, and F2100W filters, respectively, corresponding to the flux limits for SNR=10 of 0.24, 0.49, 0.85, 1.4, 3.0, and 5.4 Jy. The 80% completeness limits we obtained are comparable with these numbers.
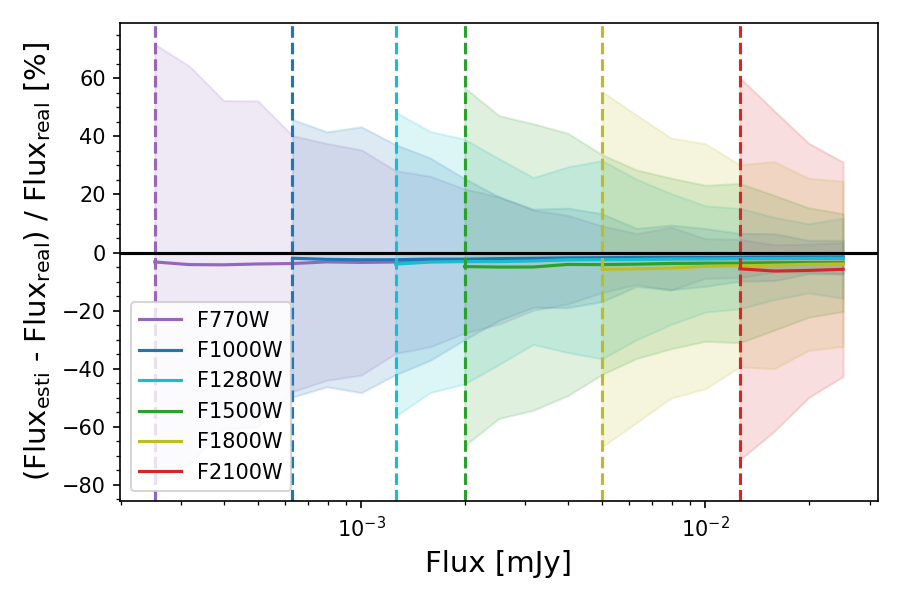
During the completeness estimation, we also calculated the accuracy of the flux recovery from SE. As shown in Figure 10, the median of flux difference between ’real’ (fluxes of injected artificial sources) and ’esti’ (fluxes obtained by SE) approaches 0% after the 80% completeness limit in every filter. We note, however, there is still a systematic underestimate of in F770W, F1000W, F1280W, F1500W, F1800W, and F2100W filters, respectively. The source count of each flux bin is corrected for incompleteness based on our completeness estimation. We only give the corrected source count in the result for sources brighter than 80 percent of completeness.
2.3 Reliability
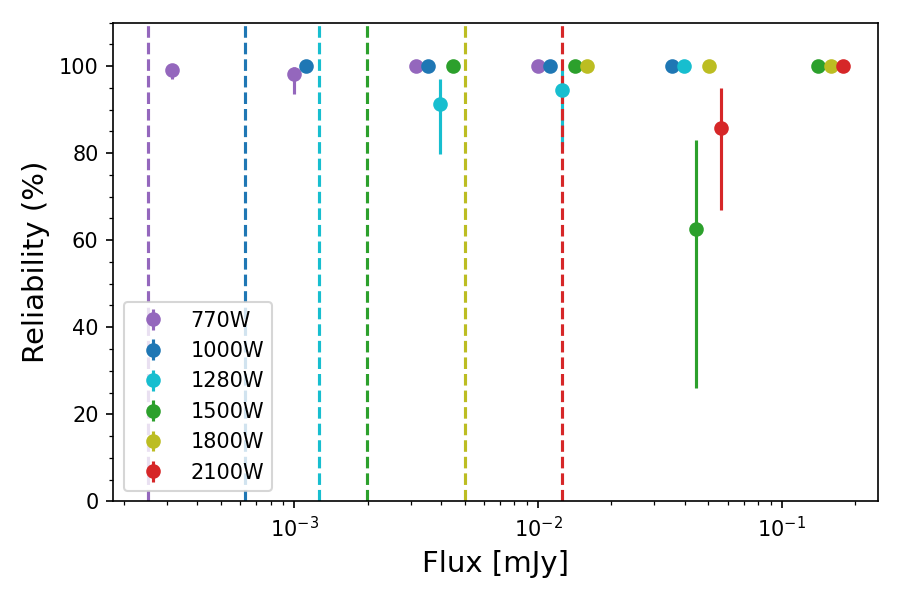
To confirm the credibility of the extracted sources, we perform the same source extraction procedure on negative images as on the original positive images. The negative images are created by multiplying the signal in the original JWST MIRI images by . We have removed the artificial spikes near the brightest star in the field ’o001’ and the spiral galaxy in the lower right corner in the field ’o002’. The reliability is estimated by taking the differences between the sources detected in the original images and the sources detected in the negative images, then dividing the difference by the number of sources detected in the original images, . We have combined the number of sources detected in the ’o001’ and ’o002’ fields for a better evaluation of the overall reliability. Figure 11 shows the reliability as a function of the flux above 80% completeness in each filter. For most filters, we find that the reliability of our sources is above 95%. The dip at 15 m is mainly due to the binning, where fewer sources are obtained in the positive image at this flux range. The 21 m image generally has the worst reliability of the filters due to the lower resolution. Table 2 summarises the average reliability of each filter.
| Filter | Reliability |
|---|---|
| F770W | 99% |
| F1000W | 100% |
| F1280W | 95% |
| F1500W | 95% |
| F1800W | 100% |
| F2100W | 72% |
3 Results and discussion
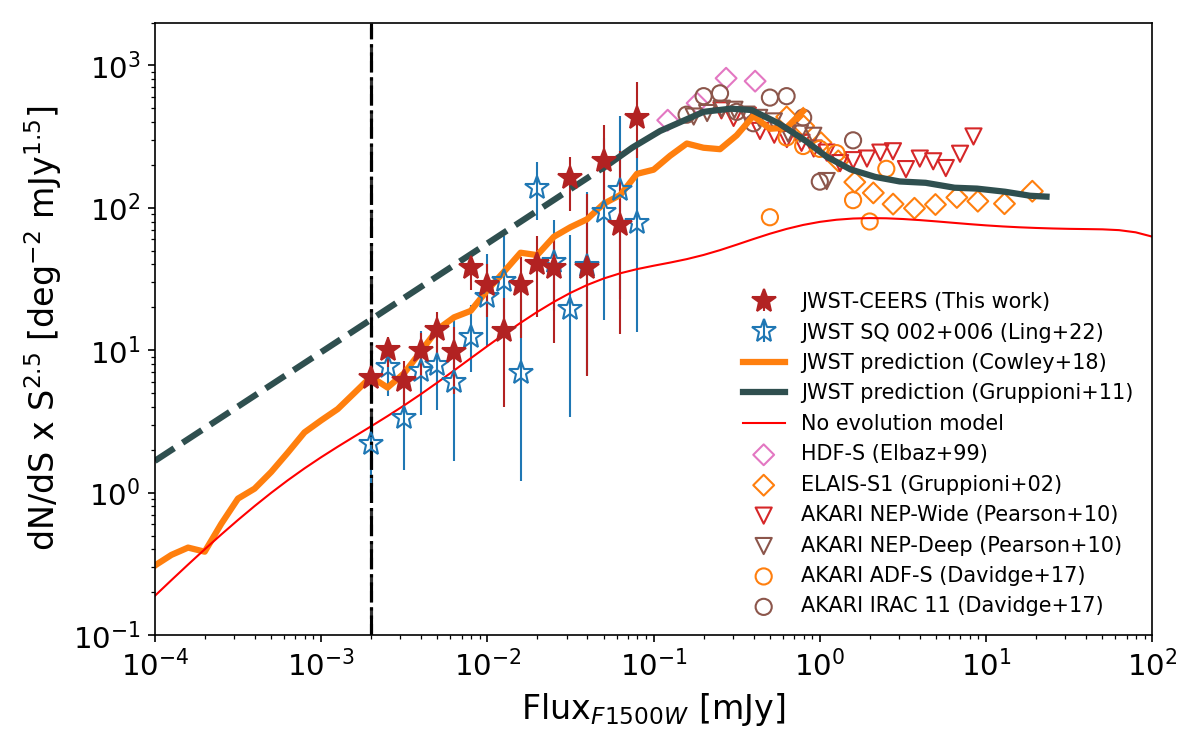
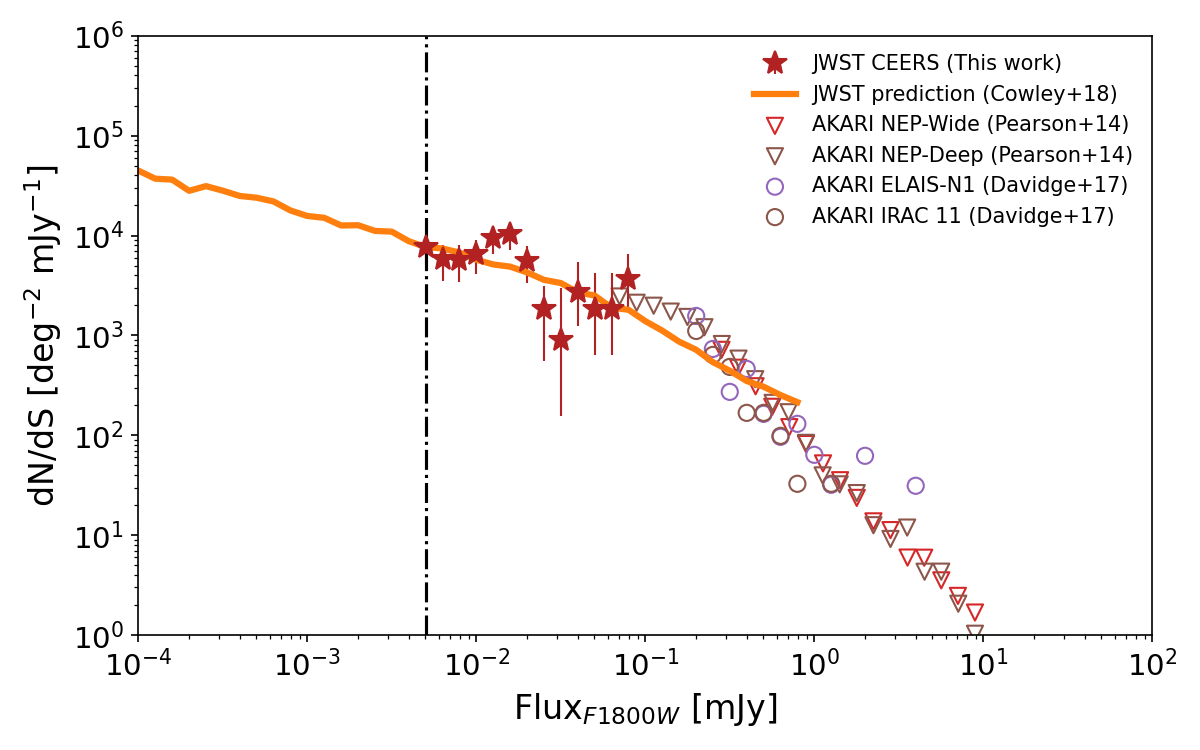
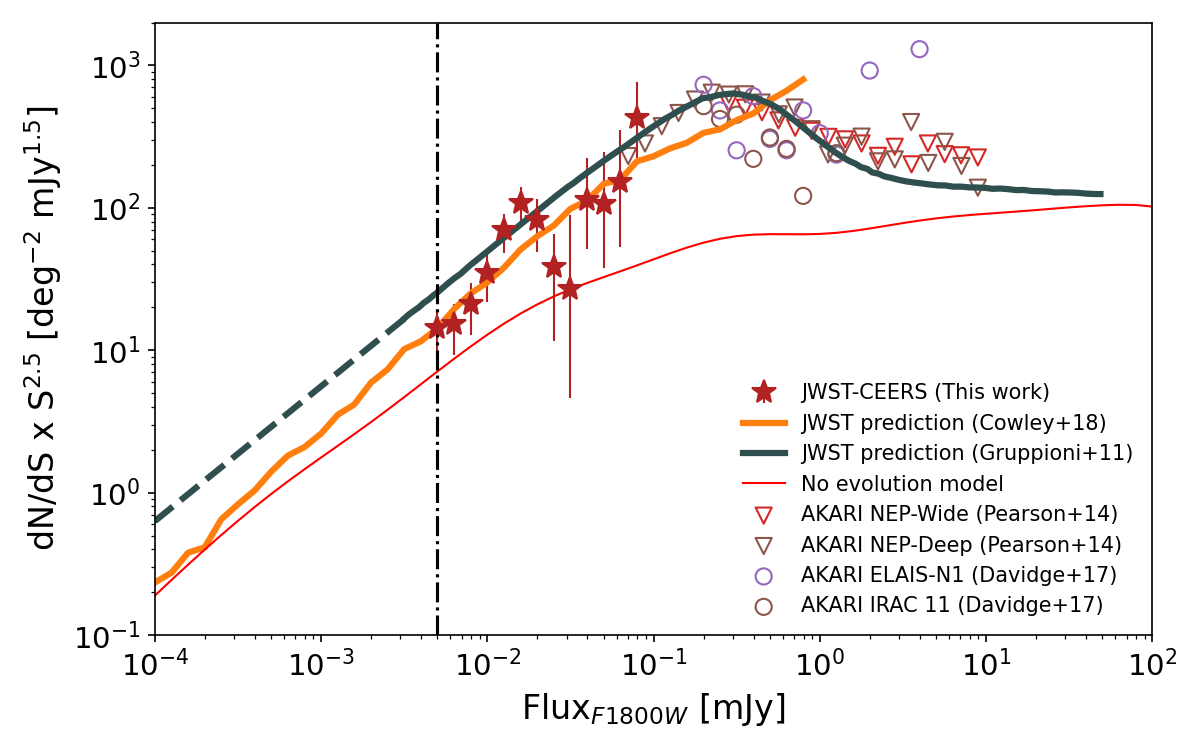
We present the derived source counts in the CEERS o001 and o002 fields in Figs. 12-17. For F770W, F1000W, and F1500W, we overlay the source counts with those from Stephan’s Quintet fields (Ling et al., 2022). The total area in Stephan’s Quintet fields is 16688 arcsec2 (4.64 arcmin2), which is larger than that covered in this work. We derived the Poisson error for our source count estimation at each flux bin as follows. If the number of extracted sources from each CEERS field within one flux bin is fewer than 6, we adopt the error values provided by Gehrels (1986) for an improved estimation. In the resulting source counts, the non-uniformity at longer wavelengths is due to a smaller number of sources being detected in those bands. This could be attributed to the binning of the data, and the lower resolution and sensitivity at longer wavelengths
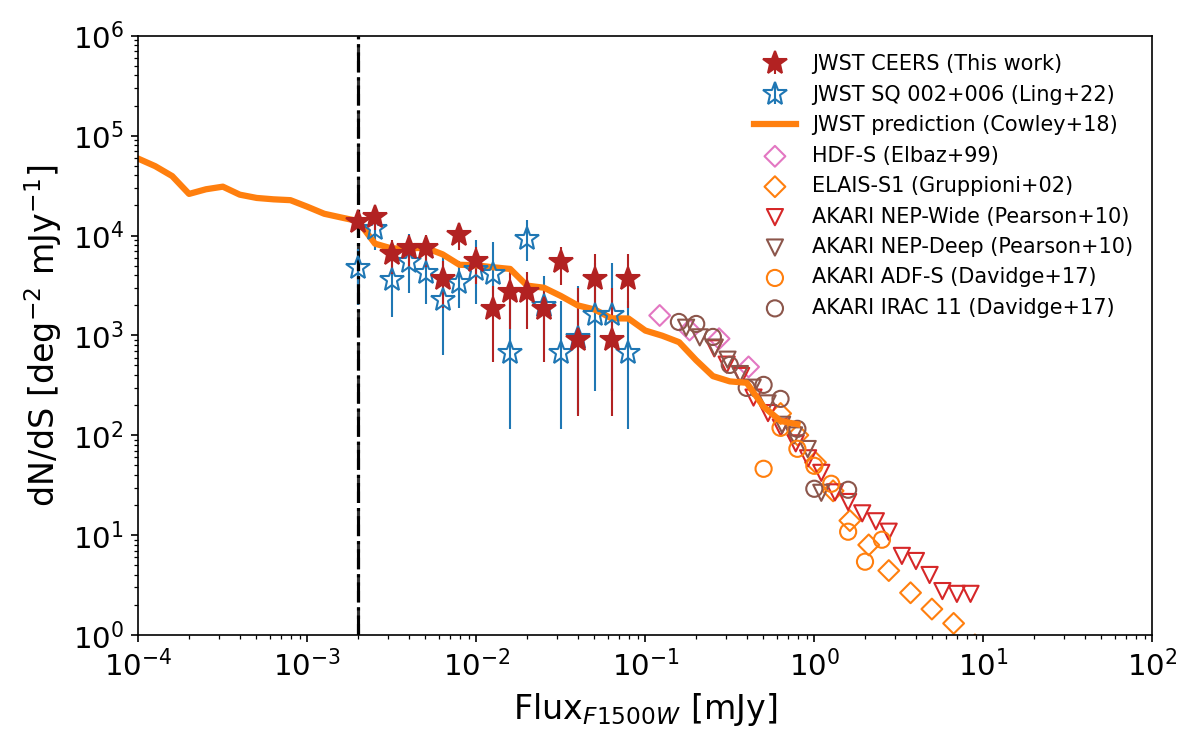
Compared with Ling et al. (2022), the CEERS field is better suited for the purpose of extra-galactic source counts. This field has been obtained for the extra-galactic studies, resulting in fewer contamination from the foreground objects. With this CEERS field data, we are able to explore deeper than Stephen’s Quintet fields used by Ling et al. (2022). At the shortest wavelength 7.7m (Fig. 12), our 80% completeness level reaches 2 times deeper than Ling et al. (2022). Our 80% completeness level in the other two bands (Fig. 13 and 15) are both comparable to Ling et al. (2022)’s numbers.
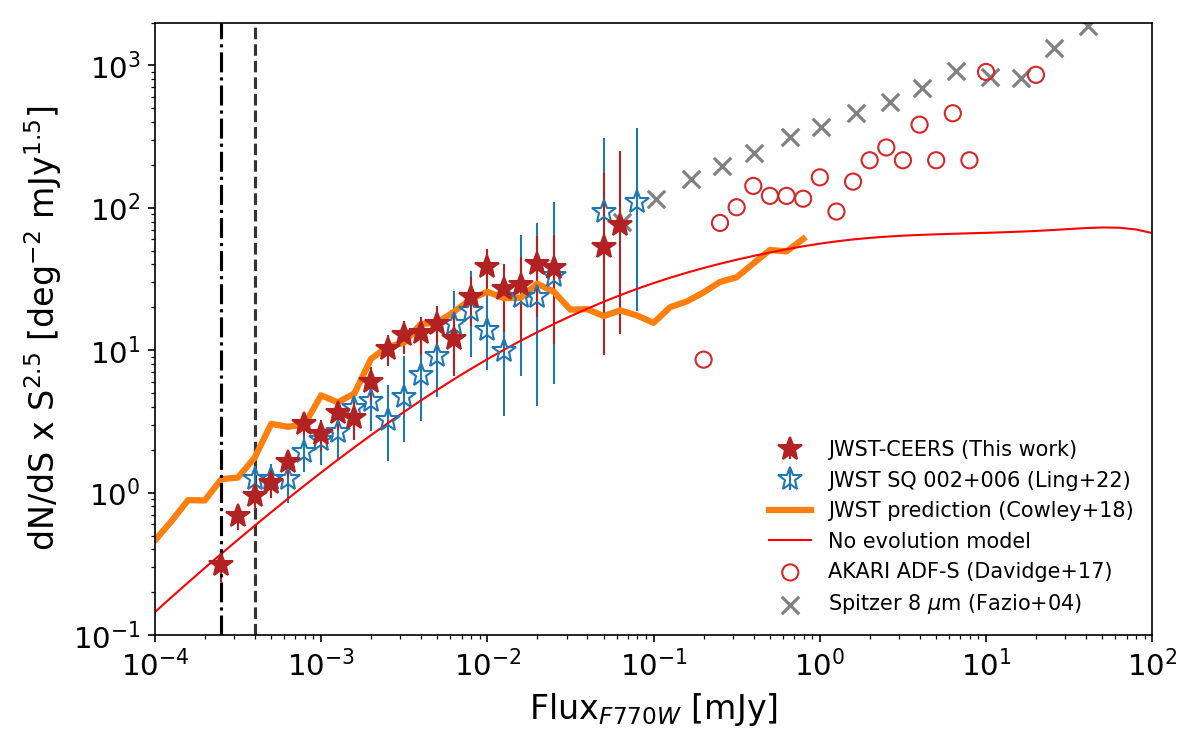
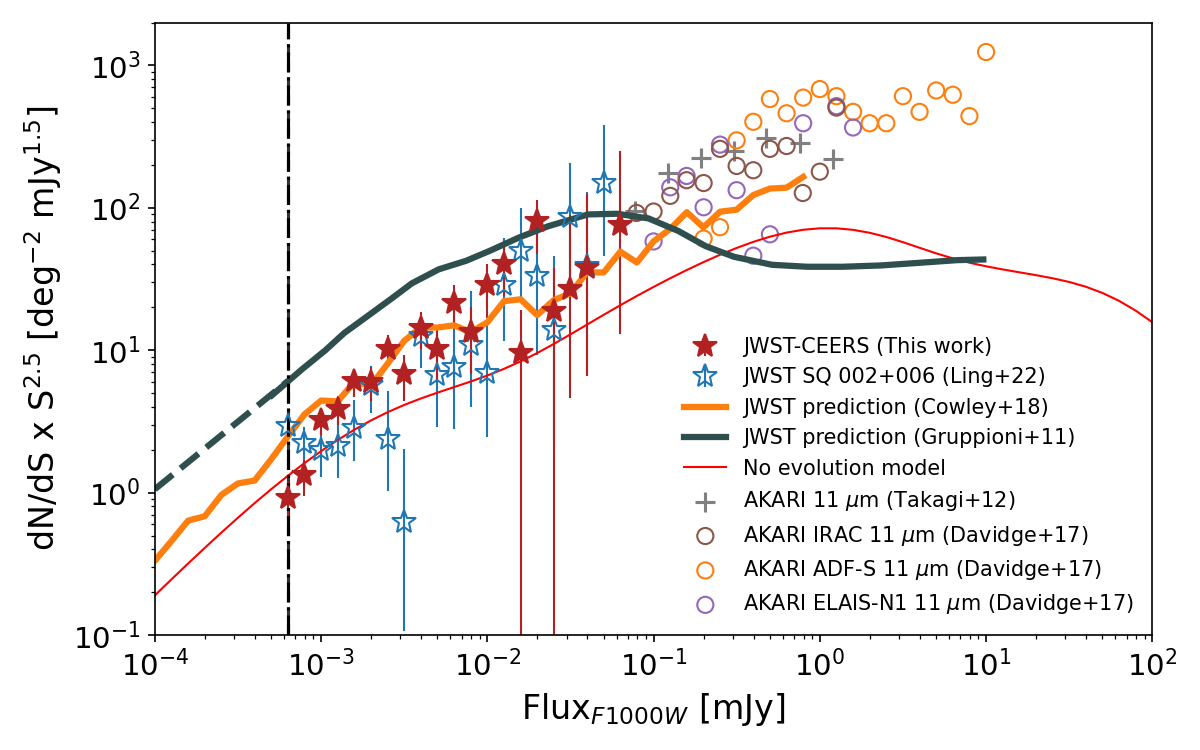
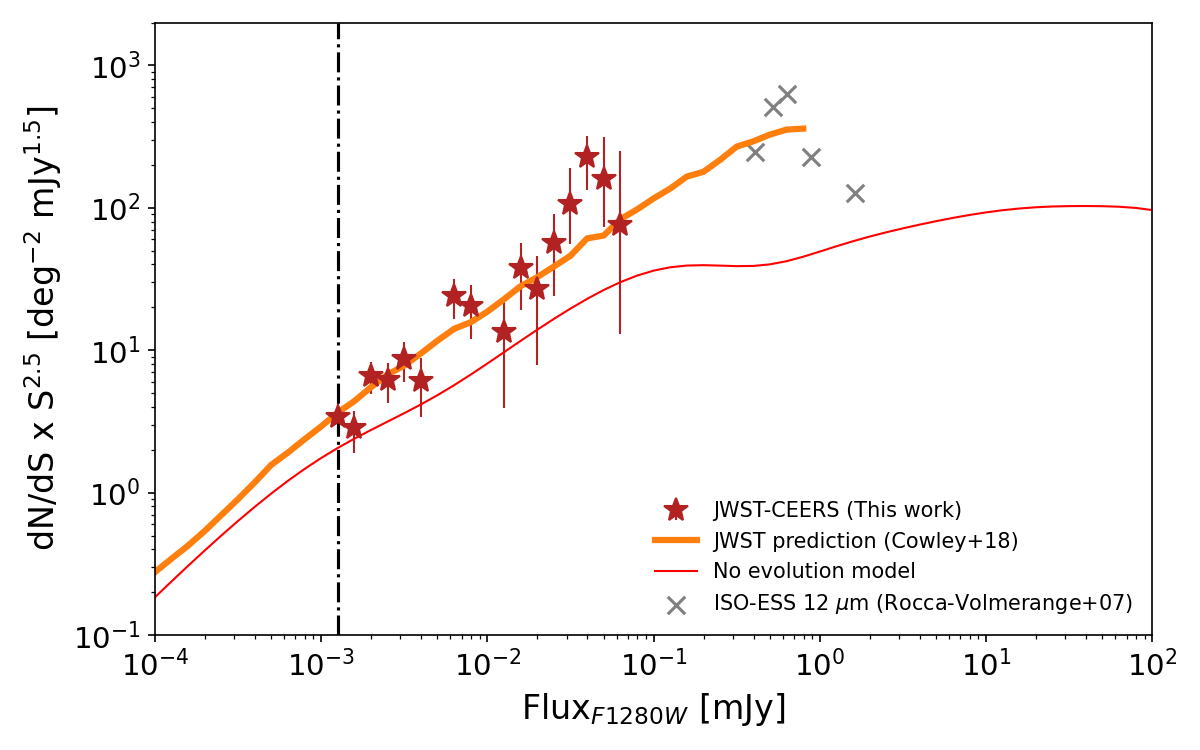
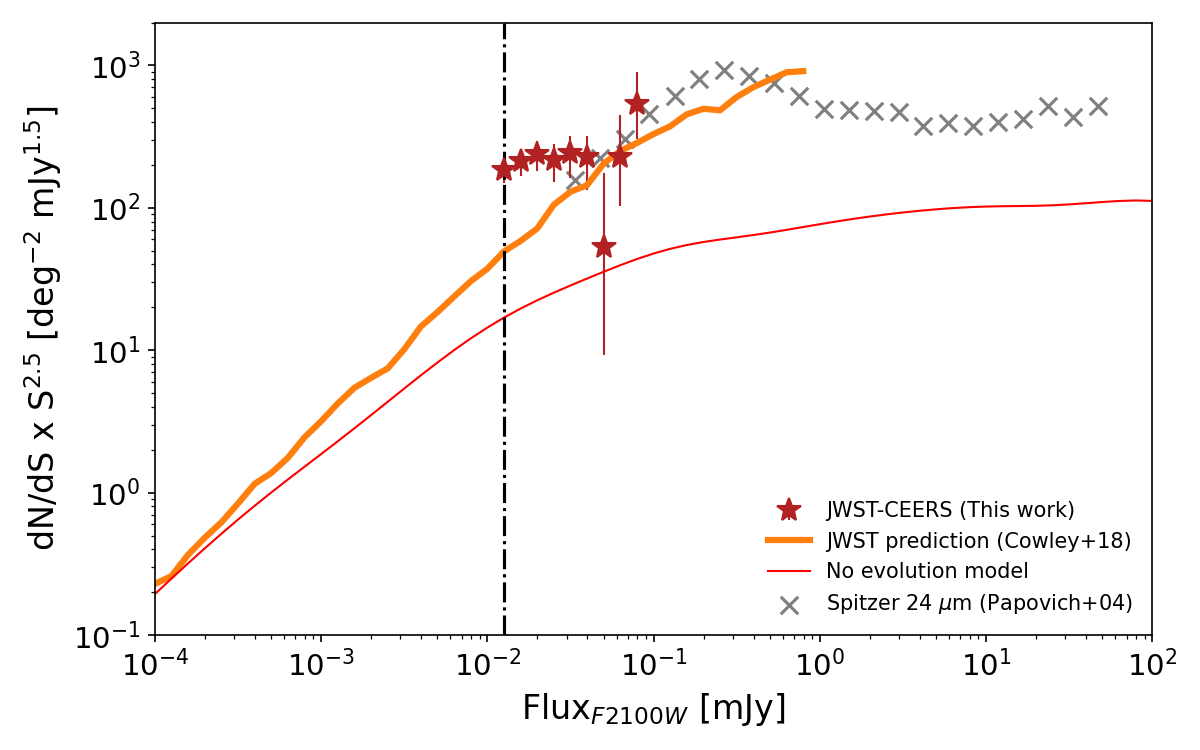
We note that the observed source counts are high than the no-evolution model (red solid line) shown in Figs 12-17. One possible explanation is that the assumption of no evolution in the luminosity function (LF) may not be valid for all galaxy populations. The no-evolution model assumes that the comoving luminosity function remains equal to the local one at all redshifts, but this may not be true if galaxies undergo significant evolution in their properties over time. For example, if star formation rates were higher in the past, we might expect to see more luminous galaxies at high redshifts (Figures 4 and 8 in Goto et al. (2010)). Thus, the observed number of evolutionary models will be higher compared to the no-evolution model. Therefore, the no-evolution model can only be a baseline for comparison with more complex empirical models (which allow for LF evolution).
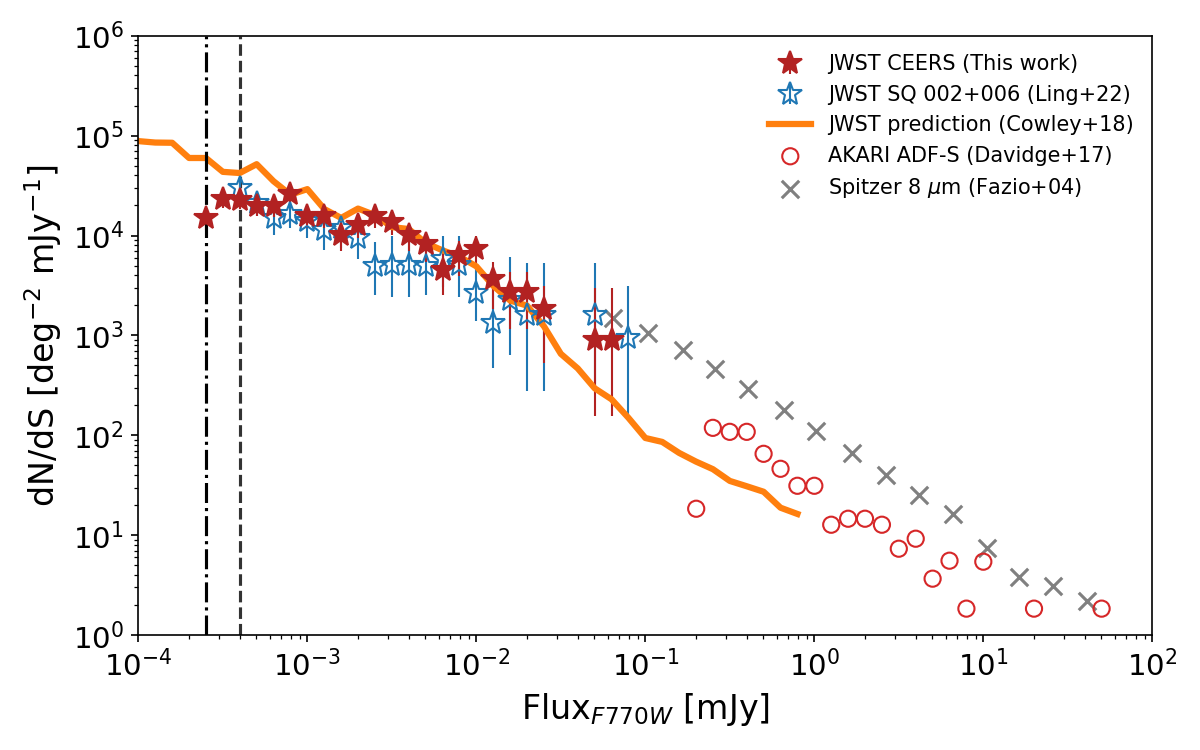
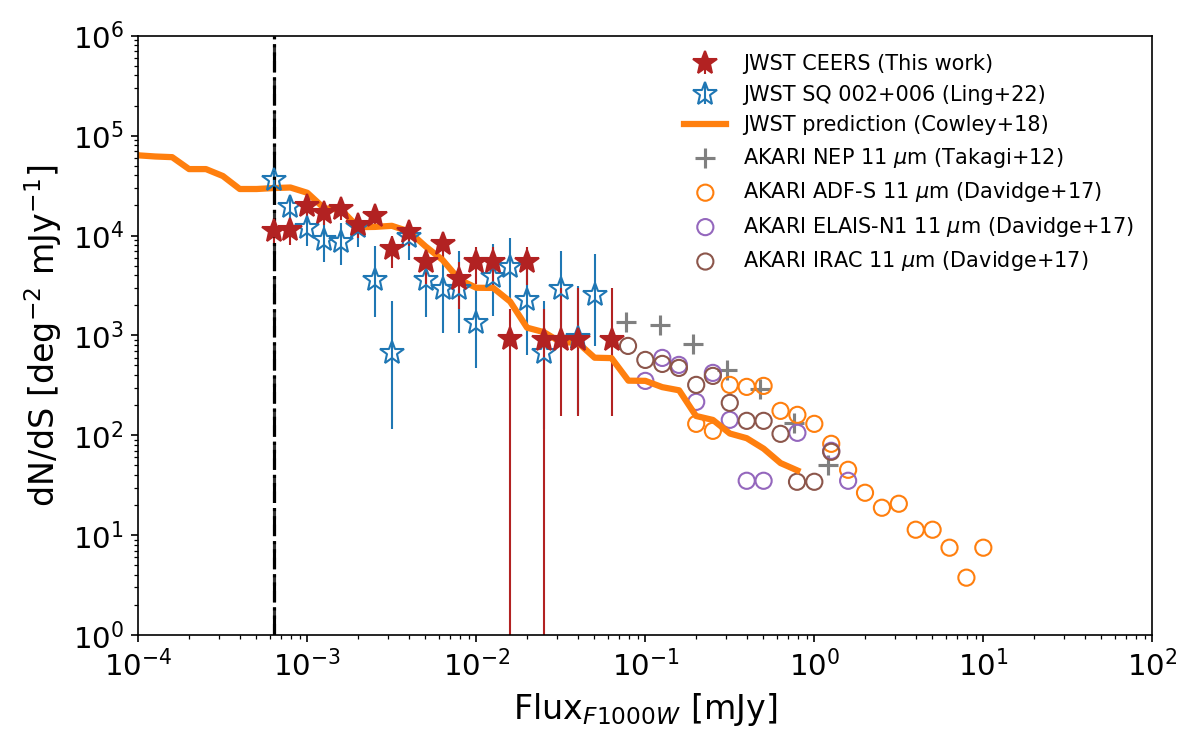
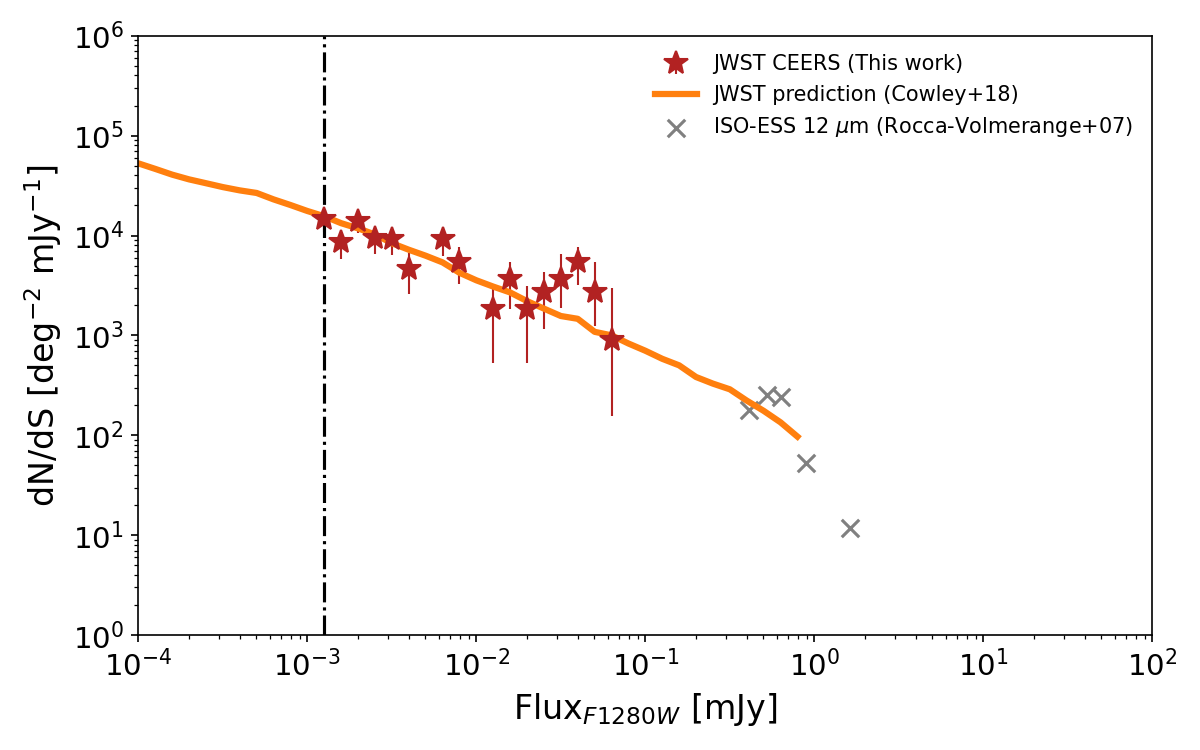
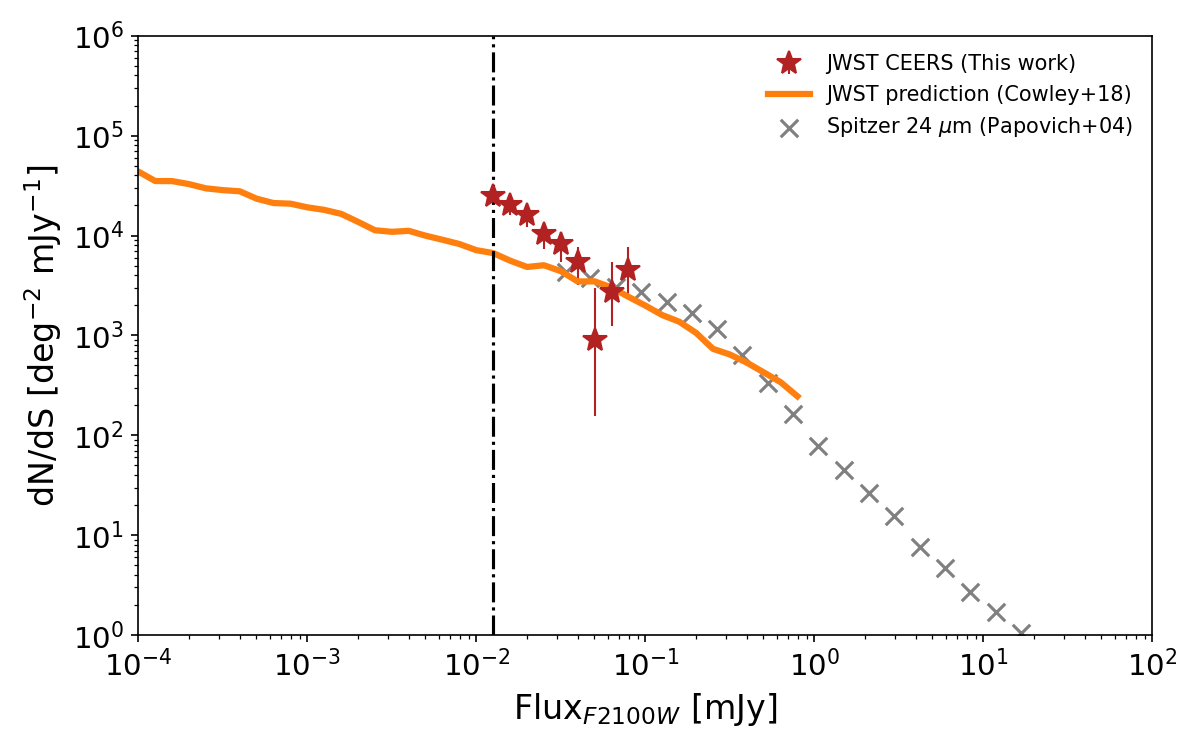
In all six broad band filters, JWST continues the work from its predecessors such as Spitzer (Fazio et al., 2004) or AKARI (Takagi et al., 2012), and the JWST counts still continue down below the Jy levels at shorter wavelengths (7.7 and 10 m). At brighter flux of >0.1mJy, the deviation between models and observed data from Fazio et al. (2004) is due to the contamination from Milky Way stars. The newly observed data seems to be well connected with brighter source counts from the previous studies such as Rocca-Volmerange et al. (2007), Elbaz et al. (1999), Gruppioni et al. (2002), Pearson et al. (2010), Pearson et al. (2014), Papovich et al. (2004) and Davidge et al. (2017) in all filters. The prediction from the dark matter simulation combined with the SED models (Cowley et al., 2018, orange curves) appears in reasonable agreement in all the observational measurements. In Figs. 12, 15 and 16, the linear extrapolation of the prediction (Gruppioni et al., 2011) based on previous generation satellites (Spitzer/AKARI; Gruppioni et al., 2010) are over-plotted in the dark green line, and agree with the JWST measurements within the errors.
The only exception is Figure 13, where we compare the JWST source counts in 10 m with the model prediction from Cowley et al. (2018) and Gruppioni et al. (2011). The former model combined dark matter simulation (GALFORM) with the galaxy SED models (GRASIL) to obtain the prediction, while the latter relies on the parameters that have been constrained by the observables from pre-JWST surveys in the mid- and far-IR. In Fig. 13 at the fainter flux of mJy, the Gruppioni et al. (2011) model over-predicts IR sources by a factor of , while the slope is still consistent.
In Fig. 2, the shape of Cowley’s model in differential source counts is not seen in wavelengths other than 7.7 m. According to the discussion in Cowley et al. (2018), the burst component, i.e., the star-burst component becomes important in the wavelength > 10m at the high-flux end, due to the dust-attenuated energy from nearby galaxies being re-emitted at observed wavelengths that are larger or equal to 10 m. However, the starburst component is less dominant at 7.7 m. At 7.7 m, starburst galaxies have a prominent PAH emission, which is difficult to be accurately modeled. Therefore, one possibility is that the contribution from the starburst component needs to be improved in Cowley et al. (2018) at 7.7 m. This might account for the drop observed in Cowley’s model at 0.1 mJy, a feature that is solely evident in Fig. 2.
At all wavelengths, even if we have consistent results with the model predictions, the parameters in the Gruppioni et al. (2011) model has inevitable degeneracy. The source counts themselves do not provide specific information about any particular type of IR population, making it difficult to be connected to the LF of a certain type of galaxies. In this sense, the degeneracy in luminosity or density evolution, or the faint-end slopes of LFs exist in the source counts. Deviations seen in this work may suggest an evolution towards the fainter end, or the need to modify evolutionary parameters in the currently available models in order to describe all the infrared sources ranging from Jy to sub-Jy levels. In the near future, we will be able to use photometric/spectroscopic redshifts and more advanced SED-fitting techniques with brand-new template libraries to unwrap/improve these parameters or models . Optimistically speaking, as more JWST data become available, the evolutionary properties of different populations of galaxies will be easily revealed by the multi-band analysis of photometric/spectroscopic redshift information.
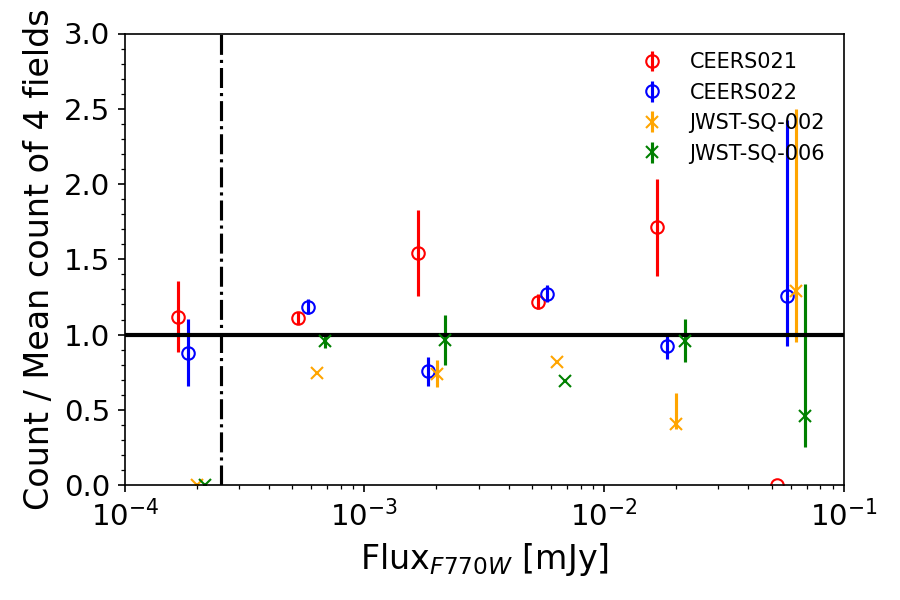
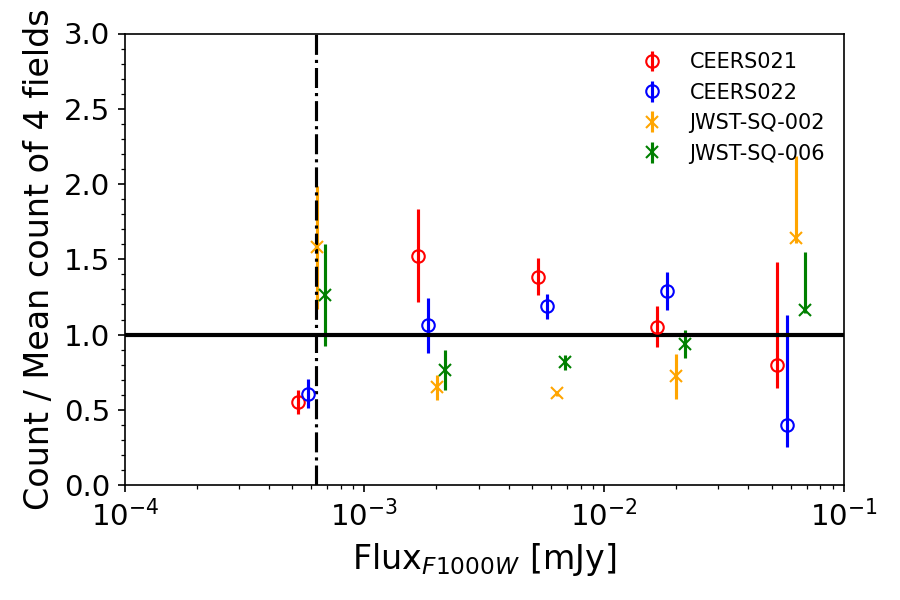
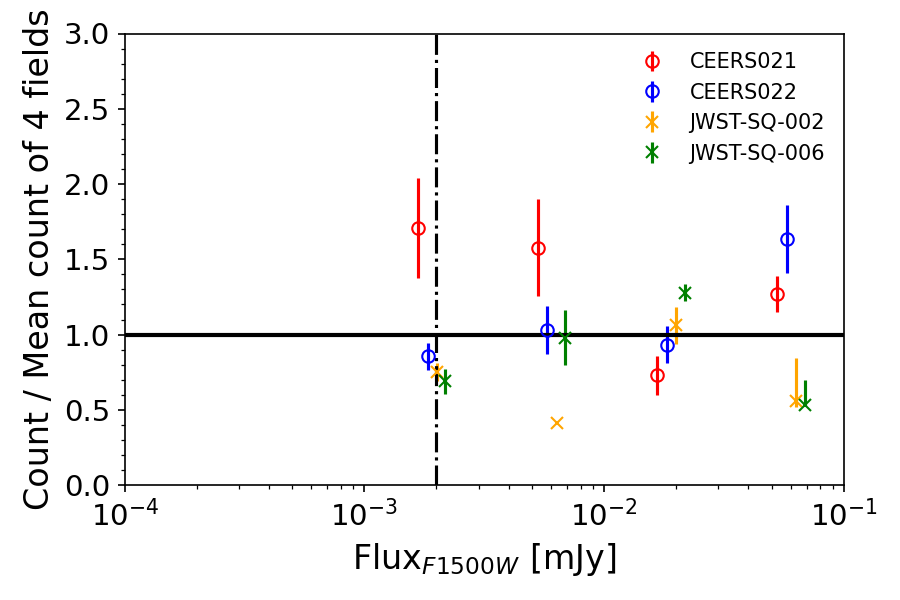
In Fig. 18, we show the field-to-average fluctuations due to the large scale structures in 7.7, 10, and 15 m compared with the source counts from the Stephen’s Quintet fields of Ling et al. (2022). Fig. 18 shows the ratio between the average of each bin and source counts with bin size dex. The derived field-to-average fluctuation is majorly between 30% to 180%. Some of the bins have no sources in them thus yielding 0% in the field-to-average ratio. The error of these fluctuations is calculated from the error propagation of the Poisson noise of the source counts. We observe a significant scatter in the ratio beyond the 1 sigma error tolerance, indicating the potential influence of LSS on the source counts. Furthermore, it is clear that the sources in the background of Stephan’s Quintet have a reduced number density, representing only 70% of the average, while CEERS fields tend to have a higher density of sources.
4 Conclusions
Using the deep MIR data from the JWST CEERS fields, we derived the source counts in the six MIRI (7.7-21.0 m) bands of the JWST. The 80% completeness limits are 0.25 (0.25), 0.63 (0.63), 1.26 (1.26), 2.0 (2.0), 5.0 (5.0), and 13 (16) Jy, in F770W, F1000W, F1280W, F1500W, F1800W, and F2100W filters, respectively. These numbers are comparable to the expected flux limits given the JWST sensitivity, illustrating their unprecedented depths in the MIR. Compared with previous work, our results provide more than 2 orders of magnitude deeper extension of the source counts in 7 to 15 m bands, and about 1 and 0.5 order extension in 18- and 21- m, respectively. Apart from the 10 m, the other wavelengths show reasonable agreements with the extrapolation of the current models, which are primarily based on previous IR observations/studies (e.g., ISO, Spitzer, and AKARI).
Our JWST source counts at 12.8, 18, and 21 m compared to Ling et al. (2022) are newly obtained in this work and provide us with the deepest counts to date. Even though we have some deviations between the currently available models and the measurement at the F1000W (Section 3) in this work, it is clear that new observations with the MIRI/JWST have broadened our horizons to much fainter infrared galaxies. The development of improved models to physically interpret MIR source counts across a wide range of observed fluxes is urgently needed. In our companion paper, we fit the newly obtained source counts to constrain the evolution of IR galaxy populations (Kim et al., submitted).
Acknowledgements
The authors would like to express their sincere gratitude to the referee, Prof. Chris Pearson, for many insightful comments and suggestions, which have greatly improved the quality and clarity of this manuscript. TG acknowledges the support of the National Science and Technology Council of Taiwan through grants 108-2628-M-007-004-MY3 and 111-2123-M-001-008-. TH acknowledges the support of the National Science and Technology Council of Taiwan through grants 110-2112-M-005-013-MY3, 110-2112-M-007-034-, and 111-2123-M-001-008-. This work is based on observations made with the NASA/ESA/CSA James Webb Space Telescope. The data were obtained from the Mikulski Archive for Space Telescopes at the Space Telescope Science Institute, which is operated by the Association of Universities for Research in Astronomy, Inc., under NASA contract NAS 5-03127 for JWST. These observations are associated with the program ERO. Also, we thank Jamie, Chang at the Department of Physics, NTHU for his profound editing skill for the beautiful Fig. 1.
Data Availability
Early Release Observations obtained by JWST MIRI are publicly available at https://www.stsci.edu/jwst/science-execution/approved-programs/webb-first-image-observations. Other data underlying this article will be shared upon reasonable request to the corresponding author.
References
- Ashby et al. (2015) Ashby M. L. N., et al., 2015, ApJS, 218, 33
- Bertin & Arnouts (1996) Bertin E., Arnouts S., 1996, A&AS, 117, 393
- Bradley et al. (2022) Bradley L., et al., 2022, astropy/photutils: 1.5.0, doi:10.5281/zenodo.6825092, https://doi.org/10.5281/zenodo.6825092
- Caputi et al. (2007) Caputi K. I., et al., 2007, ApJ, 660, 97
- Cowley et al. (2018) Cowley W. I., Baugh C. M., Cole S., Frenk C. S., Lacey C. G., 2018, MNRAS, 474, 2352
- Davidge et al. (2017) Davidge H., Serjeant S., Pearson C., Matsuhara H., Wada T., Dryer B., Barrufet L., 2017, MNRAS, 472, 4259
- Elbaz et al. (1999) Elbaz D., et al., 1999, Astron. Astrophys., 351, L37
- Elbaz et al. (2002) Elbaz D., Cesarsky C. J., Chanial P., Aussel H., Franceschini A., Fadda D., Chary R. R., 2002, A&A, 384, 848
- Fazio et al. (2004) Fazio G. G., et al., 2004, ApJS, 154, 39
- Finkelstein et al. (2017) Finkelstein S. L., et al., 2017, The Cosmic Evolution Early Release Science (CEERS) Survey, JWST Proposal ID 1345. Cycle 0 Early Release Science
- Gardner et al. (2006) Gardner J. P., et al., 2006, Space Sci. Rev., 123, 485
- Gehrels (1986) Gehrels N., 1986, ApJ, 303, 336
- Goto et al. (2010) Goto T., et al., 2010, A&A, 514, A6
- Gruppioni et al. (2002) Gruppioni C., Lari C., Pozzi F., Zamorani G., Franceschini A., Oliver S., Rowan-Robinson M., Serjeant S., 2002, MNRAS, 335, 831
- Gruppioni et al. (2010) Gruppioni C., et al., 2010, A&A, 518, L27
- Gruppioni et al. (2011) Gruppioni C., Pozzi F., Zamorani G., Vignali C., 2011, MNRAS, 416, 70
- Kalirai (2018) Kalirai J., 2018, Contemporary Physics, 59, 251
- Kessler et al. (1996) Kessler M. F., et al., 1996, A&A, 315, L27
- Ling et al. (2022) Ling C.-T., et al., 2022, Monthly Notices of the Royal Astronomical Society, 517, 853
- Murakami et al. (2007) Murakami H., et al., 2007, PASJ, 59, S369
- Neugebauer et al. (1984) Neugebauer G., et al., 1984, ApJ, 278, L1
- Papovich et al. (2004) Papovich C., et al., 2004, ApJS, 154, 70
- Pearson (2005) Pearson C., 2005, MNRAS, 358, 1417
- Pearson et al. (2010) Pearson C. P., et al., 2010, A&A, 514, A8
- Pearson et al. (2014) Pearson C. P., et al., 2014, MNRAS, 444, 846
- Pilbratt et al. (2010) Pilbratt G. L., et al., 2010, A&A, 518, L1
- Planck Collaboration et al. (2016) Planck Collaboration et al., 2016, A&A, 594, A13
- Rocca-Volmerange et al. (2007) Rocca-Volmerange B., de Lapparent V., Seymour N., Fioc M., 2007, A&A, 475, 801
- Rowan-Robinson et al. (1997) Rowan-Robinson M., et al., 1997, MNRAS, 289, 490
- Saunders et al. (1990) Saunders W., Rowan-Robinson M., Lawrence A., Efstathiou G., Kaiser N., Ellis R. S., Frenk C. S., 1990, MNRAS, 242, 318
- Takagi et al. (2012) Takagi T., et al., 2012, A&A, 537, A24
- Wada et al. (2008) Wada T., et al., 2008, PASJ, 60, S517
- Werner et al. (2004) Werner M. W., et al., 2004, ApJS, 154, 1
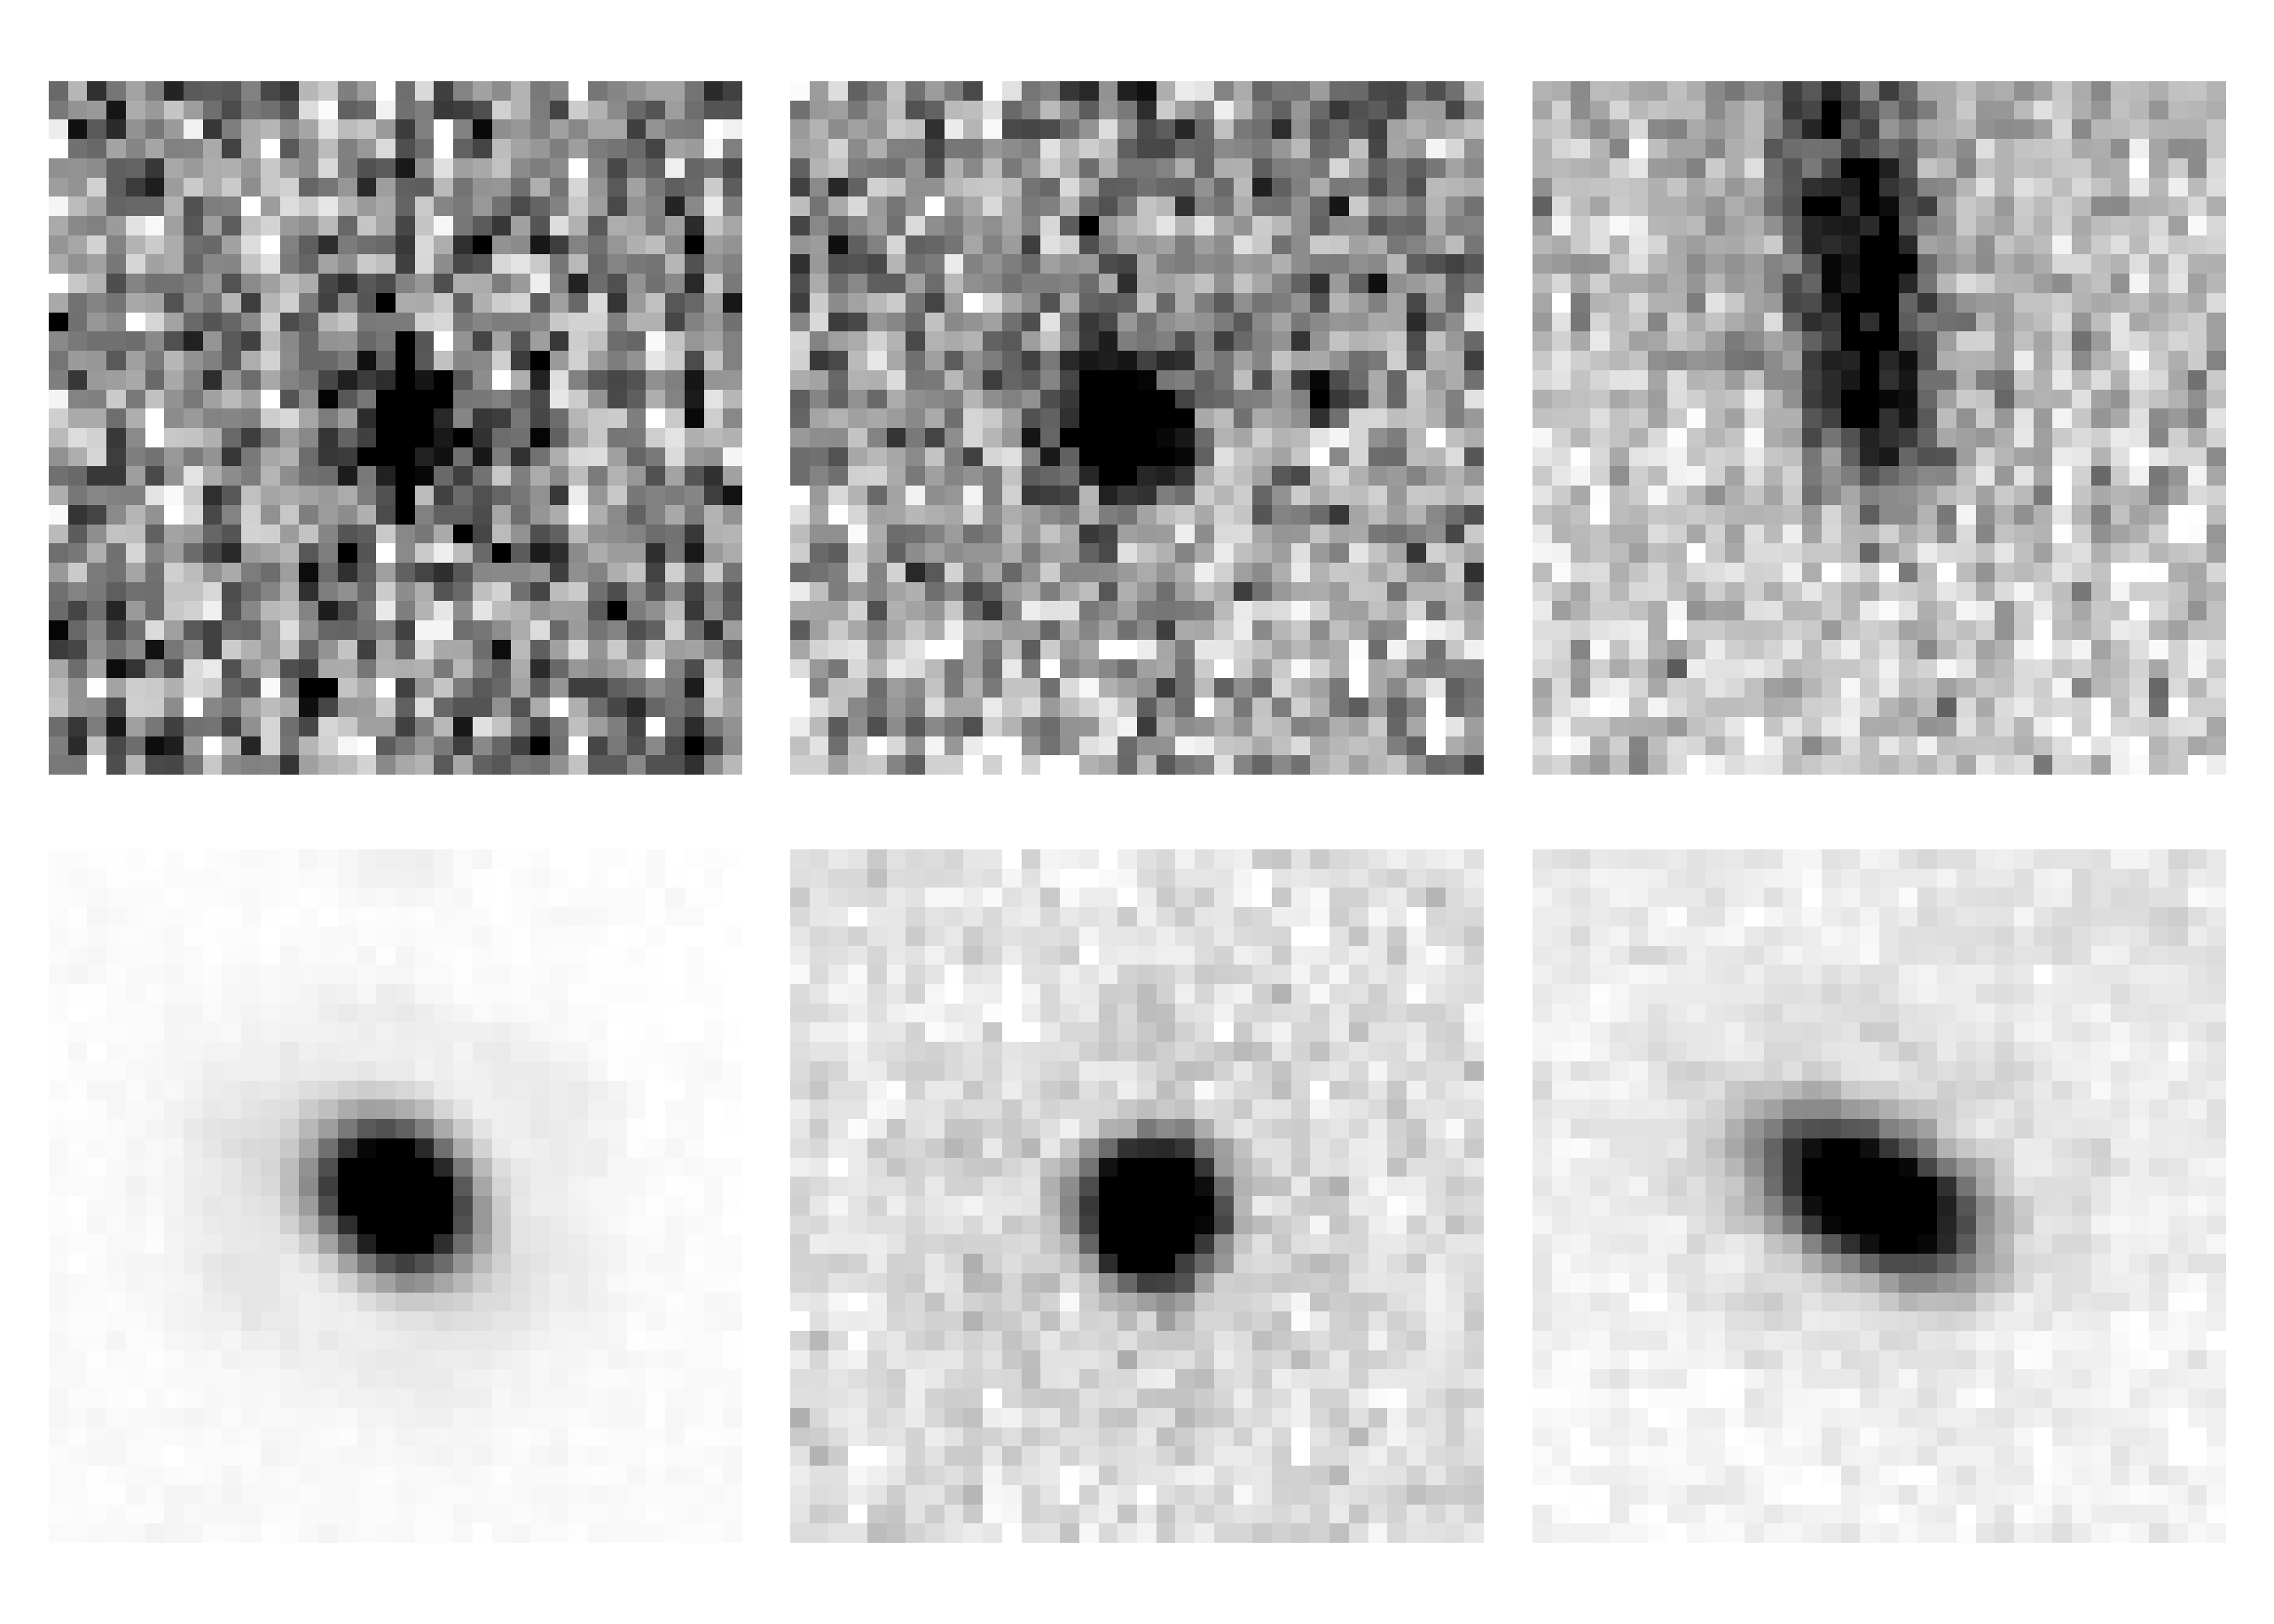
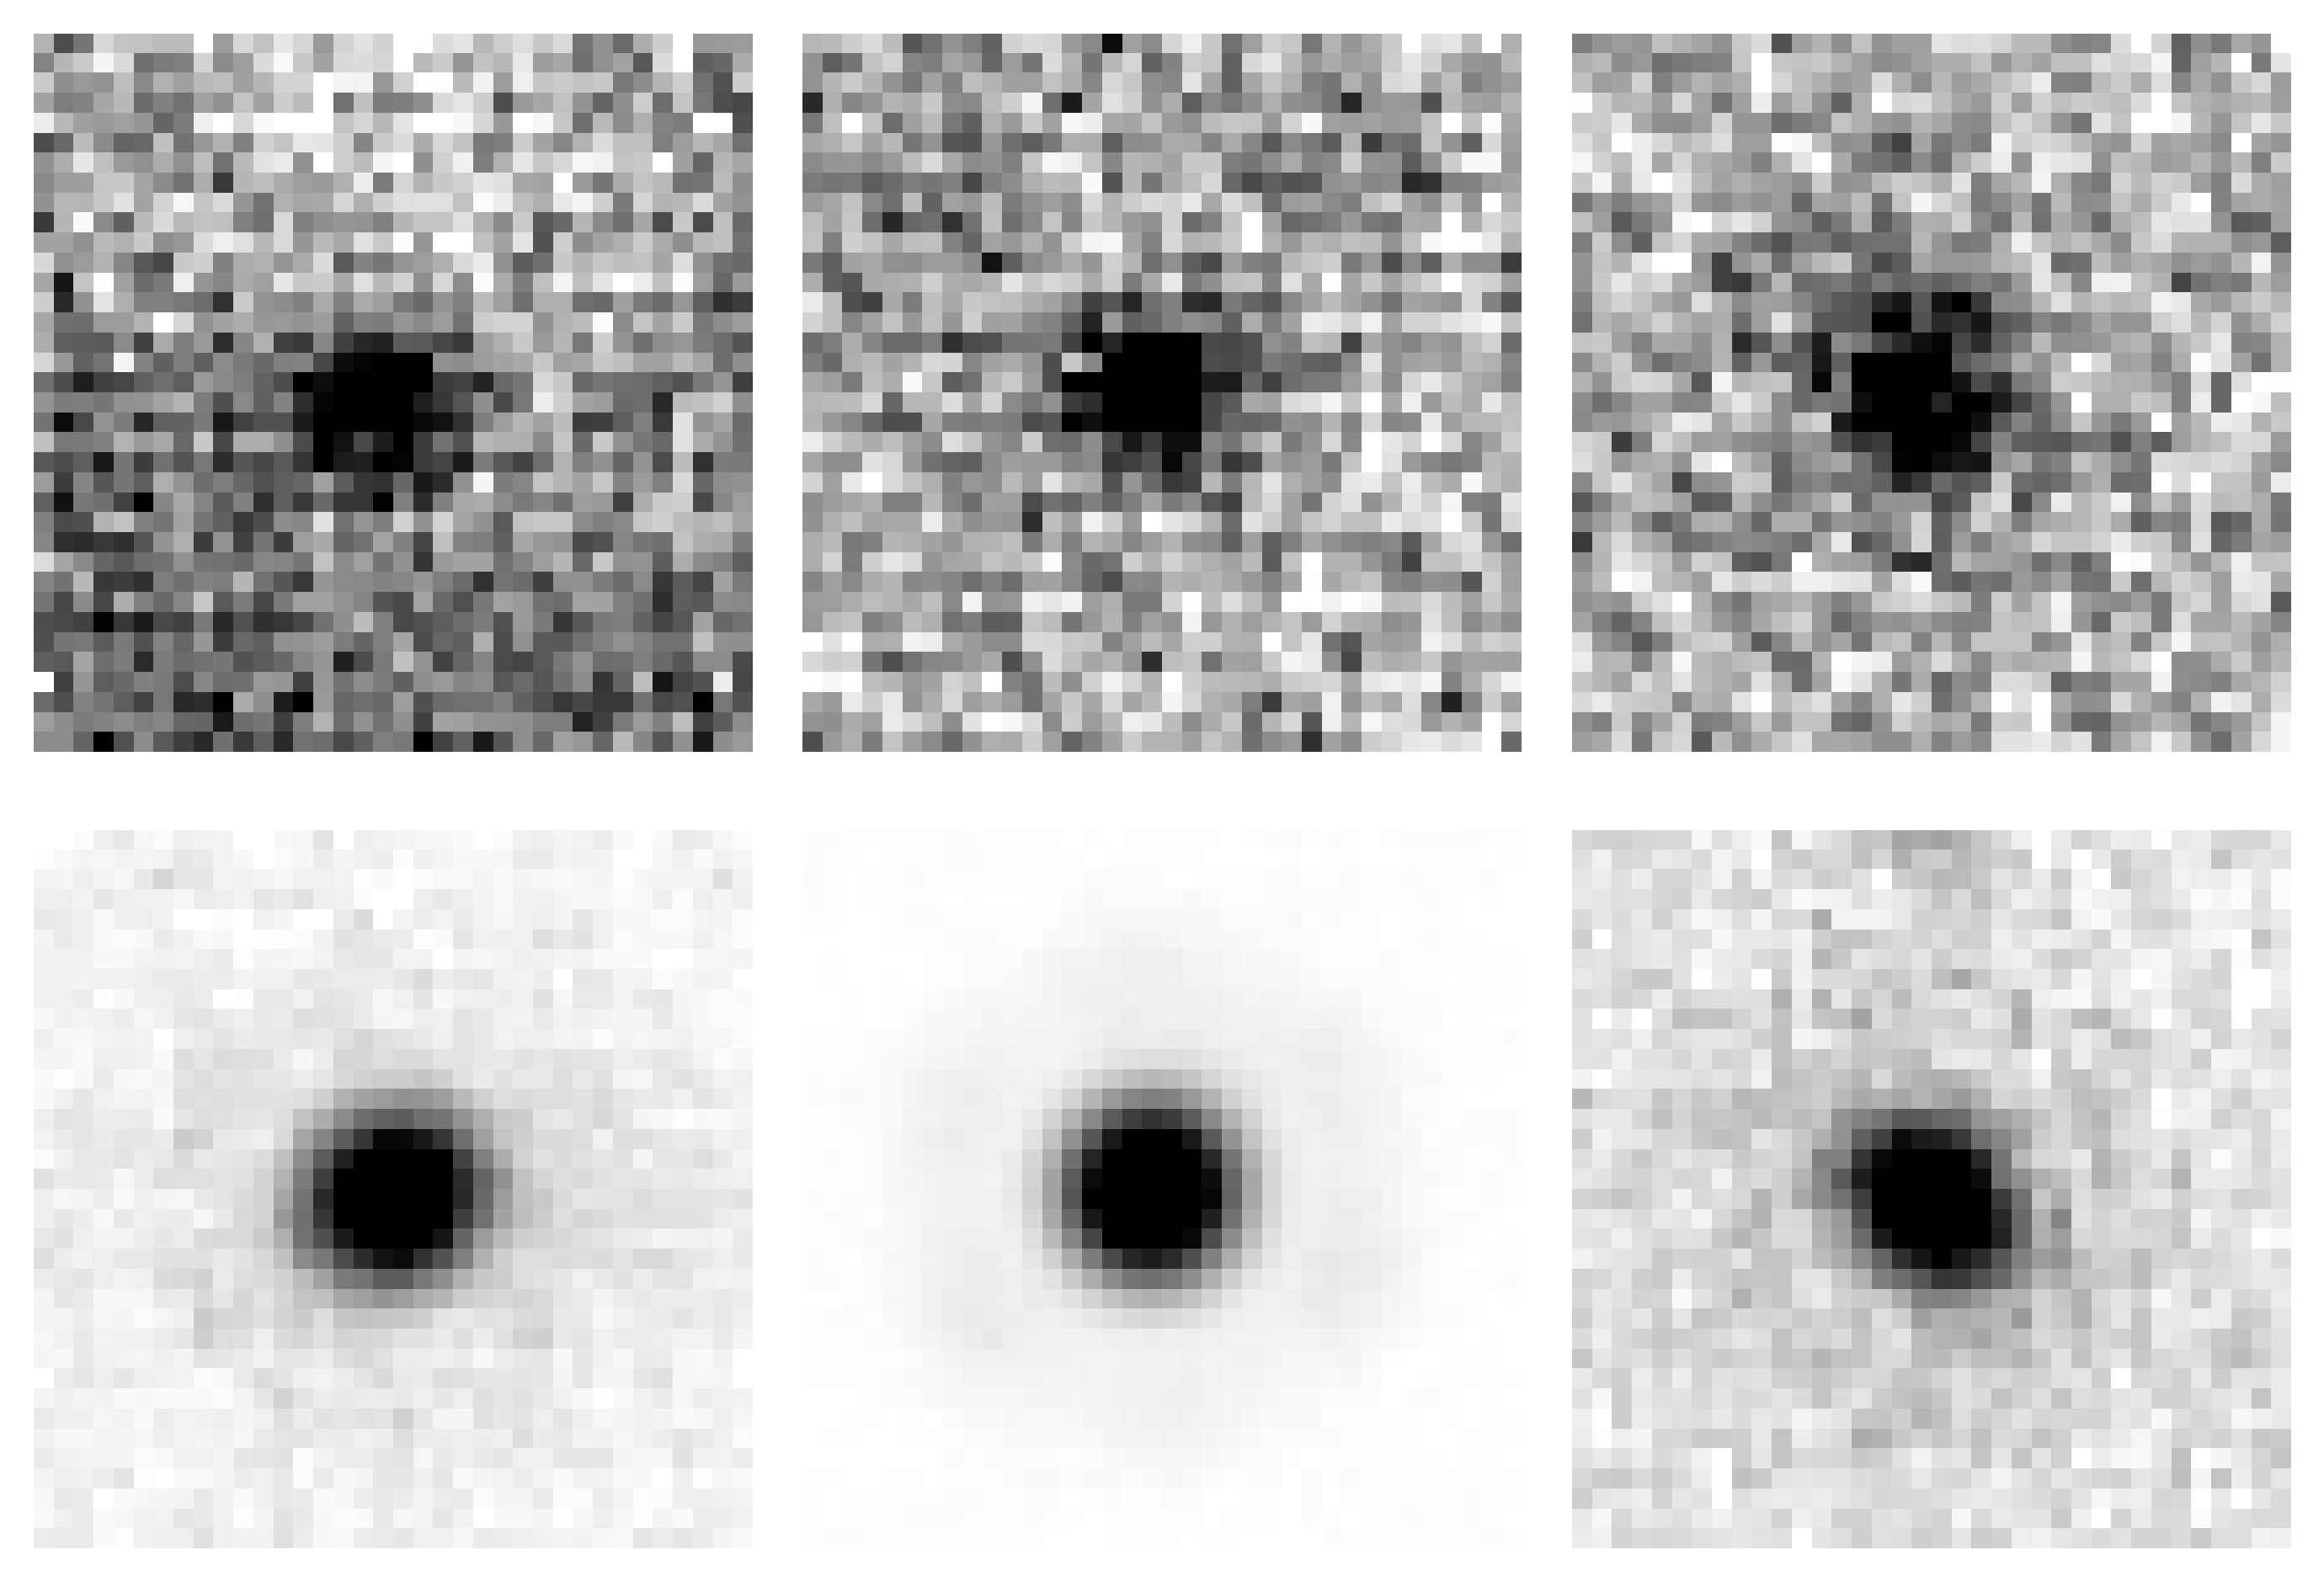
Appendix A Appendix
Here we put the randomly selected example sources from each band of the JWST MIRI filter to demonstrate differences in flux levels. The fluxes of the objects in the first row are roughly at the o001 (o002) 80% completeness: 0.25 (0.25), 0.63 (0.63), 1.26 (1.26), 2.0 (2.0), 5.0 (5.0), and 13 (16) Jy for different filters, respectively. While the images in the second row are 10 to 1000 times brighter.