School of Physical Sciences, University of Science and Technology of China, Hefei 230026, China \alsoaffiliationCollaborative Innovation Center of Extreme Optics, Shanxi University, Taiyuan, Shanxi 030006, China \altaffiliationPeking University Yangtze Delta Institute of Optoelectronics, Nantong, China
![[Uncaptioned image]](/html/2209.01818/assets/x1.png)
Identification of the decay pathway of photoexcited nucleobases
Abstract
The identification of the decay pathway of the nucleobase uracil after being photoexcited by ultraviolet (UV) light has been a long standing problem. Various theoretical models have been proposed but yet to be verified. Here we propose an experimental scheme to test the theoretical models by a combination of ultrafast X-ray spectroscopy, X-ray diffraction and electron diffraction methods. Incorporating the signatures of multiple probing methods, we demonstrate an approach to identify the pathway of the geometric and electronic relaxation of the photoexcited uracil molecule.
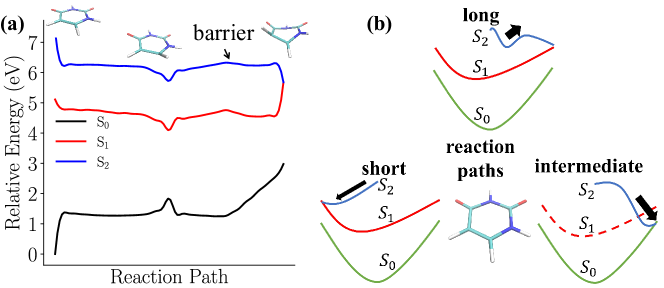
Ultraviolet photons in the sunlight can excite biological molecules, and the photoexcited molecules then experience different interatomic potential energies, which may induce unexpected reactions, such as dimethylation of RNA and DNA molecules, and seriously harm the biological functions of the molecules 1, 2. In order to survive from the photodamage, living things seem to have chosen a special set of molecules as building blocks, which can decay rapidly at an ultrafast time scale via nonadiabatic pathways before harmful reactions take place 3, 4. However, surprisingly, it was proposed that uracil, one of the nucleobases, could have a different property when being photoexcited to the singlet state S2 by UV light. Theoretical investigations showed that uracil may have a significantly longer electronic decay time up to picoseconds (ps) from the photoexcited state, because of a hypothetical barrier blocking the pathway to the conical intersection (CI) between the S2/S1 states (see Fig. 1(a)) 5. CI is a diabolical point in the potential energy surface caused by point-wise degeneracy of different electronic states and provides an ultrafast route of nonadiabatic electronic decay 6, 7, 8, 9. The instability of RNA due to the long decay time of photoexcited uracil may result in gene mutations and evolution of life. On the other hand, the proposal of ps long decay time of uracil is challenged by the follow-up studies 10, 11, 12, 13, 14, 15, 16, 17, because the predicted potential barrier of 0.2 eV is very shallow, and due to the precision limit of quantum chemical calculations, different methods give contradictory predictions of electronic decay pathways.
The controversial predictions cover various time scales of electronic decay from the photoexcited S2 state (see Fig. 1(b)). The long trajectory hypothesis 5 assumes that the relaxation is a two-step process. After being excited to S2 from the ground state at the Franck-Condon (FC) region, the uracil first takes 100 fs to relax to a deformed geometry of minimal energy (ME) in the S2 state, and then reaches the minimal energy conical intersection (MECI) between S2 and S1 states for the electronic decay, which could take picoseconds (ps) because of the potential energy barrier of about 0.2 eV, as shown in Fig. 1(a). The short trajectory hypothesis assumes that the uracil decays to S1 in about 70 fs, and the nonadiabatic transition follows rapidly for an undistorted geometry 11. The intermediate trajectory hypothesis points to the third possibility of the decay pathway. The uracil can partially circumvent the barrier and evolve to a CI point between S2 and S0 within 0.7 ps, which is energetically not favored but can result in direct transition to the ground state S0 10, and the intermediate state S1 does not participate in this pathway.
Here we propose an approach to resolve the debate, which can uniquely identify the electronic decay mechanism of the photoexcited uracil by means of ultrafast X-ray spectroscopy and coherent diffraction imaging. We demonstrate that the combined ultrafast spectroscopic and diffraction signals can unambiguously distinguish the decay models from each other. The ultrafast electron diffraction (UED) is capable of characterizing the evolving electronic correlation 19 and molecular geometry 20, and can be used to monitor the electronic population transfer and transient structural dynamics 21, 22. The ultrafast X-ray diffraction (UXD), though less sensitive to electron correlation, is free of pulse length limitation of UED due to space charge effect of electron bunch compression. For UXD with attosecond time resolution 23, 24, it can resolve the transient geometric structure with higher temporal precision. The X-ray photoelectron spectroscopy (XPS) equipped with the ultrashort X-ray pulses from free electron lasers (FEL) provides the toolkit to map out the valence electron density variation in the chosen atomic sites of molecules in the excited state. Incorporating the mixed quantum-classical surface hopping molecular dynamics (MD) method 25, we simulate the trajectories that follow the long trajectory hypothesis, using the ab initio five-state-averaged complete active space self-consistent field method with 8 active electrons in 6 orbitals (SA5-CASSCF(8,6)) and 6-31g* basis set 5, in order to show that a joint analysis based on UED, UXD and XPS data can test this hypothesis. The surface hopping MD simulation of photoexcited uracil and the calculation of spectral and diffraction observables are carried out using the SHARC package 26, 15, and the quantum chemistry packages Molpro 27 and Terachem 28, respectively (see details of the MD simulation in Supplementary Information [SI]).
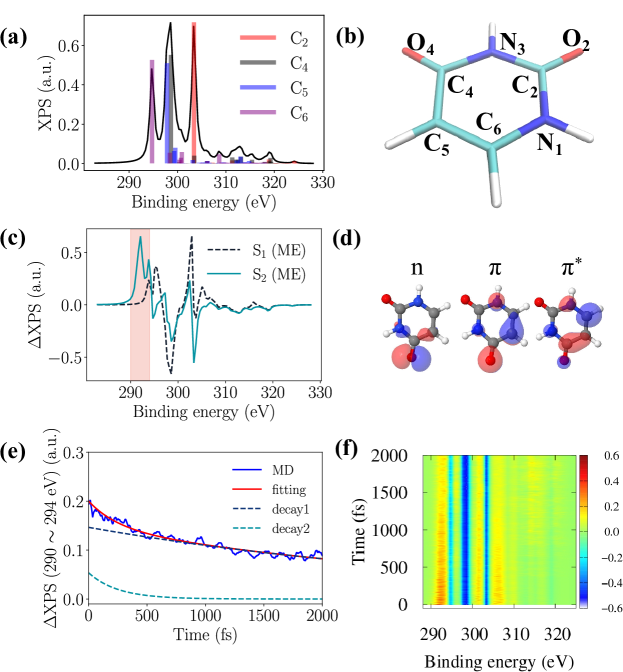
Choosing the carbon K-edge for the X-ray probe, the shift of photoelectron energy of XPS in the molecule compared to that of carbon atom reflects the strength of electron screening of nuclear charge 29, and maps out the local density of valence electrons at the specific atom, from which the 1s core electron is ionized, as shown in Fig. 2(a). Because the excitation to the S1 and S2 states is accompanied by the flow of valence electrons from the non-bonding () and bonding orbitals to the antibonding orbital of uracil, the deficit and excess of valence electron density on the four individual carbon atoms gives the blue- and red-shift of carbon 1s binding energies in the XPS spectra, respectively (see Fig. 2(b)). In the SI, we present the XPS spectra of uracil in the states involved in the MD simulation, including the singlet and triplet excited states. The Mulliken charge analysis of several representative geometries in the long trajectory hypothesis of electronic decay dynamics is shown in Table. 1. The most evident change is the increase of electronic density on \ceC5 atom in the S2 state, which leads to the red-shift of carbon 1s binding energy followed by the positive peak at 290 eV and the negative peak at 300 eV of XPS of S2, as shown in Fig. 2(c). The change of XPS intensity around 290 eV (shown as shaded area of Fig. 2(c)) can be uniquely linked to the evolution population of excited state S2, because the contribution of S1 in this spectral range is negligible.
| \ceC2 | \ceC4 | \ceC5 | \ceC6 | |
|---|---|---|---|---|
| FC (S0) | +1.05 | +0.81 | -0.32 | +0.17 |
| FC (S2) | +1.05 | +0.75 | -0.53 | +0.13 |
| ME (S1) | +1.08 | +0.69 | -0.33 | +0.05 |
| ME (S2) | +1.04 | +0.77 | -0.46 | +0.12 |
However, apart from the transition of electronic states, the change of molecular geometry can also affect the spectral shift and intensity of XPS, which mixes with the effect from the transition of electronic states and thus prohibits an unambiguous mapping of time-dependent XPS signals to the electronic population evolution (see simulated XPS of different states and geometries in the SI). To quantitatively extract the characteristic time constants of the electronic decay out of the S2 () state and nuclear relaxation in the decay of photoexcited uracil, we apply bi-exponential fitting on XPS 15, 30,
| (1) |
where is the initial intensity of the XPS signal, and quantifies the relative components of the geometric and electronic relaxation processes (see details of the fitting procedure in SI). However, the two time constants fs and fs can not be unambiguously assigned to the characteristic time scale of geometric relaxation and electronic decay , as the fitting model makes no assumptions about the physics of the temporal trajectory, but only quantifies the time scales of the reactions 31. In order to resolve this difficulty, we propose a multi-signal analysis using spectroscopic (XPS) and diffraction (UED and UXD) signals to investigate these two processes and validate the two time constants, which can be uniquely assigned to the different types of relaxation processes.
Ultrafast electron diffraction (UED) provides a tool for retrieving transient molecular structural and electronic dynamics simultaneously, and exhibits high sensitivity for measuring electronic correlations from small angle scattering signals 19. The intensities of the elastic and inelastic scattering signals are
| (2) |
| (3) |
where is the momentum transfer of electrons, and are the nuclear charge and position of the -th atom, is the number of electrons in the molecule, and are the Fourier transforms of one-electron density and two-electron density ,
| (4) |
| (5) |
The inelastic scattering intensity dominates at small scattering angles as shown in the shaded area of Fig. 3(a). Because the inelastic electron scattering is dependent on the Fourier transform of the two-electron density , it measures the changes in the electron correlation due to the transitions of electronic states. In contrast, the elastic scattering signal dominates at larger scattering angles, and encodes the transient structural information characterized by the atomic charge pair distribution functions (CPDF) 22, 32, which is given by
| (6) |
where is the isotropic average of total UED signal including both elastic and inelastic components. The damping term with is introduced to avoid edge effects during the transform 32.
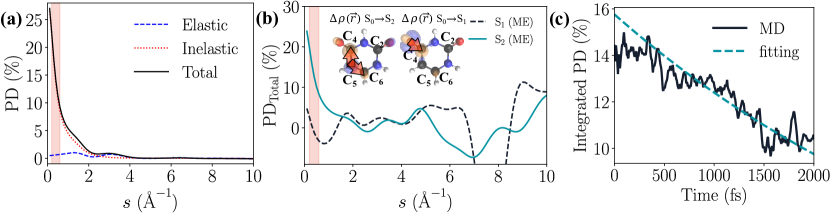
We define the percentage difference (PD) of the UED signal as
| (7) |
where is the UED signal in the equilibrium geometry of the ground state and is that of excited states. The S1 state is mainly from the excitation of the localized non-bonding orbital to delocalized C-O antibonding orbital relative to the ground state S0 (see Fig. 3(b)), which is accompanied by the enlarged two-electron distance and thus the reduction of electronic Coulomb repulsion and the electron correlation. Such process must result in the enhancement of inelastic scattering signals at small scattering angles, thus S1 has weaker electron correlation than that of S0. The excitation to S2 state accompanied by the transition between two delocalized orbitals and leads to longer range electron flow around the molecular ring. As shown in Fig. 3(b), the electrons relocate from \ceC5 atom to two nearest neighbor atoms \ceC4 and \ceC6, which forms a more delocalized electron density distribution and results in larger PD of inelastic signal than S1 state in the small region.
Due to the evident PDs of the inelastic scattering signals for S2 (20%) and S1 (10%) at small angles (0.20.6Å-1) (see Fig. 3(b)) as well as for other relevant states (see SI), the inelastic signal can serve as a sensitive probe for the transition of electronic states. We show the PD of the inelastic signal calculated from MD trajectories in Fig. 3(c), and fit PD() with an exponential function as The time constant extracted from the fitting is fs, which qualitatively matches the magnitude of electronic decay time constant by time-resolved XPS analysis (XPS), and correctly reflects the corresponding parameter of the long trajectory model. However, the fast geometric relaxation 5 could pose a challenge to UED, because its time resolution is partially limited by the space charge effect of the electron pulses. On the other hand, the sub-100 fs structural dynamics can be well resolved by UXD using ultrashort X-ray pulses from X-ray free electron lasers (XFEL), which can reach an attosecond time resolution 23, 24.
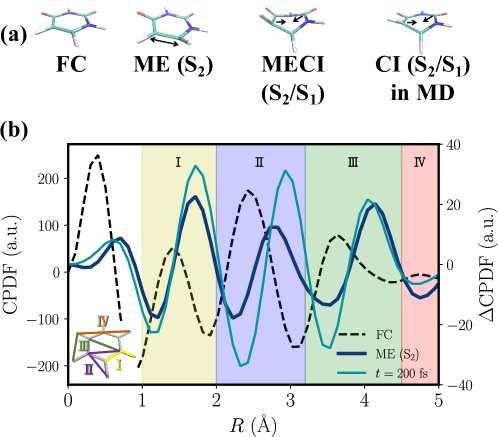
To reveal the molecular dynamical information in the simulated UXD data, we apply the spectral and autocorrelation analysis to the charge pair distribution functions (CPDF). As shown in Fig. 4(b), the black line is the CPDF of uracil at equilibrium FC point. The peak at Å is contributed by inelastic diffraction, which reflects the electron-electron correlation. The negative CPDF at Å comes from the electron-nucleus pairs. Longer range interactions dominate the other peaks, in which the structural information of the atomic positions in the molecule is encoded 32. The peak at Å comes from the elastic scattering of the nearest neighbour (NN) atom pairs, dubbed the 1st shell. The third peak (at Å) comes from the next nearest neighbour (NNN) atomic pairs, dubbed the 2nd shell. The fourth peak at Å corresponds to the second atomic coordination shell (the distances between atoms are two atomic sites; 3rd shell). The fifth peak comes from the third coordination shell (the distances between atoms are three atomic sites; 4th shell). The CPDF of charge pairs of various shells are shown in Fig. 4(b), marked by I(yellow), II(purple), III(green) and IV(red), respectively. The first three geometries in Fig. 4(a) are the same representative configurations as those in Fig. 1(a) along the reaction path in the S2 state. A representative CI structure in the MD trajectories is shown in Fig. 4(a). The CPDF of other shells are shown in SI. According to Fig. 4(b), as uracil moves toward ME (S2), the charge pair density in the 1st shell increases. These variations of shells manifest themselves clearly in the elastic scattering signal. As shown in the CPDF signal at ME (S2) in Fig. 4(b), compared with CPDF signal at FC, the peak intensity of the 1st shell of CPDF moves toward larger . We also show the CPDF signal at 200 fs from MD trajectories, which is a representative time point near ME (S2). It exhibits similar positive peak at Å and negative peak at Å, and indicates the bond length of \ceC5-\ceC6 atoms for ME (S2) that is the dominant driving reaction coordinate for geometrical relaxation of photoexcited uracil in the long trajectory model 5. These stretching modes of the \ceC5 and \ceC6 atoms are the focus of our quantitative analysis of the structural dynamics. To capture the characteristic signatures of the structural evolution, we apply the continuous wavelet transform (CWT) analysis to the autocorrelation function of CPDF() from the simulated time-resolved ultrafast X-ray diffraction (UXD) signal, which gives the frequency spectra of nuclear motions with largest amplitudes at each time points. The autocorrelation function is given by
| (8) |
calculated from a swarm of MD trajectories, where , are the boundaries of 1st atomic shell, and is detrended by a baseline fitted to the exponential model (see details in SI), giving
| (9) |
In the long trajectory model, the driving mode corresponds to the \ceC5-\ceC6 stretching, which is active in the first 500 fs 5. As shown in the wavelet transformed spectra (Fig. 5(a)) and the exponential fitting (Fig. 5(c)) of the evolution of the \ceC5-\ceC6 bond length from MD trajectories, the vibrational spectrum peaks around 30 THz at the beginning in the S2 state for to a period of 33 fs, and this geometric stretching mode dominates around 185 fs. The frequencies of the major modes match that in Fig. 5(b), which is obtained from wavelet transform of autocorrelation function of the 1st shell. Time-dependent frequency spectra of nuclear motion in other shells are shown in the SI. The time constant of the major modes (Fig. 5(d)), 243 fs, is also obtained from the exponential fitting of wavelet transform of autocorrelation function of the 1st shell CPDF. The analysis shows that the geometric relaxation time scale of 0.5 ps in the long trajectory model can be qualitatively obtained via the time-dependent frequency analysis of ultrafast diffraction with sufficient time resolution.
We have shown that the characteristic time scales of geometric relaxation and electronic decay in the long trajectory model can be faithfully retrieved by incorporating time-resolved XPS, UED and UXD analysis. In the long trajectory model, the relaxation mechanism of photoexcited uracil is comprised of two processes. One is the fast geometric relaxation with the characteristic time ps, and the other is a slower transition of the electronic state to S1 with a characteristic time ps. It is important to note that none of the three methodologies alone can determine the characteristic time constants of the two competing relaxation processes of uracil involving nuclear and electronic degrees of freedom.
With the same method, one can test the intermediate and short trajectory hypotheses by experimental measurements. These two hypotheses have one major process that is different from the two-step model in the long trajectory hypothesis. The molecule tends to directly find the decaying geometry in the S2 state, without first evolving to the minimum energy geometry as in the long trajectory hypothesis. In the short trajectory model (Fig. 1(b)), the characteristic time of the electronic decay from S2 to S1 is less than 100 fs and the molecule keeps the plane geometry, and the conical intersection is very close to the Franck-Condon region in the S2 state 11. In this case, the XPS spectral components of S2 must decay within 100 fs, which can be observed both in the XPS and the inelastic signal of UED. The CI point in the short trajectory model has a stretched \ceC5-\ceC6 bond without the ring-folding characteristic, and the peaks of CPDF are expected to move toward larger in sub-100 fs and a similar peak of \ceC5-\ceC6 stretching oscillation should appear in the time-frequency analysis of the UXD autocorrelation function. If the molecule decays along the intermediate pathway as shown in Fig. 1(b), photoexcited uracil will follow the S2 state potential energy surface until reaching an ethylenic CI point between S2 and S0 10, which can then decay to the S0 ground state in fs. In this process, it is expected that the geoemtric relaxation possesses the same time constant as the electronic decay, i.e. 700 fs, and can be mapped out by XPS and the inelastic part of UED. The UXD offers complementary evidence for the structural dynamics in finding the S2/S0 intersection, which should be driven by a small set of reaction coordinates 31. Such driving coordinates can be revealed by the time-frequency analysis of UXD.
While the predicted phenomena have not yet been fully examined experimentally, they are within reach of the capabilities of free electron lasers and ultrafast electron diffraction facilities. Our study demonstrates the synergy of the X-ray photoelectron spectroscopy, and the electron and X-ray diffraction with ultrafast time resolution. The approach can also serve as a general methodological toolkit for investigating valence electron and structural dynamics in ultrafast photochemistry.
1 METHODS
1.1 X-ray photoelectron spectra
Under dipole approximation, the ionization rate from the initial state with energy is
| (10) |
where the final state includes the molecular cationic state with energy and the ejected electron state with energy , is the X-ray photon energy, and are the electronic dipole operator and the electric field of X-ray. In the second-quantized form,
| (11) |
where are orbital indexes including all bounded and continuum states, and orbital index is restricted to be the carbon 1s orbital. and are matrix elements of transition dipole moment between corresponding initial and final orbitals. Replace by their average value which is only dependent of the energy of the ejected electron , then
| (12) |
The sum over all ejected electron states is proportional to the factor , which is the density of states. For photoionization in low energy region far from resonance, the product can be treated as a constant 5, so
| (13) |
The calculation involves three initial states S0, S1 and S2, and different cationic final states with 1s-1 hole located at different carbon atoms are considered separately, as shown in Fig. 2(a). For each carbon 1s-1 hole, 50 cationic final states with lowest energy are involved in the calculation.
The SI contains the initial conditions for molecular dynamics, population dynamics, X-ray photoelectron spectrum (XPS) for various electronic states and molecular geometries, fitting result of time resolved XPS, ultrafast electron diffraction analysis with comparison between S2 state at FC point and S2 state at ME point, and time-frequency analysis of various atomic shells.
This work was supported by the National Natural Science Foundation of China (No. 12174009, 11974031). We thank Todd J. Martinez, Fang Liu, Basile Curchod and Ludger Inhester for helpful discussions. NM gratefully acknowledges financial support from the Czech Ministry of Education, Youth and Sports (grants No. LTT17015, LM2018114, and EF16_013/0001552).
Author Contributions
M.X.X. and M.Z. contributed equally to this work.
References
- Smith et al. 1997 Smith, D. M. A.; Smets, J.; Elkadi, Y.; Adamowicz, L. Methylation Reduces Electron Affinity of Uracil. Ab Initio Theoretical Study. J. Phys. Chem. A 1997, 101, 8123
- Steenken et al. 1992 Steenken, S.; Telo, J. P.; Novais, H. M.; Candeias, L. P. One-Electron-Reduction Potentials of Pyrimidine Bases, Nucleosides, and Nucleotides in Aqueous Solution. Consequences for DNA Redox Chemistry. J. Am. Chem. Soc. 1992, 114, 4701
- Wolf et al. 2019 Wolf, T. J. A.; Parrish, R. M.; Myhre, R. H.; Martínez, T. J.; Koch, H.; Gühr, M. Observation of Ultrafast Intersystem Crossing in Thymine by Extreme Ultraviolet Time-Resolved Photoelectron Spectroscopy. J. Phys. Chem. A 2019, 123, 6897–6903
- Prokhorenko et al. 2016 Prokhorenko, V. I.; Picchiotti, A.; Pola, M.; Dijkstra, A. G.; Miller, R. J. D. New Insights into the Photophysics of DNA Nucleobases. J. Phys. Chem. Lett. 2016, 7, 4445–4450
- Hudock et al. 2007 Hudock, H. R.; Levine, B. G.; Thompson, A. L.; Satzger, H.; Townsend, D.; Gador, N.; Ullrich, S.; Stolow, A.; Martínez, T. J. Ab Initio Molecular Dynamics and Time-Resolved Photoelectron Spectroscopy of Electronically Excited Uracil and Thymine. J. Phys. Chem. A 2007, 111, 8500
- Yarkony 1996 Yarkony, D. R. Diabolical conical intersections. Rev. Mod. Phys. 1996, 68, 985
- Boggio-Pasqua et al. 2002 Boggio-Pasqua, M.; Bearpark, M. J.; Hunt, P. A.; Robb, M. A. Dihydroazulene/Vinylheptafulvene Photochromism: A Model for One-Way Photochemistry via a Conical Intersection. J. Am. Chem. Soc. 2002, 124, 1456
- Worth and Cederbaum 2004 Worth, G. A.; Cederbaum, L. S. Beyond Born-Oppenheimer: Molecular Dynamics Through A Conical Intersection. Annu. Rev. Phys. Chem. 2004, 55, 127
- Domcke and Yarkony 2012 Domcke, W.; Yarkony, D. R. Role of Conical Intersections in Molecular Spectroscopy and Photoinduced Chemical Dynamics. Annu. Rev. Phys. Chem. 2012, 63, 325
- Nachtigallová et al. 2011 Nachtigallová, D.; Aquino, A. J. A.; Szymczak, J. J.; Barbatti, M.; Hobza, P.; Lischka, H. Nonadiabatic Dynamics of Uracil: Population Split among Different Decay Mechanisms. J. Phys. Chem. A 2011, 115, 5247–5255
- Lan et al. 2009 Lan, Z.; Fabiano, E.; Thiel, W. Photoinduced Nonadiabatic Dynamics of Pyrimidine Nucleobases: On-the-Fly Surface-Hopping Study with Semiempirical Methods. J. Phys. Chem. B 2009, 113, 3548–3555
- Chakraborty et al. 2021 Chakraborty, P.; Liu, Y.; McClung, S.; Weinacht, T.; Matsika, S. Time Resolved Photoelectron Spectroscopy as a Test of Electronic Structure and Nonadiabatic Dynamics. J. Phys. Chem. Lett. 2021, 12, 5099–5104
- Fingerhut et al. 2013 Fingerhut, B. P.; Dorfman, K. E.; Mukamel, S. Monitoring Nonadiabatic Dynamics of the RNA Base Uracil by UV Pump–IR Probe Spectroscopy. J. Phys. Chem. Lett. 2013, 4, 1933
- Hua et al. 2019 Hua, W.; Mukamel, S.; Luo, Y. Transient X-Ray Absorption Spectral Fingerprints of the S 1 Dark State in Uracil. J. Phys. Chem. Lett. 2019, 10, 7172
- Richter et al. 2014 Richter, M.; Mai, S.; Marquetand, P.; González, L. Ultrafast intersystem crossing dynamics in uracil unravelled by ab initio molecular dynamics. Phys. Chem. Chem. Phys. 2014, 16, 24423–24436
- Brister and Crespo-Hernández 2015 Brister, M. M.; Crespo-Hernández, C. E. Direct Observation of Triplet-State Population Dynamics in the RNA Uracil Derivative 1-Cyclohexyluracil. J. Phys. Chem. Lett. 2015, 6, 4404–4409
- Nam et al. 2021 Nam, Y.; Keefer, D.; Nenov, A.; Conti, I.; Aleotti, F.; Segatta, F.; Lee, J. Y.; Garavelli, M.; Mukamel, S. Conical Intersection Passages of Molecules Probed by X-Ray Diffraction and Stimulated Raman Spectroscopy. J. Phys. Chem. Lett. 2021, 12, 12300
- Berne et al. 1998 Berne, B. J.; Ciccotti, G.; Coker, D. F. Classical and quantum dynamics in condensed phase simulations: Proceedings of the International School of Physics; World Scientific, 1998; p 385
- Yang et al. 2020 Yang, J.; Zhu, X.; Nunes, J. P. F.; Yu, J. K.; Parrish, R. M.; Wolf, T. J. A.; Centurion, M.; Gühr, M.; Li, R.; Liu, Y. et al. Simultaneous Observation of Nuclear and Electronic Dynamics by Ultrafast Electron Diffraction. Science 2020, 6
- Yang et al. 2018 Yang, J.; Zhu, X.; Wolf, T. J. A.; Li, Z.; Pedro Nunes, J. F.; Coffee, R.; Cryan, J. P.; Gühr, M.; Hegazy, K.; Heinz, T. F. et al. Imaging CF3I conical intersection and photodissociation dynamics with ultrafast electron diffraction. Science 2018, 361, 64–67
- Yang et al. 2018 Yang, J.; Zhu, X.; Wolf, T. J. A.; Li, Z.; Nunes, J. P. F.; Coffee, R.; Cryan, J. P.; Gühr, M.; Hegazy, K.; Heinz, T. F. et al. Imaging CF3I Conical Intersection and Photodissociation Dynamics with Ultrafast Electron Diffraction. Science 2018, 361, 64
- Wolf et al. 2019 Wolf, T. J. A.; Sanchez, D. M.; Yang, J.; Parrish, R. M.; Nunes, J. P. F.; Centurion, M.; Coffee, R.; Cryan, J. P.; Gühr, M.; Hegazy, K. et al. The Photochemical Ring-Opening of 1,3-Cyclohexadiene Imaged by Ultrafast Electron Diffraction. Nature Chem. 2019, 11, 504
- Duris et al. 2020 Duris, J.; Li, S.; Driver, T.; Champenois, E. G.; MacArthur, J. P.; Lutman, A. A.; Zhang, Z.; Rosenberger, P.; Aldrich, J. W.; Coffee, R. et al. Tunable Isolated Attosecond X-Ray Pulses with Gigawatt Peak Power from a Free-Electron Laser. Nature Photonics 2020, 14, 30
- Duris et al. 2021 Duris, J. P.; MacArthur, J. P.; Glownia, J. M.; Li, S.; Vetter, S.; Miahnahri, A.; Coffee, R.; Hering, P.; Fry, A.; Welch, M. E. et al. Controllable X-Ray Pulse Trains from Enhanced Self-Amplified Spontaneous Emission. Phys. Rev. Lett. 2021, 126, 104802
- Tully 1990 Tully, J. C. Molecular dynamics with electronic transitions. J. Chem. Phys. 1990, 93, 1061–1071
- Richter et al. 2011 Richter, M.; Marquetand, P.; González-Vázquez, J.; Sola, I.; González, L. SHARC: ab Initio Molecular Dynamics with Surface Hopping in the Adiabatic Representation Including Arbitrary Couplings. J. Chem. Theory Comput. 2011, 7, 1253–1258
- Werner et al. 2012 Werner, H.; Knowles, P. J.; Knizia, G.; Lindh, R.; Manby, F. R.; Schütz, M., et al. MOLPRO, version 2012.1, a package of ab initio programs. 2012; see https://www.molpro.net
- 28 Martinez, T. J.; Ufimtsev, I. S., et al. TERACHEM, a package of GPU accelerated ab initio quantum chemistry programs
- Siegbahn et al. 1967 Siegbahn, K.; Nordling, C.; Fahlman, A.; Nordberg, R.; Hamrin, K.; Hedman, J.; Johansson, G.; Bergmark, T.; Karlsson, S.-E.; Lindgren, I. et al. ESCA: Atomic, Molecular and Solid State Structure Studied by Means of Electron Spectroscopy; Uppsala, Almqvist & Wiksells, 1967
- McFarland et al. 2014 McFarland, B. K.; Farrell, J. P.; Miyabe, S.; Tarantelli, F.; Aguilar, A.; Berrah, N.; Bostedt, C.; Bozek, J. D.; Bucksbaum, P. H.; Castagna, J. C. et al. Ultrafast X-Ray Auger Probing of Photoexcited Molecular Dynamics. Nature Commun 2014, 5, 4235
- Gao et al. 2013 Gao, M.; Lu, C.; Jean-Ruel, H.; Liu, L. C.; Marx, A.; Onda, K.; Koshihara, S.-Y.; Nakano, Y.; Shao, X.; Hiramatsu, T. et al. Mapping Molecular Motions Leading to Charge Delocalization with Ultrabright Electrons. Nature 2013, 496, 343
- Yang et al. 2021 Yang, J.; Nunes, J. P. F.; Ledbetter, K.; Biasin, E.; Centurion, M.; Chen, Z.; Cordones, A. A.; Crissman, C.; Deponte, D. P.; Glenzer, S. H. et al. Structure Retrieval in Liquid-Phase Electron Scattering. Phys. Chem. Chem. Phys. 2021, 23, 1308–1316