Power-to-X in Energy Hubs: Operations and Policies Supporting the Scale-Up of Renewable Fuel Production
Abstract
Power-to-X (P2X) needs to scale up rapidly to provide the fuels required in the hard-to-decarbonize industrial and heavy transport sector. Only recently, the European Commission proposed requirements for renewable fuels. P2X energy hubs enable efficient synergies between energy infrastructures, production facilities, and storage options. In this study, we explore the optimal operation of an energy hub by leveraging the flexibility of P2X including hydrogen, methanol, and ammonia synthesizers, and analyze potential revenue streams such as the day-ahead and ancillary service markets. We propose EnerHub2X, a mixed-integer linear program that maximizes the hub’s profit based on current market prices, considering technical constraints of P2X such as unit commitment and non-linear efficiencies. We model a representative Danish energy hub and find that without price incentives, it mainly produces liquid hydrogen and sells renewable electricity. Only by adding a price premium of about 50% (0.16 €/kg) to the conventional fuel prices, sufficient amounts of renewable ammonia and methanol are produced. To utilize production efficiently, on-site renewable capacity and P2X must be carefully aligned. We show that renewable power purchase agreements can provide flexibility while complying with the rules set by the European Commission.
keywords:
Energy Hub , Power-to-X , Electrolyzer , Fuel premiums , Renewable fuels[inst1]organization=Technical University of Denmark,addressline=Department of Technology, Management and Economics, Produktionstorvet, Building 424, city=Kongens Lyngby, postcode=2800, country=Denmark
We propose a new multi-commodity flow model to analyze Power-to-X in energy hubs.
We explore optimal operation for different expansion pathways and markets.
We evaluate the profitability of operating energy hubs under current market conditions.
We analyze different policy instruments promoting renewable fuel production.
We illustrate the dispatch merit order for varying levels of renewable fuel premium.
1 Introduction
The climate targets of the European Commission (EC) require a redesign of future energy systems due to the stochastic nature of renewable energy sources (RES) and limited sustainable carbon sources. The integration of Power-to-X (P2X) in a renewable-based energy system will be crucial, especially for the decarbonization of hard-to-abate sectors such as industry and heavy transport. In addition, P2X enables seasonal storage, provides system flexibility, and allows integration across energy vectors (i.e., power, gas, and heat). To scale up P2X production in the near future, energy hubs play an important role by demonstrating viable business models and establishing operations on market-based terms (Energinet, 2019).
The REPowerEU initiative of the European Commission (2022a) sets the goal of 10 Mt of annual domestic production and 10 Mt of imports of renewable hydrogen by 2030. This requires an ambitious European electrolyzer capacity of at least 64 GWe111This assumes 100% utilization and the (current) technology conversion factors used by the IEA (2021b): 0.0046 (ALK), 0.0052 (PEM) MW/nm3 H2/hour and a hydrogen density of 0.089 kg/m3.. The market environment, however, is highly uncertain. Based on the hydrogen project database of the IEA (2021b), Figure 1 shows that most global hydrogen projects are still in their concept phase, and almost all projects have not yet decided which technology to use (Figure 1) and which fuel to produce (Figure 1). Currently, a lot of different countries222Illustrated are the eleven countries with project capacities of more than 1.5 GWe are planning pilot projects in the coming years, some with giga-scale ambitions (Figure 1). To fulfill the EC’s goals as well as target the 850 GWe of global electrolyzer capacity needed according to the Net Zero Emissions by 2050 Scenario of the IEA (2021c), large-scale projects need to ramp up soon. Yet, until 2022, only five projects with a capacity greater than 10 MWe have become operational (IEA, 2021b). Table 5 describes these and some additional projects projected to go live until 2025 with a capacity of more than 10 MWe. Mostly, these are initiated by large utility companies in cooperation with an international mix of technology providers, varying electrolyzer technologies, and final products. Yet, all of these have in common, that they are connected to regional energy hubs such as mobility stations (using fuel cells), ports, upgraded refineries, or ammonia production sites as these enable efficient synergies between energy infrastructures, production facilities, and storage options. In most of these projects, the capacity is already defined, companies seem, however, reluctant to decide on a technology, a provider, and a fuel to produce. Despite recent political ambitions, the lack of clear policy support seems to stall industrial commitments.
In addition, market participants still wait for a clear definition of what is considered renewable. Finally, in May 2022, the European Commission (2022b) proposed a delegated act for renewable fuel production requirements considering additionality and the temporal and geographic correlation of the RES used (see further in Section 5.2). These rules will probably also apply to renewable hydrogen used in industry and for imports. The legislation is expected to be updated based on the submitted public feedback and to be introduced in the upcoming RED II (European Commission, 2018) update in autumn 2022.
In conclusion, we note that additional support is needed for market participants investing in such P2X energy hubs, but also for policy makers trying to incentivize renewable fuel production. This should consider current market conditions such as prices and regulations, as well as relevant technical details of P2X plants and potential synergies within energy hubs.
Hence, the goal of this study is to investigate whether regional energy hubs with renewable fuel production can establish economically viable operations under current market conditions. In addition, we analyze which support schemes can be utilized to promote renewable fuels taking into account the recent EC’s production requirements. In order to do that:
-
1.
We introduce a flexible modeling framework for energy hubs focusing on renewable fuels and cluster synergies.
-
2.
We analyze optimal flows of an expansion pathway and investigate potential revenue streams, including ancillary service markets.
-
3.
We investigate different policy instruments to promote renewable fuel production in a Danish case study.
The remainder of this paper is structured as follows: Section 2 presents related work on P2X energy hubs. Section 3 introduces the main components of the proposed EnerHub2X model, whereas the whole model formulation and the used data can be found in D and C, respectively. Section 4 introduces the Danish case study and Section 5 the numerical analysis. Section 6 discusses the results, limitations, and further research and Section 7 concludes with the policy recommendations.
2 Literature Review
An energy hub (EH) is defined as a multi-energy system, where various energy carriers are optimally produced, converted, stored, and consumed (Mohammadi et al., 2017), fulfilling certain sociopolitical and socioeconomic mandates (Ding et al., 2022). The concept was introduced by Geidl and Andersson (2007) using a non-linear and a linearized model (with constant plant efficiencies) to optimally dispatch electricity, natural gas, and district heating using different EHs with combined heat and power (CHP) units. Almassalkhi and Hiskens (2011) decompose the framework into matrices, but despite this structure, changing network topologies is still quite costly. In addition, all these efforts only consider a single input per conversion unit. For example, Hajimiragha et al. (2007) and Krause et al. (2011) in their hydrogen economy application use only electricity as input to their electrolyzer, which, for example, limits applicability in countries with rising water scarcity. To facilitate synergy networks using excess products (e.g., wastewater), an integrated management framework is required that considers multi-source multi-product converters (Hemmes et al., 2007; Mohammadi et al., 2017). These multi-input/multi-output systems contain several energy resources, converters, transmission lines, storage systems, and loads (Aljabery et al., 2021). They aim at improving reliability, flexibility, and efficiency by coupling, coordinating, and co-optimizing multiple forms of energy, such as electricity, heating and cooling, as well as e-fuels (Chen et al., 2018) towards a 100% renewable energy system (Ghasemi et al., 2018; Ding et al., 2022; Mohammadi et al., 2017).
Research on multi-carrier energy systems or multi-energy systems, energy hubs, or integrated energy systems has been conducted extensively for more than a decade now. A multitude of review studies have been published focusing on topology (Son et al., 2021; Mancarella, 2014), optimization techniques for planning, operation, and trading (Ding et al., 2022; Aljabery et al., 2021), focus of the analysis (Mohammadi et al., 2017; Sadeghi et al., 2019), or the current available infrastructure (Guelpa et al., 2019).
The dominant conversion technologies investigated are, however, still CHP plants and gas boilers, the dominant energy carriers are electricity and natural gas, and the dominant demands are electricity and heating (Mohammadi et al., 2017; Son et al., 2021; Sadeghi et al., 2019). Studies mainly consider electrolyzers to consume electricity in combination with CHP or fuel cells. Yet, as a consequence of the recent increase in urgency to reduce fossil fuel dependencies, including hard-to-decarbonize sectors, the interest in how to model and optimize these sector-coupled systems has rejuvenated. Hence, we focus our investigation on EHs using renewable hydrogen to produce e-fuels that can be used in the industry or heavy transport sectors.
Multiple studies investigate separately the production of hydrogen in combination with fuel cell electric vehicles (Nasir et al., 2022; Maroufmashat et al., 2016), comparing the economies of different production technologies (Maniyali et al., 2013; Sharif et al., 2014; Parra et al., 2017) or different electricity markets (Lück et al., 2017; Scolaro and Kittner, 2022), the production of methanol (Chen and Yang, 2021; Zheng et al., 2022; Zhang et al., 2019) in a Icelandic/German case study (Kauw et al., 2015), or the production of ammonia (Salmon and Bañares-Alcántara, 2021; Zhang et al., 2020) in case studies in the UAE (Osman et al., 2020), South America (Armijo and Philibert, 2020), or the USA (Morgan et al., 2017). Overarching, Decourt (2019) analyzes the P2X innovation system, and Chehade et al. (2019) and Gahleitner (2013) review global pilot projects. Bellotti et al. (2022) compare the economic feasibility of different renewable P2X plants and find that in the close-to-mid-term time horizon, electrical energy should be stored in renewable fuel to be transported using existing infrastructure and to circumvent issues related to hydrogen transportation.
Utilizing an integrated energy system modelling approach, Bramstoft et al. (2020) assess renewable gas and liquid fuel production pathways for the hard-to-abate sectors considering synergies and interactions between energy sectors and vectors in a Danish case study. Lester et al. (2020) build upon this methodology and perform a long-term analysis of an extensive catalog of various P2X and e-fuel production pathways. They find that e-methanol and e-ammonia are promising options to supply the long-haul transport sector and the maritime sector. Incer-Valverde et al. (2022) compare different P2X fuels in a multi-criteria evaluation of a German case study. They find ammonia to be the best option, closely followed by methanol. Finally, in their techno-economic cradle-to-grave environmental assessment, Ordóñez et al. (2021) find similar net production costs for renewable methanol and ammonia and stress the high environmental impact of H2 storage.
Overall, a techno-economic analysis of the operation of a synergetic energy hub producing renewable hydrogen and e-fuels, as well as of the necessary policy frameworks to incentivize renewable fuel production, have to the best of our knowledge, not been conducted yet. Therefore, in this study, we develop a state-of-the-art energy hub operation model called EnerHub2X. EnerHub2X allows optimizing small network flow problems but also generalizes to large-scale P2X value chains operating under a common energy hub framework. The flexible formulation allows modeling of additional conversion technologies and easy adoption to different cluster topologies.
3 Methodology: EnerHub2X
EnerHub2X is designed to capture the complexity and dynamics of P2X and provides insights into optimal dispatch and operational bottlenecks. The model flexibly simulates different processes and conversion technologies using accurate energy carrier transformation including technical and operational constraints. EnerHub2X is a network and multi-commodity flow model solved in a four-dimensional space: accounting for spatial and temporal resolution, technology details, and energy carriers. Its objective is to maximize the energy hub’s profit and optimally dispatch all its conversion technologies assuming perfect information. The planning horizon can be either daily, weekly, or yearly using an hourly time resolution. The model assumes a connection to the electricity grid, the day-ahead market, and the ancillary service market.
EnerHub2X is formulated as a mixed-integer linear program in GAMS and solved using CPLEX. In the following section, we introduce the model formulation of EnerHub2X denoting all parameter names in capital (except ratios and fuel prices) and variable names in small letters. The nomenclature and complete mathematical formulation including the ancillary service market can be found in D.
3.1 Objective Function
EnerHub2X maximizes the energy hub’s profit (Eq. 1) composed of four terms: the market price multiplied by the quantity of each fuel sold in area in time period as the energy hub’s revenue from fuel sales; the market price multiplied by the feed-stock purchased as the fuel costs; the variable operational costs of technology multiplied with the produced quantities ; and the ramp-up costs for technologies with unit commitment .
| (1) | ||||
3.2 Fuel Mix and Conversion
EnerHub2X’s core functionality is the ability to model conversion technologies based on input and output flows. These parameters capture the flow mass of each technology and each fuel . Based on those parameters the values , and are determined. describes the input share of fuel used in technology (Eq. 2), describes the output share of fuel of technology (Eq. 3), and describes the ratio between the sum of input flows and the sum of output flows of technology (Eq. 4).
| (2) |
| (3) |
| (4) |
The decision variables and describe the input and output flows, as well as the activity level of each technology . Eq. 5 connects the consumption of fuel with the overall activity level of technology . Similarly, Eq. 6 links the generation of fuel with the total activity level. These linkages introduce linear conversion efficiencies.
| (5) |
| (6) |
In addition, technologies with non-linear load-dependent production efficiencies can be incorporated using SOS2 constraints (Special Ordered Sets of type 2) similar to Lin et al. (2021) (Eqs. 7 and 8). The breakpoints between each linear segment are denoted by , while and indicate the discrete efficiency and total level of activity of technology at breakpoint . In addition, denotes the capacity of technology and the weight assigned to the breakpoints. Using SOS2 constraints, all weights have to sum to one and only two subsequent weights can be larger or equal to zero.
| (7) |
| (8) |
For technologies with unit commitment (i.e., ), Eq. 9 activates the unit commitment variable accordingly.
| (9) |
3.3 Technical Constraints
The following constraints restrict technology operations (i.e., and based on their respective characteristics. All technologies are linked to exogenous capacity factors (e.g., to force maintenance this parameter could be set to zero). Eq. 10 restricts the total level of activity based on the capacity and . We assume all technologies are shut down initially.
| (10) |
| (11) |
| (12) |
Furthermore, the flexibility of some technologies is further restricted by unit commitment constraints (Eq. 13). The associated cost is derived in Eq. 15 considering the ramp-up decision (Eq. 14).
| (13) |
| (14) |
| (15) |
For unit commitment technologies, Equations 11 and 12 are expanded. In addition to the production rates, Eq. 16 restricts the ramp-up rate to the minimum production level of a technology . This prevents shutting down a technology and forces it into a standby mode (Eq. 13) to remain flexible. Similarly, Eq. 17 restricts the ramp-down rate of a technology.
| (16) |
| (17) |
3.4 Storage Constraints
EnerHub2X considers different types of storage technologies, e.g., battery electric or compressed hydrogen storage systems. The decision variable represents the state of charge (SOC) of technology managed by the storage balance equation (Eq. 18). Eq. 19 restricts the to the maximum level and Eq. 20 defines the initial values.
| (18) |
| (19) |
| (20) |
The binary decision variable prevents simultaneous charging and discharging. The maximum and minimum rates of dis-/charging are accounted for in Eqs. 21 and 22.
| (21) |
| (22) |
3.5 Fuel Flow Balance and Restrictions
The model connects different hierarchical areas using the fuel flows in the balance equation (Eq. 23). All areas are connected with one another creating a network for each fuel . Up to five decisions are made in each area. In areas with technologies , the model decides how much to consume and produce (i.e., and ) of fuel . In addition, each area can purchase or sell fuel . The im-/exporting decisions are linked with in-/out-flows of fuel to adjacent area .
| (23) | ||||
Overall, the EnerHub2X framework can be used to model energy hubs of varying sizes and topologies using different levels of technical accuracy for each conversion technology. In the next section, a Danish case study is presented, illustrating an example model implementation.
4 Danish Case Study: GreenLab Skive Energy Hub
The Danish Government (2020) has committed to reduce CO2 emissions by 70% by 2030 compared to 1990 levels and to become carbon neutral by 2050. In 2021, its P2X strategy was launched, which outlines at least 4–6 GW of electrolyzer capacity by 2030 (mceu_goverments_2021). Figure 3 shows the multitude of pilot projects all over the country333see https://brintbranchen.dk/danske-brintprojekter/ for updated projects.
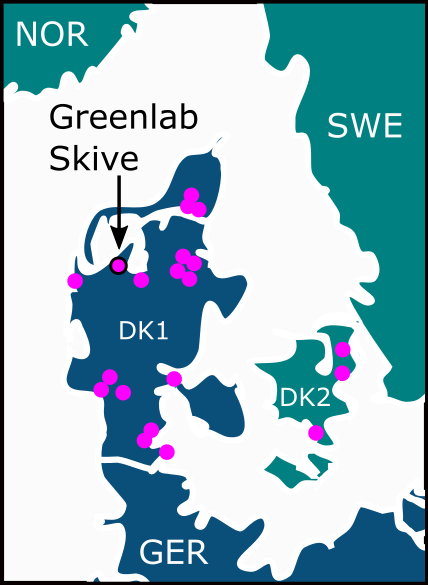
One of them is GreenLab Skive (GLS), a 60-hectares industrial park in northwestern Denmark. Its goal is to establish an efficient regional symbiosis network using RES and P2X technologies. GLS acts as the facilitator and coordinates the exchange of resources within its network of partners (Table 1). Thereupon, bilateral contracts, ensuring a just allocation of resources and benefits, need to be established.
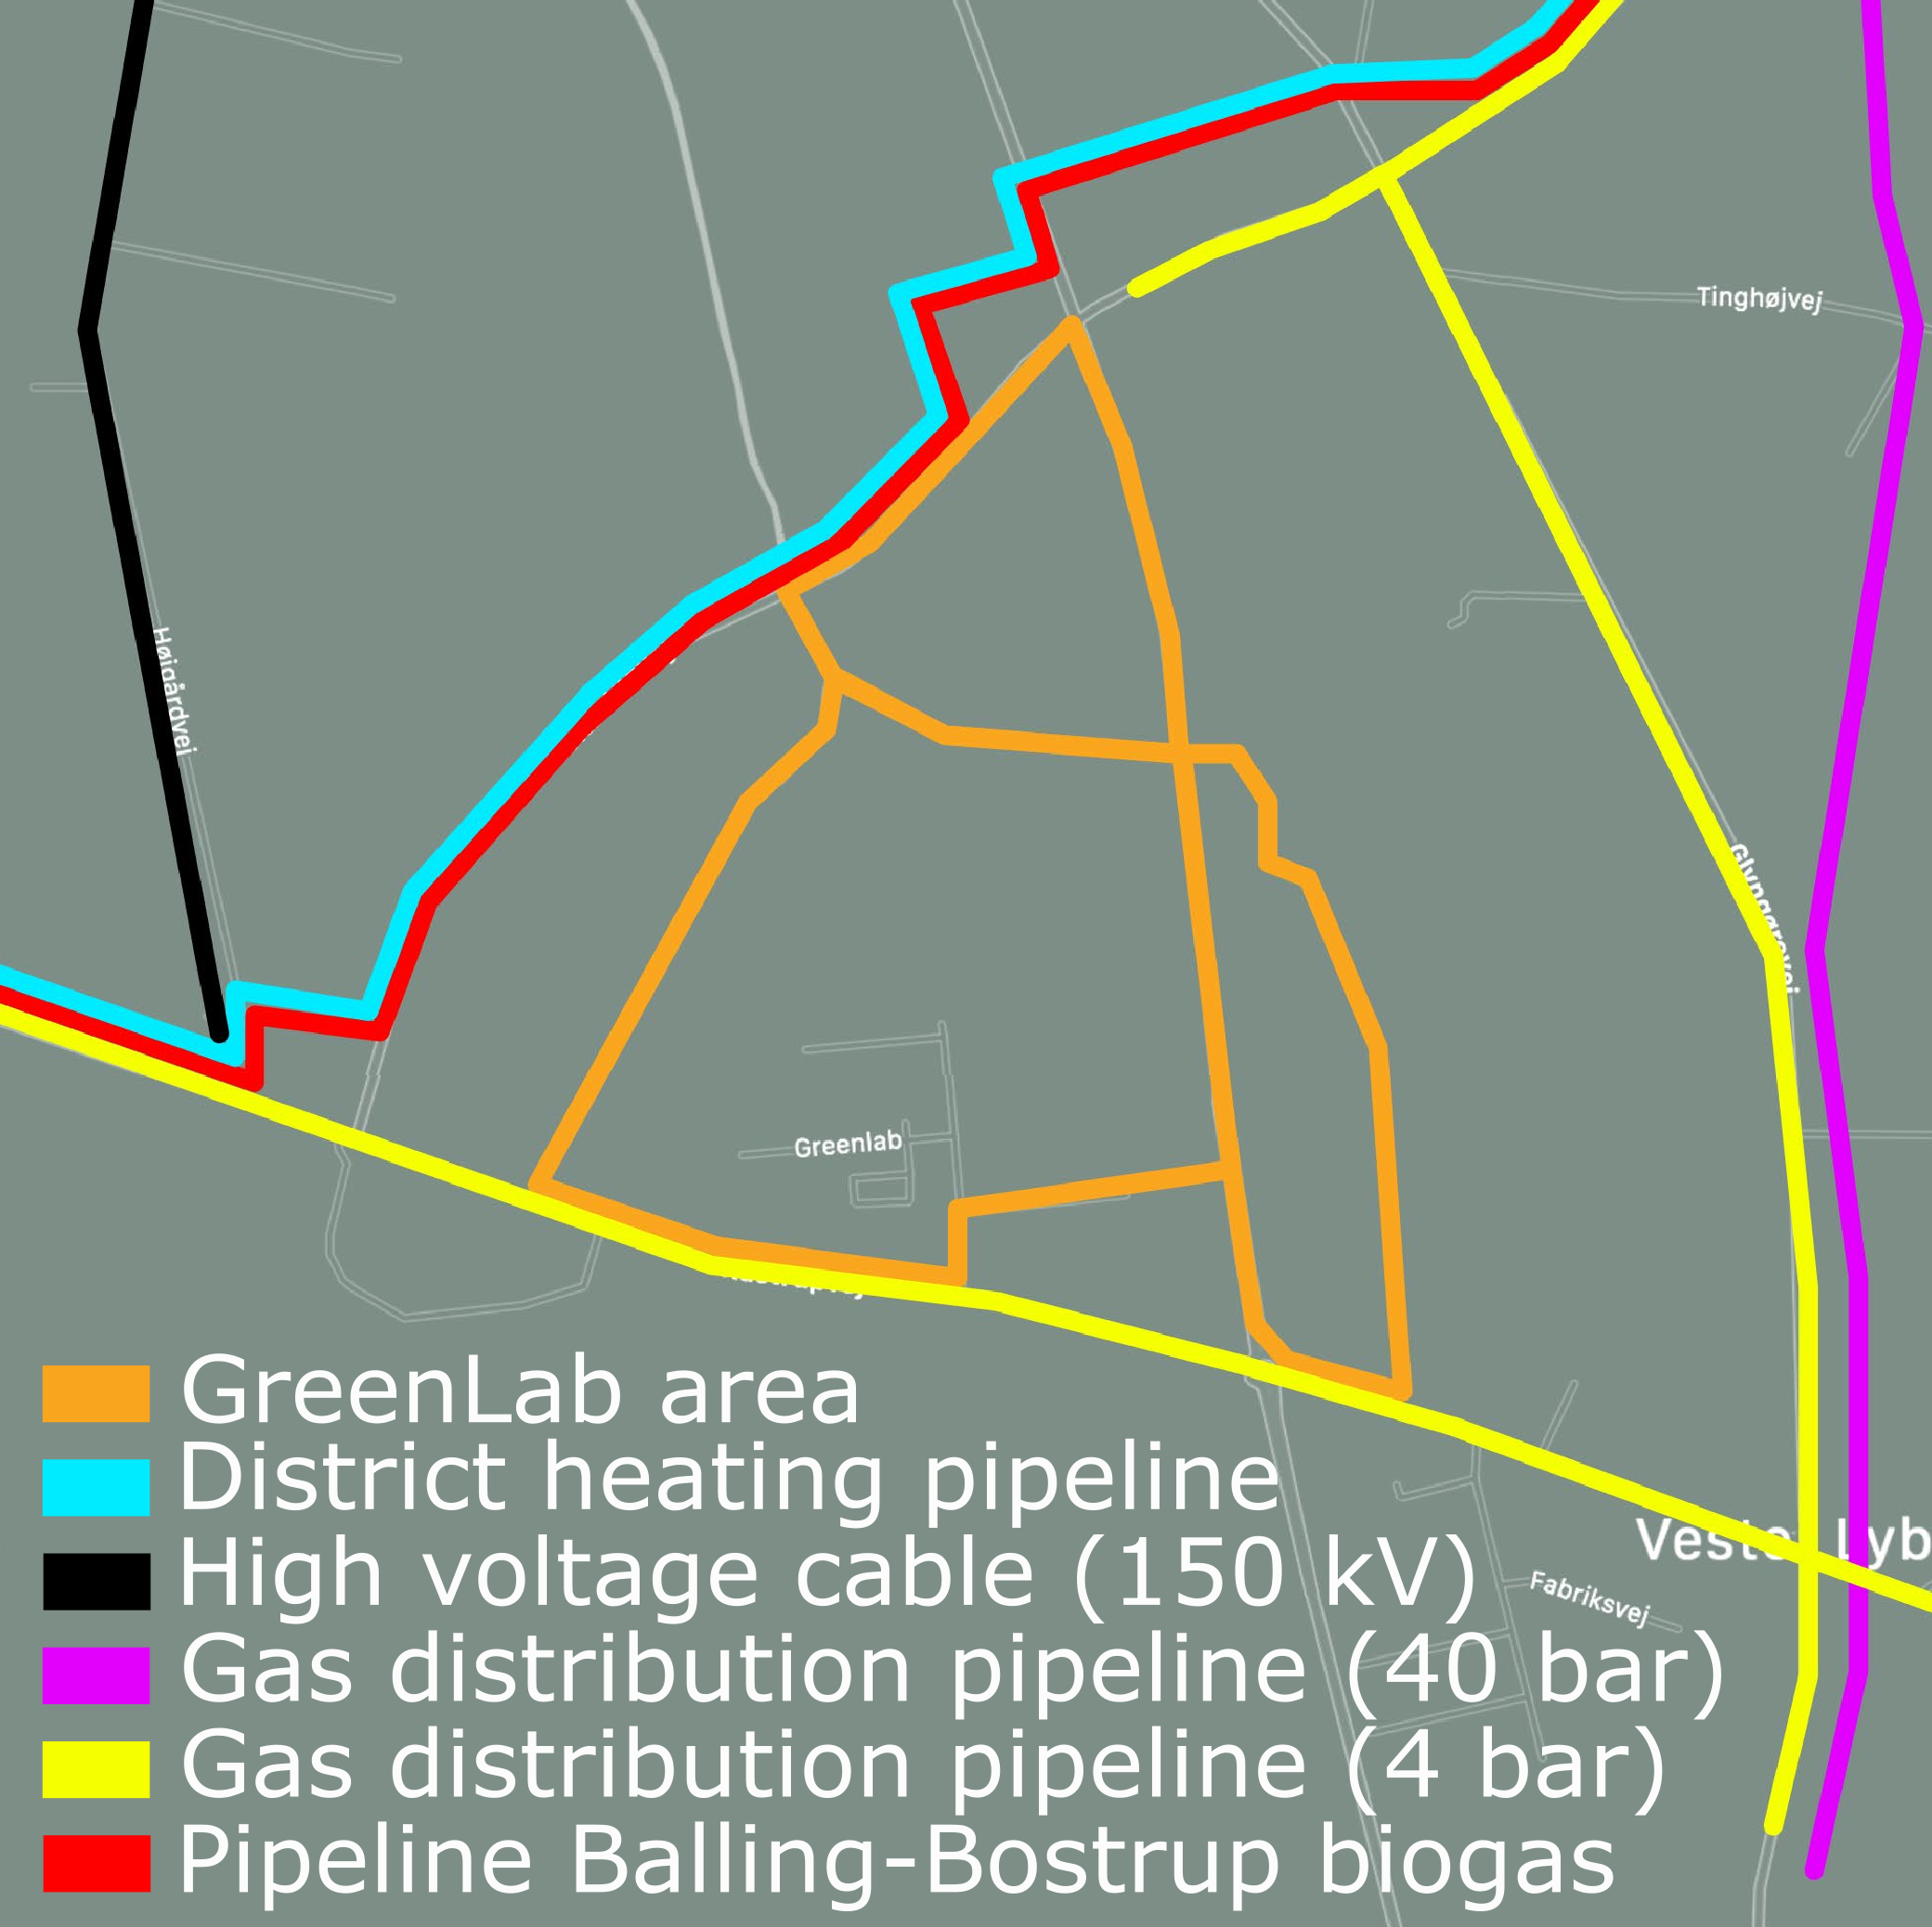
Figure 4 illustrates the current and future technologies of the energy hub, its interlinkages, and the market connections of the hub. In the current system, the following main units are planned: wind and solar energy, electrolysis, methanol synthesis, battery-electric storage, and compressed hydrogen storage. The respective partners, projected capacities, and construction dates can be found in Table 1. Figure 3 illustrates its (future) infrastructure connections to the electricity, gas distribution, and district heating networks.
GLS has five potential revenue streams, it can sell electricity at the day-ahead market or provide ancillary service, it can sell liquefied hydrogen, or use hydrogen to produce and sell ammonia or methanol. The revenues are based on the electricity and feedstock prices of DK 1 in 2019 (Table 6). GLS can source electricity from the utility grid via the day-ahead market. Further capacity expansions and technologies (e.g., ammonia synthesis, carbon capture and storage (CCS)) are planned. In the following, the main conversion technologies are briefly described.
| Technology | Partners | Capacity | Plan |
|---|---|---|---|
| Electrolysis | Green Hydrogen Systems, | 12 MW | 2022 |
| Eurowind & Lhyfe, | 24 MW | 2023? | |
| GreenHyScale Partners | 100 MW | ||
| Methanol Synthesis | European Energy | 10 MW | 2023 |
| Ammonia Synthesis | Siemens Gamesa | 20 t/day* | |
| Biogas Plant | Eon | 19 mio m3 | in use |
| Compr. H2 Storage | Everfuel | 7 tons* | |
| Battery Storage | Eurowind | 1.6 MWh | |
| Wind Park | Eurowind | 54 MW | |
| Solar park | Eurowind | 27 MW |
4.1 Electrolyzer
Hydrogen (H2) can be used to produce a number of fuels and other products such as methane, methanol, ammonia, synthetic aviation fuels, and plastics to replace products based on fossil fuels (Danish Energy Agency, 2022). It has a high gravimetric energy density of about 120 MJ/kg, which is about three times that of gasoline, but a low volumetric energy density (9 GJ/m3 in its liquid state at -253°C). This is only about one-third that of gasoline (IEA - Advanced Motor Fuels, 2020a). The global (pure) hydrogen demand in 2020 was estimated at around 90 Mt, mainly used as feedstock in the chemical sector and in the refining industry to produce ammonia or methanol. Today’s supply is almost entirely fossil fuel-based (IEA, 2021a).
The most common electrolyzers are alkaline electrolysis cell (AEC) technology, its in-/output characteristics and efficiencies are very similar to Polymer electrolyte membrane electrolysis (PEM), which is the second most common technology (Danish Energy Agency, 2022). All electrolyzers use electricity and water as input and have hydrogen, oxygen, and excess heat as output (Table 7). Since the heat needs to be at a certain temperature to be used in district heating, only a percentage of the heat can be utilized. GLS uses 29x Green Hydrogen System A-Series A90 AEC-electrolyzers for the initial 12 MW installation in 2022.
4.2 Methanol Synthesis
Methanol (CH3OH or MeOH) could be used straight or blended in fuels, for fuel additives, or for fuel cell applications. It has a lower energy content than hydrogen (20 MJ/kg) but a higher volumetric density (16 GJ/m3) (IEA - Advanced Motor Fuels, 2020b). At ambient temperature, methanol is liquid making it a convenient energy carrier. It can be produced from hydrogen and CO2 (Table 8). In 2021, the global production capacity was estimated at around 157 Mt (Statista, 2021), primarily produced from synthesis gas based on natural gas or coal.
4.3 Ammonia Synthesis
Ammonia (NH3) has various applications and could, for example, be used as a carbon-free fuel in maritime transportation (Danish Energy Agency, 2022). It has the highest hydrogen content, making it a promising carrier that can be transported in liquid form, it is however highly toxic (Incer-Valverde et al., 2022). Its energy content is comparable to methanol (19 MJ/kg), but it has a slightly lower volumetric energy density (13 GJ/m3 cooled) (IEA - Advanced Motor
Fuels, 2020a). Since 1913, the Haber-Bosch process is used with hydrogen and nitrogen as input (Table 9). In 2021, the global production capacity was estimated at around 236 Mt, mainly used as fertilizer (Statista, 2022).
5 Numerical Analysis
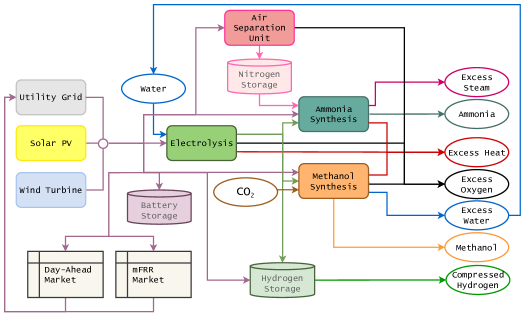
In the following, we will introduce the numerical analysis based on the Danish case study introduced in Section 4. As illustrated in Figure 5, the numerical analysis is split into two parts, first, we investigate four sequential energy hub configurations (Configurations 1 to 4) motivated by the projected expansion pathway of GLS (Table 1). Subsequently, we investigate two different scenarios (Scenario A and B) of potential policy instruments to support renewable fuel production in energy hubs.
5.1 GreenLab Skive Expansion Pathway Configurations
P2X energy hubs built all over Europe, similar to GreenLab Skive, are expected to demonstrate profitable business cases. Mostly, the hubs start as small pilot sites and scale up by exploiting different revenue streams. Local, national, or European funding oftentimes provides an essential part of the capital expenses. These subsidies can however lead to imbalances when, for example, electrolyzer capacity is expanded, but the RES remain fixed (Skov and Schneider, 2022).
To analyze these effects, we consider four hub configurations based on GLS’s expansion plans: 1) Initial configuration with 12 MW electrolyzer capacity, 2) Expanded electrolyzer capacity of 100 MW, 3) Expanded electrolyzer capacity plus ammonia synthesis plant, and 4) Expanded version with an ancillary market connection (Figure 5). Configuration 3 provides a holistic picture of the competition between hydrogen and e-fuels production in the energy hub, assuming the respective market prices and technical constraints. We demonstrate the ability of EnerHub2X to handle new network topologies and energy carrier conversion technologies. Configuration 4 illustrates the participation in different electricity markets. For this, we first have to decide which markets are eligible for the GLS energy hub.
In Configurations 1 to 3, the energy hub is only connected to the day-ahead market. The setup of the Danish ancillary services markets for DK 1 (Western Denmark) is described in Table 2. In the following, the characteristics of the main products: FCR, aFRR, and mFRR are introduced briefly.
| Product | up/ | Bid | -Price | Vol. | Ramp | Min. | Min. |
|---|---|---|---|---|---|---|---|
| down | length | [€/MW/h] | [MW] | [min] | [min] | [MW] | |
| FCR | bi | 4 h | 27 | 9 | 0.5 | 15 | 1 |
| aFRR | bi | 1 mth. | 41 | 100 | 15(5) | 60 | 1 |
| mFRR | up | 1 h | 5 | +299 | 15 | 60(15) | 5(1) |
Frequency Containment Reserve (FCR)444https://energinet.dk/El/Systemydelser/indkob-og-udbud/FCR (in Danish) stabilizes the frequency in the electricity grid in case of differences in consumption and production. FCR is activated automatically and can be supplied by both production and consumption units. It is a symmetrical product, which means that both up-and-down-regulation (bi) must be provided. Relatively small amounts are purchased at 8 am the previous day in 4-hour-blocks requiring a fast response time of 30 seconds (Table 2).
Automatic Frequency Restoration Reserve (aFRR)555https://energinet.dk/El/Systemydelser/indkob-og-udbud/aFRR (in Danish) serves two purposes: 1) Restoring the frequency to 50 Hz and 2) Re-balancing international connections. aFRR is a symmetrical product regulated automatically and can be supplied by both consumption and production units. Medium-sized amounts (bids are normally around 50 MW in DK1) are purchased 1–2 weeks in advance for the whole next month requiring a response time of 15 minutes (Table 2).
Manual Frequency Restoration Reserve (mFRR)666https://energinet.dk/El/Systemydelser/indkob-og-udbud/mFRR (in Danish) reduces major imbalances and upon activation balances unplanned fluctuations of the electricity system. mFRR is an asynchronous product that is regulated manually and can be delivered by both production and consumption units, and receive a signal upon activation. Energinet only purchases up-regulation capacity in DK 1. Larger-sized amounts are purchased at 9.30 am the previous day requiring a response time of 15 minutes (Table 2). In both cases, aFRR and mFRR, auctions are capacity payments, and upon activation, separate payments are issued.
Overall, we conclude that in the current regulatory setup in Denmark only bidding on the mFRR market would be possible for the energy hub (in addition to the day-ahead market). This is due to the fast ramp-up times needed for FCR services, and due to the requirement of monthly (currently also sometimes a weekly) symmetric bids for the aFRR services. This might change in 2024 when Denmark will (with the other Nordic countries) join ENTSO-E’s unification effort for aFRR: PICASSO777https://www.entsoe.eu/network_codes/eb/picasso/ and for mFRR: MARI888https://www.entsoe.eu/network_codes/eb/mari/ and the bidding windows might become sub-hourly and non-symmetric. The final design is still undecided, however.
Accordingly, in Configuration 4, EnerHub2X includes the ancillary service market mFRR (see D). The day ahead market is coupled with the mFRR (reservation and activation), assuming a uniformly distributed activation probability.
5.2 Renewable Fuel Policy Instrument Scenarios
Analyzing the technical configurations and market participation on the GLS expansion pathway allows us to investigate potential revenue streams and business models. Based on this analysis, in the next step, we investigate which policy instruments could be used to support the production of renewable fuels. An essential part of this analysis is to clearly outline what is considered a renewable fuel.
According to the European Commission (2022b), renewable fuels are almost exclusively based on hydrogen produced via electrolysis using renewable electricity. This is the case because the emissions of hydrogen using fossil-based electricity are substantially higher than the emissions of hydrogen produced using natural gas. Therefore, EU regulations on renewable fuels try to prevent the usage of fossil-based electricity by expanding RES or using excess renewable electricity.
Hence, according to the European Commission (2022b) renewable fuels have to comply with three aspects of RES input: additionality, temporal, and geographic correlation. For all of them, the EC suggests (highly controversial) exemptions until the end of 2026. In this study, we focus on the long-term rules. The additionality rules make sure that new RES are built instead of re-assigning old installations. It requires either a direct connection (off-grid) with RES (no more than 3 years older than the P2X) or using a grid connection (on-grid). The latter is valid when the previous year’s RES share in the bidding zone was either higher than 90% or a power purchase agreement (PPA) with RES in the same or adjacent bidding zone without financial support was entered. The rules for temporal correlation require that renewable electricity is consumed (either by the electrolyzer or a local storage device) in the same hour, or when the grid price is below 20 EUR per MWh, or during curtailment. Lastly, the geographic rules enforce that the electrolyzer is located in the same bidding zone as the RES, an adjacent zone with higher prices, or an adjacent offshore zone. Fulfilling these requirements, GLS would receive guarantees of origin.
In Scenario A, we investigate how green premiums affect the operation and profitability of the energy hub using only its on-site RES (off-grid). In Scenario B, we expand the available renewable electricity to include grid access via a PPA (on-grid). In both cases, a sensitivity analysis of different price premiums for methanol and ammonia is conducted. We assume a competitive PPA price paid on top of the day-ahead price to access renewable electricity.
Next, Section 6 describes the numerical results and discusses policy implications.
6 Results and Discussion
In the following, we will analyze the four energy hub configurations, as well as the two policy scenarios and discuss the implications for GLS and P2X energy hubs in general.
6.1 GreenLab Skive Expansion Pathway Configurations
In this section, we analyze the energy hub operations taking into account the expansion pathway outlined by GLS. We start with the initial 12 MW electrolyzer capacity (Configuration 1), extend to 100 MW capacity (Configuration 2), and add ammonia production (Configuration 3). Finally, we include the mFRR market (Configuration 4).
To understand the operations of the energy hub, a detailed analysis of the hub’s bottlenecks and potential revenue streams is performed. The competition between revenue streams and energy vectors is characterized by a merit order within the hub. This merit order is, however, dynamic based on variable electricity prices, RES availability, and technical operating constraints.
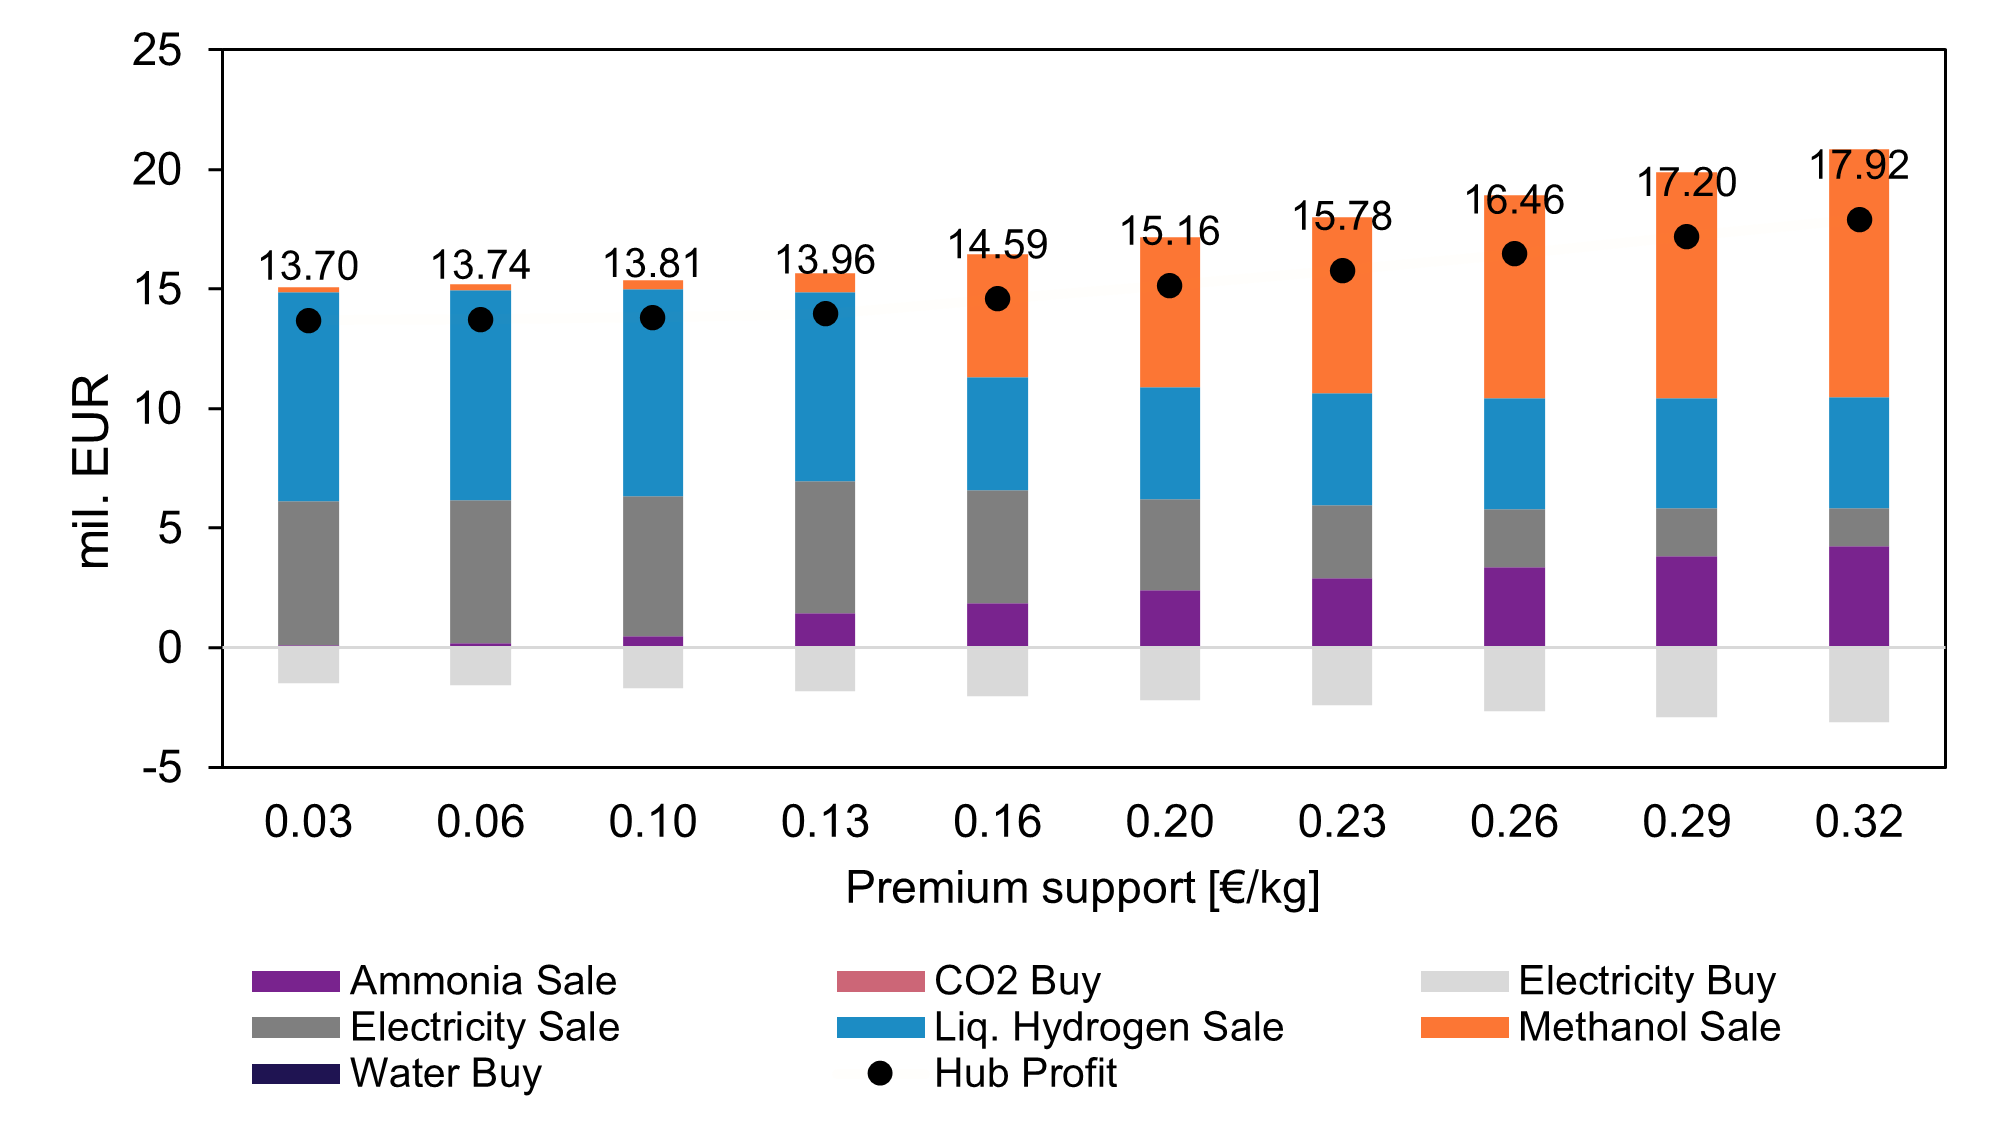
Figure 6 shows that although the extended electrolysis capacity (Configurations 2 to 4) allows for more hydrogen and e-fuel production, GLS almost only sells liquefied hydrogen and electricity.
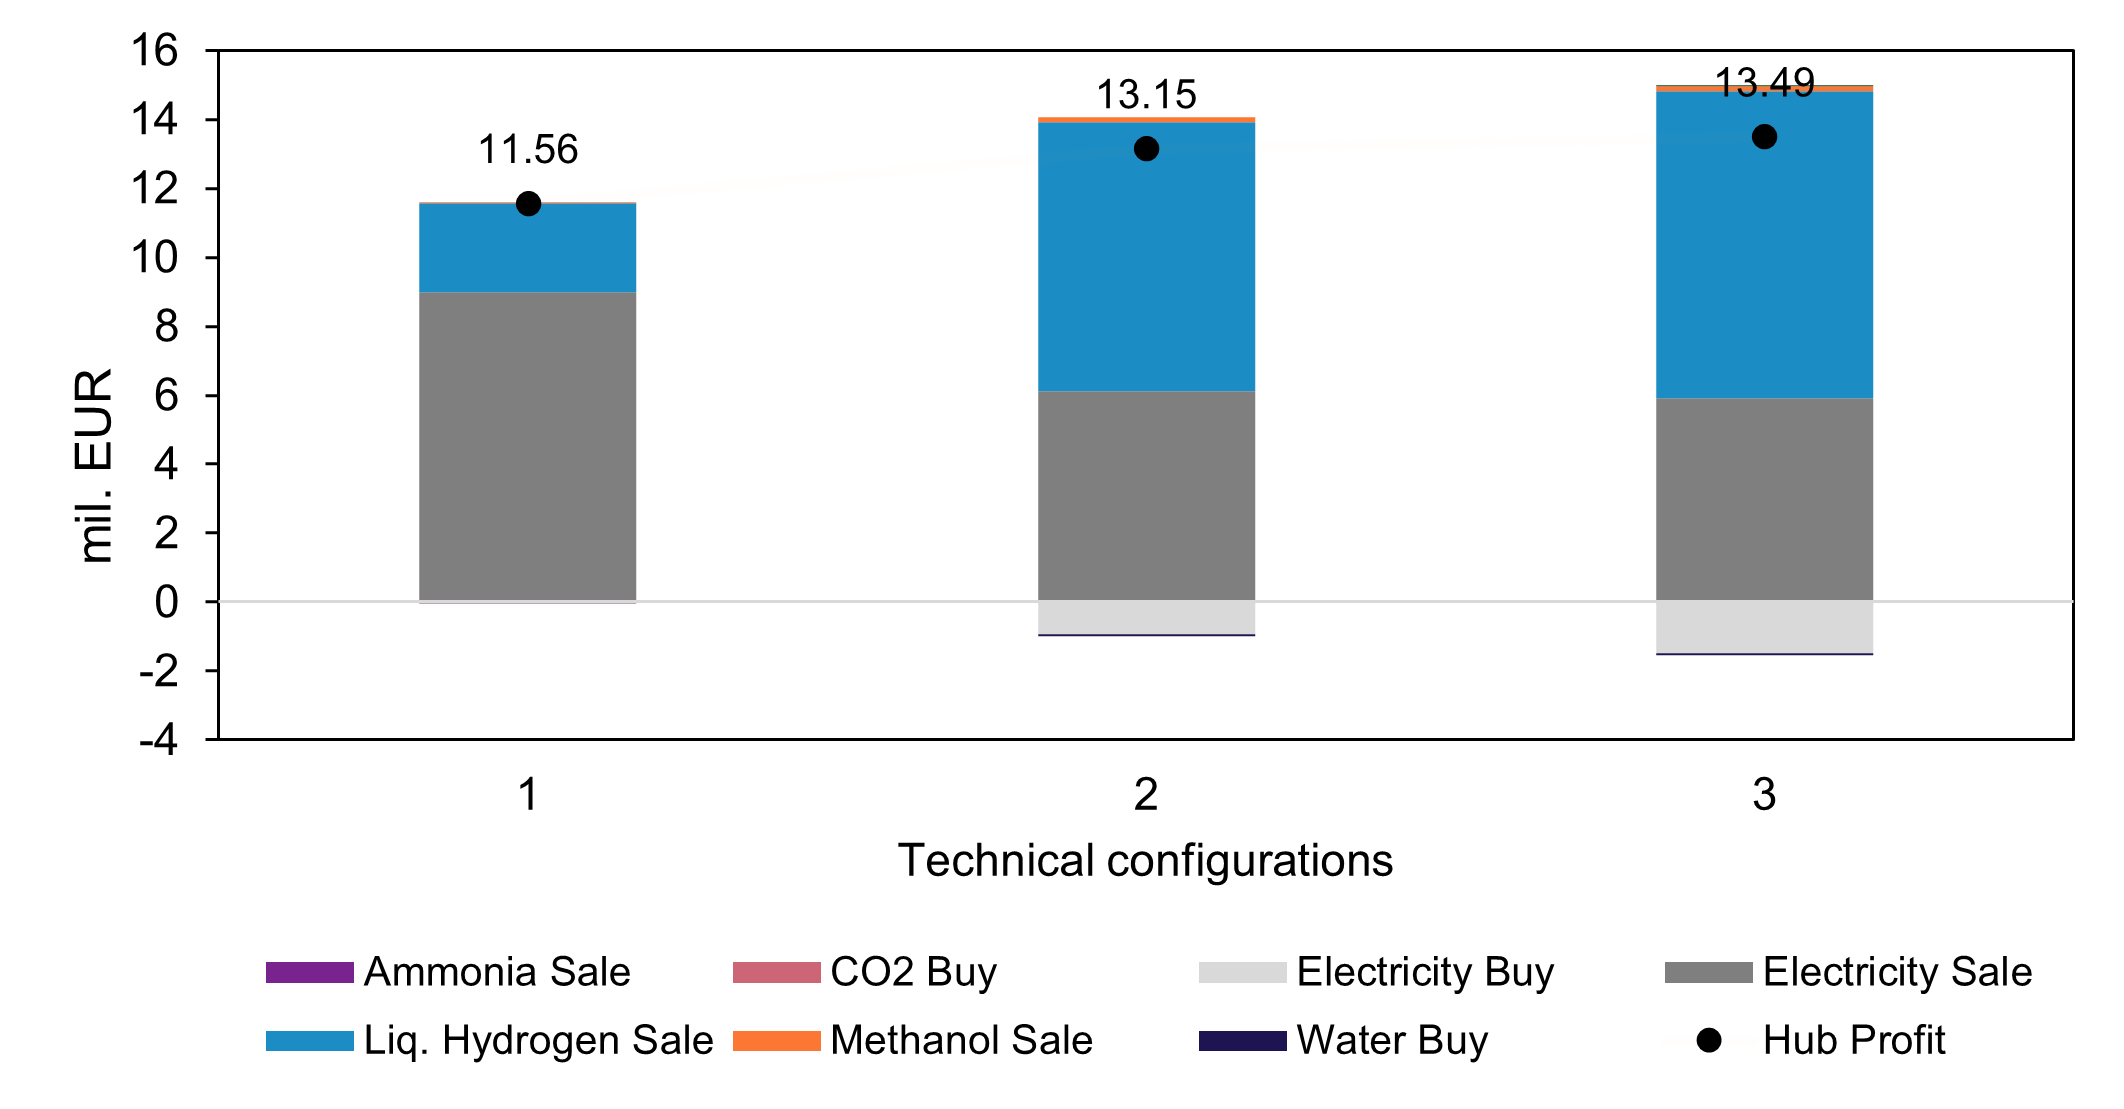
This is because the profits to be gained selling renewable fuels are relatively low compared to the day-ahead market prices and liquefied hydrogen profits. This way, Figure 6 shows that in none of the configurations, a significant amount of e-fuels is produced. Hence, when renewable electricity is available or when electricity prices are low, the hub produces and sells hydrogen. Accordingly, by increasing the electrolyzer capacity in Configurations 2 to 3, a higher share of hydrogen can be produced compared to Configuration 1. In addition, to utilize the higher capacity, more electricity is purchased from the grid at low or negative prices. When electricity prices are high on the other hand, the hub rather sells electricity on the day-ahead market.
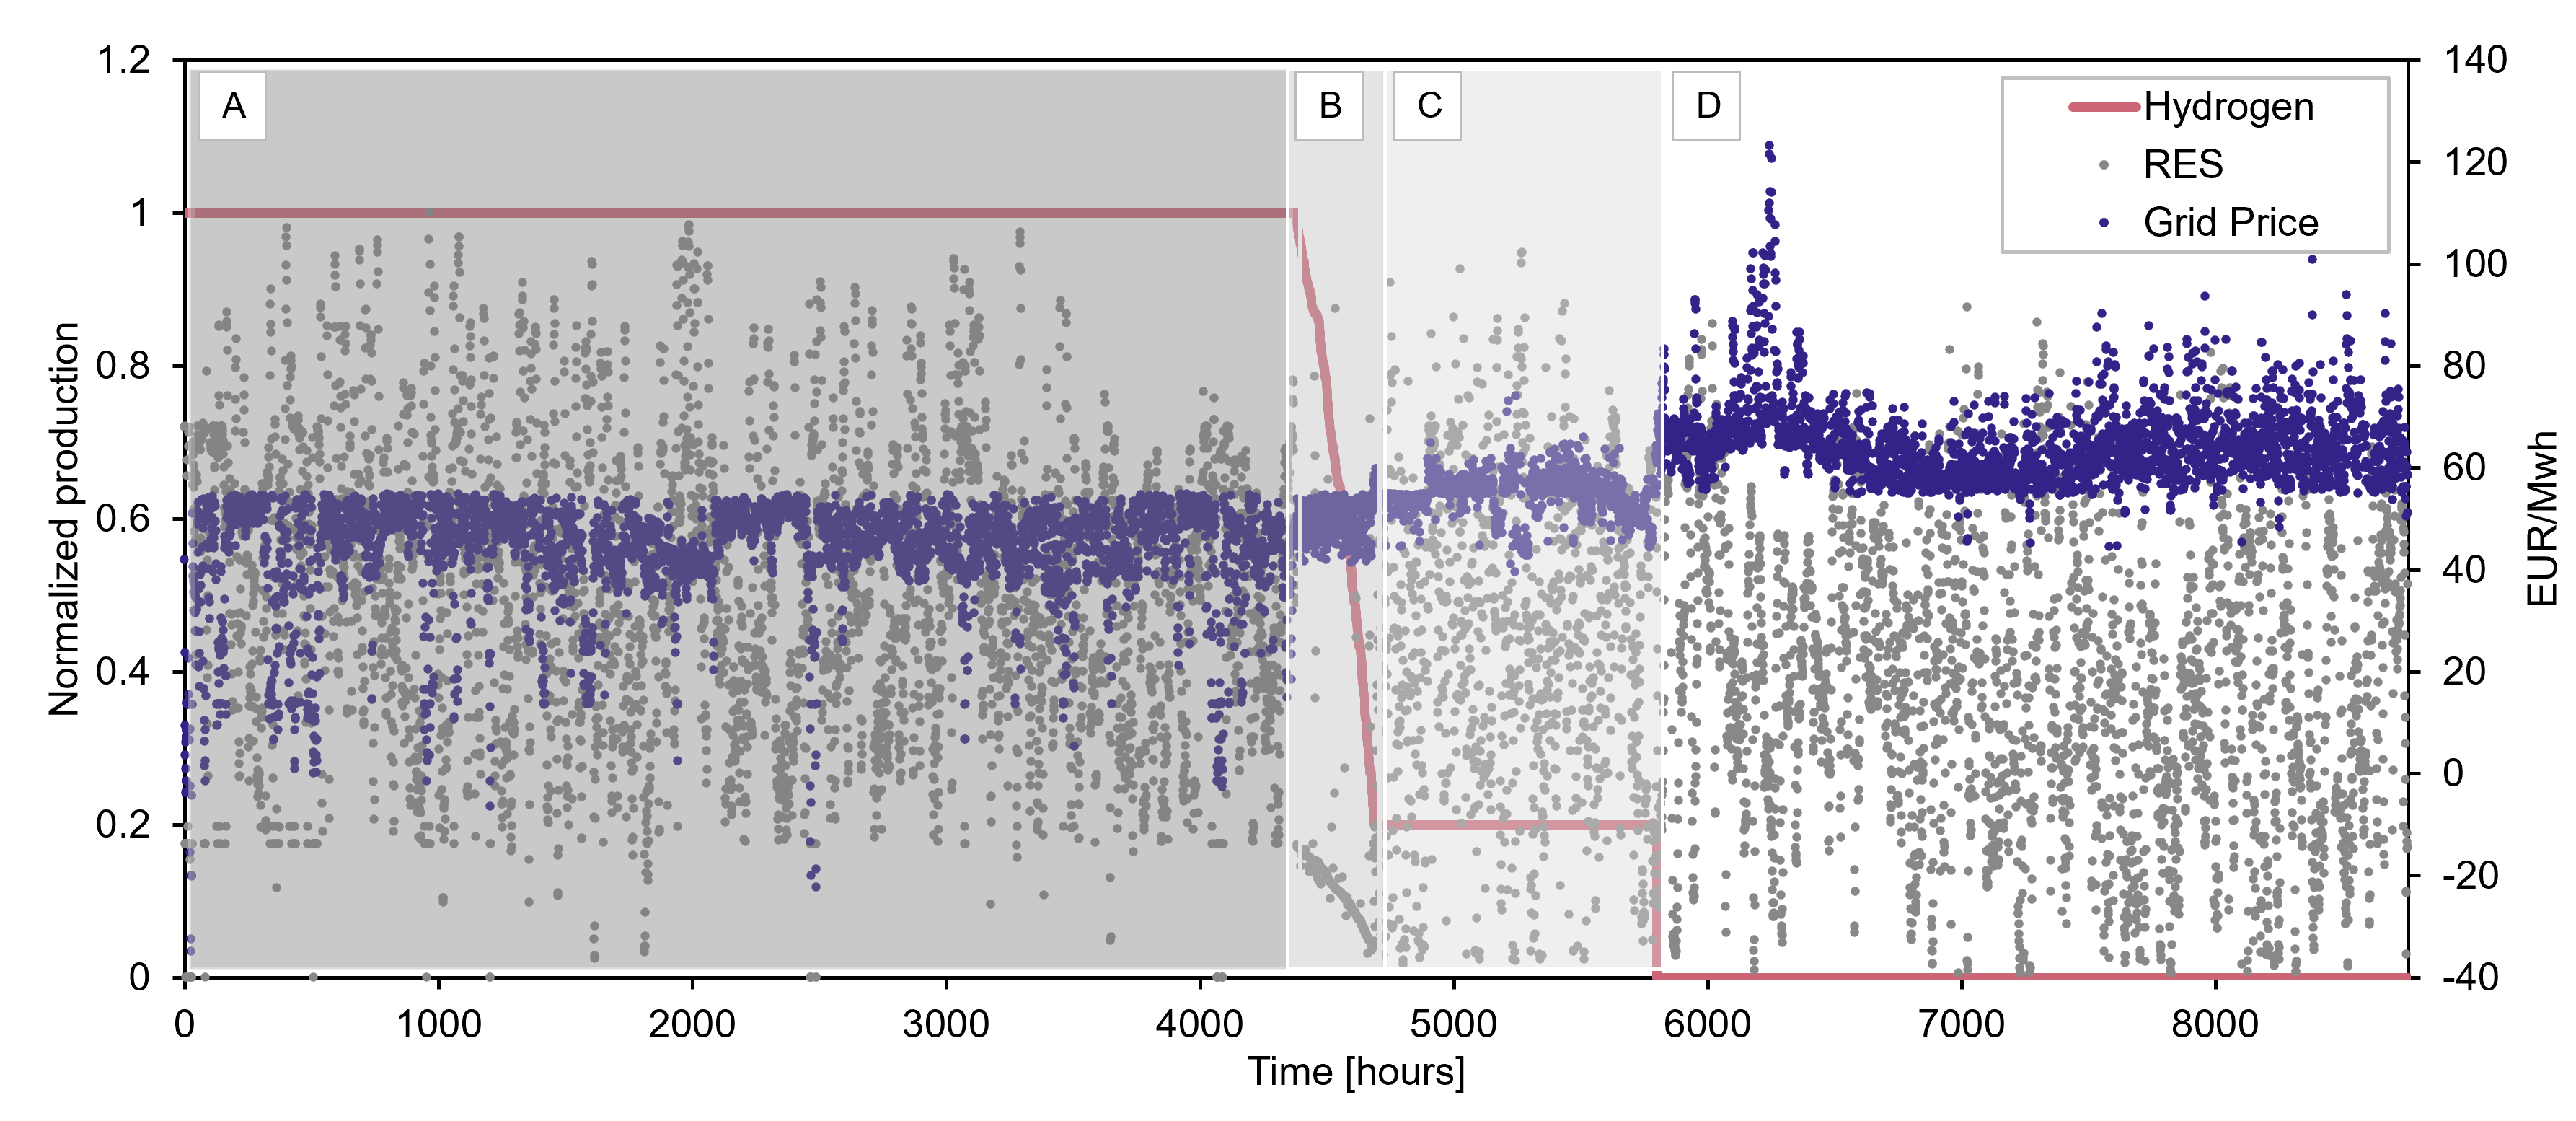
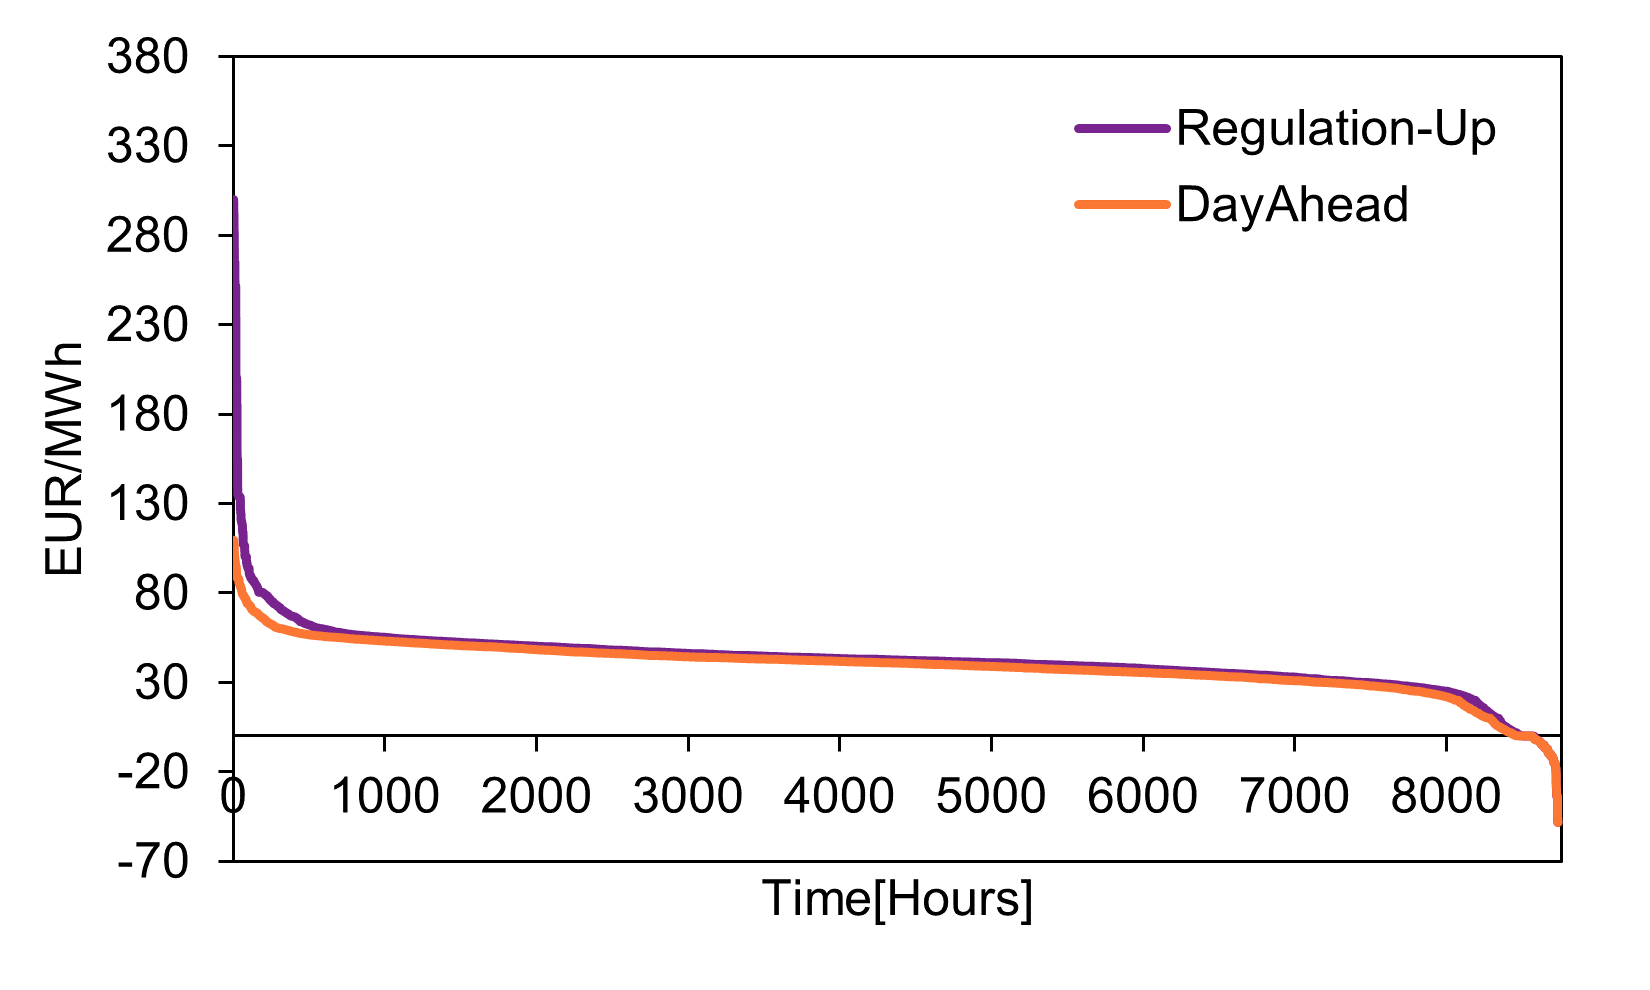
In the following, we investigate the bottlenecks of the initial Configuration 1. The electrolyzer acts as intermediate technology between the RES and the P2X units, therefore its operational pattern characterizes the hub’s overall behavior. Figure 7 shows the electrolyzer’s production duration curve (in descending order from max. to min. utilization) including the electricity prices and RES availability. In Area A (about 50% of the year), the electrolyzer operates at maximum capacity (i.e., normalized production is equal to 1) with relatively low electricity prices and high RES availability. Area B shows (a small share of hours) with medium electricity prices and decreasing RES availability. Here, the electrolyzer follows the RES availability since purchasing electricity from the grid is too expensive. Area C is characterized by technical limitations and medium to high electricity prices. Here, the hub prefers selling to the grid at high prices but the minimum load requirement forces the electrolyzer to operate on standby to ramp up fast when electricity prices are low. Finally, Area D (about 25% of the year) shows high electricity prices and no hydrogen production. The electrolyzer is shut down completely and the electricity is sold at the day-ahead market.
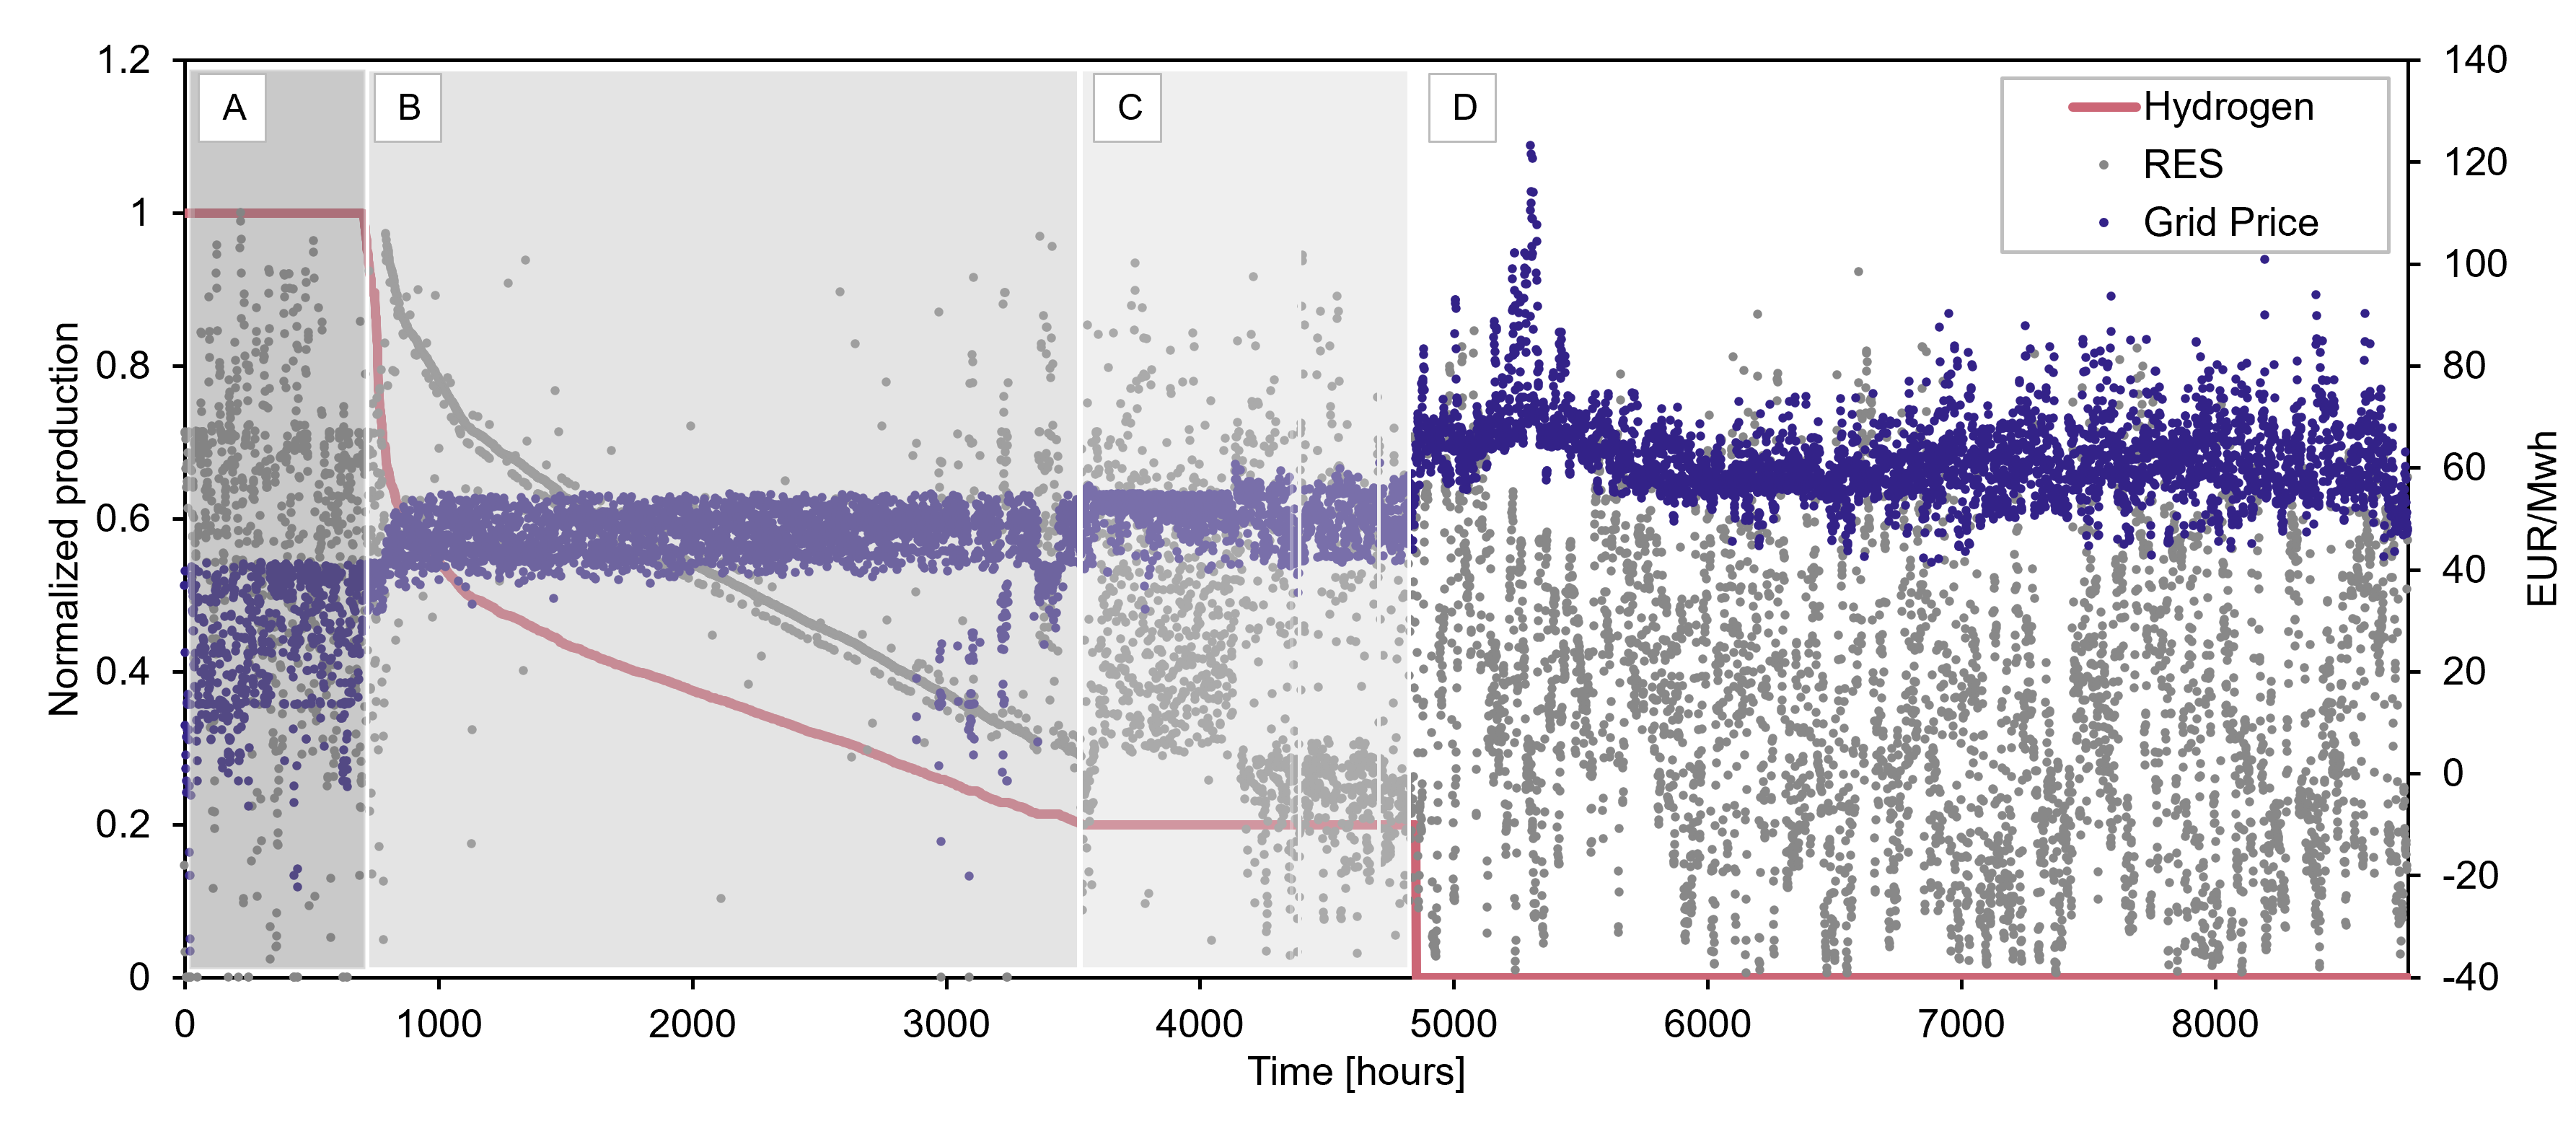
Next, we compare the bottlenecks of Configuration 1 (Figure 7) with the ones of Configuration 3 (Figure 8). Due to the higher electrolyzer capacity, the system is only fully utilized at very low prices (Area A decreases). At medium prices, the hydrogen production decreases with RES availability until the standby load is reached. Area B is much larger than in Configuration 1 due to the higher capacity. In addition, Area D is also larger, so the electrolyzer is shut down more often, maybe based on the fact that the minimum load is considerably higher now.
Configuration 3 can also be used to determine the merit order of the renewable fuels in the hub. This merit order is based on the market prices and production costs using a post-processing analysis (Table 3). In the production hours, the average production costs for ammonia and methanol are 0.24 €/kg and 0.28€/kg, respectively. Production is, however, only profitable in a limited number of hours with low and negative electricity prices (Figure 13). Following the merit order based on the profits of the fuels, hydrogen is dispatched first, then ammonia, and finally methanol (see full-load hours and profits in Table 3).
| Fuel | Market Price |
Average
Production Cost |
Full-load Hours |
Total
Production |
Fuel Sales |
|---|---|---|---|---|---|
| [€/kg] | [€/kg] | [h] | [Tons] | [mil. €] | |
| Liquid Hydrogen | 2.5 | 1.05 | 2045 | 3567 | 8.92 |
| Ammonia | 0.31 | 0.24 | 223 | 185 | 0.06 |
| Methanol | 0.32 | 0.28 | 220 | 436 | 0.14 |
To conclude, we find four operational patterns A,B,C, and D in Figures 7 and 8. These distinct areas should occur in every energy hub but will have different shares based on the hub’s configuration. In Area A, hydrogen production is fully utilized, however, purchasing electricity at low grid prices will lead to non-renewable fuels. Following the recent EC proposal, to produce renewable fuels sourcing from the grid, the grid would have to be 90% renewable in the previous year or renewable PPAs would have to be concluded. We will evaluate the latter option in Section 6.3. Area B in Figure 8 shows that given sufficient capacity, RES availability drives electrolyzer usage. Whereas, Area C indicates that the technical constraints have a significant influence on operations. Finally, Area D shows the times when producing renewable fuels including hydrogen is less profitable than selling electricity to the grid. To increase renewable fuels production, this area would have to be converted into a production area. An option to do that would be to increase the profitability of renewable fuels by introducing a premium paid on top of the price for conventional fuels.
We show that the renewable fuels methanol and ammonia are not competitive under current market prices. Without government intervention and support, these fuels will not be produced. To receive green premiums based on guarantees of origin, P2X plants must guarantee that their fuels are renewable. In Section 6.3, we, therefore, apply the latest EC proposal on renewable fuels and analyze the impact of renewable fuel premiums and renewable PPAs on the profitability of the P2X technologies in energy hubs.
First, however, we evaluate if offering ancillary services could be a viable business model for the GLS energy hub.
6.2 Ancillary Markets Participation
To analyze the effects of a fully integrated energy hub, we expand EnerHub2X and allow GLS to offer ancillary services. Based on our reasoning in Section 5.1, we focus on the mFRR market. Accordingly, respecting the TSO’s current regulations, the P2X assets can only offer up-regulation to the grid. The overall profit gained on the electricity markets consists of three main components (Table 4): the capacity payments, the day-ahead sales, and the activation payments. The table shows that offering mFRR services results in higher profits. The table also indicates, however, that the capacity and activation payments are small compared to the day-ahead profits because the market volume and prices are much smaller (again this could change with the European market integration).
| Result | Configuration 3 | Configuration 4 |
|---|---|---|
| Capacity Payment [mil. €] | - | 0.11 |
| Day-ahead Profit [mil. €] | 13.49 | 12.24 |
| Activation Payment [mil. €] | - | 1.44 |
| Overall Market Profit [mil. €] | 13.49 | 13.79 |
| Total Hydrogen Production [tons] | 4005 | 4293 |
The P2X assets, mainly the electrolysis plant as the most significant electricity consumer, provide demand response to the utility grid. Up-regulation leads to a decrease in the electricity consumption of the P2X assets. Consequently, the P2X assets must operate at least on a minimum level to offer the service and purchase the respective electricity on the day-ahead market. Therefore, the day-ahead profits are lower but compensated for by the additional profits from the mFRR market (Table 4). Also, the overall hydrogen production is higher, possibly because of not-activated reserves.
In this study, the mFRR participation holds minor advantages, however, including the uncertainty in prices and volumes would further diminish them. In addition, one needs to consider that when being activated by the TSO, the hub does not produce fuels. While not being activated, the hub produces fuel, which is, however, not considered renewable due to the use of electricity from the day-ahead market. Therefore, offering up-regulation is not an option for energy hubs that have the goal of being certified as renewable. Only when offering down-regulation (e.g., preventing RES curtailment), the produced fuels would be considered renewable by the EC’s proposal (European Commission, 2022b). Unfortunately, right now the Danish TSO Energinet does not purchase down-regulation.
6.3 Renewable Fuel Policy Instrument Scenarios
GLS is connected to its own on-site RES, and these will probably be built within three years of the P2X assets and can be used to produce renewable fuels. In Section 5.1, we have shown, however, that the production of methanol and ammonia is not economically viable. Therefore, in the following, we will introduce renewable fuel premiums to investigate the effects on the hub’s operations only using its own RES (Scenario A Off-grid).
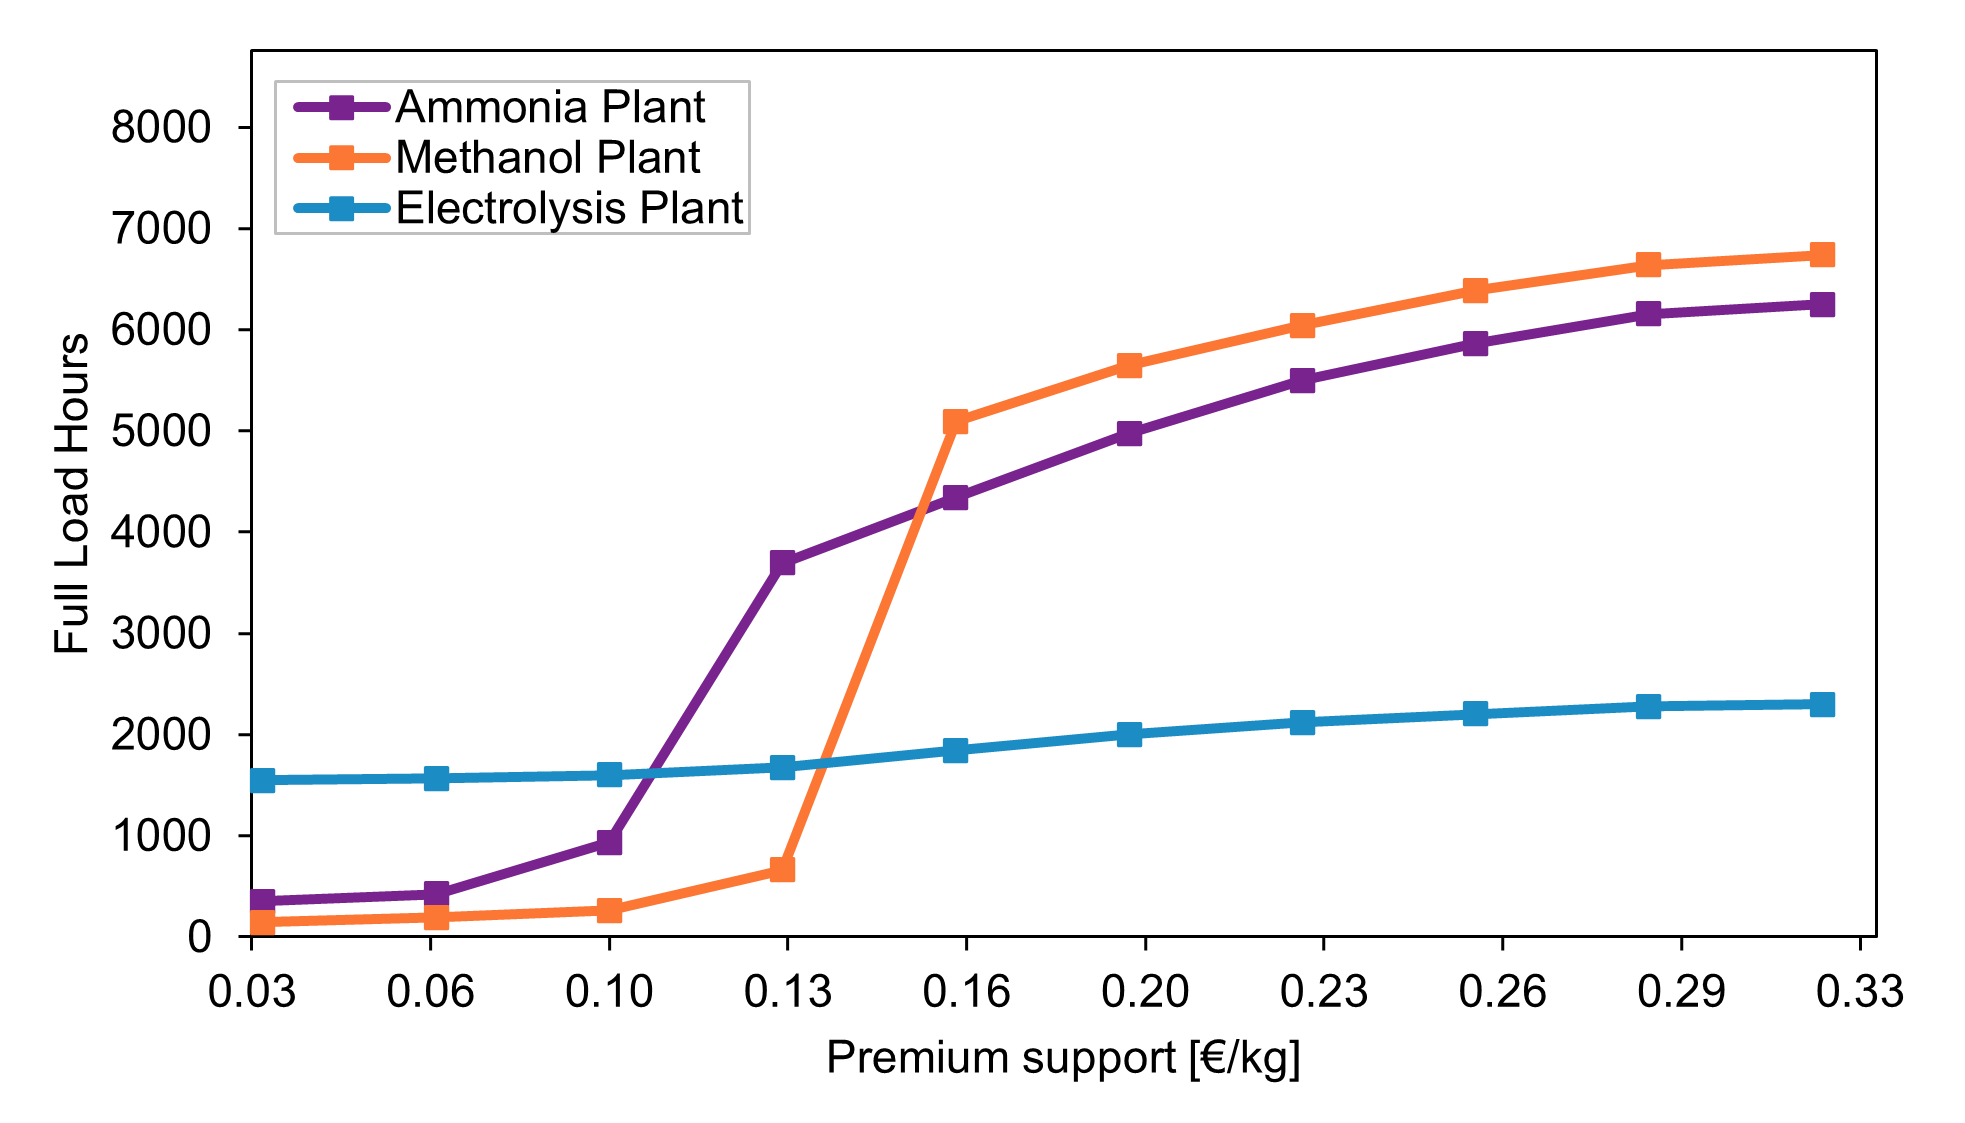
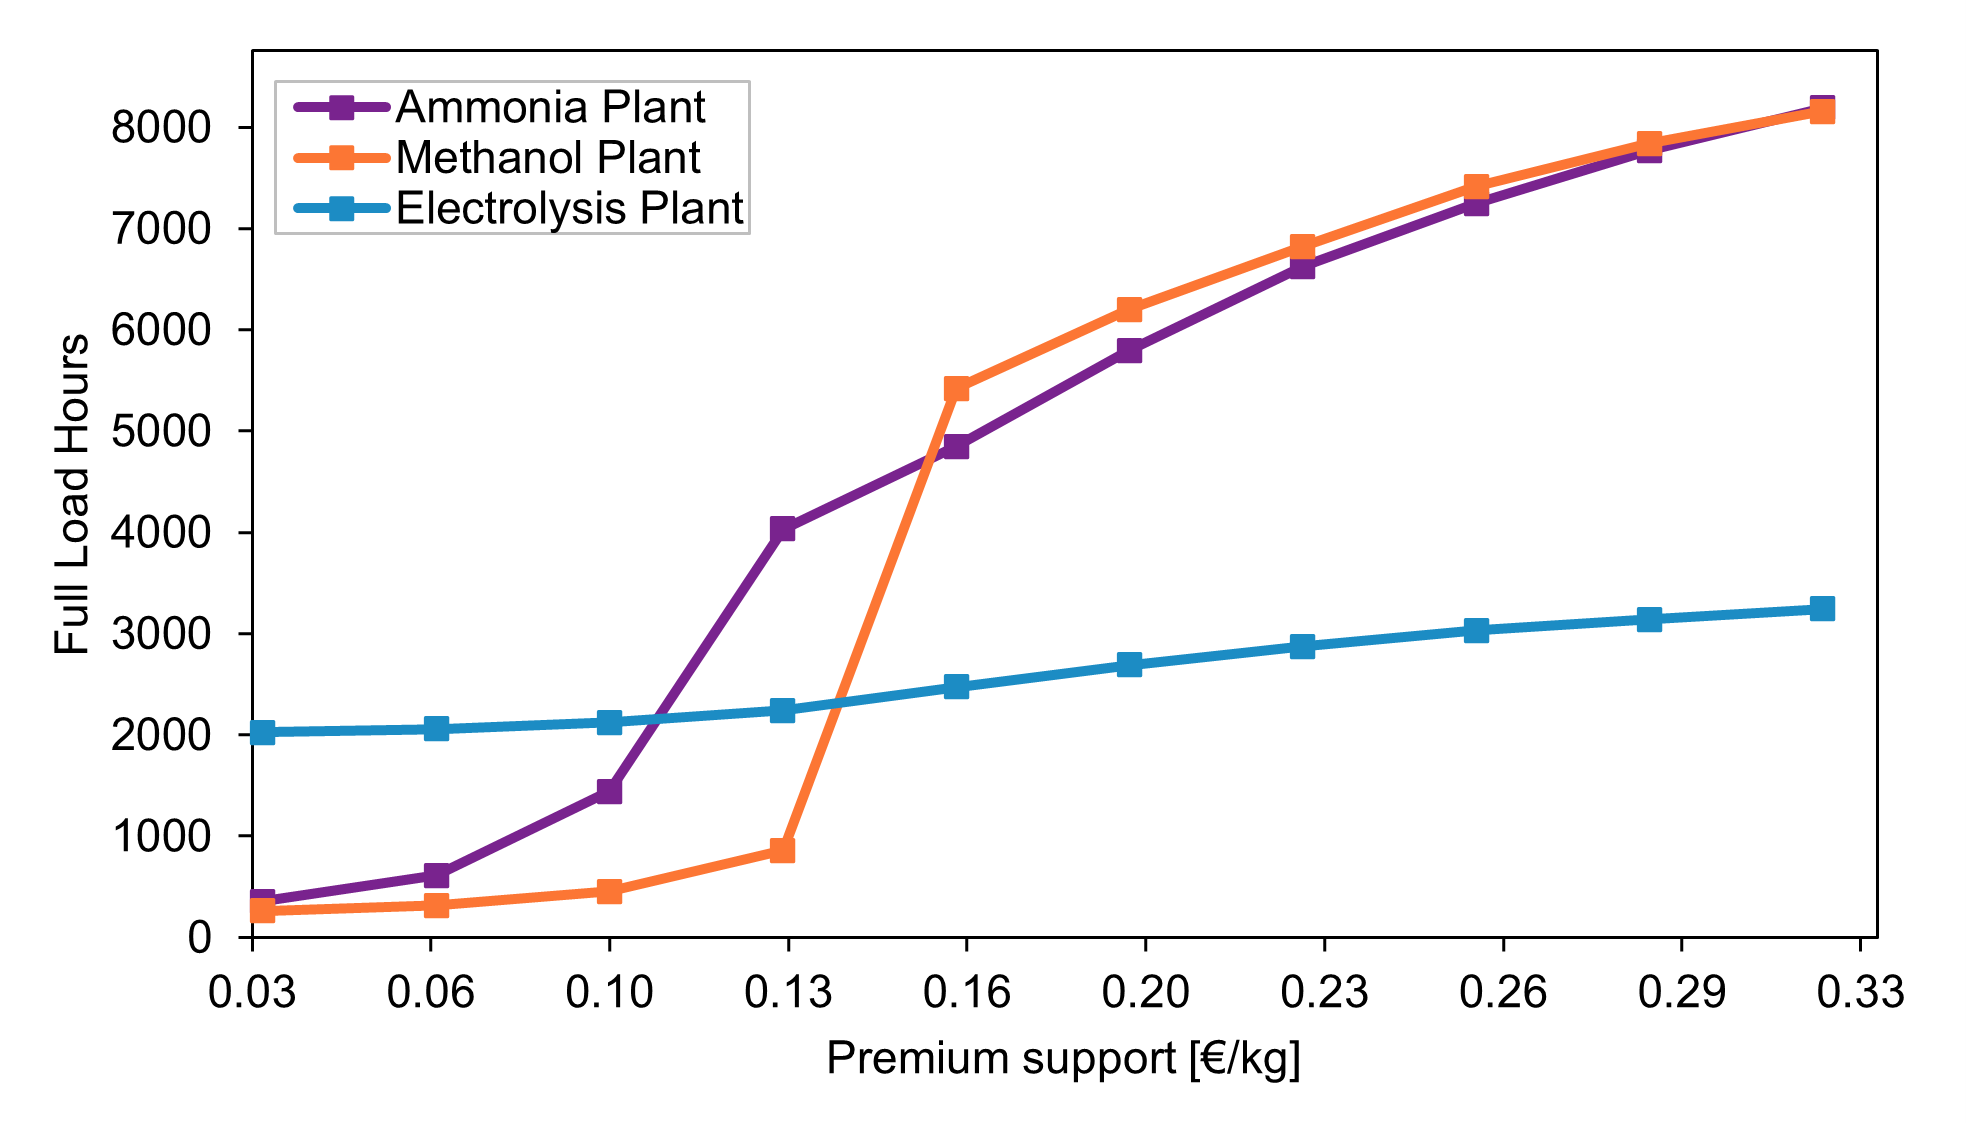
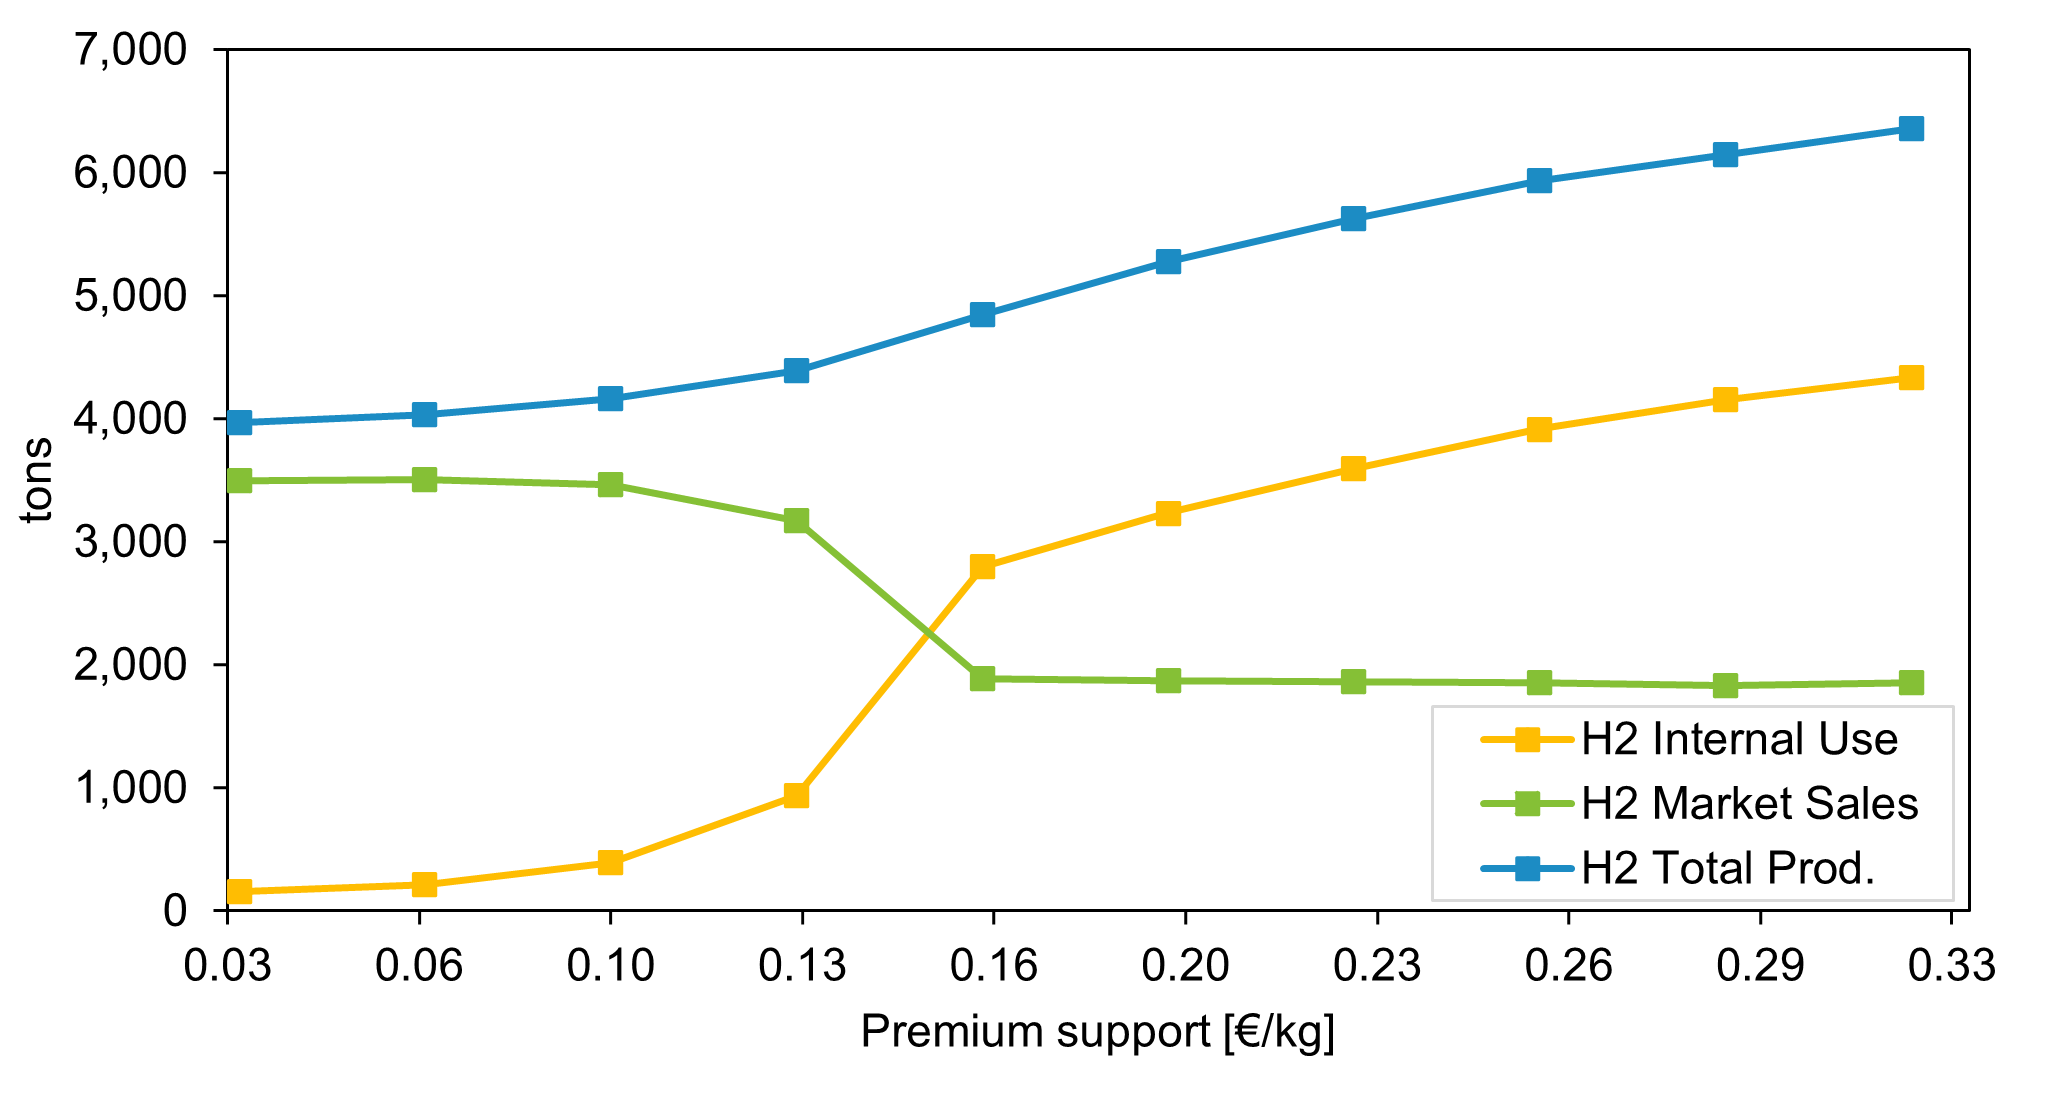
Figure 9 illustrates the impact of increasing the renewable premiums for ammonia and methanol in 10%-steps ranging from 10 to 100%. We analyze the electrolysis and P2X asset’s full-load hours (FLH) over the year by dividing the overall production by the daily capacity. We show that a premium of 40% (0.13 €/kg) on top of the conventional prices (Table 3) significantly increases the production of ammonia that used to be second in the merit order. An increase of 50% (0.16 €/kg) leads to an increase in the production of both renewable fuels above 4000 FLH. The graph also shows that the hydrogen FLH are not reduced because hydrogen is still needed to produce the other fuels (Figure 12). At this price level, the merit order of the products changes, and selling renewable fuels is preferred over liquid hydrogen. The production of renewable fuels is, however, still restricted by the availability of RES. Therefore, Figure 9 shows a saturation level of FLH even at high premiums.
To increase renewable fuel production, one could increase on-site RES or conclude a renewable PPA (local and without subsidies). We assume the RES capacities are already as large as possible and therefore concentrate on the second option in Scenario B (On-grid). In this study case, we assume a virtual PPA structure as described in Mendicino et al. (2019) and Danish Energy Agency (2019). The PPA follows the grid price and reflects the cost of the guarantees of origin (GO). Based on Sánchez and Jacobsen (2020) the price of GOs ranged from 0.4–0.5 €/MWh in 2019. Therefore, we assume GOs cost of 0.5 €/MWh.
Figure 11 shows that by concluding a PPA the FLH of the system increase because low or negative prices can be utilized. At low premium levels, both scenarios A and B show similar results. Using a PPA, however, higher premiums eventually lead to full utilization of the supported synthesizers. Figure 10 shows the change in the merit order towards renewable fuels at 0.16 €/kg and subsequently the continuous reduction of day-ahead market sales.
Overall, we find that renewable premiums increase the production and profitability of renewable fuels in the given GLS energy hub. Using only off-grid RES, their availability sets an upper bound on this expansion. This way, the capacities of P2X assets and on-site RES have to be reconciled carefully. Considering the multitude of influencing factors in these large-scale investments, harmonization might not always be possible. In this case, PPAs could be utilized to balance potential misalignments and allow for higher asset utilization. The EC regulation allows for this option, so the level of renewable premiums can be used to support renewable fuel production. We show that a premium of 0.16 €/kg, so a price 50% higher than conventional prices, leads to a substantial increase in renewable fuel production. In the end, however, it is a political decision which level of support should be chosen and which fuels to include in the support scheme.
6.4 Limitations and Future Research
In this study, GreenLab Skive’s operations and future expansion pathway are simulated. EnerHub2X can capture the hub’s dynamic evolution by flexibly adjusting its input parameters. Our study does, however, does not consider investments. Oftentimes, the hub’s production capacities are already defined and receive substantial subsidies. Therefore, we do not analyze the project’s overall economics. Optimal capacity expansion of energy hubs should be considered in future research.
Since the model behavior is highly affected by the price assumptions made regarding the electricity and feedstock prices, an investigation of how well our results transfer to other markets could be interesting.
In addition, the internal and external contracts between consortium members, electricity providers, and consumers could be investigated. The contracts should reflect a just allocation of the hub’s profit along the P2X value chain while ensuring the recovery of the individual investments.
Furthermore, studies could investigate the value of hydrogen and electric battery storage investments and quantify the value of additional flexibility to the energy hub. This could also include more detailed aspects of synergies, for example, considering the integration into a local district heating network.
Finally, future research could focus on the emerging ancillary markets of aFRR: PICASSO and mFRR: MARI. Due to the European integration, the revised structure of the markets and the potentially higher volumes could provide incentives for large consumer units (giga-scale electrolyzers) to provide down-regulation and help tackle system imbalances. Since this might prevent the curtailment of renewable production, the produced renewable fuel would be considered renewable. However, the uncertainty in these markets and the real-time activation magnitude should be properly addressed.
7 Conclusions and Policy Implications
Recently, the energy landscape is dominated by the discussion on how to rapidly expand renewable hydrogen infrastructure and production to decarbonize the hard-to-abate industry and transport sector. The REPowerEU initiative sets ambitious goals for domestic production and imports, and many EU countries have launched national hydrogen strategies supporting a multitude of pilot to giga-scale projects oftentimes connected to regional energy hubs. However, progress has been slow due to the long-standing ambiguity in the definition of what is considered renewable and the uncertain profitability of renewable fuel production due to new market conditions.
In this study, the multi-commodity flow model, EnerHub2X, simulates the planned expansion pathway of the GreenLab Skive energy hub to gain insights into the profitability of the operation of energy hubs under current market conditions. In addition, this study evaluates different policy instruments to promote renewable fuel production.
Overall, we find that the electricity prices, renewable energy availability, technical constraints, and feedstock prices strongly influence competition among energy vectors within the hub. The derived merit order of fuels under current market conditions results in a dispatch of hydrogen first, ammonia second, and methanol last. Low renewable energy availability decreases the production of hydrogen substantially and technical constraints can drive system behavior (e.g., forcing standby mode). In addition, a large amount of the renewable electricity produced on-site is not used for renewable fuel production but sold to the grid. Producing electrofuels (ammonia and methanol) is not economically viable under the current market conditions throughout most of the year. We, therefore, conclude that energy hubs must receive renewable fuel premiums to increase fuel production. But in order to do so, the fuels would have to be certified as renewable. A recent proposal by the European Commission (2022b) defines the production requirements, taking into account renewable electricity additionality, as well as temporal, and geographic correlation.
Consequently, energy hubs would not be allowed to source electricity from the grid without using their renewable status. Yet, we show that the exclusive use of on-site renewable energy sources (RES) can lead to imbalances and lower utilization of power-to-X (P2X) resources. This can only be prevented by carefully coordinating the capacity expansions of RES and P2X. As this can be challenging due to the multitude of influence factors, we promote using renewable purchase power agreements (PPA) to maintain flexibility. We show that a renewable fuel premium of 0.16 €/kg corresponding to a 50% increase in ammonia and methanol prices leads to a substantial increase in renewable fuel production and more than 4000 full-load hours for both fuels.
In addition, we note that offering ancillary services has only incremental gains. Due to market characteristics, the energy hub in DK 1 could only access the market for manual frequency restoration reserve (mFRR). The Danish TSO Energinet only purchases mFRR up-regulation, which would lead to a decrease in fuel production. In addition, the electricity procured and consumed is not considered renewable. However, the European Commission considers down-regulation as renewable because it prevents renewable energy from being curtailed. This could be an interesting revenue stream in connection with the increase in volume and possibly prices due to the European integration of reserve power markets.
The model’s behavior is primarily driven by its price assumptions. The current COVID-19 pandemic and energy crisis and their impact on electricity and fuel prices would have a substantial effect on the results. COVID-19 led to lower electricity prices (2020 DK1: 38 €/MWh), while the energy crisis causes a historic surge in prices (2021 DK1: 88 €/MWh)999https://www.nordpoolgroup.com/en/Market-data1/Dayahead/Area-Prices/ALL1/Yearly/?view=table. These fluctuations increase uncertainty even further and highly affect the profitability of individual fuels. On-site RES and long-term PPAs might hedge some of these uncertainties.
Fuel prices for hydrogen, methanol, and ammonia are also affected. The global markets for hydrogen and ammonia are closely linked. The recent rise in natural gas prices leads to higher hydrogen and ammonia prices101010https://www.eia.gov/todayinenergy/detail.php?id=52358. However, conventional methanol, a petroleum-based product, has not been as affected 111111https://tradingeconomics.com/commodity/methanol. This may indicate that hydrogen and ammonia production may already be profitable in the current situation, while methanol production is still dominated by its fossil fuel-based alternative and therefore needs fuel premiums more.
Data availability
The code and data that were used for this study are available on GitHub121212https://github.com/IoannisKountouris/.
Declaration of competing interests
The authors declare that they have no known competing financial interests or personal relationships that could have appeared to influence the work reported in this paper.
Acknowledgements
The authors would like to acknowledge financial support from the SuperP2G project that has received funding in the framework of the joint programming initiative ERA-Net Smart Energy Systems’ focus initiative Integrated, Regional Energy Systems, with support from the European Union’s Horizon 2020 research and innovation programme under grant agreement No 775970.
References
- Aljabery et al. (2021) Aljabery, A.A.M., Mehrjerdi, H., Mahdavi, S., Hemmati, R., 2021. Multi carrier energy systems and energy hubs: Comprehensive review, survey and recommendations. International Journal of Hydrogen Energy 46, 23795–23814. doi:10.1016/j.ijhydene.2021.04.178.
- Almassalkhi and Hiskens (2011) Almassalkhi, M., Hiskens, I., 2011. Optimization Framework for the Analysis of Large-scale Networks of Energy Hubs, in: Proceedings: 17th Power Systems Computation Conference 2011, Curran Associates, Stockholm.
- Armijo and Philibert (2020) Armijo, J., Philibert, C., 2020. Flexible production of green hydrogen and ammonia from variable solar and wind energy: Case study of Chile and Argentina. International Journal of Hydrogen Energy 45, 1541–1558. doi:10.1016/j.ijhydene.2019.11.028.
- Bellotti et al. (2022) Bellotti, D., Rivarolo, M., Magistri, L., 2022. A comparative techno-economic and sensitivity analysis of Power-to-X processes from different energy sources. Energy Conversion and Management 260, 115565. doi:10.1016/j.enconman.2022.115565.
- Bramstoft et al. (2020) Bramstoft, R., Pizarro-Alonso, A., Jensen, I.G., Ravn, H., Münster, M., 2020. Modelling of renewable gas and renewable liquid fuels in future integrated energy systems. Applied Energy 268, 114869. doi:10.1016/j.apenergy.2020.114869.
- Chehade et al. (2019) Chehade, Z., Mansilla, C., Lucchese, P., Hilliard, S., Proost, J., 2019. Review and analysis of demonstration projects on power-to-X pathways in the world. International Journal of Hydrogen Energy 44, 27637–27655. doi:10.1016/j.ijhydene.2019.08.260.
- Chen and Yang (2021) Chen, C., Yang, A., 2021. Power-to-methanol: The role of process flexibility in the integration of variable renewable energy into chemical production. Energy Conversion and Management 228, 113673. doi:10.1016/j.enconman.2020.113673.
- Chen et al. (2018) Chen, Y., Wei, W., Liu, F., Wu, Q., Mei, S., 2018. Analyzing and validating the economic efficiency of managing a cluster of energy hubs in multi-carrier energy systems. Applied Energy 230, 403–416. doi:10.1016/j.apenergy.2018.08.112.
- Danish Energy Agency (2019) Danish Energy Agency, 2019. Analysis of the Potential for Corporate Power Purchasing Agreements for Renewable Energy Production in Denmark. Technical Report. URL: https://ens.dk/sites/ens.dk/files/Analyser/corporate_ppa_report_june_2019.pdf.
- Danish Energy Agency (2022) Danish Energy Agency, 2022. Technology Data – Renewable fuels. Technical Report. Danish Energy Agency and Energinet. URL: https://ens.dk/sites/ens.dk/files/Analyser/technology_data_for_renewable_fuels.pdf. version 8.
- Danish Government (2020) Danish Government, 2020. A Green and Sustainable World - The Danish Government’s long-term strategy for global climate action. URL: https://um.dk/en/-/media/websites/umen/foreign-policy/global-climate-action-strategy/a_green_and_sustainable_world.ashx.
- Decourt (2019) Decourt, B., 2019. Weaknesses and drivers for power-to-X diffusion in Europe. Insights from technological innovation system analysis. International Journal of Hydrogen Energy 44, 17411–17430. doi:10.1016/j.ijhydene.2019.05.149.
- Ding et al. (2022) Ding, T., Jia, W., Shahidehpour, M., Han, O., Sun, Y., Zhang, Z., 2022. Review of Optimization Methods for Energy Hub Planning, Operation, and Control. IEEE Transactions on Sustainable Energy , 1–1doi:10.1109/TSTE.2022.3172004.
- ENERGINET (2019) ENERGINET, 2019. PTX IN DENMARK BEFORE 2030. URL: https://energinet.dk/Om-publikationer/Publikationer/RS-Analyse-April-2019-PtX-i-Danmark-foer-2030.
- Energinet (2019) Energinet, 2019. Winds of change in a hydrogen perspective - PtX strategic action plan. URL: https://energinet.dk/-/media/4385DB7A333248E7A1A3EA8674E460DA.PDF.
- European Commission (2018) European Commission, 2018. Directive (EU) 2018/2001 of the European Parliament and of the Council of 11 December 2018 on the promotion of the use of energy from renewable sources. URL: https://eur-lex.europa.eu/legal-content/EN/TXT/?uri=uriserv:OJ.L_.2018.328.01.0082.01.ENG.
- European Commission (2022a) European Commission, 2022a. REPowerEU Plan. URL: https://ec.europa.eu/commission/presscorner/detail/en/IP_22_3131.
- European Commission (2022b) European Commission, 2022b. Supplementary to Directive (EU) 2018/2001 rules on renewable e-fuels. URL: https://eur-lex.europa.eu/legal-content/EN/TXT/?uri=PI_COM:Ares(2022)3836651.
- Gahleitner (2013) Gahleitner, G., 2013. Hydrogen from renewable electricity: An international review of power-to-gas pilot plants for stationary applications. International Journal of Hydrogen Energy 38, 2039–2061. doi:10.1016/j.ijhydene.2012.12.010.
- Geidl and Andersson (2007) Geidl, M., Andersson, G., 2007. Optimal Power Flow of Multiple Energy Carriers. IEEE Transactions on Power Systems 22, 145–155. doi:10.1109/TPWRS.2006.888988. conference Name: IEEE Transactions on Power Systems.
- Ghasemi et al. (2018) Ghasemi, A., Banejad, M., Rahimiyan, M., 2018. Integrated energy scheduling under uncertainty in a micro energy grid. IET Generation, Transmission & Distribution 12, 2887–2896. doi:10.1049/iet-gtd.2017.1631.
- Glenk and Reichelstein (2019) Glenk, G., Reichelstein, S., 2019. Economics of converting renewable power to hydrogen. Nature Energy 4, 216–222. doi:10.1038/s41560-019-0326-1.
- Guelpa et al. (2019) Guelpa, E., Bischi, A., Verda, V., Chertkov, M., Lund, H., 2019. Towards future infrastructures for sustainable multi-energy systems: A review. Energy 184, 2–21. doi:10.1016/j.energy.2019.05.057.
- Hajimiragha et al. (2007) Hajimiragha, A., Canizares, C., Fowler, M., Geidl, M., Andersson, G., 2007. Optimal Energy Flow of integrated energy systems with hydrogen economy considerations, in: Proceedings: 2007 iREP Symposium - Bulk Power System Dynamics and Control - VII. Revitalizing Operational Reliability, pp. 1–11. doi:10.1109/IREP.2007.4410517.
- Hemmes et al. (2007) Hemmes, K., Zachariah-Wolf, J.L., Geidl, M., Andersson, G., 2007. Towards multi-source multi-product energy systems. International Journal of Hydrogen Energy 32, 1332–1338. doi:10.1016/j.ijhydene.2006.10.013.
- IEA (2019) IEA, 2019. The Future of Hydrogen. Technical Report. URL: https://www.iea.org/reports/the-future-of-hydrogen.
- IEA (2021a) IEA, 2021a. Global Hydrogen Review. URL: https://iea.blob.core.windows.net/assets/5bd46d7b-906a-4429-abda-e9c507a62341/GlobalHydrogenReview2021.pdf.
- IEA (2021b) IEA, 2021b. Hydrogen Projects Database. URL: https://www.iea.org/data-and-statistics/data-product/hydrogen-projects-database.
- IEA (2021c) IEA, 2021c. Net Zero by 2050. Technical Report. Paris. URL: https://www.iea.org/reports/net-zero-by-2050.
- IEA - Advanced Motor Fuels (2020a) IEA - Advanced Motor Fuels, 2020a. Ammonia Application in IC Engines. Technical Report. URL: https://iea-amf.org/app/webroot/files/file/other%20publications/Ammonia%20Application%20in%20IC%20Engines.pdf.
- IEA - Advanced Motor Fuels (2020b) IEA - Advanced Motor Fuels, 2020b. Methanol as Motor Fuel. Technical Report. URL: https://www.iea-amf.org/app/webroot/files/file/Annex%20Reports/AMF_Annex_56.pdf.
- Incer-Valverde et al. (2022) Incer-Valverde, J., Patiño-Arévalo, L.J., Tsatsaronis, G., Morosuk, T., 2022. Hydrogen-driven Power-to-X: State of the art and multicriteria evaluation of a study case. Energy Conversion and Management 266, 115814. doi:10.1016/j.enconman.2022.115814.
- Kauw et al. (2015) Kauw, M., Benders, R.M.J., Visser, C., 2015. Green methanol from hydrogen and carbon dioxide using geothermal energy and/or hydropower in Iceland or excess renewable electricity in Germany. Energy 90, 208–217. doi:10.1016/j.energy.2015.06.002.
- Klyapovskiy et al. (2021) Klyapovskiy, S., Zheng, Y., You, S., Bindner, H.W., 2021. Optimal operation of the hydrogen-based energy management system with P2X demand response and ammonia plant. Applied Energy 304, 117559. doi:10.1016/j.apenergy.2021.117559.
- Krause et al. (2011) Krause, T., Andersson, G., Fröhlich, K., Vaccaro, A., 2011. Multiple-Energy Carriers: Modeling of Production, Delivery, and Consumption. Proceedings of the IEEE 99, 15–27. doi:10.1109/JPROC.2010.2083610.
- Lester et al. (2020) Lester, M.S., Bramstoft, R., Münster, M., 2020. Analysis on Electrofuels in Future Energy Systems: A 2050 Case Study. Energy 199, 117408. doi:10.1016/j.energy.2020.117408.
- Lin et al. (2021) Lin, H., Wu, Q., Chen, X., Yang, X., Guo, X., Lv, J., Lu, T., Song, S., McElroy, M., 2021. Economic and technological feasibility of using power-to-hydrogen technology under higher wind penetration in China. Renewable Energy 173, 569–580. doi:10.1016/j.renene.2021.04.015.
- Lück et al. (2017) Lück, L., Larscheid, P., Maaz, A., Moser, A., 2017. Economic potential of water electrolysis within future electricity markets, in: 2017 14th International Conference on the European Energy Market (EEM), pp. 1–6. doi:10.1109/EEM.2017.7981950. iSSN: 2165-4093.
- Mancarella (2014) Mancarella, P., 2014. MES (multi-energy systems): An overview of concepts and evaluation models. Energy 65, 1–17. doi:10.1016/j.energy.2013.10.041.
- Maniyali et al. (2013) Maniyali, Y., Almansoori, A., Fowler, M., Elkamel, A., 2013. Energy Hub Based on Nuclear Energy and Hydrogen Energy Storage. Industrial & Engineering Chemistry Research 52, 7470–7481. doi:10.1021/ie302161n.
- Maroufmashat et al. (2016) Maroufmashat, A., Fowler, M., Sattari Khavas, S., Elkamel, A., Roshandel, R., Hajimiragha, A., 2016. Mixed integer linear programing based approach for optimal planning and operation of a smart urban energy network to support the hydrogen economy. International Journal of Hydrogen Energy 41, 7700–7716. doi:10.1016/j.ijhydene.2015.08.038.
- Mendicino et al. (2019) Mendicino, L., Menniti, D., Pinnarelli, A., Sorrentino, N., 2019. Corporate power purchase agreement: Formulation of the related levelized cost of energy and its application to a real life case study. Applied Energy 253, 113577. doi:10.1016/j.apenergy.2019.113577.
- Mohammadi et al. (2017) Mohammadi, M., Noorollahi, Y., Mohammadi-ivatloo, B., Yousefi, H., 2017. Energy hub: From a model to a concept – A review. Renewable and Sustainable Energy Reviews 80, 1512–1527. doi:10.1016/j.rser.2017.07.030.
- Morgan et al. (2017) Morgan, E.R., Manwell, J.F., McGowan, J.G., 2017. Sustainable Ammonia Production from U.S. Offshore Wind Farms: A Techno-Economic Review. ACS Sustainable Chemistry & Engineering 5, 9554–9567. doi:10.1021/acssuschemeng.7b02070.
- Nasir et al. (2022) Nasir, M., Rezaee Jordehi, A., Matin, S.A.A., Tabar, V.S., Tostado-Véliz, M., Mansouri, S.A., 2022. Optimal operation of energy hubs including parking lots for hydrogen vehicles and responsive demands. Journal of Energy Storage 50, 104630. doi:10.1016/j.est.2022.104630.
- Ordóñez et al. (2021) Ordóñez, D.F., Halfdanarson, T., Ganzer, C., Guillén-Gosálbez, G., Dowell, N.M., Shah, N., 2021. Carbon or Nitrogen-based e-fuels? A comparative techno-economic and full environmental assessment, in: Türkay, M., Gani, R. (Eds.), Computer Aided Chemical Engineering. Elsevier. volume 50 of 31 European Symposium on Computer Aided Process Engineering, pp. 1623–1628. doi:10.1016/B978-0-323-88506-5.50251-5.
- Osman et al. (2020) Osman, O., Sgouridis, S., Sleptchenko, A., 2020. Scaling the production of renewable ammonia: A techno-economic optimization applied in regions with high insolation. Journal of Cleaner Production 271, 121627. doi:10.1016/j.jclepro.2020.121627.
- Parra et al. (2017) Parra, D., Zhang, X., Bauer, C., Patel, M.K., 2017. An integrated techno-economic and life cycle environmental assessment of power-to-gas systems. Applied Energy 193, 440–454. doi:10.1016/j.apenergy.2017.02.063.
- Pérez-Fortes et al. (2016) Pérez-Fortes, M., Schöneberger, J.C., Boulamanti, A., Tzimas, E., 2016. Methanol synthesis using captured CO2 as raw material: Techno-economic and environmental assessment. Applied Energy 161, 718–732. doi:10.1016/j.apenergy.2015.07.067.
- Sadeghi et al. (2019) Sadeghi, H., Rashidinejad, M., Moeini-Aghtaie, M., Abdollahi, A., 2019. The energy hub: An extensive survey on the state-of-the-art. Applied Thermal Engineering 161, 114071. doi:10.1016/j.applthermaleng.2019.114071.
- Salmon and Bañares-Alcántara (2021) Salmon, N., Bañares-Alcántara, R., 2021. Green ammonia as a spatial energy vector: a review. Sustainable Energy & Fuels 5, 2814–2839. doi:10.1039/D1SE00345C.
- Scolaro and Kittner (2022) Scolaro, M., Kittner, N., 2022. Optimizing hybrid offshore wind farms for cost-competitive hydrogen production in Germany. International Journal of Hydrogen Energy 47, 6478–6493. doi:10.1016/j.ijhydene.2021.12.062.
- Sharif et al. (2014) Sharif, A., Almansoori, A., Fowler, M., Elkamel, A., Alrafea, K., 2014. Design of an energy hub based on natural gas and renewable energy sources. International Journal of Energy Research 38, 363–373. doi:10.1002/er.3050.
- Skov and Schneider (2022) Skov, I.R., Schneider, N., 2022. Incentive structures for power-to-X and e-fuel pathways for transport in EU and member states. Energy Policy 168, 113121. doi:10.1016/j.enpol.2022.113121.
- Son et al. (2021) Son, Y.G., Oh, B.C., Acquah, M.A., Fan, R., Kim, D.M., Kim, S.Y., 2021. Multi Energy System With an Associated Energy Hub: A Review. IEEE Access 9, 127753–127766. doi:10.1109/ACCESS.2021.3108142.
- Statista (2021) Statista, 2021. Production capacity of methanol worldwide from 2018 to 2020, with a forecast for 2030. URL: https://www.statista.com/statistics/1065891/global-methanol-production-capacity/.
- Statista (2022) Statista, 2022. Production capacity of ammonia worldwide from 2018 to 2021, with a forecast for 2026 and 2030. URL: https://www.statista.com/statistics/1065865/ammonia-production-capacity-globally/.
- Sánchez and Jacobsen (2020) Sánchez, I.N.B., Jacobsen, H.K., 2020. Potentials for transborder green gas and hydrogen certificate markets. Technical Report.
- Zhang et al. (2020) Zhang, H., Wang, L., Van herle, J., Maréchal, F., Desideri, U., 2020. Techno-economic comparison of green ammonia production processes. Applied Energy 259, 114135. doi:10.1016/j.apenergy.2019.114135.
- Zhang et al. (2019) Zhang, Q., Martín, M., Grossmann, I.E., 2019. Integrated design and operation of renewables-based fuels and power production networks. Computers & Chemical Engineering 122, 80–92. doi:10.1016/j.compchemeng.2018.06.018.
- Zheng et al. (2022) Zheng, Y., You, S., Li, X., Bindner, H.W., Münster, M., 2022. Data-driven robust optimization for optimal scheduling of power to methanol. Energy Conversion and Management 256, 115338. doi:10.1016/j.enconman.2022.115338.
Appendix A Additional Figures
Appendix B Future hydrogen related projects
| Project | Lead role/ | Location | Size | Type | Output | Year |
| Tech. provider | [MWe] | |||||
| Mobility | ||||||
| H2 Energy Research Field | Toshiba | Fukushima (JPN) | 10 | ALK | H2 | 2020 |
| Air Liquide Bécancour | Air Liquide/ Cummins (US) | Bécancour (CAN) | 20 | PEM | H2 | 2021 |
| Green fuels for DK | Ørsted & mobility companies/ | Copenhagen (DNK) | 10 | ? | H2 | 2023 |
| ? | 250 | e-fuels | 2027 | |||
| 1300 | e-fuels | 2030 | ||||
| Ports | ||||||
| ? | H2 Energy (CHE)/ Plug (USA) | Esbjerg (DNK) | 1000 | PEM | H2 | 2024 |
| HØST PtX Esbjerg | CIP/ Plug (USA) | Esbjerg (DNK) | 1000 | PEM | NH3 | 2025 |
| Refurbished refineries | ||||||
| Refhyne | Shell/ ITM (GBR) | Wesseling (DEU) | 10 | PEM | H2 | 2021 |
| 100 | 2025 | |||||
| HySynergy | Everfuel, Crossbridge Energy/ | Fredericia (DNK) | 20 | PEM | H2 | 2022 |
| ? | 300 | ? | H2 | 2025 | ||
| 1000 | ? | H2 | 2030 | |||
| GET H2 Lingen | RWE/ Sunfire (ALK), | Lingen (DEU) | 10 | ALK | H2 | 2023 |
| Linde (PEM) | 4 | PEM | H2 | 2023 | ||
| 300 | ? | 2026 | ||||
| Westküste 100 | Shell/ EDF (FRA) | Heide (DEU) | 30 | ALK | H2 | 2023 |
| 700 | H2 | 2030 | ||||
| Lingen Green Hydrogen | BP, Ørsted (DNK)/ | Lingen (DEU) | 50 | ? | H2 | 2024 |
| ? | 100 | H2 | 2025 | |||
| 500 | H2 | 2027 | ||||
| Ammonia production | ||||||
| Cachimayo Plant | Industrias Cachimayo | Cusco (PER) | 25 | ALK | NH3 | 1965 |
| Green hydrogen plant | Iberdrola/ Nel ASA (NO) | Puertollano (ES) | 20 | PEM | NH3 | 2022 |
| HyEx | Engie (FRA), Enaex/ | Antofagasta (CHL) | 26 | ? | NH3 | 2025 |
| ? | 1600 | NH3 | 2030 | |||
Appendix C Data and GreenLab Skive technical parameters
| Energy Carrier | Units | Market Price 2019 | Source |
|---|---|---|---|
| Day-ahead electricity, DK1 | €/MWh | Dynamic | (131313see https://www.energidataservice.dk/tso-electricity/Elspotprices/ ) |
| Electricity grid tarrifs | €/MWh | 13.5 | ENERGINET (2019) |
| Frequency Restoration Reserves (mFRR), DK1 | €/MW | Dynamic | (141414see https://www.energidataservice.dk/tso-electricity/MfrrReservesDK1/ ) |
| Regulating prices | €/MWh | Dynamic | (151515 https://www.energidataservice.dk/tso-electricity/RealtimeMarket/ ) |
| Hydrogen | €/kg | 2.5 | IEA (2019) |
| Ammonia | €/kg | 0.31 | (161616 https://www.icis.com/explore/resources/news/2019/09/20/10420486/tfi-19-global-ammonia-prices-stable-to-firm-ahead-of-first-q4-spot-business/ ) |
| Methanol | €/kg | 0.32 | (171717see https://www.methanol.org/methanol-price-supply-demand/ ) |
| Water | €/kg | 0.078 | Glenk and Reichelstein (2019) |
| CO2 | €/kg | 0.27 | Internal contract price |
| Production | Flow balance | ||||
| Carrier | Units | IN | OUT | IN | OUT |
| Electricity | MWh | 53.06 | 85% | ||
| Water | Tons | 9.55 | 15% | ||
| Hydrogen | Tons | 1 | 5% | ||
| Heat | MWh | 9.76 | 44% | ||
| Oxygen | Tons | 11.26 | 51% | ||
| 100% | 100% | ||||
| Production | Flow balance | ||||
| Carrier | Units | IN | OUT | IN | OUT |
| Electricity | MWh | 0.169 | 10% | ||
| Hydrogen | Tons | 0.192 | 11% | ||
| CO2 | Tons | 1.37 | 79% | ||
| Methanol | Tons | 1 | 64% | ||
| Water | Tons | 0.569 | 36% | ||
| 100% | 100% | ||||
| Production | Flow balance | ||||
| Carrier | Units | IN | OUT | IN | OUT |
| Electricity | MWh | 0.34 | 25% | ||
| Hydrogen | Tons | 0.18 | 13% | ||
| Nitrogen | Tons | 0.84 | 62% | ||
| Ammonia | Tons | 1 | 52% | ||
| Steam | MWh | 0.69 | 36% | ||
| Heat | MWh | 0.24 | 12% | ||
| 100% | 100% | ||||
| Parameter | Units | WindTurbine | SolarPV | Electrolysis | MethanolSynthesis | AmmoniaSynthesis | AirSeparationUnit | HydrogenStorage | ElectricStorage |
|---|---|---|---|---|---|---|---|---|---|
| Capacity | MW or tons/h | 54.60 | 27.00 | 0.24 | 1.98 | 0.83 | 1.00 | 7.00 | 1.60 |
| Minimum Operation | %load/h | - | - | 20.00 | - | 25.00 | - | - | - |
| RampRate | %load/h | - | - | 95.00 | - | 20.00 | - | - | - |
| CapacityUP | %load/h | - | - | 20.00 | 20.00 | 20.00 | - | 20.00 | - |
| CapacityDown | %load/h | - | - | 20.00 | 20.00 | 20.00 | - | 20.00 | - |
| StorageCap | MWh or tons | - | - | - | - | - | - | 7.00 | 1.60 |