Rotational spectroscopy of mono-deuterated oxirane (-C2H3DO) and its detection towards IRAS 162932422 B
Abstract
We prepared a sample of mono-deuterated oxirane and studied its rotational spectrum in the laboratory between 490 GHz and 1060 GHz in order to improve its spectroscopic parameters and consequently the calculated rest frequencies of its rotational transitions. The updated rest frequencies were employed to detect -C2H3DO for the first time in the interstellar medium in the Atacama Large Millimetre/submillimetre Array (ALMA) Protostellar Interferometric Line Survey (PILS) of the Class 0 protostellar system IRAS 16293242. Fits of the detected lines using the rotation diagrams yield a temperature of K, which in turn agrees well with 125 K derived for the -C2H4O main isotopologue previously. The -C2H3DO to -C2H4O ratio is found to be 0.15 corresponding to a D-to-H ratio of 0.036 per H atom which is slightly higher than the D-to-H ratio of species such as methanol, formaldehyde, ketene and but lower than those of the larger complex organic species such as ethanol, methylformate and glycolaldehyde. This may reflect that oxirane is formed fairly early in the evolution of the prestellar cores. The identification of doubly deuterated oxirane isotopomers in the PILS data may be possible judged by the amount of mono-deuterated oxirane and the observed trend that multiply deuterated isotopologues have higher deuteration rates than their mono-deuterated variants.
keywords:
astrochemistry – ISM: molecules – line: identification – methods: laboratory: molecular – ISM: abundances – ISM: individual objects: IRAS 162932422.1 Introduction
The cyclic molecule oxirane, -C2H4O, has been detected in several places in warm regions associated with low- and high-mass star formation. It was detected first towards the molecule-rich Galactic centre source Sagittarius B2(N) (Dickens et al., 1997). It was observed subsequently in the warm gas associated with several high-mass star-forming regions (Nummelin et al., 1998; Ikeda et al., 2001). Requena-Torres et al. (2008) reported its identification in three rotationally cold, but kinetically warm Galactic centre sources. Lykke et al. (2017) found the molecule towards the low-mass protostellar source IRAS 162932422 more recently and Bacmann et al. (2019) reported its detection in a prestellar core.
The report by Lykke et al. (2017) was one of the early results of the Protostellar Interferometric Line Survey (PILS): PILS is an unbiased molecular line survey around 345 GHz carried out with the Atacama Large Millimetre/submillimetre Array (ALMA) to study the physical conditions and the molecular complexity of the Class 0 solar-type protostellar system and astrochemical template source IRAS 162932422 (Jørgensen et al., 2016). Through the high sensitivity of PILS and narrow lines towards one component of IRAS 16293-2422 (limiting line confusion) a number of species have been detected for the first time, including the organohalogen compound methyl chloride (CH3Cl) (Fayolle et al., 2017), nitrous acid (HONO) (Coutens et al., 2019) and, tentatively, 3-hydroxypropenal (Coutens et al., 2022).
An important contribution of PILS has also been the numerous isotopologues of organic molecules, in particular deuterated variants, that were detcted for the first time in the interstellar medium (ISM). Deuterated molecules are particularly noteworthy among the isotopic species because the enrichment of deuterium in dense molecular clouds has attracted considerable interest for many years as the degree of deuteration has been viewed as an evolutionary tracer in low-mass star-forming regions and/or a means to trace the formation histories of complex organic molecules (e.g., Millar et al., 1989; Crapsi et al., 2005; Ceccarelli et al., 2007; Taquet et al., 2014; Chantzos et al., 2018).
Deuterated isotopologues are particularly prominent towards low-mass star forming regions due to the low temperatures promoting deuterium fractionation. With its rich spectrum IRAS 162932422 is therefore one of the prime targets to search for deuterated molecules: and already through single-dish observations dedicated studies led to the first detections of methanol species such as CHD2OH (Parise et al., 2002), CD3OH (Parise et al., 2004), mono-deutered dimethyl ether, CH2DOCH3, (Richard et al., 2013), the ground state terahertz transitions of H2D+ (Brünken et al., 2014) and HD (Harju et al., 2017) and NHD and ND2 (Melosso et al., 2020).
The deuterated species detected in the PILS data are the mono-deuterated isotopomers of the oxygen-bearing organics glycolaldehyde (Jørgensen et al., 2016), ethanol, ketene, formic acid and of mono-deuterated acetaldehyde species CH3CDO (Jørgensen et al., 2018) and CH2DCHO (Coudert et al., 2019; Manigand et al., 2020), of the nitrogen-bearing organics isocyanic acid DNCO and the mono-deuterated isotopomers of formamide (Coutens et al., 2016) and the cyanamide isotopologue HDNCN (Coutens et al., 2018) and sulfur-containing species such as the hydrogen sulfide isotopologue HD34S (Drozdovskaya et al., 2018). Also, the PILS data reveal the presence of doubly-deuterated organics including the methyl cyanide species CHD2CN (Calcutt et al., 2018), the methyl formate species CHD2OCHO (Manigand et al., 2019) and the dimethyl ether species CHD2OCH3 (Richard et al., 2021) and enable new and more accurate constraints on the doubly- and triply-deuterated variants of methanol in the warm gas close to the protostars (Drozdovskaya et al., 2022; Ilyushin et al., 2022). These systematic studies also enabled a more detailed comparison across the different species. It was seen for example that the degree of deuteration in a given molecule (referenced to one H atom) does not change for structurally different H atoms within uncertainties for several organics (e.g., Jørgensen et al., 2016, 2018). It also appears that different types of organics can be categorised in groups according to their D/H ratios, which in turn may reflect their underlying formation mechanisms (Jørgensen et al., 2018).
It appeared plausible to identify mono-deuterated oxirane (-C2H3DO) in the PILS data judged by the strength of the -C2H4O lines (Lykke et al., 2017). Very limited transition frequencies, however, were available only until fairly recently (Hirose, 1974a); only 20 transitions were published up to 60 GHz with and of these were only three strong -branch transitions with . Albert et al. (2019) reported on a laboratory spectroscopic investigation of -C2H3DO which provided us with the means to search for this isotopic species. While the data were extensive and accurate enough to identify -C2H3DO with certainty in the PILS data we were faced with a small, but non-negligible deviation of the velocity offset in comparison to those of -C2H4O and other molecules. We decided to synthesize a sample of -C2H3DO to investigate its rotational spectrum further in order to improve the spectroscopic parameters and hoping to be able to resolve the deviation.
The remainder of the article is laid out as follows. Section 2 deals with our laboratory spectroscopic investigations, Section 3 describes the astronomical search for -C2H4O and Section 4 summarises the main findings of the paper.
2 Laboratory investigations
2.1 Spectroscopy of oxirane
Oxirane (-C2H4O) is also known as epoxyethane, ethylene oxide, dimethylene oxide and oxacyclopropane. Its rotational spectrum was studied quite extensively (Hirose, 1974b; Creswell & Schwendeman, 1974; Pan et al., 1998; Medcraft et al., 2012; Müller et al., 2022). The molecule has symmetry with its dipole moment of 1.90 D along the -axis (Cunningham et al., 1951). This value includes a small upward correction of 0.02 D (Müller et al., 2022) caused by the difference of the OCS reference value used in Cunningham et al. (1951) compared to more modern values (Tanaka et al., 1985; Lahaye et al., 1986). The main isotopologue is an asymmetric top rotor of the oblate type with which is quite far from the oblate symmetric limit of +1. The four equivalent H nuclei lead to ortho and para spin-statistics with intensity weight ratios of . The ortho and para levels are described by being even and odd, respectively.
Substitution of one of the four H atoms by D lowers the symmetry to and leads to a chiral species, similar to the related molecule methyl oxirane, also known as propylene oxide etc., recently detected as the first chiral molecule in space (McGuire et al., 2016). We derived from the structural parameters of the molecule that the rotation of the principal inertial axis system of -C2H3DO with respect to that of -C2H4O leads to a small dipole moment component of 0.36 D, a very small D and an almost unchanged D. Mono-deuterated oxirane is also an asymmetric top rotor of the oblate type with even more distant from the oblate symmetric limit of +1. No non-trivial spin-statistics occur in the rotational spectrum of -C2H3DO because of the low symmetry of the isotopologue.
2.2 Synthesis of mono-deuterated oxirane
Oxirane-1- was synthesized in a two-step reaction: the synthesis of 2-chloroethanol-1- and the dehydrochlorination of the latter to oxirane-1-. We imagined an original approach for the second step in order to be able to synthesize small quantities of the desired product.
2-Chloroethanol-1-. The chloroacetaldehyde in water (50%) (10 g, 64 mmol) was extracted with diethyl ether (50 mL) and the organic phase was dried over MgSO4. Sodium borodeuteride (1.0 g, 24 mmol) and dry diethyl ether (10 mL) were introduced under nitrogen into a three-necked flask and the chloroacetaldehyde in diethyl ether was added dropwise (bubbling was observed). The reaction mixture was refluxed for 3 h, then hydrolysed with 3 N-H2SO4, made alkaline with aqueous sodium carbonate, extracted with diethyl ether and dried over MgSO4. The solvent was carefully removed under vacuum and the purification was carried out on a vacuum line (0.1 mbar) with a trap cooled to 60oC to selectively trap the 2-chloroethanol-1-. Two distillations gave 1.8 g pure product with an isotopic purity higher than 98%. The yield is 90% based on sodium borodeuteride.
1H NMR (CDCl3, 400 MHz) 3.09 (s, brd, 1H, OH), 3.66 (d, 2H, 3J Hz, CH2Cl), 3.85 (dt, 1H, 3J Hz, 2J Hz, CHD). 13C NMR (CDCl3, 100 MHz) 46.6 (1J Hz (t), CH2Cl), 62.6 (1J Hz (t), 1J Hz (d), CHD).
Oxirane-1-. 2-Chloroethanol-1- (1.63 g, 20 mmol) was then vaporised in a vacuum line (0.1 mbar) onto t-BuOK in powder heated to 90oC (for similar experiments see Guillemin et al., 2019). A trap cooled to 100oC removed selectively the impurities (mainly t-butanol) and oxirane-1- was selectively condensed in a trap cooled at 77 K at a yield of 0.60 g or 67%.
1H NMR (CDCl3, 400 MHz) 2.54 (m, 3H, CH2O and CHD). 13C NMR (CDCl3, 100 MHz) 40.2 (1J Hz (t), 1J Hz (d), CHD), 40.4 (1J Hz (t), CH2).
2.3 Rotational spectroscopy
The measurements were carried out at room temperature in a 5 m long single path Pyrex glass cell equipped with high-density polyethylene windows. Two frequency multipliers (VDI Inc.) driven by a Rhode & Schwarz SMF 100A microwave synthesizer were used as sources in the region 4901060 GHz. A closed cycle liquid He-cooled InSb bolometer (QMC Instruments Ltd) was employed as a detector. Additional information on this spectrometer system is available in Xu et al. (2012).
The entire region from 490 GHz to 750 GHz was covered at a total pressure of 1 Pa and with low bolometer sensitivity to record mainly medium strong lines of -C2H3DO. Strong lines that displayed (potentially) weak indications of saturation in these spectral recordings were rerecorded individually at a pressure of 0.2 Pa. Very strong lines with clear signs of saturation were remeasured at a pressure of 0.05 Pa. The same region was covered again at a high bolometer sensitivity and a pressure of 4 Pa for an improved signal-to-noise ratios (S/N) of weak lines.
Very weak lines in this region with relatively large uncertainties after inclusion of the stronger lines were recorded individually at a pressure of 4 Pa and with longer integration times. Similar measurements were finally carried out between 810 GHz and 1060 GHz.
The S/N of our spectral recordings is very high such that the uncertainties assigned to the transition frequencies are mostly dominated by the line shape. Very symmetric and isolated lines have uncertainties of 5 kHz, a value that appeared even conservative for several of the strong and very strong lines. We have shown in studies of H2CO (Müller & Lewen, 2017) and H2CS (Müller et al., 2019) that uncertainties of 10 kHz can be achieved quite regularly at higher frequencies of 1.31.5 THz. Baseline effects or other lines in the vicinity affect the line shape. The assigned uncertainties of slightly less symmetric lines were 1020 kHz while 30 kHz or 50 kHz were employed for some lines with more pronounced asymmetries.
2.4 Treatment of previous data
Fitting and calculation of -C2H3DO transition frequencies was performed with Pickett’s SPFIT and SPCAT programmes (Pickett, 1991). We refitted the previous -C2H3DO data (Hirose, 1974a; Albert et al., 2019) in order to derive transition frequencies, their uncertainties and intensities for our present laboratory studies. We assumed 50 kHz for the data from Hirose (1974a) in analogy to the experimental lines of the main isotopic species (Hirose, 1974b) from the same author and based on our judgement (Müller et al., 2022) of the -C13CH4O and -C2H418O data from Hirose (1974a). Two transition frequencies from that work with large residuals of 0.20 MHz and 0.72 MHz were omitted. We employed the millimetre wave data from Albert et al. (2019) as provided by one of the authors of that study because the data published as supplementary data to Albert et al. (2019) were in units of wavenumbers and truncated at the cm-1 or 300 kHz level. These data were estimated to have uncertainties of about 200 kHz in the original work. A fit of these data alone, however, had an rms of 30 kHz (Albert et al., 2019). We carried out several trial fits with different uncertainties assigned to these data and different sets of spectroscopic parameters which suggested that the uncertainties of these millimetre wave data are more like 10 kHz possibly even better. We used 10 kHz as uncertainties initially and 5 kHz later.
The majority of the lines from Albert et al. (2019) were obtained in the far-infrared (FIR) region by Fourier transform spectroscopy (FTS). The authors estimated these data to be accurate to 0.00010 cm-1 or about 3 MHz. Their fit as well as our trial fits yielded rms values of slightly better than 0.00008 cm-1 ( MHz); we employed therefore 0.00008 cm-1 as uncertainties of the FIR data. All but two of the FIR transition frequencies refer to unresolved asymmetry doublets, but only one of the two transitions was given in the line list. This is fine for asymmetry splittings well within the frequency uncertainties but introduces an error otherwise. We assigned two transitions to all unresolved asymmetry doublets which essentially doubled the FIR line list. There is essentially no effect on the parameter uncertainties because if two or more lines are blended to one they are treated as one piece of information in SPFIT. The effect on the rms of the FIR data turned out to be modest because the frequencies of most unresolved asymmetry doublets were identical within the quoted digits.
We need to point out that FTS requires calibration of the spectra in order to achieve reliable transition frequencies. The FIR data in Albert et al. (2019) were calibrated with lines of residual water in the optical path, a common procedure if enough suitable water lines are present. These are usually compared to reference data to determine a calibration factor. The rms of the FIR transitions deteriorated in the early stages of adding lines from our measurements to the fit until a value of 0.00016 cm-1 was reached and an average shift of the FIR data of 0.00015 cm-1 or 4.5 MHz lower than the calculated frequencies was obtained which is indicative of a small but non-negligible calibration error. Trial fits with the aim to minimize the average shift yielded a recalibration factor of 1.0000037. The inverse of this value can be entered as infrared calibration factor in the parameter files of SPFIT. The rms of the FIR lines returned to the initial value of slightly better than 0.00008 cm-1 after this correction.
We employed the scaled spectroscopic parameters up to sixth order from a quantum-chemical calculation (Puzzarini et al., 2014) as starting values as was done by Albert et al. (2019). It turned out that rotational and quartic centrifugal distortion parameters plus the sextic parameter were needed to minimize the rms error as measure for the quality of the fit. Some other sextic distortion parameters appeared to be determined, meaning their uncertainties were a sufficiently small fraction of their values but had only a small impact on the rms error. Releasing different sets of sextic distortion parameters resulted in transition frequencies that differed by around 0.2 MHz for the lines we had identified in our astronomical data, significant at line widths of about 1 MHz. We decided to revisit the rotational spectrum of -C2H3DO exactly because of these deviations.
2.5 Observed spectrum and determination of spectroscopic parameters
The rotational spectrum of -C2H3DO is sparse on the level of the strong and very strong lines. These are all -type -branch () transitions in the 490750 GHz region. The -type transitions have , etc. and , etc. More specifically, these transitions are mostly prolate paired (unresolved asymmetry doublets both having the same upper and lower and values) with about 10 to 15 and low values of or oblate paired transitions (unresolved asymmetry doublets both having the same upper and lower and values) with about 16 to 27 and low values of . These transitions were found close to their calculated positions even if they were shifted from their calculated positions by a few megahertz. The spectroscopic parameters were improved after each round of assignments leading to improved calculations of the rotational spectrum.
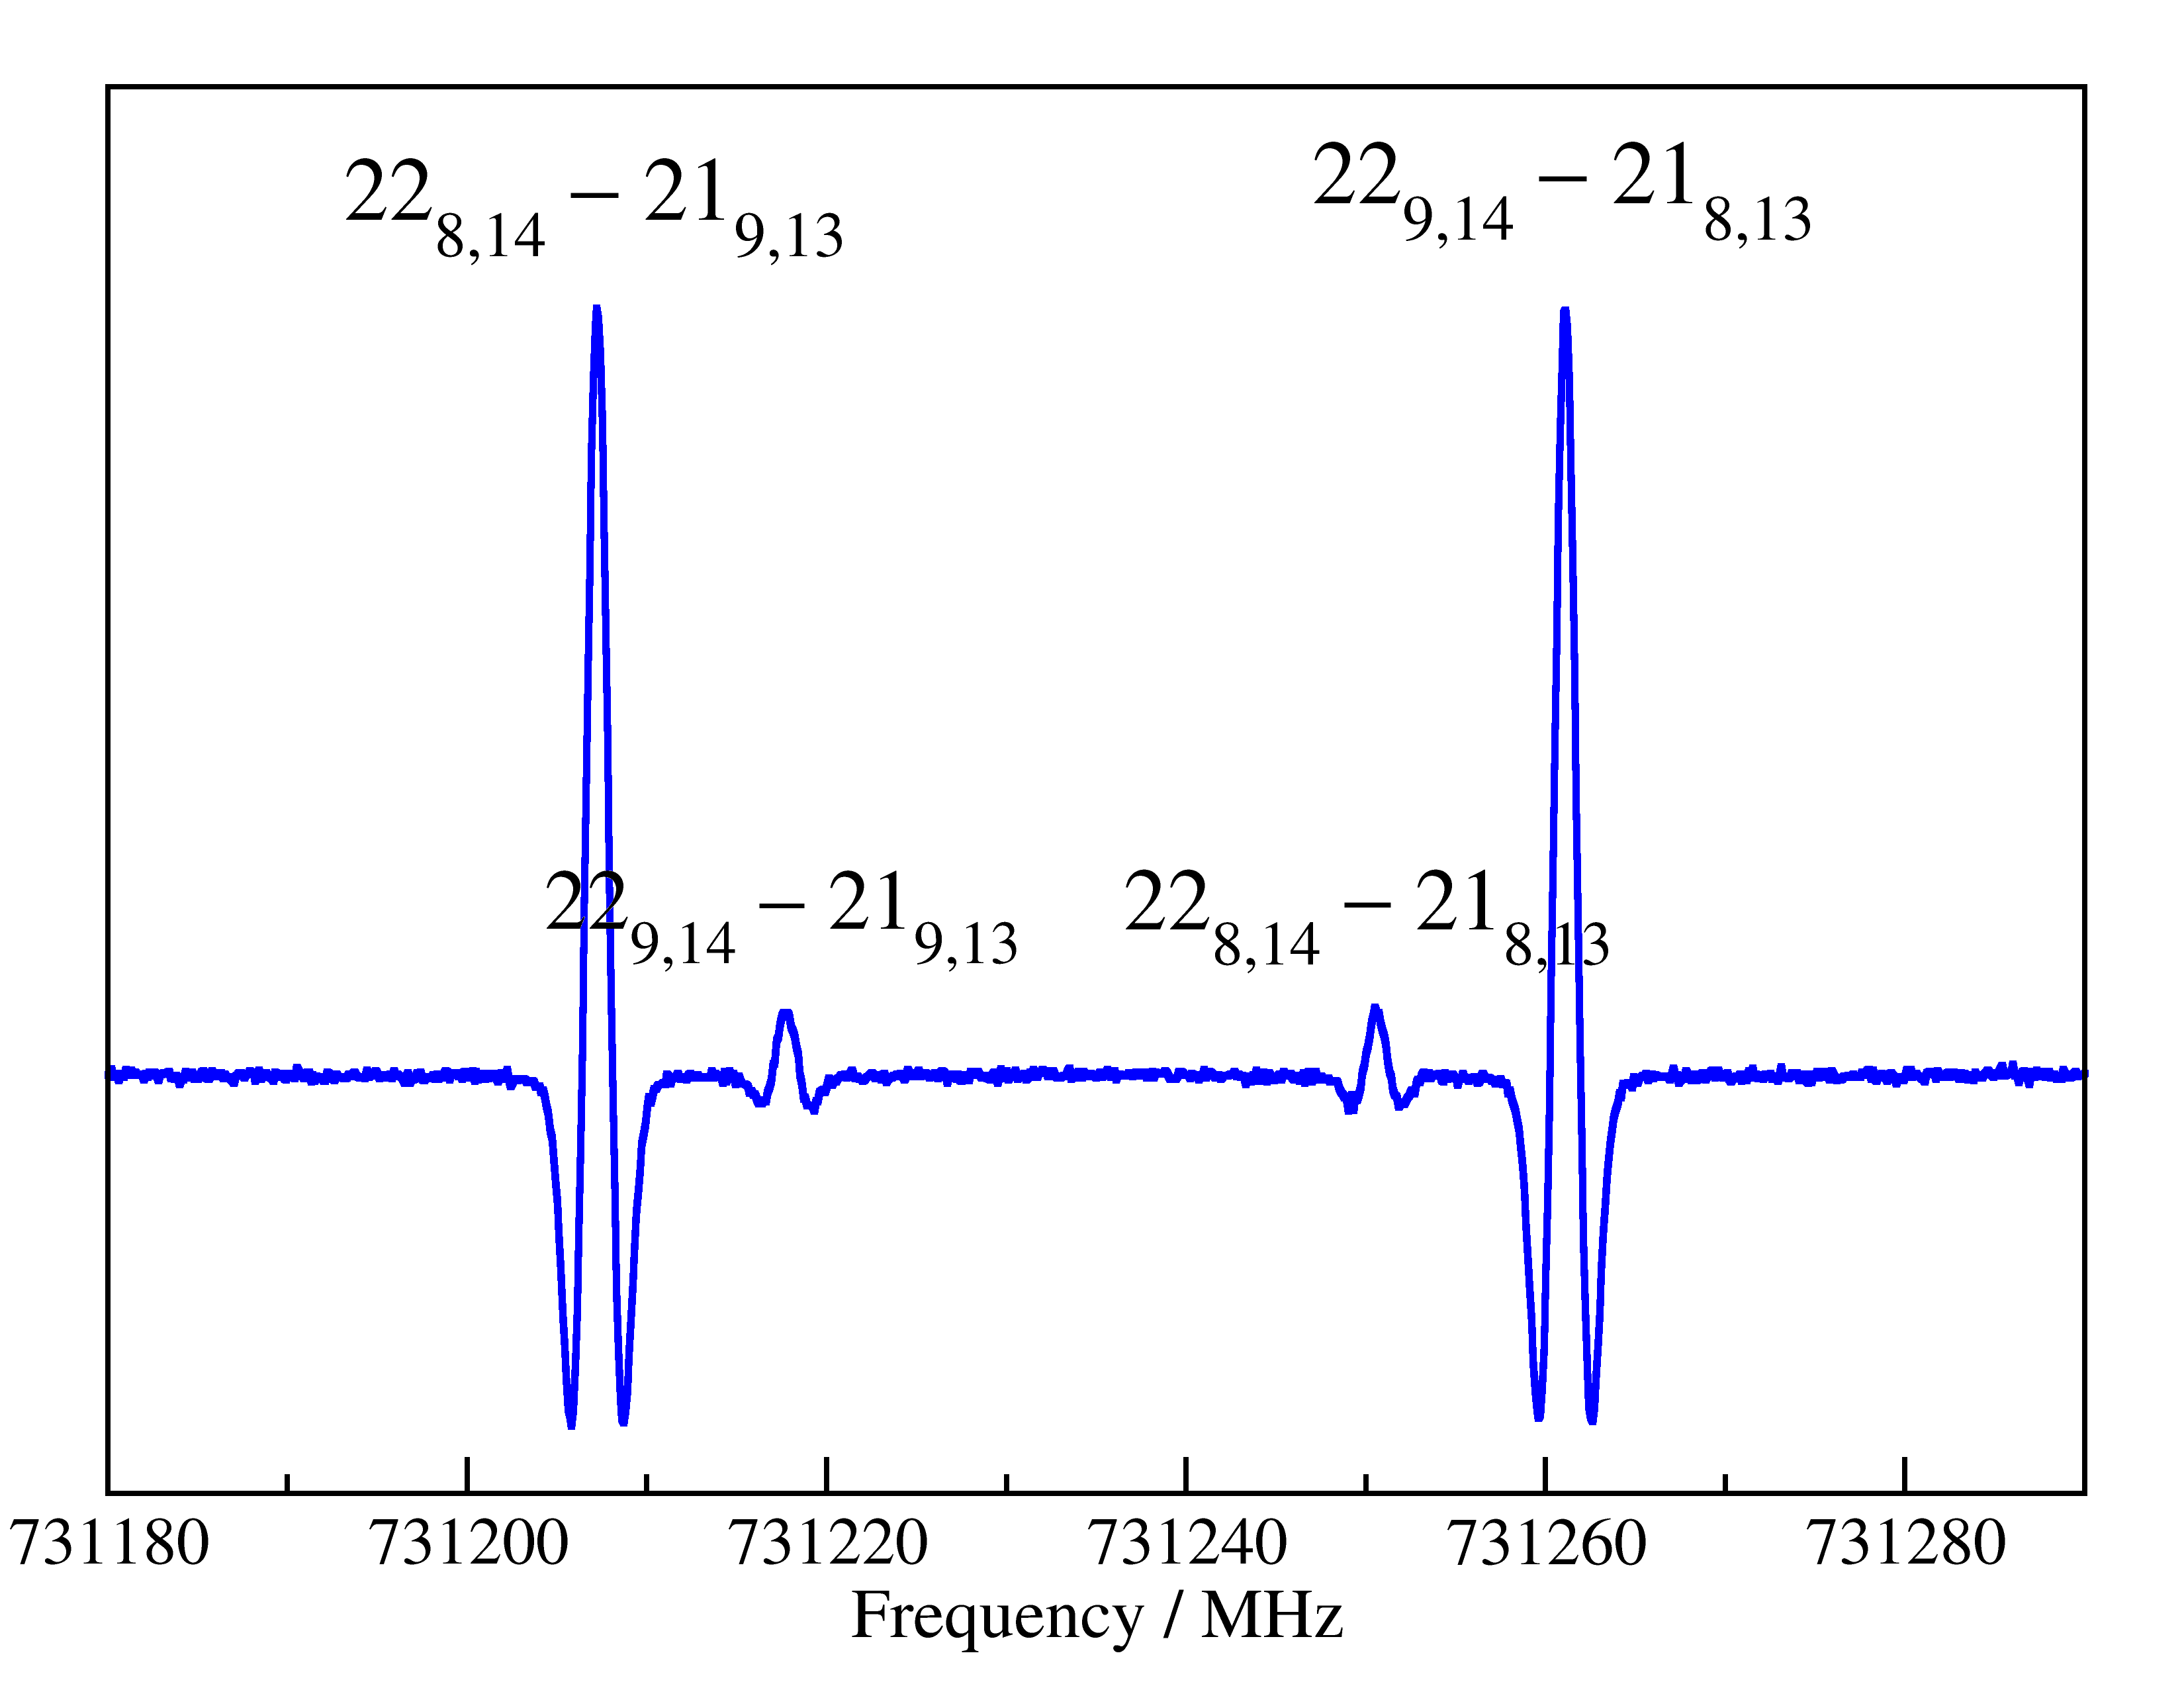
The -type transitions approaching oblate pairing, these are transitions close but distinct in frequency having the same and values, are accompanied by much weaker -type transitions between them, as is shown in Fig. 2. These patterns are easy to recognize and may be used for assignment purposes if the calculated spectrum is uncertain. The relatively strong -type transitions have and . We also assigned several much weaker -type transitions with and . Among the weaker -type transitions were -branch transitions (), - and -branch transitions with , high- transitions with and with other selection rules.
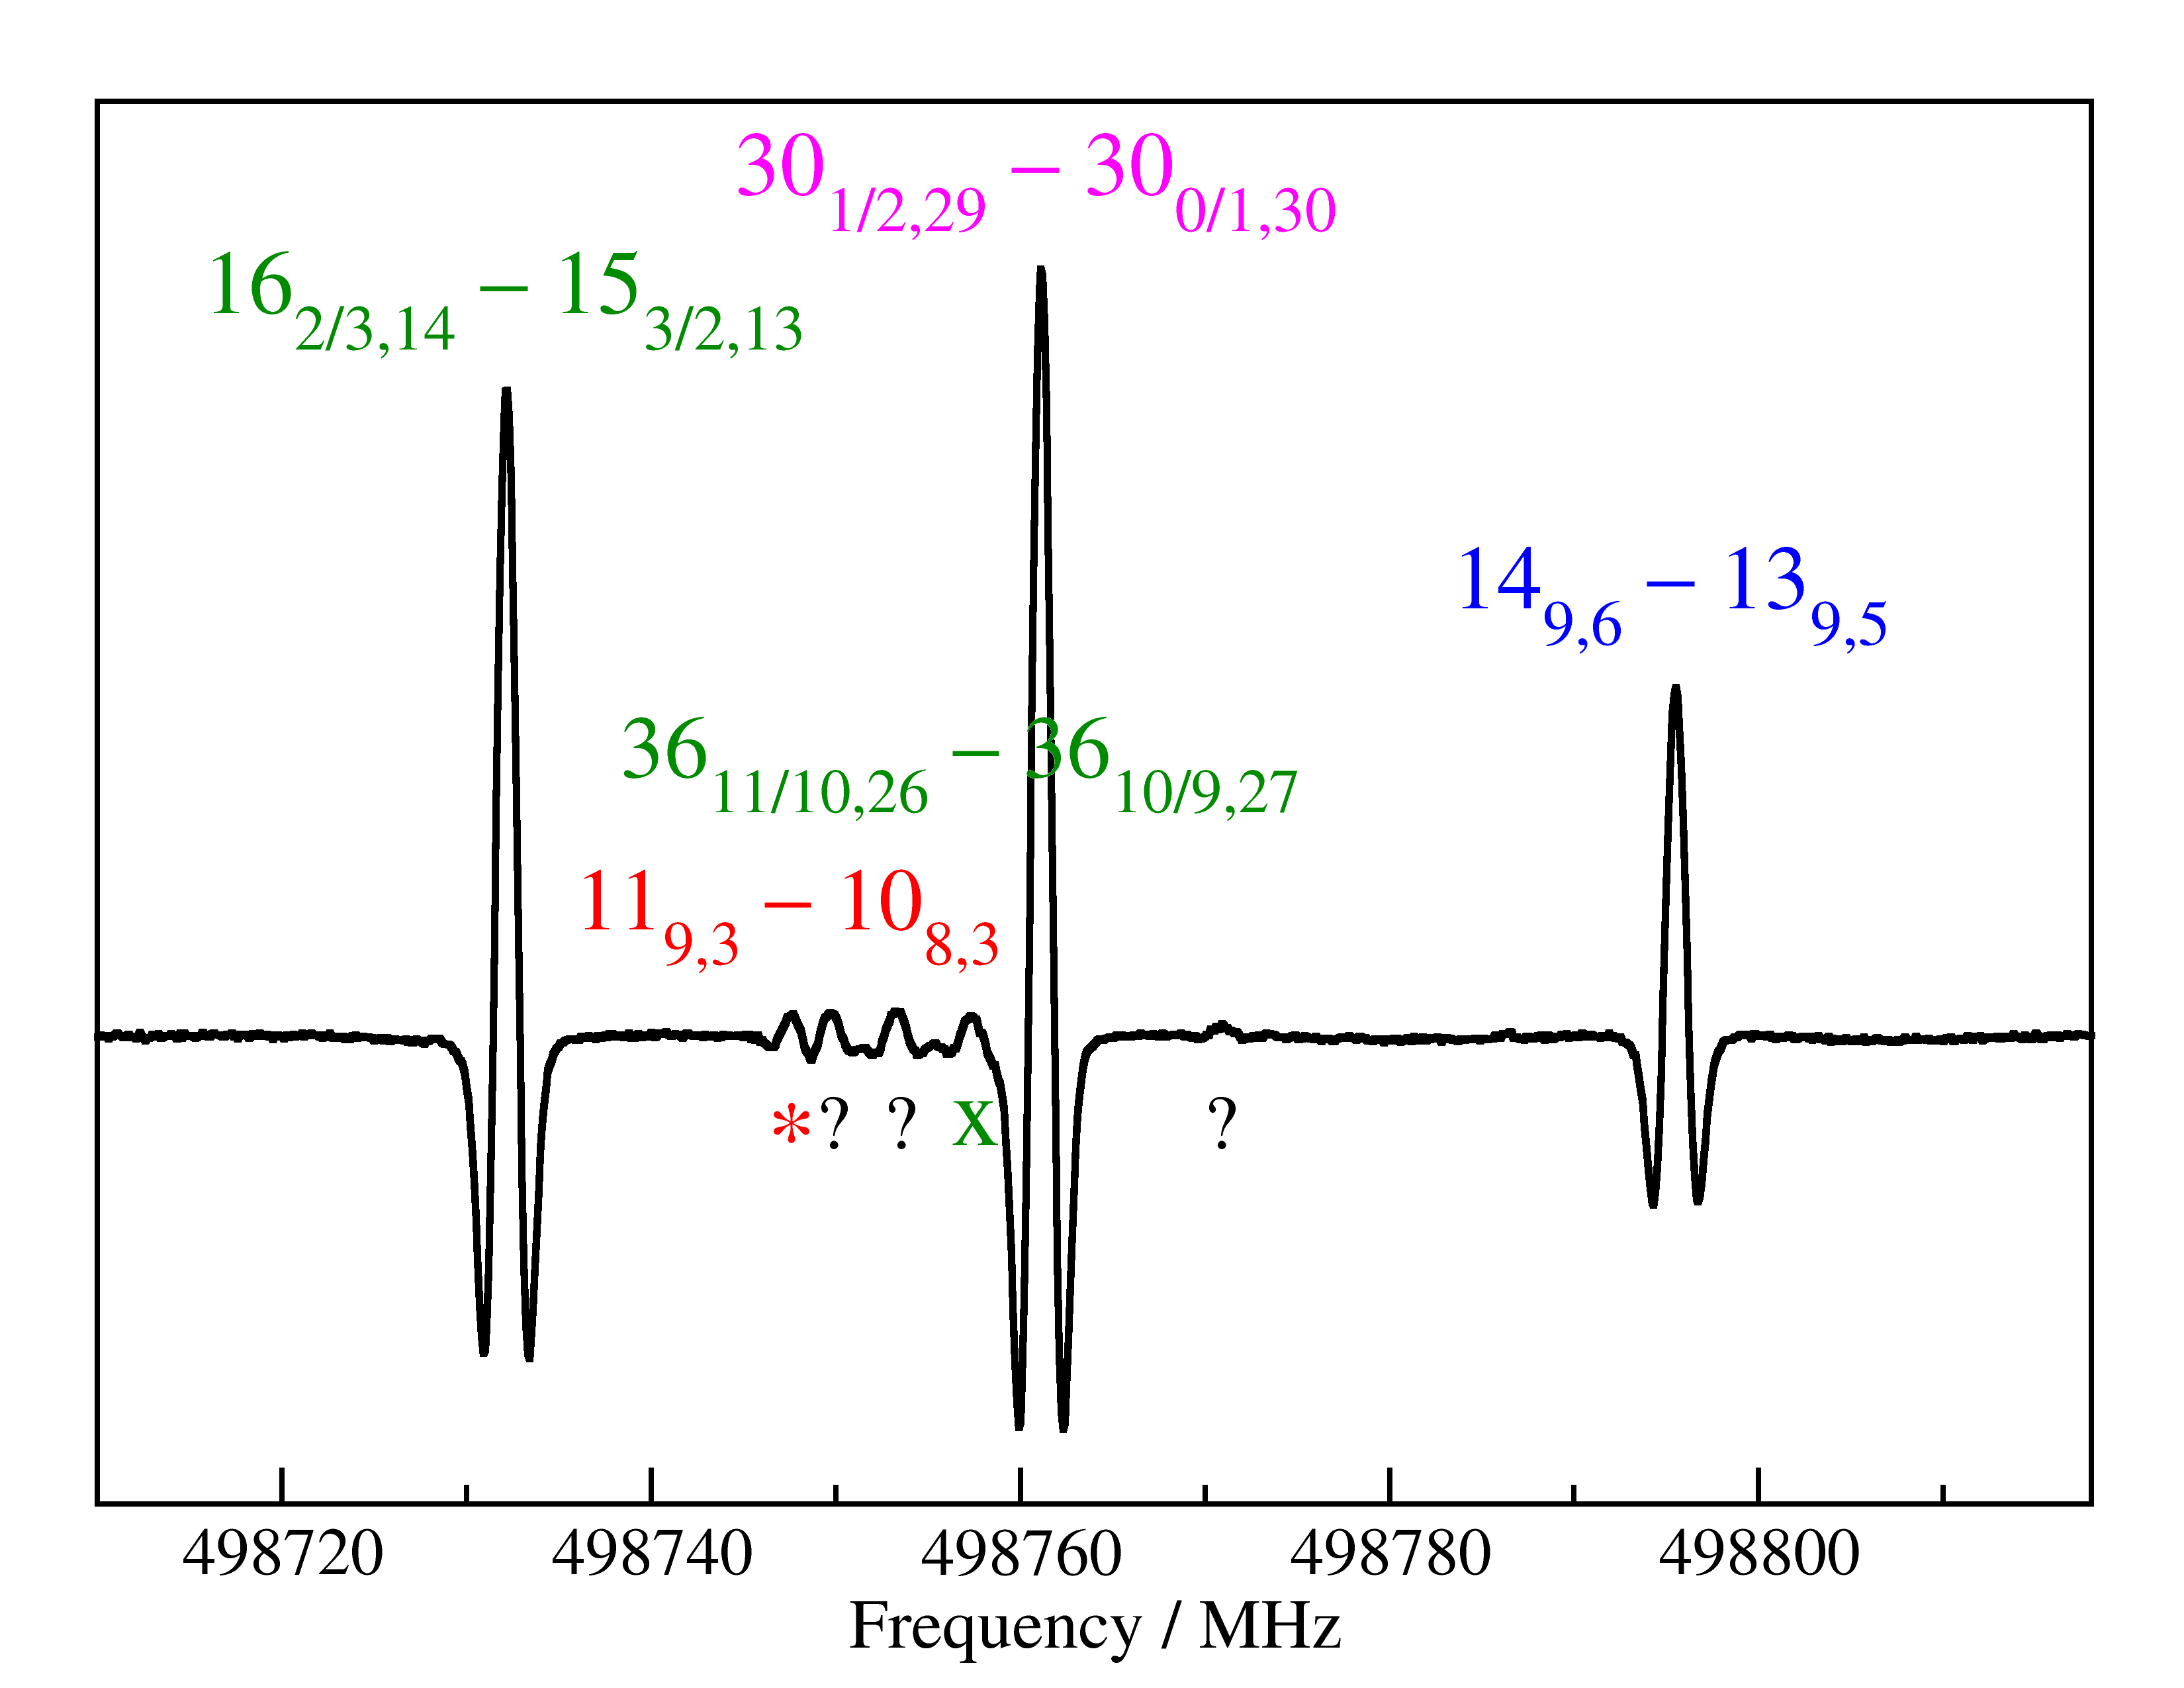
Eventually we assigned a fair fraction of the strongest though still weak or very weak -type transitions with and . In the case of transitions approaching prolate pairing, the -type transitions are between the close-lying much stronger -type transitions. Fig. 3 displays a -type transition of -C2H3DO accompanied by an -type transition and two oblate paired -type transitions supporting the magnitudes of the dipole moment components calculated from the structure. Also shown are two lines of -C2H4O; we conclude from their intensities that about 1.5% of the sample pressure is caused by the fully hydrogenated isotopologue. We included afterwards the very weak transitions recorded in the 490750 GHz region and subsequently those from the 8101060 GHz region into the fit.
| sourceb | No. T | No. F | rms | rms error | ||||
|---|---|---|---|---|---|---|---|---|
| MW (Hirose, 1974a) | 18 | 18 | 8 | 5 | 4 | 46 | .2 | 0.924 |
| mmW (Albert et al., 2019) | 112 | 112 | 23 | 14 | 10 | 5 | .02 | 1.004 |
| FIR (Albert et al., 2019) | 782 | 392 | 57 | 40 | 56 | 0 | .070 | 0.879 |
| sub-mmW, present | 1504 | 1091 | 58 | 43 | 55 | 9 | .13 | 0.884 |
| global | 2416 | 1613 | 58 | 43 | 56 | 0.892 | ||
a Units of kHz for all but the FIR data.
b The abbreviations stand for microwave, millimetre wave, far-infrared and submillimetre wave respectively.
c The rms values are 10.40 kHz and 0.00007 cm-1 ( 2.1 MHz) for MW to sub-mmW data and FIR data respectively.
| S reduction, IIIl | A reduction, Ir | |||||||||
|---|---|---|---|---|---|---|---|---|---|---|
| Parameter | present | present | prev. exptl. | scaled ai | Parameter | |||||
| 24252 | .670221 (39) | 24252 | .647815 (44) | 24252 | .64765c | 24250 | .3320 | |||
| 19905 | .493836 (40) | 19905 | .523291 (40) | 19905 | .52126c | 19906 | .4347 | |||
| 13327 | .592078 (53) | 13327 | .583649 (53) | 13327 | .58134c | 13327 | .2181 | |||
| 18 | .028074 (55) | 25 | .46266 (19) | 25 | .478 (21) | 17 | .458 | |||
| 52 | .12685 (11) | 17 | .25673 (12) | 17 | .252 (22) | 22 | .401 | |||
| 41 | .656664 (99) | 17 | .04199 (11) | 17 | .0744 (69) | 15 | .689 | |||
| 8 | .308953 (27) | 13 | .231691 (56) | 13 | .250 (10) | 16 | .214 | |||
| 0 | .743758 (8) | 4 | .742162 (17) | 4 | .7399 (21) | 4 | .124 | |||
| 114 | .912 (41) | 808 | .09 (31) | 870 | . (60) | 757 | .5 | |||
| 220 | .075 (113) | 835 | .25 (36) | 960 | . (60) | 868 | .8 | |||
| 123 | .995 (124) | 141 | .97 (16) | 186 | . (21) | 170 | .3 | |||
| 21 | .586 (95) | 12 | .364 (105) | 14 | .1 (21) | 6 | .0 | |||
| 10 | .980 (26) | 30 | .210 (103) | 61 | .7d | 61 | .7 | |||
| 26 | .227 (13) | 62 | .667 (69) | 81 | .1d | 81 | .1 | |||
| 15 | .071 (3) | 4 | .797 (14) | 2 | .2d | 2 | .2 | |||
| 1 | .578 (11) | 9 | .13 (25) | |||||||
| 4 | .280 (37) | 6 | .51 (27) | |||||||
| 4 | .424 (53) | 1 | .55 (20) | |||||||
| 2 | .546 (39) | 2 | .10 (6) | |||||||
| 0 | .922 (27) | 0 | .170 (30) | |||||||
| 399 | .2 (74) | 4 | .571 (60) | |||||||
| 209 | .4 (47) | 2 | .243 (41) | |||||||
| 177 | .6 (18) | 1 | .191 (25) | |||||||
| 26 | .7 (3) | 34 | .7 (36) | |||||||
| 1 | .305 (103) | |||||||||
| 1 | .949 (171) | |||||||||
| 0 | .851 (99) | |||||||||
| 1 | .95 (13) | |||||||||
Numbers in parentheses are one standard deviation in units of the least significant figure.
a Albert et al. (2019); fit of all data.
b Puzzarini et al. (2014).
c Rotational parameters kept fixed to values from a fit to microwave and millimetre wave data.
d Off-diagonal sextic distortion parameters kept fixed to scaled values from Puzzarini et al. (2014).
The strategy to determine spectroscopic parameters has been the usual for the most part. We search for the spectroscopic parameter whose release, if the value was kept fixed to an estimated value, or whose inclusion reduces the rms error of the fit the most in order to keep the set of parameters as small and as unique as possible. This strategy works mostly very well in cases of asymmetric rotors close to the prolate limit of 1. It works sometimes less well for asymmetric rotors of the oblate type presumably because spectroscopic parameters of a given order are similar in magnitude and correlated. The extreme of an alternative approach is to include all reasonable spectroscopic parameters or the remaining part thereof into the fit and omit subsequently those parameters which display large uncertainties or whose omission from the parameter set increases the rms error only by small amounts. This latter approach was employed at least at one stage of the fittings.
Several spectroscopists view Watson’s A reduction in an oblate representation as the natural choice to fit an asymmetric rotor of the oblate type. Several studies on molecules such as H2S (Yamada & Klee, 1994), dimethylsulfoxide (Margulès et al., 2010), the lowest energy conformer of 2-cyanobutane (Müller et al., 2017) or the main isotopologue of oxirane (Müller et al., 2022) revealed that this choice of reduction and representation is frequently a rather poor one. All other choices yielded better fits or required fewer parameters. In the case of oxirane all other common combinations of reduction and representation, the S reduction in the oblate IIIl representation and the A and S reductions in the prolate Ir representation yielded satisfactory fits albeit the A reduction in Ir required two parameters less than the two combinations involving S reductions. The A reduction in Ir was in fact the preferred choice in several studies on -C2H4O (Medcraft et al., 2012; Müller et al., 2022) and -C2H3DO (Puzzarini et al., 2014; Albert et al., 2019). We used the scaled parameters from a quantum-chemical calculation (Puzzarini et al., 2014) as starting values in our present study on -C2H3DO exactly for this reason. We also tried out the S reduction in the oblate IIIl representation to test a more natural choice of representations. Both choices resulted for a long time in fits of similar quality employing the same number of spectroscopic parameters. Later fits in Ir and the A reduction required one and even two parameters less than fits of the same line lists in IIIl and the S reduction. The inclusion of our transition frequencies in the 8101060 GHz altered the situation; now the IIIl fit in the S reduction required two parameters less than the Ir fit in the A reduction.
We evaluated as final steps the impact of the previous data on the fit and the appropriateness of the assigned uncertainties. Omission of all previously reported transition frequencies changed the parameter values within the uncertainties and increased the parameter uncertainies only slightly; the largest increase occurred for the rotational parameter with slightly more than 10%. The previous transition frequencies were retained in the final fit nevertheless because their impact was not negligible. Table 1 displays the extent and the upper quantum numbers of the individual data sets and of the fit as a whole. It also demonstrates that the data were fitted within the assigned uncertainties on average with a marginal exception for the millimetre wave data from Albert et al. (2019). However, the rms error of this data set exceeds 1.0 by such a small amount that an alteration of the uncertainties is not warranted. The quality of the A reduction fit in the Ir representation is very similar; the rms error of the overall fit is 0.901.
The resulting spectroscopic parameters are gathered in Table 2 together with the previous experimental values from Albert et al. (2019) and the scaled values from a quantum-chemical study (Puzzarini et al., 2014).
The fit files and a calculation of the rotational spectrum of -C2H3DO have been deposited as supplementary material to this article together with an explanatory file. These files as well as additional files are also available in the Cologne Database for Molecular Spectroscopy (CDMS)111https://cdms.astro.uni-koeln.de/ (Müller et al., 2005; Endres et al., 2016).
2.6 Discussion of the laboratory spectroscopic results
Our submillimetre spectroscopic data enabled us to determine full sets of very accurate spectroscopic parameters up to eighth order supplemented by one or three decic parameters respectively. The parameter set in the IIIl representation employing Watson’s S reduction should be favoured over the set in the Ir representation employing the A reduction because two fewer parameters are needed for a satisfactory fit. We point out that our experience in the course of the present study indicated that this choice may depend on details of the line list. The Ir A reduction combination was the favoured one in fits of the main isotopologue (Müller et al., 2022). It is interesting to note that fits of the rotational spectrum of -C2H4O required at most a full set of parameters up to eighth order (the disfavoured A reduction in the IIIl representation is an exception) whereas the present fits of -C2H3DO required decic distortion parameters.
The present laboratory spectroscopic investigation improves the calculation of the rotational spectrum of -C2H3DO considerably. The stronger transition frequencies are sufficiently accurate up to at least 1.5 THz which is sufficient for all astronomical observations dedicated to this isotopologue. The Boltzmann peak at 125 K is at 460 GHz and the strongest transitions are oblate paired transitions with . The peak shifts to 960 GHz at room temperature and the strongest transitions are now prolate paired transitions with .
The spectroscopic parameters in the Ir representation employing Watson’s A reduction can be compared with results from the recent experimental study on -C2H3DO (Albert et al., 2019) and with results from a quantum-chemical calculation (Puzzarini et al., 2014). The comparison is favourable for the rotational and quartic centrifugal distortion parameters from the previous experimental study and reasonable for the sextic centrifugal distortion parameters both for the values kept fixed to scaled values from a quantum-chemical calculation and for those that were floated. The scaled values from Puzzarini et al. (2014) agree reasonably well with ours on average. The scaling improved the agreement for some parameters and deteriorated it for others. Our choice for the scaled values was motivated by the aspect that such scaling usually reduces deficiencies caused by the theoretical model or created by the neglect of vibrational effects in the common quantum-chemical calculations of centrifugal distortion parameters. Such scaling works usually well for heavy atom substitutions but not as well for H to D substitutions as may be seen in the example of the cyclopropenone isotopologues (Müller et al., 2021).
The frequencies calculated from the parameters in the S reduction and the IIIl representation for the strong transitions in the range of PILS (329.1 to 362.9 GHz; see Section 3) differ little from our previous calculations based only on the data available through Albert et al. (2019) for prolate paired transitions, in particular those with . Deviations exceeding 300 kHz were observed for oblate paired transitions, in particular those with . Albert et al. (2019) provided also calculations of strong rotational transitions of -C2H3DO between 300 and 400 GHz in their supplementary material. The frequencies of prolate paired transitions agree usually quite well with our current ones; but the deviations increase to nearly 70 MHz for the oblate paired transitions with . Such large deviations are difficult to explain in light of their FIR data combined with the fact that interpolation in quantum numbers is usually not a problem.
3 Astronomical search for mono-deuterated oxirane
3.1 Overview of the observations
We employed a calculation of the rotational spectrum of -C2H3DO based on our results described in Section 2 to search for this isotopologue in data from PILS. As described in introduction, PILS is an unbiased molecular line survey of the protostellar object IRAS 162932422 carried out with ALMA in its Cycle 2 (project id: 2013.1.00278.S, PI: J. K. Jørgensen). The source is separated into two main components, the more prominent Source A (in itself a binary source; Wootten 1989) and the secondary Source B, separated by about 5″ (700 au), and both commonly viewed as Class 0 protostars. The survey covers part of Band 7 from 329.1 to 362.9 GHz at 0.2 km s-1 spectral and 0.5″ angular resolution. An overview of the data and their reduction as well as first results from that survey are presented in Jørgensen et al. (2016). Also considered were Band 6 observations toward IRAS 16293-2422 in its Cycle 4 (project id: 2016.1.01150.S, PI: V. Taquet) targeting a few selected windows at 232.71–234.18 GHz, 234.92–235.38 GHz, 235.91–236.38 GHz and 236.37–236.84 GHz, previously presented in Taquet et al. (2018). We refer to that paper for further details about those data and their reduction.
We focus on Source B in the present work because its narrow lines (1 km s-1) make it an ideal target for searches for rare species. The position that we have used almost exclusively in investigations of Source B is slightly offset from its continuum peak because opacity of the continuum is less severe, absorption lines are fewer and weaker and the lines are particularly narrow (see, e.g., Jørgensen et al. 2016, 2018; Calcutt et al. 2018).
3.2 Astronomical results
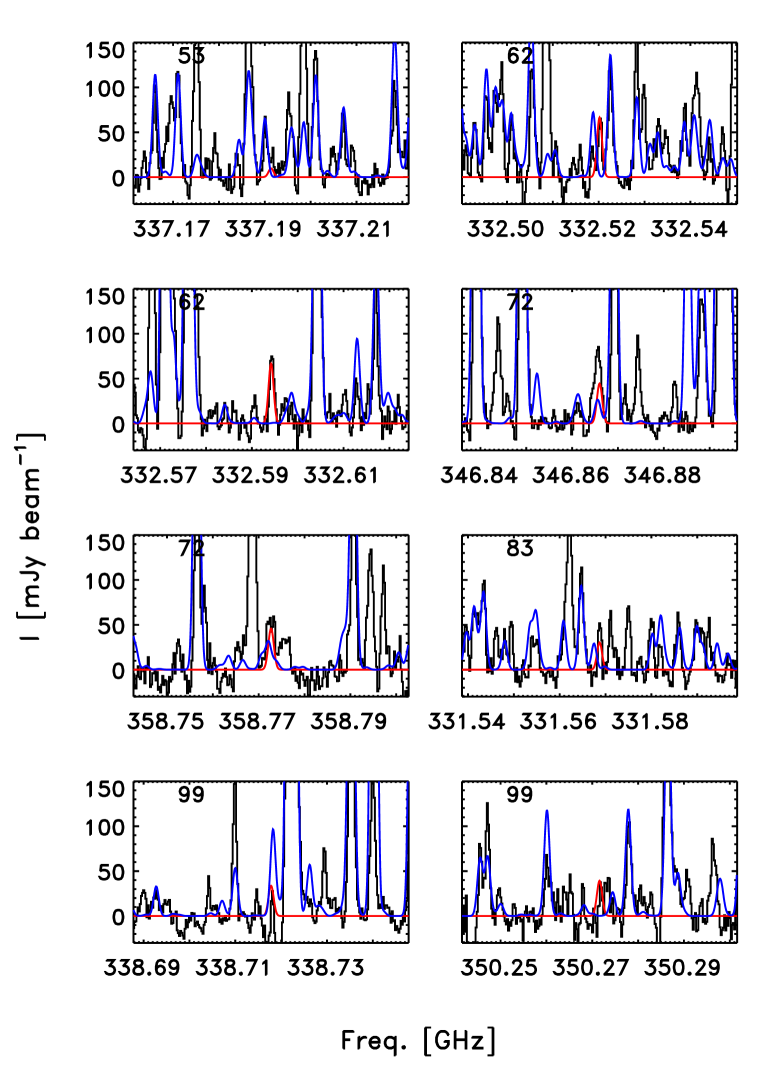
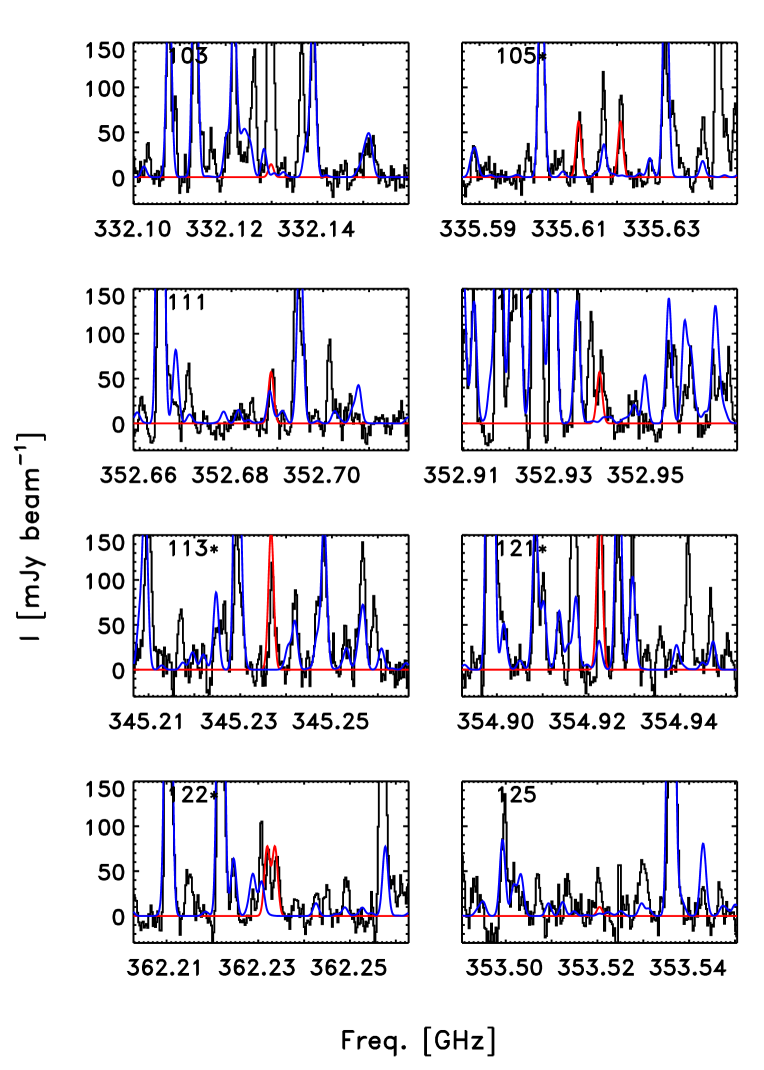
The search for -C2H3DO towards IRAS 162932422 B was carried out by fitting synthetic spectra to the PILS data similar to other searches for complex molecules in this source. The synthetic spectra were calculated assuming the molecules are in local thermodynamical equilibrium (LTE) which is sensible given the high densities in the molecular cloud surrounding the protostar that is probed by our ALMA observations (Jørgensen et al., 2016). We assumed K in our initial calculations as was determined for -C2H4O (Lykke et al., 2017). We employed a linewidth (FWHM) of 1 km s-1 and a velocity offset relative to the local standard of rest of 2.6 km s-1 for the same reasons. Several of the stronger transitions of -C2H3DO in the Band 7 data of PILS are shown in Fig. 4 and are summarized in Table 4. A large fraction of these were found to be unblended or only slightly blended. As indicated in Section 1 and Section 2.6, our own calculation based on data available through Albert et al. (2019) had an accuracy that was sufficient to identify -C2H3DO towards IRAS 162932422 B but was somewhat limited to achieve a satifactory analysis.
The analysis yielded a -C2H3DO column density cm-2. This results in a -C2H3DO to -C2H4O ratio of 0.15 with the -C2H4O column density taken from Lykke et al. (2017). This corresponds to a D-to-H ratio of 0.036 per H atom because all four H atoms in -C2H4O are equivalent with respect to substitution by one D. We constructed a rotation diagram from the unblended or only slightly blended transitions because these were numerous enough and span a range of upper state energies as can be seen in Table 3. Such a rotation diagram may serve as a check of the modelling and it also provides a measure of the statistical uncertainties originating from the observational data. The rotation diagram is shown in Fig. 6 together with the results. We also applied our model based on the Band 7 data to the observations in Band 6: a small number of lines were detected in the more limited Band 6 data and only one appeared to be unblended (Fig. 5). Still, the good match to the single transition is an additional verification of the results. These transitions are also given in Table 3.
| Frequency | Notes | |||
|---|---|---|---|---|
| 235180.99 | 33 | 1.95 | ||
| 235190.43 | 311 | 1.05 | ||
| 235200.38 | 311 | 1.05 | ||
| 235965.82 | 33 | 1.95 | ||
| 331568.82 | 84 | 2.51 | ||
| 332130.07 | 103 | 1.26 | ||
| 332520.25 | 63 | 5.99 | ||
| 332594.25 | 63 | 6.00 | ||
| 335611.61 | 105 | 5.09 | ||
| 335620.97 | 105 | 5.09 | ||
| 337191.43 | 54 | 0.79 | ||
| 338717.98 | 100 | 2.87 | ||
| 345236.98 | 114 | 6.57 | ||
| 345237.01 | 114 | 6.57 | ||
| 346866.07 | 72 | 3.76 | ||
| 350271.77 | 100 | 3.35 | ||
| 352688.86 | 112 | 4.94 | ||
| 352939.91 | 112 | 4.95 | ||
| 353520.70 | 125 | 0.95 | ||
| 354922.73 | 122 | 8.10 | ||
| 354922.73 | 122 | 8.10 | ||
| 358772.79 | 72 | 3.89 | ||
| 362232.22 | 122 | 6.65 | ||
| 362233.93 | 122 | 6.65 |
a Derived from our parameter set emplyoing the S reduction in the IIIl representation.
b Blended.
c Weak, close to the noise limit.
d Partially blended.
e Blended with absorption line.


3.3 Discussion of astronomical results
The temperature of K determined from the rotation diagram -C2H3DO agrees well with the 125 K obtained for -C2H4O (Lykke et al., 2017). The column density from the rotation diagram of cm-2 is slightly lower than cm-2 derived from the modelling applying 125 K to some degree because the partition function value is lower at 103 K than at 125 K.
The degree of deuteration of -C2H3DO referenced to one H atom of 0.036 is slightly larger than species such as formaldehyde, methanol, ketene, HNCO, formamide and cyanamide with ratios of 0.02–0.03 but lower than some of the larger complex species such as ethanol, methylformate, glycolaldehyde and acetaldehyde with ratios of 0.05–0.06 (Jørgensen et al., 2018; Coutens et al., 2016, 2018). This difference may reflect differences in the formation time with the species with the lower ratios forming earlier in the evolution of the prestellar cores.
Some of the emission lines of monodeutero-oxirane are strong enough that it may be possible to detect doubly-deuterated oxirane. Recall that there are four different ways to substitute one H by one D, but all four of them are spectroscopically indistinguishable. There are six different ways to substitute two of the four H by two D, however, only two each are spectroscopically indistinguishable, leading to three spectroscopically different doubly-deuterated oxirane isotopomers, 1,1-dideutero-oxirane and -1,2-dideutero-oxirane with symmetry and -1,2-dideutero-oxirane having symmetry. If the degree of deuteration were also 0.036 per H atom in dideutero-oxirane this would lead to an abundance of 0.0027 relative to the main species for each of the three dideutero-oxirane isotopomers. Even the strongest lines would be close to the detection limit. Combined with a large probability that these lines are blended with stronger features of other species, the unambiguous detection of dideutero-oxirane in the PILS data would be fairly unlikely even if the presence of three isotopomers increase the chances to detect a sufficiently large number of lines with certainty. It is, however, common that the degree of deuteration per H atom is higher in doubly deuterated molecules compared to the respective singly deuterated isotopologues. In the case of D2CO (Persson et al., 2018), CHD2CN (Calcutt et al., 2018) and CHD2OCHO (Manigand et al., 2019) detected in the PILS data this degree is higher by factors of about 2.8, 3.3 and 2.0 respectively than for the corresponding singly deuterated isotopic species leading to column densities between a factor of four and ten higher than without this additional increase in deuteration. A similar result was obtained for the deuteration of NH2 to ND2 compared with that to NHD (Melosso et al., 2020). Additional support comes from the PILS data of CH3OH and CH2DOH (Jørgensen et al., 2016), CHD2OH (Drozdovskaya et al., 2022) and CD3OH (Ilyushin et al., 2022). It has been argued that the higher degree of deuteration per H atom for multiply deuterated isotopologues compared with the respective singly deuterated ones has been inherited from the prestellar phase. A very recent investigation into the deuteration of thioformaldehyde of the prestellar core L1544 (Spezzano et al., 2022) supports this view. If the deuteration of the three dideutero-oxirane isotopomers is enhanced in a similar way compared with that of monodeutero-oxirane we may observe column density ratios of 0.01 to 0.025 for each of the three dideutero-oxirane isotopomers compared to the main species, which may be enough for identifications provided not all of the stronger lines of these three species are blended with stronger lines of other species.
4 Conclusions
We prepared a sample of -C2H3DO to extend the line list and to improve the quality of its rest frequencies which is now sufficient well into the terahertz region. We made use of the Protostellar Interferometric Line Survey of IRAS 162932422 to identify mono-deuterated oxirane towards its source B at a level of 0.15 overall and 0.036 with respect to a single H atom relative to the main isotopologue, in good agreement with values observed for some organic molecules in this source but slightly higher than other molecules. The detection of the doubly deuterated oxirane isotopomers should be possible if the strongest lines are not all blended with stronger lines of other species.
Acknowledgements
HSPM thanks Ziqiu Chen and Martin Quack for providing the -C2H3DO millimetre data with higher accuracy. This paper makes use of the following ALMA data: ADS/JAO.ALMA2013.1.00278.S and ADS/JAO.ALMA#2016.1.01150.S. ALMA is a partnership of ESO (representing its member states), NSF (USA) and NINS (Japan), together with NRC (Canada), NSC and ASIAA (Taiwan) and KASI (Republic of Korea), in cooperation with the Republic of Chile. The Joint ALMA Observatory is operated by ESO, AUI/NRAO and NAOJ. The work in Köln was supported by the Deutsche Forschungsgemeinschaft through the collaborative research centre SFB 956 (project ID 184018867) project B3 and through the Gerätezentrum SCHL 341/15-1 (“Cologne Center for Terahertz Spectroscopy”). The research of JKJ is supported by the European Research Council through the ERC Consolidator Grant “S4F” (grant agreement No 646908) and Centre for Star and Planet Formation funded by the Danish National Research Foundation. J.-C. G. acknowledges support by the Centre National d’Etudes Spatiales (CNES; grant number 4500065585) and by the Programme National Physique et Chimie du Milieu Interstellaire (PCMI) of CNRS/INSU with INC/INP co-funded by CEA and CNES. Our research benefitted from NASA’s Astrophysics Data System (ADS).
Data Availability
The spectroscopic line lists and associated files are available as supplementary material through the journal and in the data section of the CDMS222https://cdms.astro.uni-koeln.de/classic/predictions/daten/Oxiran/. The underlying original spectral recordings will be shared on reasonable request to the corresponding author. The radio astronomical data are available through the ALMA archive333https://almascience.eso.org/aq/.
References
- Albert et al. (2019) Albert S., Chen Z., Keppler K., Lerch P., Quack M., Schurig V., Trapp O., 2019, Phys. Chem. Chem. Phys., 21, 3669
- Bacmann et al. (2019) Bacmann A., Faure A., Berteaud J., 2019, ACS Earth Space Chem., 3, 1000
- Brünken et al. (2014) Brünken S., et al., 2014, Nature, 516, 219
- Calcutt et al. (2018) Calcutt H., et al., 2018, A&A, 616, A90
- Ceccarelli et al. (2007) Ceccarelli C., Caselli P., Herbst E., Tielens A. G. G. M., Caux E., 2007, Protostars and Planets V, pp 47–62
- Chantzos et al. (2018) Chantzos J., Spezzano S., Caselli P., Chacón-Tanarro A., Bizzocchi L., Sipilä O., Giuliano B. M., 2018, ApJ, 863, 126
- Coudert et al. (2019) Coudert L. H., Margulès L., Vastel C., Motiyenko R., Caux E., Guillemin J. C., 2019, A&A, 624, A70
- Coutens et al. (2016) Coutens A., et al., 2016, A&A, 590, L6
- Coutens et al. (2018) Coutens A., et al., 2018, A&A, 612, A107
- Coutens et al. (2019) Coutens A., et al., 2019, A&A, 623, L13
- Coutens et al. (2022) Coutens A., Loison J. C., Boulanger A., Caux E., Müller H. S. P., Wakelam V., Manigand S., Jørgensen J. K., 2022, A&A, 660, L6
- Crapsi et al. (2005) Crapsi A., Caselli P., Walmsley C. M., Myers P. C., Tafalla M., Lee C. W., Bourke T. L., 2005, ApJ, 619, 379
- Creswell & Schwendeman (1974) Creswell R. A., Schwendeman R. H., 1974, Chem. Phys. Lett., 27, 521
- Cunningham et al. (1951) Cunningham George L. J., Boyd A. W., Myers R. J., Gwinn W. D., Le van W. I., 1951, J. Chem. Phys., 19, 676
- Dickens et al. (1997) Dickens J. E., Irvine W. M., Ohishi M., Ikeda M., Ishikawa S., Nummelin A., Hjalmarson Å., 1997, ApJ, 489, 753
- Drozdovskaya et al. (2018) Drozdovskaya M. N., et al., 2018, MNRAS, 476, 4949
- Drozdovskaya et al. (2022) Drozdovskaya M. N., Coudert L. H., Margulès L., Coutens A., Jørgensen J. K., Manigand S., 2022, A&A, 659, A69
- Endres et al. (2016) Endres C. P., Schlemmer S., Schilke P., Stutzki J., Müller H. S. P., 2016, J. Mol. Spectrosc., 327, 95
- Fayolle et al. (2017) Fayolle E. C., et al., 2017, Nat. Astron., 1, 703
- Guillemin et al. (2019) Guillemin J.-C., Nasraoui W., Gazzeh H., 2019, Chem. Commun., 55, 5647
- Harju et al. (2017) Harju J., et al., 2017, ApJ, 840, 63
- Hirose (1974a) Hirose C., 1974a, Bull. Chem. Soc. Japan, 47, 1311
- Hirose (1974b) Hirose C., 1974b, ApJ, 189, L145
- Ikeda et al. (2001) Ikeda M., Ohishi M., Nummelin A., Dickens J. E., Bergman P., Hjalmarson Å., Irvine W. M., 2001, ApJ, 560, 792
- Ilyushin et al. (2022) Ilyushin V. V., et al., 2022, A&A, 658, A127
- Jørgensen et al. (2016) Jørgensen J. K., et al., 2016, A&A, 595, A117
- Jørgensen et al. (2018) Jørgensen J. K., et al., 2018, A&A, 620, A170
- Lahaye et al. (1986) Lahaye J. G., Vandenhaute R., Fayt A., 1986, J. Mol. Spectrosc., 119, 267
- Lykke et al. (2017) Lykke J. M., et al., 2017, A&A, 597, A53
- Manigand et al. (2019) Manigand S., et al., 2019, A&A, 623, A69
- Manigand et al. (2020) Manigand S., et al., 2020, A&A, 635, A48
- Margulès et al. (2010) Margulès L., Motiyenko R. A., Alekseev E. A., Demaison J., 2010, J. Mol. Spectrosc., 260, 23
- McGuire et al. (2016) McGuire B. A., Carroll P. B., Loomis R. A., Finneran I. A., Jewell P. R., Remijan A. J., Blake G. A., 2016, Science, 352, 1449
- Medcraft et al. (2012) Medcraft C., Thompson C. D., Robertson E. G., Appadoo D. R. T., McNaughton D., 2012, ApJ, 753, 18
- Melosso et al. (2020) Melosso M., et al., 2020, A&A, 641, A153
- Millar et al. (1989) Millar T. J., Bennett A., Herbst E., 1989, ApJ, 340, 906
- Müller & Lewen (2017) Müller H. S. P., Lewen F., 2017, J. Mol. Spectrosc., 331, 28
- Müller et al. (2005) Müller H. S. P., Schlöder F., Stutzki J., Winnewisser G., 2005, J. Mol. Struct., 742, 215
- Müller et al. (2017) Müller H. S. P., Zingsheim O., Wehres N., Grabow J.-U., Lewen F., Schlemmer S., 2017, J. Phys. Chem. A, 121, 7121
- Müller et al. (2019) Müller H. S. P., et al., 2019, A&A, 621, A143
- Müller et al. (2021) Müller H. S. P., Brahmi M. A., Guillemin J.-C., Lewen F., Schlemmer S., 2021, A&A, 647, A179
- Müller et al. (2022) Müller H. S. P., Guillemin J.-C., Lewen F., Schlemmer S., 2022, J. Mol. Spectrosc., 384, 111584
- Nummelin et al. (1998) Nummelin A., Dickens J. E., Bergman P., Hjalmarson A., Irvine W. M., Ikeda M., Ohishi M., 1998, A&A, 337, 275
- Pan et al. (1998) Pan J., Albert S., Sastry K. V. L. N., Herbst E., De Lucia F. C., 1998, ApJ, 499, 517
- Parise et al. (2002) Parise B., et al., 2002, A&A, 393, L49
- Parise et al. (2004) Parise B., Castets A., Herbst E., Caux E., Ceccarelli C., Mukhopadhyay I., Tielens A. G. G. M., 2004, A&A, 416, 159
- Persson et al. (2018) Persson M. V., et al., 2018, A&A, 610, A54
- Pickett (1991) Pickett H. M., 1991, J. Mol. Spectrosc., 148, 371
- Puzzarini et al. (2014) Puzzarini C., Biczysko M., Bloino J., Barone V., 2014, ApJ, 785, 107
- Requena-Torres et al. (2008) Requena-Torres M. A., Martín-Pintado J., Martín S., Morris M. R., 2008, ApJ, 672, 352
- Richard et al. (2013) Richard C., et al., 2013, A&A, 552, A117
- Richard et al. (2021) Richard C., Jørgensen J. K., Margulès L., Motiyenko R. A., Guillemin J. C., Groner P., 2021, A&A, 651, A120
- Spezzano et al. (2022) Spezzano S., et al., 2022, A&A, 661, A111
- Tanaka et al. (1985) Tanaka K., Tanaka T., Suzuki I., 1985, J. Chem. Phys., 82, 2835
- Taquet et al. (2014) Taquet V., Charnley S. B., Sipilä O., 2014, ApJ, 791, 1
- Taquet et al. (2018) Taquet V., et al., 2018, A&A, 618, A11
- Wootten (1989) Wootten A., 1989, ApJ, 337, 858
- Xu et al. (2012) Xu L.-H., et al., 2012, J. Chem. Phys., 137, 104313
- Yamada & Klee (1994) Yamada K. M. T., Klee S., 1994, J. Mol. Spectrosc., 166, 395