GOALS-JWST: Resolving the Circumnuclear Gas Dynamics in NGC 7469 in the Mid-Infrared
Abstract
The nearby, luminous infrared galaxy (LIRG) NGC 7469 hosts a Seyfert nucleus with a circumnuclear star-forming ring and is thus the ideal local laboratory for investigating the starburst–AGN connection in detail. We present integral-field observations of the central 1.3 kpc region in NGC 7469 obtained with the JWST Mid-InfraRed Instrument. Molecular and ionized gas distributions and kinematics at a resolution of 100 pc over the m region are examined to study gas dynamics influenced by the central AGN. The low-ionization [Fe II] 5.34m and [Ar II] 6.99m lines are bright on the nucleus and in the starburst ring, as opposed to H2 S(5) 6.91m which is strongly peaked at the center and surrounding ISM. The high-ionization [Mg V] line is resolved and shows a broad, blueshifted component associated with the outflow. It has a nearly face-on geometry that is strongly peaked on the nucleus, where it reaches a maximum velocity of 650 km s-1, and extends about 400 pc to the East. Regions of enhanced velocity dispersion in H2 and [Fe II] 180 pc from the AGN that also show high and ([Fe II])/(Pf) ratios to the W and N of the nucleus pinpoint regions where the ionized outflow is depositing energy, via shocks, into the dense interstellar medium between the nucleus and the starburst ring. These resolved mid-infrared observations of the nuclear gas dynamics demonstrate the power of JWST and its high-sensitivity integral-field spectroscopic capability to resolve feedback processes around supermassive black holes in the dusty cores of nearby LIRGs.
1 Introduction
Accreting supermassive black holes (SMBHs) within active galactic nuclei (AGNs) are thought to play a prominent role in influencing the interstellar medium (ISM) of their host through feedback mechanisms such as outflows (see reviews by Veilleux et al., 2020; Armus et al., 2020). Distinguishing the drivers of such winds and determining their direct impacts on surrounding star formation has been difficult due to observational challenges such as heavy dust obscuration. Investigating the triggering of AGN outflows is most ideally done close to the launching site which is often obscured by dust in the case of many Seyfert and luminous infrared galaxies (LIRGs; ), with the latter exhibiting extinction upward of mag or higher (Mattila et al., 2007; Väisänen et al., 2017; U et al., 2019; Falstad et al., 2021; Pérez-Torres et al., 2021).
NGC 7469 offers a prime opportunity to study these phenomena in detail. It is a nearby (; 70.6 Mpc)111NED LIRG hosting a bright Seyfert 1.5 nucleus (Landt et al., 2008) surrounded by a starburst ring ( 530 pc; Genzel et al., 1995; Song et al., 2021) with a bimodal age distribution of stellar populations (Díaz-Santos et al., 2007). Evidence of a wide-angle E-W biconically illuminated outflow in the near-infrared coronal line [Si VI] 1.96m (R[SiVI] = 90 pc) has been presented using VLT/SINFONI integral field spectroscopy (IFS) (FWHM = 014, or 46 pc; Müller-Sánchez et al., 2011). The characteristic outflow structure with broad and blueshifted components along the minor axis of the galactic disk was not seen in the coarser optical GTC/MEGARA IFS observations (FWHM = 093, or 307 pc; Cazzoli et al., 2020). However, turbulent, non-circular kinematics, detected in a component of the H-[N II] complex within the central 610 pc, might be associated with it. More recently, extended circumnuclear outflows were found reaching 531 pc from the AGN in VLT/MUSE observations of [O III] 5007Å (FWHM = 123, or 406 pc; Robleto-Orús et al., 2021; Xu & Wang, 2022). ALMA observations of CO(), CO(), and [C I] in the inner 2 kpc region with angular resolutions of 035 (120 pc) show largely rotational kinematics (Izumi et al., 2020; Nguyen et al., 2021). Despite the multiwavelength effort, there is still no clear picture for how the putative outflow interacts with the circumnuclear gas and starburst ring.
With JWST’s 6.5-meter mirror and advanced instrument suite, we can now resolve the dynamics of gas and dust at angular resolution of 0208 in the mid-infrared wavelengths (528m). In particular, this Letter investigates the detailed gas kinematics in the inner 600-pc region (the “inner ISM region” hereafter) of NGC 7469. We first describe the observations and data processing in Section 2. Section 3 highlights the moment maps of several key ionized and molecular gas emission lines and demonstrates the richness of features in the mid-infrared spectra extracted from the inner ISM region. In Section 4, we discuss the properties of the detected outflow and the shock excitation in the ISM. In several companion papers, we investigate the infrared spectral properties of the AGN (Armus et al. 2022, in preparation), the starburst ring (Lai et al., 2022), and the circumnuclear star-forming regions (Bohn et al., 2022) in NGC 7469.
Throughout the paper, km s-1 Mpc-1, = 0.30, and = 0.70 have been adopted. At the redshift of , 1″= 330 pc (Wright, 2006).
2 Observations and Data Reduction
Mid-infrared IFS observations of NGC 7469 were taken with the JWST Mid-InfraRed Instrument (MIRI; Rieke et al., 2015; Labiano et al., 2021) in Medium Resolution Spectroscopy (MRS) mode on 2022 July 3-4 UT as part of the Early Release Science (ERS) Program 1328 (Co-PIs: L. Armus and A. Evans). The observations covered the full 4.928.8m range using the short (A), medium (B), and long (C) sub-bands in all four channels. We adopted the FASTR1 readout pattern to optimize the dynamic range expected in the observations. Using the extended source 4-pt dither pattern, the science exposure time per sub-band was 444 seconds. Because our source is extended, we linked the observation to a dedicated background with the same observational parameters in all three grating settings.
Uncalibrated science and background observations were downloaded using the MAST Portal and processed with the JWST Science Calibration Pipeline (Bushouse et al., 2022) version 1.6 in batch mode. The Detector1 pipeline applies detector-level corrections and ramp fitting to the individual exposures. The output rate images were subsequently processed outside the JWST pipeline to flag newly-acquired bad pixels and additional cosmic ray artifacts, and to remove vertical stripes and zeropoint residuals remaining after the pipeline dark subtraction. These additional corrections broadly follow the steps taken for JWST ERO observations as described by Pontoppidan et al. (2022). The resulting rate files are then processed with the JWST Spec2 pipeline for distortion and wavelength calibration, flux calibration, and other 2d detector level steps. Residual fringe corrections using prototype pipeline code have been applied to both the Stage 2 products and to the 1-D spectra resulting from Stage 3 processing.
Stage 3 processing (Spec3) performs background subtraction before combining data from multiple exposures into the final data cubes. Background light is subtracted from the 2-D science images using a master background frame generated from our associated background observations. The master background is a 1-D median sigma-clipped spectrum calculated over the field-of-view (FOV) of the background observations and projected to the entire 2-D detector array. Since it is a combination of many detector pixels, it does not degrade the signal-to-noise ratio (SNR) the way a pixel-by-pixel background subtraction would. The cube-building step in Spec3 assembles a single 3-D data cube from all of the individual 2-D calibrated detector images, combining data across individual wavelength bands and channels.
NIRCam’s broadband F150W, F200W, and F444W images of NGC 7469 from our ERS-1328 Program have been included in this paper for visualization purposes. Readers are referred to Bohn et al. (2022) for the data processing details.
3 Analysis and Results
3.1 Emission Line Maps
In this paper, we focus our investigation on the Channel 1 MRS data (4.89m to 7.66m), which hosts key diagnostic lines for shock excitation ([Fe II] and H2), strength of the radiation field ([Ar II]), and coronal region ([Mg V]) at the highest spatial resolution afforded by MRS at 03. Known issues with MRS wavelength solutions (at the time of this writing) are generally not a concern for Ch 1, where zeropoint variations at the 0.001m level ( 60 km s-1) are within the spectral noise at these wavelengths. We fit single Gaussian profiles to three of the brightest ionized and molecular lines in Ch 1 ([Fe II] 5.34m, H2 S(5) 6.91m, and [Ar II] 6.99m) on a spaxel-by-spaxel basis and computed their corresponding flux, velocity, and velocity dispersion maps using ifscube (Ruschel-Dutra & Dall’Agnol De Oliveira, 2020; Ruschel-Dutra et al., 2021). We correct our linewidth measurements for instrumental broadening ( = 36.5 km s-1) by subtracting it in quadrature.
As shown in Figure 1, the morphologies of the emission lines differ among these molecular and low-ionization potential (IP) gases: [Fe II] (IP = 7.9 eV) and [Ar II] (IP = 15.8 eV) are bright and compact at the nucleus and at several star-forming clumps in the ring. The starburst ring appears slightly asymmetric around the central nucleus, where the southeast (SE) inner edge is closer to the AGN. In contrast, the H2 dominates and appears extended at the center but relatively weak in the ring. The nuclear H2 emission is 14 across, nearly 5 times larger than the FWHM of the point spread function (PSF) of 03 at 7.2m continuum. Filamentary structures extend in the NE and SW directions from the central emission that appear to be well aligned with high surface brightness CO gas (see Figure 2 in Izumi et al., 2020) at the sites of the innermost spiral arms.
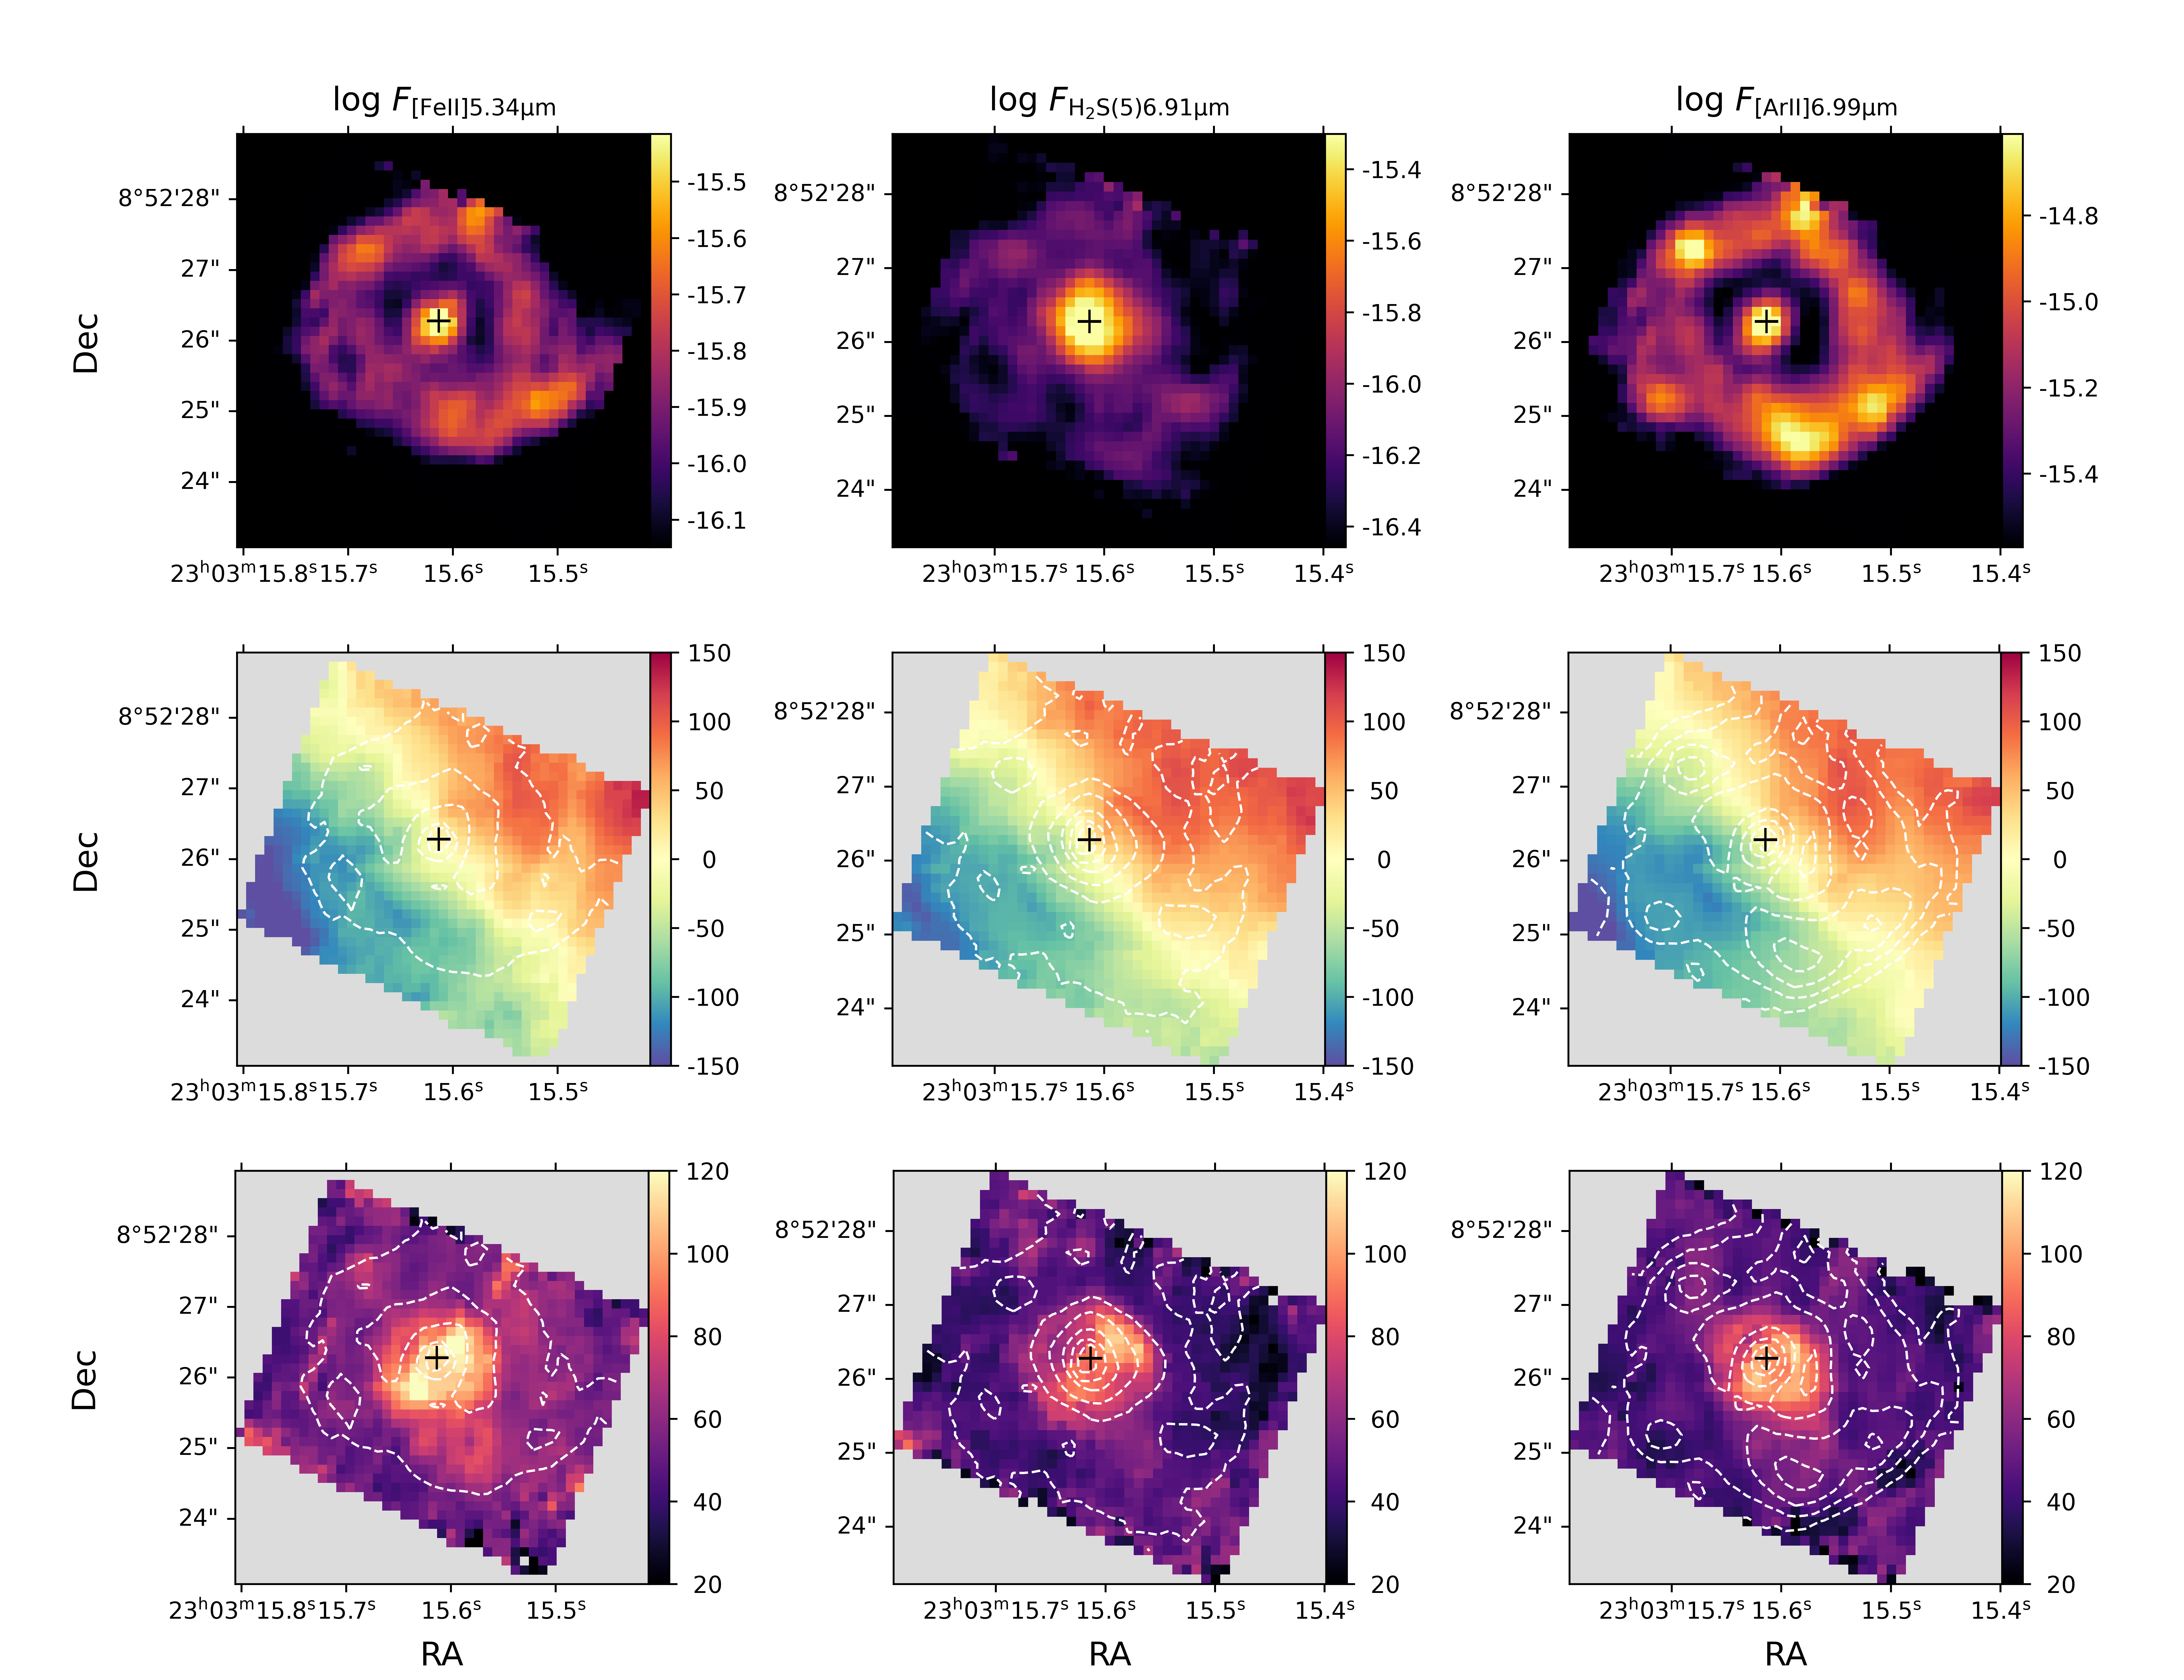
The gas kinematics for these lines are largely similar, sharing a bulk rotational motion around the ring. The kinematic major axis has a position angle (PA) of 126° as measured using PaFit (Krajnović et al., 2006). The morphological semi-major axis (21) and semi-minor axis (17) of the ring gives an inclination angle 51°. The velocity field is reminiscent of a tilted rotating ring with the near (far) side in the E/NE (W/SW). We compute the contribution to the velocity dispersion due to rotation and beam smearing following the technique from Swinbank et al. (2012); De Breuck et al. (2014): we measure the luminosity-weighted velocity gradient across the FWHM of the beam at each spaxel and subtracted it from the velocity dispersion in quadrature. For all these gases, the median effect was at the 6% level ( 4 km s-1), with 75% of the spaxels affected under 10% ( 7 km s-1) and 95% under 20% ( 14 km s-1).
The H2 velocity dispersion is slightly suppressed at the center (95 km s-1, or 75 km s-1 intrinsically) but increases toward the NW direction in a cone shape, similar to the shocked H2 2.12m detected in Mrk 273 (U et al., 2013). The [Fe II] gas, sensitive to strong shocks, shows high velocity dispersions (reaching as high as 135 km s-1) roughly along the kinematic axis toward both NW and SE.
3.2 Spectral Fits
To quantify the ISM conditions surrounding the AGN, we divide the inner 18 (600 pc) ISM region within the ring as seen at 7.1m, the observed wavelength of [Ar II], into a 3 3 grid and subsequently extract 1-D spectra from these bins. Since the central region contains a point source from the AGN, we apply a wavelength-dependent aperture correction to the central spectrum. The aperture correction is calculated using the MRS PSF models from WebbPSF (Perrin et al., 2014) that have been adjusted to match preliminary in-flight performance during JWST commissioning (private communication). These models are nearly diffraction limited longward of 8m and moderately elliptical at shorter wavelengths. Figure 2 shows the extraction regions (06 on a side) and their corresponding spectra normalized at [Ar II]. The stitched Ch 1 short-medium-long spectra exhibit a number of strong molecular and fine structure lines, as well as polycyclic aromatic hydrocarbon (PAH) features. Several of these emission lines were previously seen with Spitzer/IRS, but with a large aperture that included the starburst ring and the AGN (Stierwalt et al., 2013; Inami et al., 2013). The relatively poor spatial resolution of Spitzer precluded studies of the variations in the strengths and profile shapes of these lines with positions on these scales, now made possible with JWST. Detailed discussions of the nuclear AGN spectrum and of the dust grains in the star-forming ring are presented in two companion papers (Armus et al. 2022, in preparation, Lai et al., 2022, respectively).
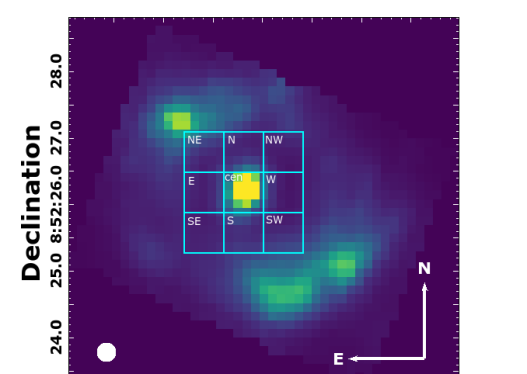
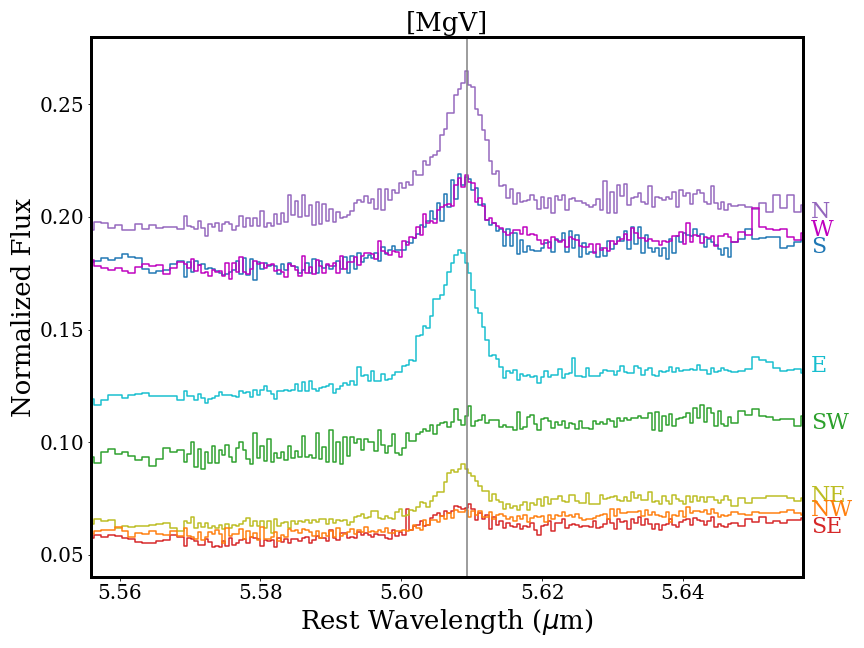
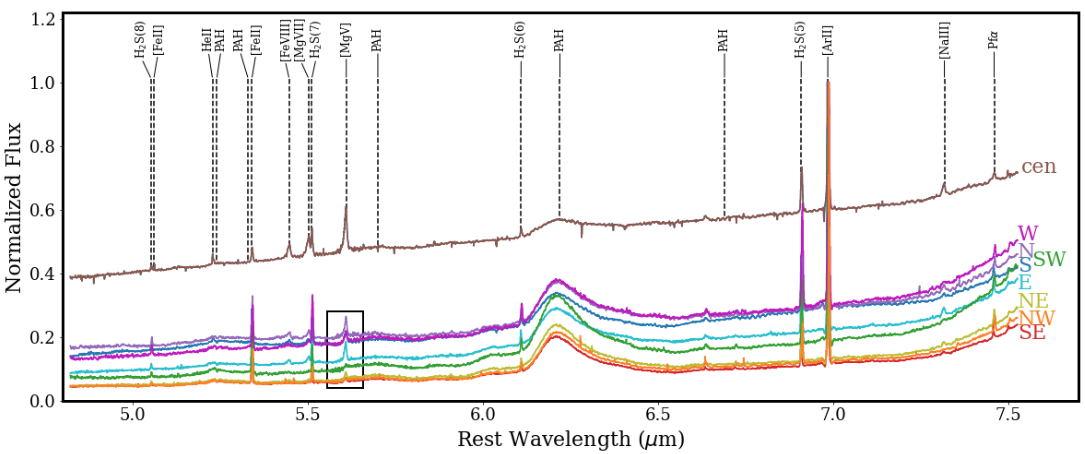
A handful of high-ionization lines ([Fe VIII] 5.48m with IP = 124 eV, [Mg VII] 5.50m with IP = 186 eV, and [Mg V] 5.61m with IP = 109 eV) show clear blue-shifted wings. The coronal line [Mg V] is the strongest among these features in all the 1-D spectra. Given their high IPs, photo-ionized coronal lines are typically produced on several hundred parsecs away from the AGN (Ferguson et al., 1997). Kinematics of coronal lines often reveal blueshifts indicating that outflows on these scales are common (e.g. Riffel et al., 2021). While strong coronal lines might be expected at the nucleus, broad and blueshifted components may be present in the immediate vicinity of the nucleus if an outflow is present. Indeed, a close look at our extracted spectra reveals that [Mg V] is most significantly shifted in the E, 70 km s-1 with respect to the center (Figure 2 inset). The blueshifted asymmetric profile of [Mg V] can be seen in several other directions as well.
To further investigate the distribution and kinematics of [Mg V], we fit two Gaussian components using a modified version of the Bayesian AGN Decomposition Analysis for SDSS Spectra software package (BADASS; Sexton et al., 2021) spaxel-by-spaxel and generate moment maps for the two components; see Appendix A. The core, narrow component of [Mg V] is plausibly consistent with rotation at the same PA as that for the low-ionization and molecular gases. A broad component is identified in a subset of the central spaxels, encompassing the blueshifted outflowing gas. The outflow is detected up to a projected distance of 420 pc E of the nucleus. Within this physical extent, the gas exhibits a median line-of-sight velocity of km s-1 but reaching as high as km s-1 close to the AGN. This outflow is also identified in other high-ionization lines such as [Fe VIII] 5.45m (IP = 124 eV) and [Ne VI] 7.65m (IP = 126 eV), and mid-ionization lines such as [O IV] 25.9m (IP = 55 eV), the detailed line profiles for which will be characterized in Armus et al. 2022, in preparation. We do find that the high ionization lines in the nuclear spectrum exhibit extreme blueshifted velocities upward of 1000 km s-1, indicating the presence of very fast winds at the center.
Multi-component spectral fitting is performed on the full Ch 1 spectral coverage of each 1-D spectrum using the Continuum And Feature Extraction (CAFE; Marshall et al., 2007, Dìaz-Santos et al. 2022, in preparation) software package originally written in IDL for analyzing Spitzer/IRS data. While individual atomic or molecular lines can be fit using single or double Gaussian profiles, CAFE specializes in decomposing the emission in the mid-infrared regime into AGN, PAHs, dust of different temperatures, and starburst components, and is ideal for recovering properties of PAH features in 1-D spectra that often require multiple components to fit correctly. The development of an improved version of the CAFE code that handles high-resolution spectral decomposition is fully described in Dìaz Santos et al. 2022, in preparation). Major updates include a fully-functional Python version applicable to the data format and spectral resolution of JWST IFS data. The flux densities for the various relevant emission-line features are reported in Table 1.
| Location | H2 S(5) | H2 S(6) | H2 S(7) | PAH 6.2m | [Fe II] 5.34m | Pf |
|---|---|---|---|---|---|---|
| E | 1.97 0.05 | 0.42 0.05 | 0.90 0.08 | 83.82 6.49 | 1.28 0.06 | 0.25 0.03 |
| N | 3.15 0.09 | 0.67 0.05 | 1.99 0.12 | 93.40 3.48 | 1.73 0.09 | 0.28 0.03 |
| NE | 1.76 0.06 | 0.29 0.06 | 0.81 0.07 | 156.27 4.84 | 1.95 0.09 | 0.49 0.03 |
| cen | 3.70 0.13 | 0.82 0.10 | 1.95 1.09 | 121.82 32.01 | 2.00 0.14 | … … |
| NW | 1.26 0.06 | 0.24 0.02 | 0.68 0.06 | 103.58 5.36 | 1.49 0.08 | 0.36 0.03 |
| S | 4.88 0.23 | 1.23 0.19 | 2.50 0.29 | 235.51 7.74 | 4.21 0.26 | 0.86 0.15 |
| SE | 1.52 0.09 | 0.27 0.07 | 0.61 0.08 | 173.99 5.47 | 2.79 0.13 | 0.66 0.09 |
| SW | 4.46 0.11 | 0.92 0.14 | 2.30 0.20 | 350.55 7.97 | 5.73 0.27 | 0.83 0.11 |
| W | 7.89 0.18 | 1.75 0.11 | 4.56 0.22 | 178.10 9.80 | 3.77 0.22 | 0.53 0.08 |
Note. — All flux densities are in units of 10-23 W m-2 pc-2. The aperture used for the grid extraction is 06 06. Pf is not well detected at the center and thus its measurement is omitted.
4 Discussion
4.1 Outflow Characteristics
As briefly introduced in Section 1, previous multiwavelength efforts in the literature converged on the presence of non-rotational kinematics in the circumnuclear region of NGC 7469, but the picture of how the non-rotating gas behaved at different physical scales was incomplete due to mismatches in observational parameters and data sensitivity (Müller-Sánchez et al., 2011; Cazzoli et al., 2020; Robleto-Orús et al., 2021). With JWST’s superb sensitivity, spectral resolution, and integral-field capability in the mid-infrared wavelengths, we can now incorporate the molecular, low- and high-ionization gases into a coherent picture with the same data set on the same physical scales. We see from Figure 2 that the high IP [Mg V] line is prominently blueshifted, with a nearly face-on geometry and flux extending E of the nucleus. The intensity of the broad, blueshifted component from Figure A.2 (lower left panel) is overplotted on the NIRCAM images as contours in Figure 3 (inset).
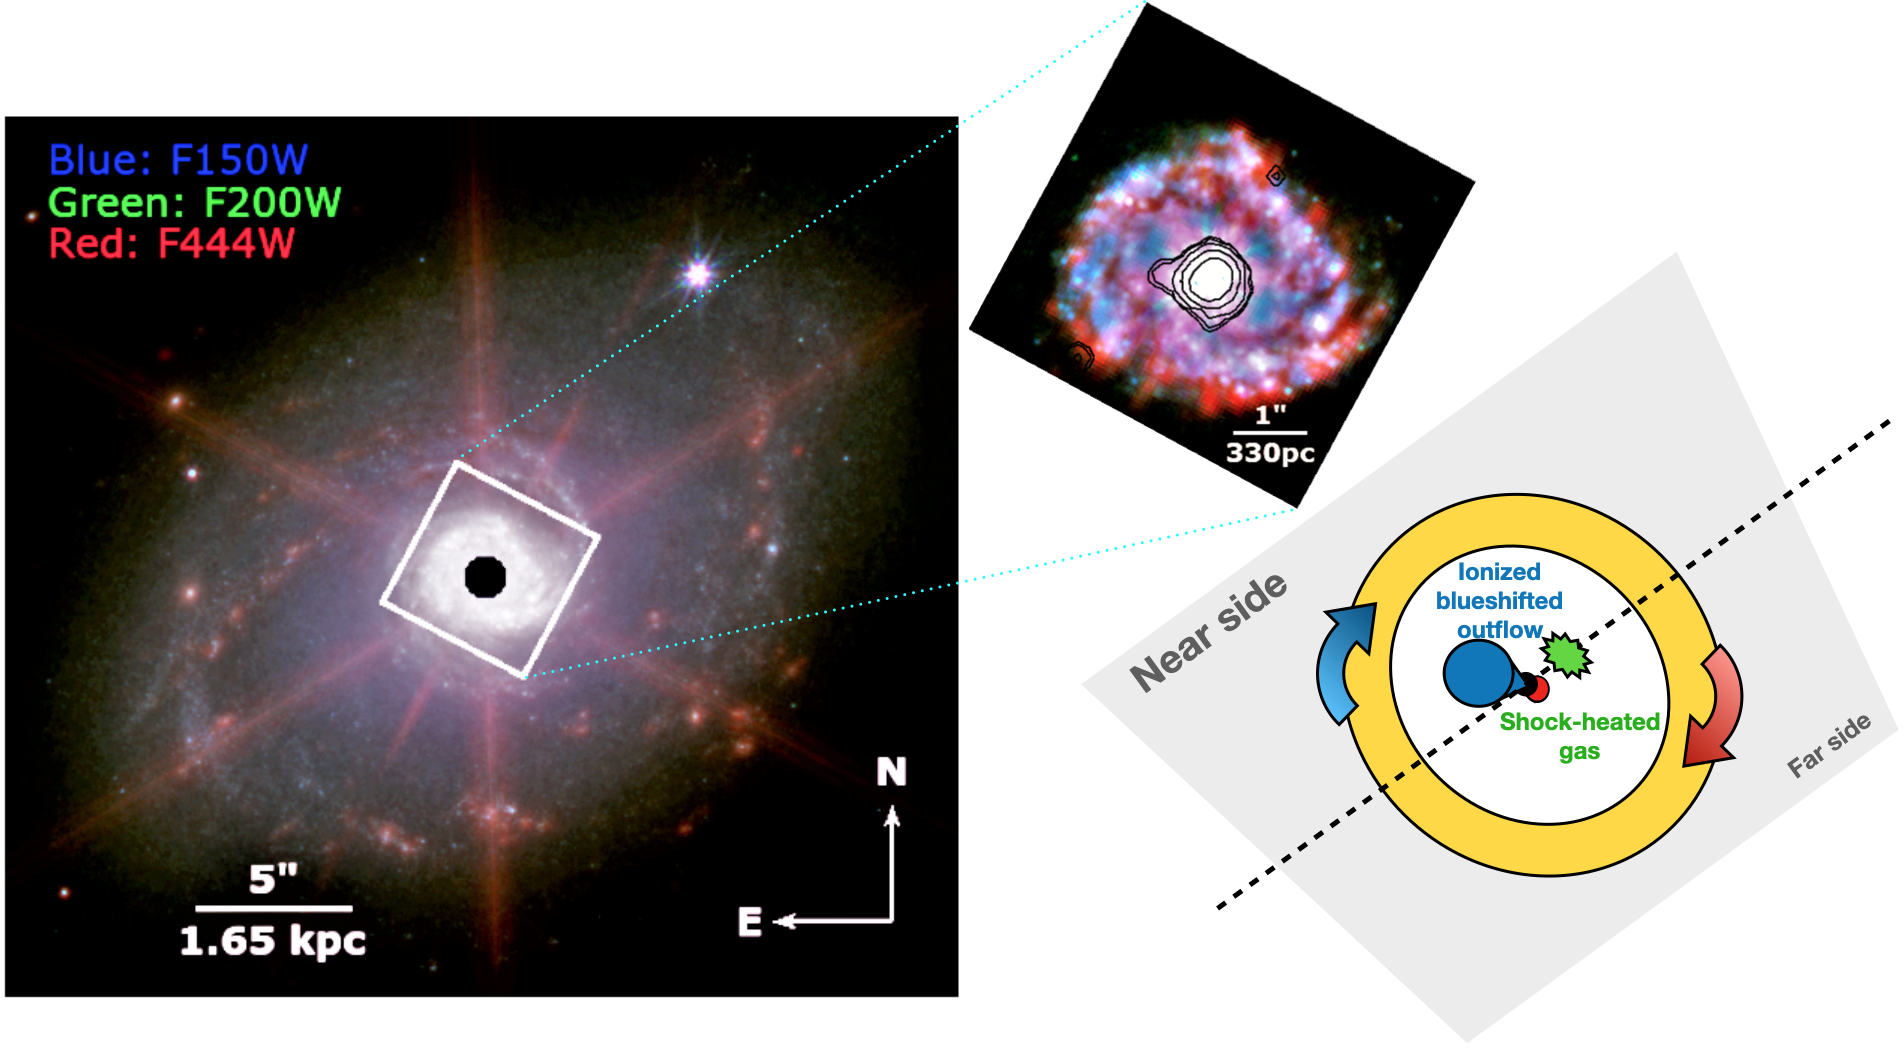
Given that the gas is photoionized and [Mg V] is tracing the illumination pattern, we see primarily the blue-shifted outflowing gas coming toward us from a nearly face-on galaxy with inclination angle of 45° (Davies et al., 2004), which is consistent with our measured of 51° based on the ring structure. The [Mg V] observations further support the picture in which the circumnuclear obscuration is roughly in the same plane as the galaxy’s large-scale disk.
To place our findings in the context of literature results, we consider the scales of the outflows detected with different instruments and tracers. Robleto-Orús et al. (2021) found an outflow as characterized by blueshifted [O III] 5007Å extending 531 pc from the nucleus. Resolved at similar scales as our MIRI/MRS data, the [O III] outflow may be more extended than the coronal wind we detect in [Mg V] because it is more easily excited (with IP = 35 eV) and more extincted at the center. On the other hand, the biconically-illuminated [Si VI] 1.96m outflow presented by Müller-Sánchez et al. (2011) has an E-W orientation, but at much smaller scale close to the AGN. The entire [Si VI] emission (IP = 167 eV) falls within the central 12 spaxels of MIRI/MRS. The mid-infrared coronal outflow we find could have physical connection with the X-ray warm absorber in this AGN in terms of location and ionization condition (Blustin et al., 2007). Our results suggest a scenario where the high-ionization outflow detected by JWST likely bridges the nuclear-scale ( 100 pc) coronal line region outflow and the larger-scale narrow line region winds. The outflow appears one-sided because it is approaching us nearly face-on; the projected size of a potentially receding red-side cone behind the AGN may be too small to be spatially resolved by MIRI (Figure 3). Even though there may be a hint of a redshifted wing in the W spectrum (Figure 2), the SNR is too weak in the individual spaxels for a robust spectral fit. The redshifted wind may simply be obscured by dense, intervening ISM. Alternatively, the outflow may also appear asymmetric if an inclined jet is pushing on the gas in the disk (e.g. in NGC 1052; Fernández-Ontiveros et al., 2019). While NGC 7469 may host a radio core–jet structure as resolved by the Very Large Array (Orienti & Prieto, 2010), no evidence of radio jet–ISM interaction has yet been found in its nuclear region (Xu & Wang, 2022).
4.2 ISM excitation
Our MIRI/MRS observations allow us, for the first time, to examine the high-ionization outflow identified here in [Mg V] at pc in detail. We search for evidence that indicates how the outflow may impact its surroundings. The mid-infrared rotational transitions of H2, when coupled with measurements of the PAH emission, provide a robust diagnostic of the excitation conditions and help determine the mechanism responsible for exciting the H2 lines (Higdon et al., 2006; Ogle et al., 2010; Guillard et al., 2012; Cluver et al., 2013). Young massive stars may heat both PAHs and H2 in photodissociation regions (PDRs), but shocks arising from outflows or X-ray emission from AGN effectively dissociate PAH molecules and small grains (Jones et al., 1996). Empirically, low-luminosity star-forming galaxies exhibit a limited range of luminosity ratio over several orders of magnitude in while those for AGN display line ratios 15 times greater (Roussel et al., 2007). Thus, the line ratio has been used to distinguish between AGN, stars, and shocks as the driver of molecular emission in extreme environments such as LIRGs (Stierwalt et al., 2014; U et al., 2019).
Ideally, the total power in the warm H2 and all forms of PAH lines should be used in any analysis of PDR heating, given that the bulk of the molecular gas mass may be traced by the lower rotational H2 transitions. However, to take advantage of the high spatial resolution in MIRI Ch 1 and minimize contamination in the inner ISM region from the nucleus and the ring, we opt to confine our analysis of to the lines present in this channel, recognizing the potential limitations. In Ch 1 MRS data cube (Figure 2), four H2 transitions are identified: S(5) 6.91m is detected and appears prominent in all the extracted spectra; S(6) 6.11m, while detected, sits on top of a prominent PAH feature at 6.2m and may be dominated by PAHs at certain locations; S(7) 5.51m may be partially blended with [Mg VII] 5.5m; and S(8) 5.05m is comparatively weak. For these reasons, the S(5) line is the most optimal line among the possibilities. Its proximity to PAH6.2m reduces the risk of potential calibration differences between sub-bands and differential extinction, so we focus on using this pair of features for the diagnostic. We note that close to the AGN ( 300 pc), the H2 gas is expected to be quite hot ( 900-1100K; Pereira-Santaella et al., 2022; Lambrides et al., 2019) and is dominated by AGN heating in the central 100 pc (Armus et al. 2022, in preparation), so the S(5) line likely carries much of the H2 luminosity, justifying our reliance on this line to measure the ratio.
Figure 4 (left) shows the distribution versus H2 luminosity density for the different locations within the inner ISM. The first result is that the corner points (NW, NE, SE, and SW) all have lower ratios than the other locations. Examining the spectra in Figure 2, the PAH features are more prominent at the corner locations that contain a larger fractional emission from the ring than at the E-W or N-S locations. This is expected, since PAH emission mostly originates from PDRs and, for some galaxy populations and/or environments, can be used as star formation rate tracers (e.g. Peeters et al., 2004). In contrast, the H2 emission is relatively weaker in the ring, as seen in Figure 1, in agreement with what is expected from actively star-forming regions.
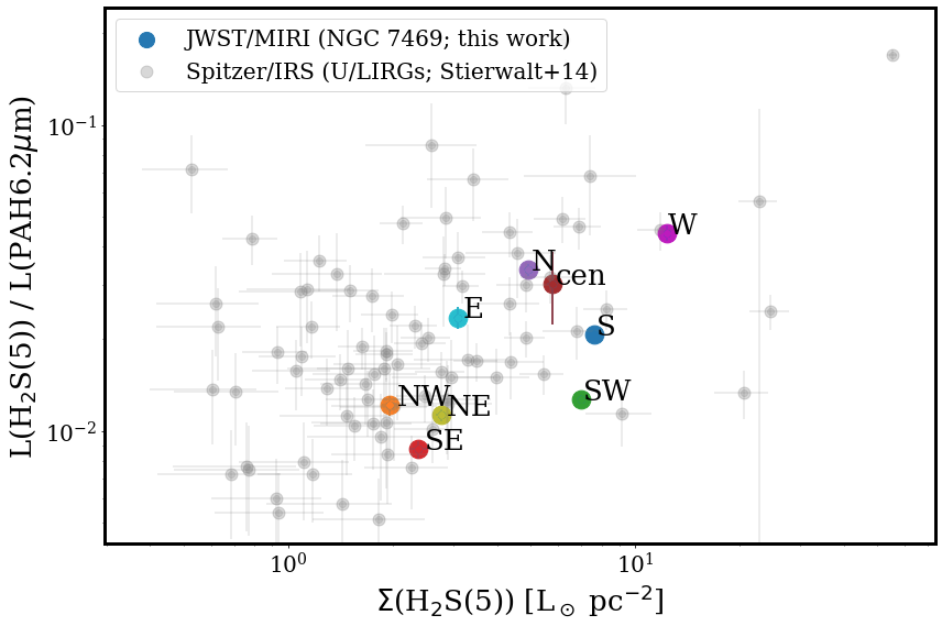
For comparison, we have plotted in Figure 4 the integrated Spitzer/IRS data points for a sample of local LIRGs (Stierwalt et al., 2014) from the Great Observatories All-sky LIRGs Survey (GOALS; Armus et al., 2009). Because the angular-size aperture (37 95) used to extract the Spitzer/IRS spectra is much larger than that of our extraction grid size, we show the H2 luminosity surface density, , in the x-axis instead of luminosity, for a more direct comparison with the Spitzer/IRS values. Our data points span a broad range in of the GOALS LIRGs, and are consistent with the more H2 bright sources for a given value. This shift may be due to the fact that the global values from Spitzer/IRS are uniformly weighted and encompass many star-forming regions and obscured AGN sources, while our resolved data points represent the inner ISM region close to the Seyfert nucleus in NGC 7469 where H2 is prominently detected.
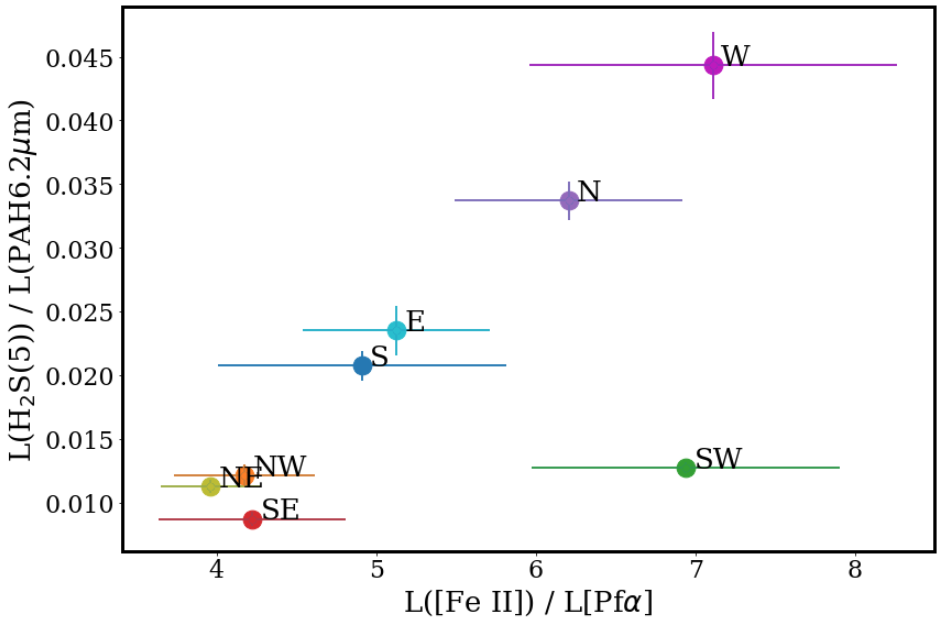
The inner ISM region does not host bright star-forming regions and therefore PDR models are not applicable, but X-rays from the AGN and shocks from the outflow can heat the molecular gas (Petric et al., 2018; Minsley et al., 2020). Since iron is highly depleted onto grains, [Fe II] is a commonly adopted tracer of shock-excited gas where grains have been processed by outflows or other ionizing sources (see references in reviews by Sajina et al., 2022; U, 2022). Infrared studies of supernova remnants indicate that not only do they produce H2 lines as luminous as bright star-forming regions, they are also associated with enhanced [Fe II]/Br relative to typical H II regions (Oliva et al., 1989). The latter observation has been predicted by theoretical models of shock fronts (McKee et al., 1984), where the ratio of [Fe II]-to-Hydrogen is deemed a useful indicator of the efficiency of the shock front in destroying dust grains (Hollenbach & McKee, 1989). Here, we examine the ratio of ([Fe II])/(Pf) given that the H recombination line Pfund traces star formation, provides a calibration baseline, and is detected in Ch 1.
Figure 4 (right) shows plotted as a function of ([Fe II])/(Pf), which appears to be well correlated with the exception of the SW region. We compute a correlation for all the data points using pymccorrelation (Privon et al., 2020) with 104 bootstrapping iterations to estimate the uncertainties. We determine the Pearson’s correlation coefficient = 0.62, with a -value of 0.10 driven mostly by the outlier point at SW and the large uncertainties of Pf. If we exclude SW (which shows the peakiest PAH6.2m profile and the most extreme slope on the red end of the Ch1 spectra where Pf is located; see Figure 2), the resulting coefficient becomes = 0.86, with a -value of 0.01, suggesting that [Fe II] and H2 at the W and N locations are likely excited by the same shocks driven by the outflow. This correlation between [Fe II] and H2 in (U)LIRGs has been studied by Hill & Zakamska (2014), who also inferred that shocks, including AGN-driven ones, are the likely source of H2 heating.
The most extreme region, W, which partially overlaps the region of high H2 and [Fe II] velocity dispersion (Figure 1), is, interestingly, on the opposite side of the center from the blueshifted coronal gas. It is possible that the H2 and [Fe II] are regions of high velocity dispersion represent regions where the receding, partially obscured part of the outflow is plowing into the dense ISM and releasing [Fe II] into the gas phase. A strong correlation between [Fe II] and H2 may be associated with sites of supernova remnants, where [Fe II] is produced in radiative shocks after grain destruction as the supernova remnant propagates (Hill & Zakamska, 2014). Given the extremely high-velocity coronal line components detected in the nuclear spectrum (Armus et al. 2022, in preparation), the AGN itself is likely driving the highly-ionized wind detected here in [Mg V], which deposits energy into the ISM via shocks in the W and NW regions where the dispersion of the warm molecular gas and the ratios are highest. It is somewhat surprising, given the location of the high dispersion H2 gas, that the NW spectrum is low in Figure 4 (left). However, this extraction region is large and partially intersects the inner edge of the ring, where the H2 is weak and the PAH is bright. Examining the individual pixels in this region indicates the ratio changes by a factor of eight as one moves from the upper right to lower left of this region. Therefore the area of maximum dispersion in the NW would indeed be located much higher in Figure 4, close to the position of region W, consistent with our simple model. A more detailed analysis of these regions will be performed in a subsequent paper using a spectral decomposition tool designed to produce accurate line ratio maps on finer scales.
5 Summary
In this Letter, we present new JWST MIRI MRS observations of NGC 7469 and focus on the analysis of the inner ISM region between the central AGN and the starburst ring. The high spatial- and spectral-resolution available with the new IFS capability of MIRI enables a detailed investigation of the rotational H2, low- and high-ionization fine structure lines, and dust features at mid-infrared wavelengths for the first time. We summarize our findings below.
-
•
The morphology of the low-ionization [Fe II] and [Ar II] lines are bright on the nucleus and in the starburst ring, showing several star-forming clumps and regions of enhanced emission. The H2, in contrast, is strongly peaked on the nucleus and surrounding ISM, and is relatively weak in the starburst ring.
-
•
The [Mg V] emission line is resolved, and shows a broad, blueshifted component that is likely associated with the coronal line outflow in NGC 7469. The blueshifted highly-ionized outflow traced by [Mg V], has a nearly face-on geometry that is strongly peaked on the nucleus, with an extension that reaches about 400 pc to the East. The [Mg V] gas has a median line-of-sight velocity km s-1 and reaches as high as km s-1 close to the AGN.
-
•
There are regions of enhanced velocity dispersion in H2 and [Fe II] 180 pc from the AGN that also feature excited ([Fe II])/(Pf) and ratios, most clearly seen to the N and W. We identify these regions as the locations where the outflow is depositing energy into the dense interstellar gas via shocks, between the nucleus and the starburst ring.
Such a detailed view of the mid-infrared gas dynamics within the central region of a dusty LIRG nucleus is made possible for the first time, fully demonstrating the high spatial- and spectral-resolution plus high-sensitivity integral-field capability of JWST.
Appendix A Fitting the Coronal Line
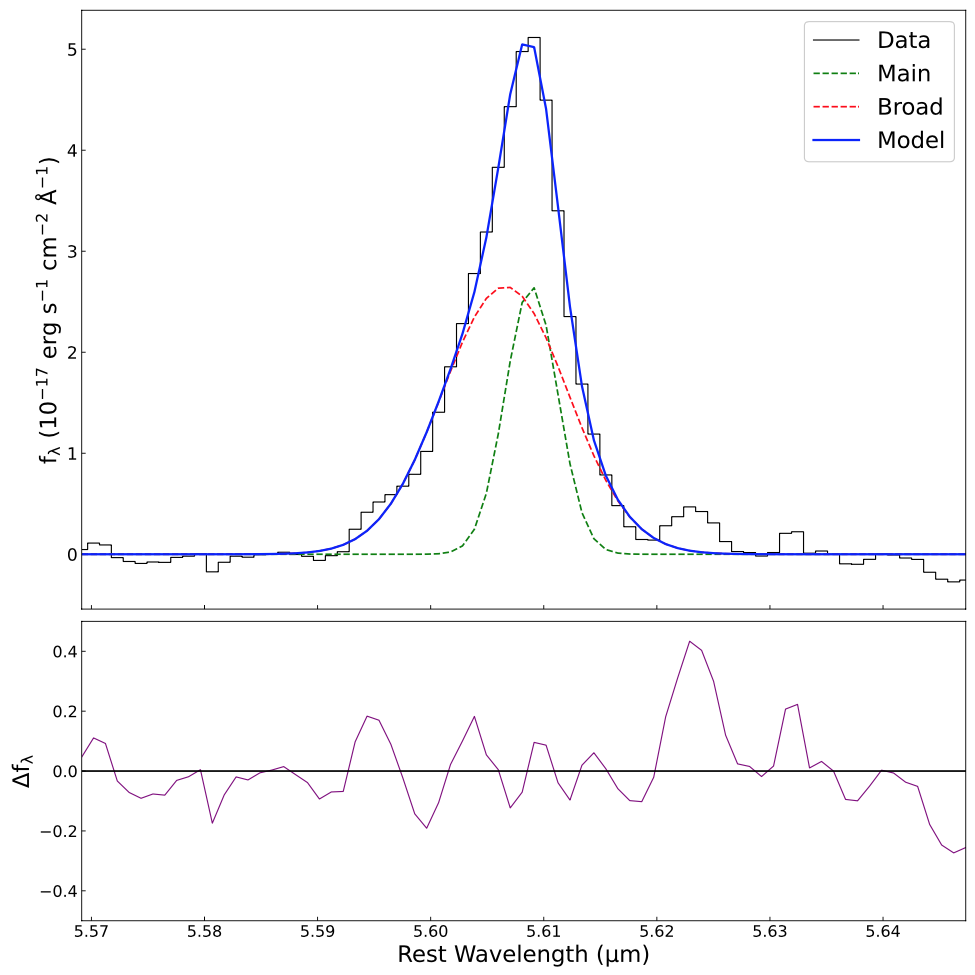
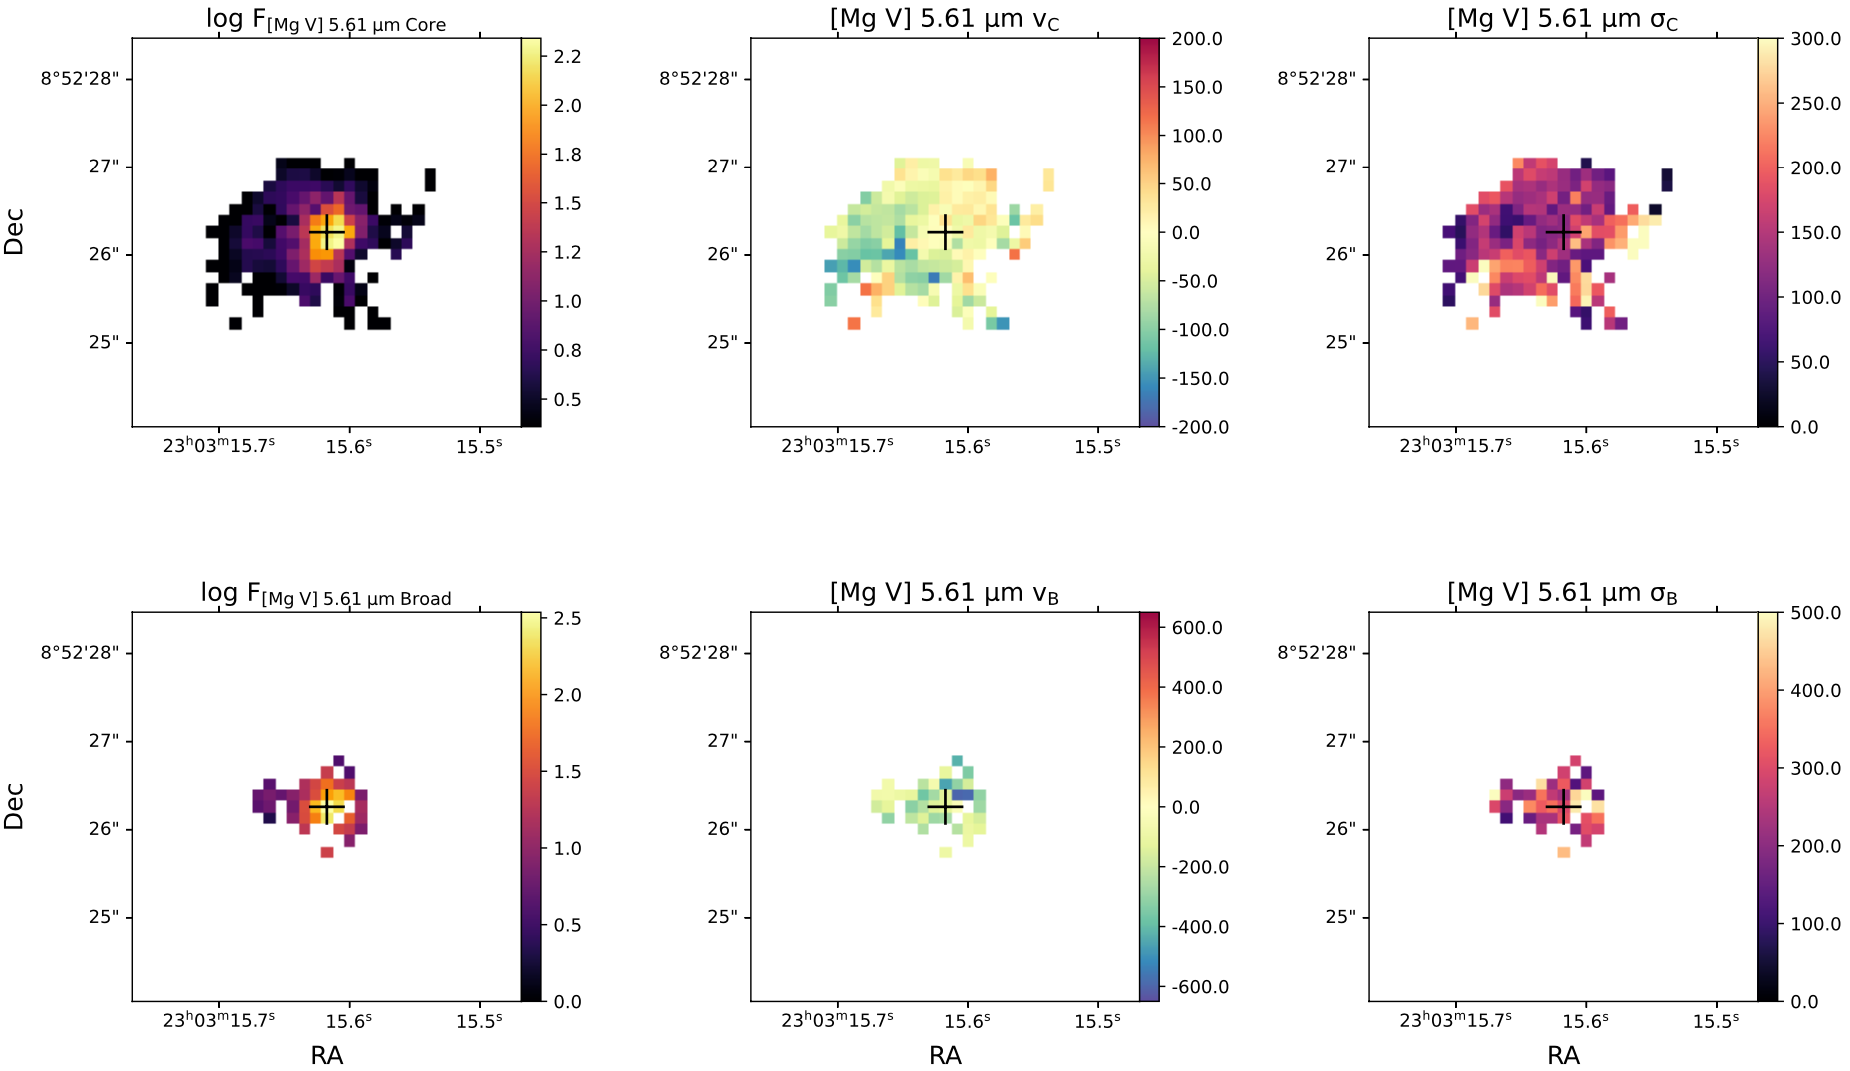
As mentioned in Section 2, we conduct an in-depth investigation of the coronal line [Mg V] over the entire Ch1 FOV using the BADASS (Sexton et al., 2021) software package. We fit one- and two-component Gaussian profiles to the line spaxel-by-spaxel (e.g. Figure A.1) and generate their resulting flux, velocity, and velocity dispersion maps (Figure A.2). The velocity dispersion maps have been corrected for instrumental broadening ( km s-1). The flux map of the secondary broad component of [Mg V] (bottom left panel of Figure A.2) is overplotted on NIRCam images as contours in Figure 3 to indicate the high-ionization outflow.
We note that this two-component spectral fitting was only applied to [Mg V] on a per-spaxel basis in this work to generate the moment maps. In a companion paper (Armus et al. 2022, in preparation), multi-component fitting is applied to all the emission lines in the full MIRI/MRS nuclear spectrum extracted from a small aperture on the AGN.
References
- Armus et al. (2020) Armus, L., Charmandaris, V., & Soifer, B. T. 2020, Nature Astronomy, 4, 467, doi: 10.1038/s41550-020-1106-3
- Armus et al. (2009) Armus, L., Mazzarella, J. M., Evans, A. S., et al. 2009, PASP, 121, 559, doi: 10.1086/600092
- Astropy Collaboration et al. (2013) Astropy Collaboration, Robitaille, T. P., Tollerud, E. J., et al. 2013, A&A, 558, A33, doi: 10.1051/0004-6361/201322068
- Astropy Collaboration et al. (2018) Astropy Collaboration, Price-Whelan, A. M., Sipőcz, B. M., et al. 2018, AJ, 156, 123, doi: 10.3847/1538-3881/aabc4f
- Blustin et al. (2007) Blustin, A. J., Kriss, G. A., Holczer, T., et al. 2007, A&A, 466, 107, doi: 10.1051/0004-6361:20066883
- Bohn et al. (2022) Bohn, T., Inami, H., Diaz-Santos, T., et al. 2022, arXiv e-prints, arXiv:2209.04466. https://arxiv.org/abs/2209.04466
- Bushouse et al. (2022) Bushouse, H., Eisenhamer, J., Dencheva, N., et al. 2022, spacetelescope/jwst: JWST 1.6.2, 1.6.2, Zenodo, doi: 10.5281/zenodo.6984366
- Cazzoli et al. (2020) Cazzoli, S., Gil de Paz, A., Márquez, I., et al. 2020, MNRAS, 493, 3656, doi: 10.1093/mnras/staa409
- Cluver et al. (2013) Cluver, M. E., Appleton, P. N., Ogle, P., et al. 2013, ApJ, 765, 93, doi: 10.1088/0004-637X/765/2/93
- Curran (2014) Curran, P. A. 2014, arXiv e-prints, arXiv:1411.3816. https://arxiv.org/abs/1411.3816
- Davies et al. (2004) Davies, R. I., Tacconi, L. J., & Genzel, R. 2004, ApJ, 602, 148, doi: 10.1086/380995
- De Breuck et al. (2014) De Breuck, C., Williams, R. J., Swinbank, M., et al. 2014, A&A, 565, A59, doi: 10.1051/0004-6361/201323331
- Díaz-Santos et al. (2007) Díaz-Santos, T., Alonso-Herrero, A., Colina, L., Ryder, S. D., & Knapen, J. H. 2007, ApJ, 661, 149, doi: 10.1086/513089
- Falstad et al. (2021) Falstad, N., Aalto, S., König, S., et al. 2021, A&A, 649, A105, doi: 10.1051/0004-6361/202039291
- Ferguson et al. (1997) Ferguson, J. W., Korista, K. T., & Ferland, G. J. 1997, ApJS, 110, 287, doi: 10.1086/312998
- Fernández-Ontiveros et al. (2019) Fernández-Ontiveros, J. A., López-Gonzaga, N., Prieto, M. A., et al. 2019, MNRAS, 485, 5377, doi: 10.1093/mnras/stz716
- Genzel et al. (1995) Genzel, R., Weitzel, L., Tacconi-Garman, L. E., et al. 1995, ApJ, 444, 129, doi: 10.1086/175588
- Guillard et al. (2012) Guillard, P., Ogle, P. M., Emonts, B. H. C., et al. 2012, ApJ, 747, 95, doi: 10.1088/0004-637X/747/2/95
- Higdon et al. (2006) Higdon, S. J. U., Armus, L., Higdon, J. L., Soifer, B. T., & Spoon, H. W. W. 2006, ApJ, 648, 323, doi: 10.1086/505701
- Hill & Zakamska (2014) Hill, M. J., & Zakamska, N. L. 2014, MNRAS, 439, 2701, doi: 10.1093/mnras/stu123
- Hollenbach & McKee (1989) Hollenbach, D., & McKee, C. F. 1989, ApJ, 342, 306, doi: 10.1086/167595
- Inami et al. (2013) Inami, H., Armus, L., Charmandaris, V., et al. 2013, ApJ, 777, 156, doi: 10.1088/0004-637X/777/2/156
- Izumi et al. (2020) Izumi, T., Nguyen, D. D., Imanishi, M., et al. 2020, ApJ, 898, 75, doi: 10.3847/1538-4357/ab9cb1
- Jones et al. (1996) Jones, A. P., Tielens, A. G. G. M., & Hollenbach, D. J. 1996, ApJ, 469, 740, doi: 10.1086/177823
- Krajnović et al. (2006) Krajnović, D., Cappellari, M., de Zeeuw, P. T., & Copin, Y. 2006, MNRAS, 366, 787, doi: 10.1111/j.1365-2966.2005.09902.x
- Labiano et al. (2021) Labiano, A., Argyriou, I., Álvarez-Márquez, J., et al. 2021, A&A, 656, A57, doi: 10.1051/0004-6361/202140614
- Lai et al. (2022) Lai, T. S. Y., Armus, L., U, V., et al. 2022, arXiv e-prints, arXiv:2209.06741. https://arxiv.org/abs/2209.06741
- Lambrides et al. (2019) Lambrides, E. L., Petric, A. O., Tchernyshyov, K., Zakamska, N. L., & Watts, D. J. 2019, MNRAS, 487, 1823, doi: 10.1093/mnras/stz1316
- Landt et al. (2008) Landt, H., Bentz, M. C., Ward, M. J., et al. 2008, ApJS, 174, 282, doi: 10.1086/522373
- Lim et al. (2022) Lim, P. L., O’Steen, R., Earl, N., et al. 2022, spacetelescope/jdaviz: v2.8.0, v2.8.0, Zenodo, doi: 10.5281/zenodo.6877878
- Marshall et al. (2007) Marshall, J. A., Herter, T. L., Armus, L., et al. 2007, ApJ, 670, 129, doi: 10.1086/521588
- Mattila et al. (2007) Mattila, S., Väisänen, P., Farrah, D., et al. 2007, ApJ, 659, L9, doi: 10.1086/516821
- McKee et al. (1984) McKee, C. F., Chernoff, D. F., & Hollenbach, D. J. 1984, in Astrophysics and Space Science Library, Vol. 108, Galactic and Extragalactic Infrared Spectroscopy, ed. M. F. Kessler & J. P. Phillips, 103–131, doi: 10.1007/978-94-009-7251-3_8
- Minsley et al. (2020) Minsley, R., Petric, A., Lambrides, E., et al. 2020, ApJ, 894, 157, doi: 10.3847/1538-4357/ab86a1
- Müller-Sánchez et al. (2011) Müller-Sánchez, F., Prieto, M. A., Hicks, E. K. S., et al. 2011, ApJ, 739, 69, doi: 10.1088/0004-637X/739/2/69
- Nguyen et al. (2021) Nguyen, D. D., Izumi, T., Thater, S., et al. 2021, MNRAS, 504, 4123, doi: 10.1093/mnras/stab1002
- Ogle et al. (2010) Ogle, P., Boulanger, F., Guillard, P., et al. 2010, ApJ, 724, 1193, doi: 10.1088/0004-637X/724/2/1193
- Oliva et al. (1989) Oliva, E., Moorwood, A. F. M., & Danziger, I. J. 1989, A&A, 214, 307
- Orienti & Prieto (2010) Orienti, M., & Prieto, M. A. 2010, MNRAS, 401, 2599, doi: 10.1111/j.1365-2966.2009.15837.x
- Peeters et al. (2004) Peeters, E., Spoon, H. W. W., & Tielens, A. G. G. M. 2004, ApJ, 613, 986, doi: 10.1086/423237
- Pereira-Santaella et al. (2022) Pereira-Santaella, M., Álvarez-Márquez, J., García-Bernete, I., et al. 2022, arXiv e-prints, arXiv:2208.04835. https://arxiv.org/abs/2208.04835
- Pérez-Torres et al. (2021) Pérez-Torres, M., Mattila, S., Alonso-Herrero, A., Aalto, S., & Efstathiou, A. 2021, A&A Rev., 29, 2, doi: 10.1007/s00159-020-00128-x
- Perrin et al. (2014) Perrin, M. D., Sivaramakrishnan, A., Lajoie, C.-P., et al. 2014, in Society of Photo-Optical Instrumentation Engineers (SPIE) Conference Series, Vol. 9143, Space Telescopes and Instrumentation 2014: Optical, Infrared, and Millimeter Wave, ed. J. Oschmann, Jacobus M., M. Clampin, G. G. Fazio, & H. A. MacEwen, 91433X, doi: 10.1117/12.2056689
- Petric et al. (2018) Petric, A. O., Armus, L., Flagey, N., et al. 2018, AJ, 156, 295, doi: 10.3847/1538-3881/aaca35
- Pontoppidan et al. (2022) Pontoppidan, K., Blome, C., Braun, H., et al. 2022, arXiv e-prints, arXiv:2207.13067. https://arxiv.org/abs/2207.13067
- Privon et al. (2020) Privon, G. C., Ricci, C., Aalto, S., et al. 2020, ApJ, 893, 149, doi: 10.3847/1538-4357/ab8015
- Rieke et al. (2015) Rieke, G. H., Wright, G. S., Böker, T., et al. 2015, PASP, 127, 584, doi: 10.1086/682252
- Riffel et al. (2021) Riffel, R. A., Dors, O. L., Armah, M., et al. 2021, MNRAS, 501, L54, doi: 10.1093/mnrasl/slaa194
- Robleto-Orús et al. (2021) Robleto-Orús, A. C., Torres-Papaqui, J. P., Longinotti, A. L., et al. 2021, ApJ, 906, L6, doi: 10.3847/2041-8213/abd32f
- Roussel et al. (2007) Roussel, H., Helou, G., Hollenbach, D. J., et al. 2007, ApJ, 669, 959, doi: 10.1086/521667
- Ruschel-Dutra & Dall’Agnol De Oliveira (2020) Ruschel-Dutra, D., & Dall’Agnol De Oliveira, B. 2020, danielrd6/ifscube: Modeling, v1.1, Zenodo, Zenodo, doi: 10.5281/zenodo.4065550
- Ruschel-Dutra et al. (2021) Ruschel-Dutra, D., Storchi-Bergmann, T., Schnorr-Müller, A., et al. 2021, MNRAS, 507, 74, doi: 10.1093/mnras/stab2058
- Sajina et al. (2022) Sajina, A., Lacy, M., & Pope, A. 2022, Universe, 8, 356, doi: 10.3390/universe8070356
- Sexton et al. (2021) Sexton, R. O., Matzko, W., Darden, N., Canalizo, G., & Gorjian, V. 2021, MNRAS, 500, 2871, doi: 10.1093/mnras/staa3278
- Song et al. (2021) Song, Y., Linden, S. T., Evans, A. S., et al. 2021, ApJ, 916, 73, doi: 10.3847/1538-4357/ac05c2
- Stierwalt et al. (2013) Stierwalt, S., Armus, L., Surace, J. A., et al. 2013, ApJS, 206, 1, doi: 10.1088/0067-0049/206/1/1
- Stierwalt et al. (2014) Stierwalt, S., Armus, L., Charmandaris, V., et al. 2014, ApJ, 790, 124, doi: 10.1088/0004-637X/790/2/124
- Swinbank et al. (2012) Swinbank, A. M., Smail, I., Sobral, D., et al. 2012, ApJ, 760, 130, doi: 10.1088/0004-637X/760/2/130
- U (2022) U, V. 2022, Universe, 8, 392, doi: 10.3390/universe8080392
- U et al. (2013) U, V., Medling, A., Sanders, D., et al. 2013, ApJ, 775, 115, doi: 10.1088/0004-637X/775/2/115
- U et al. (2019) U, V., Medling, A. M., Inami, H., et al. 2019, ApJ, 871, 166, doi: 10.3847/1538-4357/aaf1c2
- Väisänen et al. (2017) Väisänen, P., Reunanen, J., Kotilainen, J., et al. 2017, MNRAS, 471, 2059, doi: 10.1093/mnras/stx1685
- Veilleux et al. (2020) Veilleux, S., Maiolino, R., Bolatto, A. D., & Aalto, S. 2020, A&A Rev., 28, 2, doi: 10.1007/s00159-019-0121-9
- Wright (2006) Wright, E. L. 2006, PASP, 118, 1711, doi: 10.1086/510102
- Xu & Wang (2022) Xu, X., & Wang, J. 2022, arXiv e-prints, arXiv:2206.09602. https://arxiv.org/abs/2206.09602