Study of via Initial State Radiation at Belle
Abstract
Using of data collected on and around the resonances with the Belle detector at the KEKB collider, we measure the cross section of from threshold to via initial-state radiation. From a multi-parameter fit assuming exists in the final state according to previous measurement by BESIII, the resonant parameters of are determined to be (statistical and systematic errors, respectively), and, depending on the possible presence of interfering resonances, , , or . The branching fraction of decay is determined to be approximately 20%. Additionally, the branching fraction for is measured to be . However, there is no significant observed signal in the final states in this analysis, and correspondingly the upper limit for is determined to be either (for two fits), or (remaining two fits), at 90% confidence level.
pacs:
14.40.Gx, 13.25.Gv, 13.66.BcI Introduction
Quarkonium and quarkonium-like states play an important role in understanding Quantum Chromodynamics (QCD), which is the generally accepted theory for strong interactions between quarks and gluons. However, there are no first-principles methods to derive the spectrum and properties of hadrons from the QCD Lagrangian. Alternatively, the more phenomenological Quark Model is used comprehensively review . Although hadrons with multiple quarks (), with only gluons, or with bound hadrons, etc., are allowed according to QCD, only recently have accordant candidates been identified. Since the discovery of in 2003 by the Belle experiment x3872 , dozens of new states have been observed by Belle, BaBar, BESIII, CLEOc, LHCb, etc. However, these new states do not easily fit into the hadronic spectrum derived from the Quark Model, indicating that new types of hadrons may have already been observed. For example, the charged charmonium-like states, such as z3900 , z4020 and z4055 , are generally interpreted as exotic states.
Hadronic transitions have contributed significantly to the discoveries of quarkonium(-like) states, such as the in via initial-state radiation (ISR) by the BaBar experiment babay4260 . In searching for an version of the , the (now called ‘’) was discovered in via ISR by BaBar y2175_babar , and later confirmed by Belle y2175_belle . There are several interpretations of the , such as a regular meson phi_2d ; phi_3s , an hybrid phi_ssg , a tetraquark state tetra_1 ; tetra_2 ; tetra_3 , a bound state bound_1 ; bound_2 ; bound_3 ; bound_4 , an -wave threshold effect threshold , or a three-meson system phikk . In a recent lattice QCD calculation lattice-qcd , the properties of the lowest two states comply with those of and , but with no obvious correspondence to the . In searching for in other hadronic transitions, BaBar studied the process via ISR using a data sample and found several hundreds of signal events, among which hints of an excess were observed around etaphi_babar . Assuming these hints correspond to bound state, BaBar estimated the mass , width and product of the partial width times branching fraction . (Hereinafter, quoted uncertainties are statistical systematic, respectively.) The CMD-3 experiment measured the process from 1.59 to and found it is dominated by the contribution, and then calculated the contribution to the anomalous magnetic moment of muon: , etaphi_cmd3 . Recently, BESIII measured with a data sample taken at center of mass (CM) energies () ranging from to and observed a resonance near with a statistical significance exceeding etapphi . If both of these correspond to decays of the , one could infer the ratio , which is smaller than the prediction of hybrid models by several orders of magnitude. However, due to limited statistics, the uncertainty in from BaBar is large. BESIII also measured the Born cross section of and determined the parameters to be , , and or etaphi_bes3 . The signal significance of is determined to be . In that analysis, BESIII used, as input, the cross section of below (dominated by the signal) measured by BaBar etaphi_babar in the determination of the resonant parameters.
In this article, we report a study of the process via ISR with the Belle detector Belle at the KEKB asymmetric-energy collider KEKB . The integrated luminosity used in this analysis is , of which 70% were collected at the resonance, with the remainder accumulated either at the other resonances or at lower than the resonances by tens of . This data sample is much larger than the one used in the previous analysis etaphi_babar . We scan the final state over the energy interval from to , which also covers the signal regions for and . The well improved precision of the cross section of will be helpful to calculated the alpha_mu . The is reconstructed from its decay to final state, and the is reconstructed from its decay to either the or final states.
II The Belle Detector and Monte Carlo (MC) simulation
The Belle detector is a large-solid-angle magnetic spectrometer consisting of a silicon vertex detector, a 50-layer central drift chamber, an array of aerogel threshold Cherenkov counters, a barrel-like arrangement of time-of-flight scintillation counters, and an electromagnetic calorimeter (ECL) comprised of CsI(Tl) crystals located inside a superconducting solenoid coil that provides a 1.5T magnetic field. An iron flux return located outside of the coil is instrumented to detect mesons and to also identify muons. With the origin of the coordinate system defined as the nominal interaction point, the axis is aligned with the direction opposite the beam and is parallel to the direction of the magnetic field within the solenoid. The axis is vertical upward, and the axis is horizontal and completes the right-handed coordinate frame. The polar angle and azimuthal angle are measured relative to the positive and axes, respectively.
The phokhara event generator phokhara is used to simulate the process via ISR for optimization of selection criteria and the efficiency estimation. One or more ISR photons () are emitted before forming a resonance , which then decays to with and or . In the generator, the resonance could be , , or a particle with mass fixed to a value between 1.6 and and width fixed to zero. Since the dominates the final states, we use the MC sample of as the nominal signal MC sample. A GEANT3-based MC simulation geant3 is used to simulate the Belle detector response.
III Event selection criteria
To study the final states, a candidate is reconstructed from a pair and an candidate is reconstructed in either the or () modes. Hereinafter, the reconstruction channel with is called the “ mode”, and the three-pion mode is referred to as the “ mode.” For a candidate event, we require two (four) well-measured charged tracks with zero net charge for the () mode. A well-measured charged track is defined as one having impact parameters with respect to the interaction point satisfying in the plane and in the plane, respectively. For each charged track, information from different detector subsystems is combined to form a likelihood for each putative particle species () pid . Tracks with are identified as kaons, while those with are identified as pions, with an efficiency of about 95% for separation.
Each photon candidate is a cluster in the ECL that is unmatched to the extrapolated trajectories of any charged tracks. The photon with the highest energy is identified to be . In the reconstruction of candidates, the energy of a photon candidate is required to have in the barrel () and in the endcaps (). The mass resolution is about , and the signal region of the is defined to be with (the value returned for the mass fit to each candidate). Events with conversions are removed by requiring for the tracks from decays. In this case, the particle identification variable for electron/positron in conversion products is defined as ). In the reconstruction of , two photon candidates are required, each with energy satisfying and , where the subscript () signifies the lower (higher) energy photon in the laboratory system. The efficiency of the energy requirement is (statistical error only), as determined from signal MC simulation.
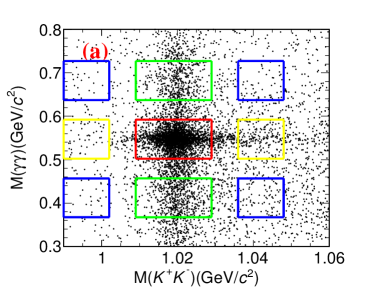
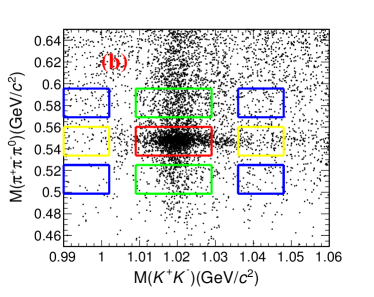
The scatter plots displaying the dikaon () invariant mass versus the invariant mass (), or the invariant mass () are shown in Fig. 1. A pair is treated as a candidate if (the mass resolution is ), where is the nominal mass PDG . This mass interval requirement for the retains of candidates in data and in the signal MC simulation, respectively. The lower and upper mass sidebands are defined to be and . A fit to the or distribution with a Gaussian function for the signal, and a smooth second-order polynomial function for background yields a mass resolution of in the mode and in the mode. We define the signal mass interval by , and the sideband regions are defined by , where is the nominal mass PDG . The central (surrounding) rectangles of Fig. 1 show the signal (sideband) regions. With , and representing the sum of the events in the two adjacent horizontal () and vertical () sideband boxes, and () the four diagonal sideband boxes relative to the signal box, the normalization of the two-dimensional (2D) sidebands is given by , where and are the appropriate areal scale factors, according to the and distributions. These 2D sidebands are used to estimate the background level in the signal region.
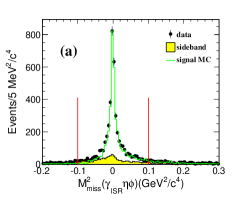
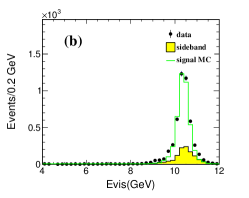
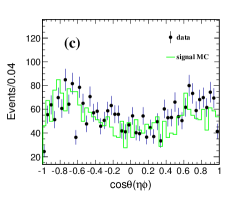
For most of the ISR events, the missing mass squared of the reconstructed , , and candidates () is close to zero, consistent with either complete reconstruction or a low-energy, second ISR photon eluding detection (Fig. 2(a)). We also require with a mass-selection efficiency of in the mode and in the mode. Figures 2(b) and (c) illustrate the good agreement between data and signal MC simulations for the distributions of visible energy of all final state photons and charged particles (), as well as the polar angle of the system in the CM frame (), confirming that the signal events are produced via ISR.
IV Invariant mass spectrum of from ISR production
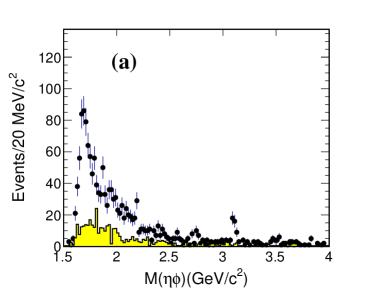
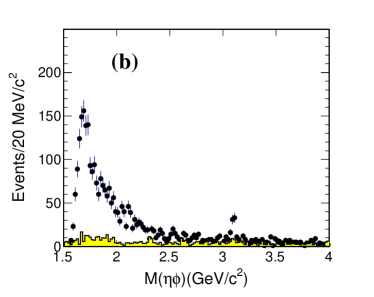
After imposing the selection criteria, the distributions of the invariant mass () from the two modes are shown in Fig. 3, together with the backgrounds estimated from the scaled 2D sidebands. Using for the mode and for the mode, the mass resolution of is about . The number of obtained signal events is about seven times larger than the previous work etaphi_babar , although there is not an obvious signal.
There are clear signals in both the mode and the mode. Performing an unbinned maximum likelihood fit to the combined spectrum of the two modes, with a Gaussian function for the signals and a second-order polynomial function for the backgrounds. The signal yield is . To estimate the fitting systematic error, polynomial functions of either first- or third-order are also used for the background parameterization. The branching fraction for the decay is calculated using
| (1) |
where , , , are the integrated luminosity of the Belle data sample, the detection efficiency, the branching fraction, and the combined branching fraction for the and final states PDG , respectively; is the cross section for production via ISR for the Belle experiment y2175_belle . With systematic uncertainties as described below in Sec. VI, the branching fraction of is measured to be , which agrees well with the world average value of PDG .
We observe a clear signal in the final state. However, the is not as prominent as in the previous BESIII etaphi_bes3 analysis. An unbinned maximum likelihood fit is performed to the mass spectra using signal candidate events and 2D sideband events, simultaneously. Similar to the parametrization in BaBar’s measurement etaphi_babar , the parametrization for the cross section of at takes the form
| (2) |
where is the phase space of the final state, describes the non-resonant contribution (mainly due to the tails of resonances below threshold), and () is the () amplitude. The resonance amplitude is described by a Breit-Wigner (BW) function
| (3) |
where , and are the mass, the total width and the partial width to for the , respectively. is the branching fraction for and is the relative phase. As shown in BaBar’s measurement etaphi_babar , several major decays of contribute to , such as and . Since , the phase space effect of can not be ignored in describing . Therefore, we take the form as in Ref etaphi_babar :
| (4) | |||||
Here, is the phase space of the decay. The other decays of are neglected, and their phase space dependence correspondingly ignored. Since both the and the contain a vector meson () and a pseudoscalar meson (), the phase takes the form
| (5) |
Since there is no measurement of the final state in this work, we take directly from Ref. etaphi_babar .
The is described by
| (6) |
where is the -wave Blatt-Weisskopf form factor and () is the breakup momentum corresponding to the ().
The efficiencies of the signal selection are determined from MC samples generated in the range , and are found to be roughly constant (1.35%) over this mass interval. The effective integrated luminosity of ISR is calculated according to the theoretical prescription from kuraev , corresponding to per near and increasing to about per near . The 2D sideband events from , and are described by three Landau functions; exponential functions are considered to estimate the systematic uncertainty.
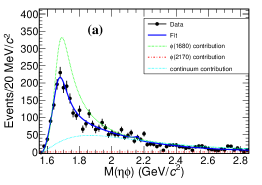
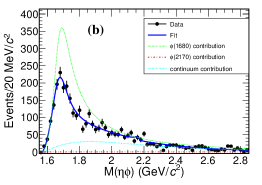
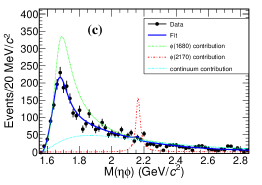
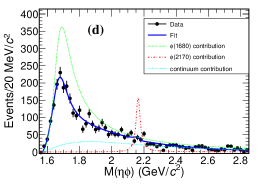
Assuming the existence of in the final state, and fitting using the mass and width of reported by BESIII etaphi_bes3 , there are four solutions of equivalent quality, having the same and . The fit results are shown in Fig. 4 and Table 1. The reduced chi-squared of the fit to the spectrum is . The resonant parameters are determined to be , , and , , or for the four solutions. The branching fraction obtained from the fit is , , or for the four solutions. The statistical significance of is determined to be by comparing the value of and the change in the number of free parameters in the fits, where is the likelihood with and without . The quantity is determined to be , , or in the four solutions. The upper limit for production at 90% confidence level (C.L.) is determined by integrating the likelihood versus the yield, with the upper limit degraded by a factor of to account for systematic uncertainties. (The systematic uncertainties in the fit results and are described below in Sec. VI.) Finally, the upper limits for are determined to be (Solutions I and II), or (Solutions III and IV) at confidence level, respectively. Since the is not significant in our measurement, another fit without in Eq. 2 is performed, as also indicated in Table 1. There is no obvious difference in quality between the curves from fits with or without .
| Parameters | with | without | ||||
| Solution I | Solution II | Solution III | Solution IV | Solution I | Solution II | |
| 77/56 | 85/60 | |||||
| — | ||||||
| — | ||||||
| — | ||||||
| — | ||||||
V Cross section for
The distributions in Fig. 3 are combined and the cross section of for each bin is calculated according to
| (7) |
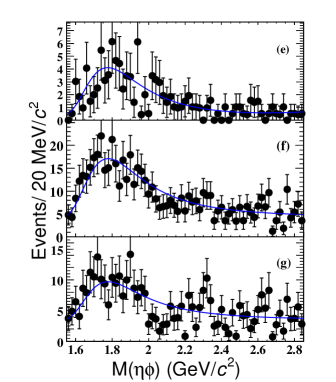
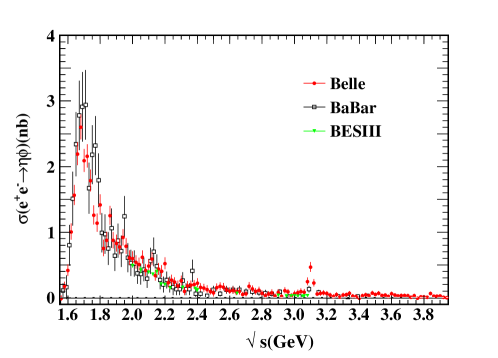
where is the -th bin of the combined distribution and is the -th decay mode; , , , , and are the number of events observed in data, the number of background events estimated from the 2D sidebands, the efficiency of signal selection, the effective integrated luminosity of ISR production in Belle data, and the branching fractions of and decays PDG , respectively. The cross sections for measured with Belle data are shown in Fig. 5, where the error bars include the statistical uncertainties and the systematic uncertainties in the background estimation using the 2D sidebands. A 6.7% common uncertainty (described in Sec. VI and Table 2) is not shown in Fig. 5. The cross sections for are around and at the and peaks, respectively. The measured cross section is in good agreement with the results from BaBar’s measurement etaphi_babar , but with improved precision.
VI Systematic uncertainties
The following systematic uncertainties are characterized for this analysis. The uncertainties due to the particle identification are 2.0% in the mode and 4.0% in , respectively. The uncertainty due to the tracking efficiency is 0.35% per track and is additive; the uncertainty in the photon reconstruction is 2% per photon. The uncertainties in the mass, mass, and requirements are measured with the control sample ; for the mass window is taken as a conservative uncertainty for the combined and modes. For the mass window, the corresponding value is . Similarly, is taken to be a conservative systematic uncertainty estimate, due to the requirement.
Belle measures luminosity with 1.4% precision while the uncertainty of the generator phokhara is less than 1% phokhara . The trigger efficiencies for the events surviving the selection criteria are for the mode and for the mode according to the trigger simulation. Conservative uncertainties of 1.0% and 1.5% are taken to be the systematic uncertainties in the trigger efficiencies for the mode and modes y2175_belle ; etajpsi_belle . The uncertainties in the and branching fractions are calculated according to the world average values PDG , which contribute a systematic uncertainty of 0.6%. The statistical uncertainty in the MC determination of the efficiency is 0.1%.
Assuming all these sources are independent and adding them in quadrature, the total systematic uncertainties in measuring are 7.9% for the mode and 7.2% for the mode. There are some common uncertainties related to detection efficiency in the two modes, as listed in Table 2. For other uncertainties that have no correlation between two modes, these are first summed in quadrature to obtain . Then the total independent uncertainty () is calculated by , where equal to , is th mode of decays (). The value of is calculated by ( designates each common uncertainty mentioned above), and the total systematic uncertainty in the cross section measurement thereby calculated to be 6.8%.
By changing the fit range to , the systematic uncertainty due to the fit range is found to be negligible. To estimate the model dependence of the non-resonant contribution, we use . The uncertainties in backgrounds from the 2D sidebands are estimated by changing or by , and changing the functions used to parameterize them, as mentioned in Sec. IV. Systematic uncertainties in the cross section resulting from different sideband background parameterizations are also shown in Fig. 5; these translate to uncertainties in the number of signal events of 1.8% in the mode and 1.5% in the mode. The uncertainty in is obtained by varying according to the previous measurement etaphi_babar .
| Source | mode | mode | common |
| Particle identification | 2.0 | 4.0 | 2.0 |
| Tracking | 0.7 | 1.4 | 0.7 |
| Photon reconstruction | 6.0 | 6.0 | 6.0 |
| , masses and | 1.7 | 1.4 | 1.4 |
| Luminosity | 1.4 | 1.4 | 1.4 |
| Generator | 0.5 | 0.5 | 0.5 |
| 1.0 | 1.0 | 1.0 | |
| Trigger | 1.5 | 1.0 | … |
| Branching fractions | 0.6 | 0.6 | 0.6 |
| signal fitting | 1.8 | 1.5 | … |
| MC statistics | 0.1 | 0.1 | 0.1 |
| Sum for | 6.9 | 7.3 | 6.7 |
| Sum for | 7.2 | 7.9 | 6.8 |
VII Summary
In summary, the cross sections are measured from threshold to . The branching fraction of is measured to be , which is in good agreement with the world average value PDG . There are four solutions with the same fit quality but different phase angles, obtained from fitting the invariant mass distributions of and including both and . The resonant parameters of are obtained to be , , and , , or for the four solutions. The branching fraction for is determined to be , , or for the four solutions. We do not find a significant signal in the Belle data, and instead set an upper limit on its production of or at 90% C.L.; both are consistent the BESIII measurement etaphi_bes3 .
Acknowledgements.
We thank the KEKB group for the excellent operation of the accelerator; the KEK cryogenics group for the efficient operation of the solenoid;References
- (1) For a recent review, see S. L Olsen, T. Skwarnichi and D. Zieminska, Rev. Mod. Phys., 90, 015003 (2018).
- (2) S. Choi et al. (Belle Collaboration), Phys. Rev. Lett. 91, 262001 (2003).
- (3) M. Ablikim et al. (BESIII Collaboration), Phys. Rev. Lett. 110, 252001 (2013); Liu et al. (Belle Collaboration), Phys. Rev. Lett. 110, 252002 (2013).
- (4) M. Ablikim et al. (BESIII Collaboration), Phys. Rev. Lett. 111, 242001 (2013).
- (5) X. L. Wang et al. (Belle Collaboration), Phys. Rev. D 91, 112007 (2015); M. Ablikim et al. (BESIII Collaboration), Phys. Rev. D 96, 032004 (2017).
- (6) B. Aubert et al. (BaBar Collaboration), Phys. Rev. Lett. 95, 142001 (2005).
- (7) B. Aubert et al. (BaBar Collaboration), Phys. Rev. D 74, 091103 (2006).
- (8) C. P Shen et al. (Belle Collaboration), Phys. Rev. D 80, 031101 (2009).
- (9) G. J. Ding and M. L. Yan, Phys. Lett. B 657, 49 (2007); Q. Li et al arXiv: 2004.05786.
- (10) T. Barnes, N. Black and P. R. Page, Phys. Rev. D 68, 054014 (2003).
- (11) G. J. Ding and M. L. Yan, Phys. Lett. B 650, 390 (2007).
- (12) P. R. Page, E. S. Swanson and A. P. Szczepaniak Phys. Rev. D 59, 034016 (1999).
- (13) Z. G. Wang, Nucl. Phys. A 791, 106 (2007).
- (14) H. X. Chen, X. Liu, A. Hosaka and S. L. Zhu, Phys. Rev. D 78, 034012 (2008).
- (15) E. Klemp and A. Zaitsev, Phys. Rep. 454, 1 (2007).
- (16) C. F. Qiao, Phys. Lett. B 639, 263 (2006).
- (17) Y. Dong, A. Faessler, T. Gutsche, Q. Lu, and V. E. Lyubovitskij, Phys. Rev. D 96, 074027 (2017).
- (18) Y. L. Yang, D. Y. Chen and Z. Lu Phys. Rev. D 100, 073007 (2019).
- (19) S. L. Zhu, Int. J. Mod. Phys. A E17, 283 (2008).
- (20) A. M. Torres, K. P. Khemchandani, L. S. Geng, M. Napsuciale and E. Oset, Phys. Rev. D 78, 074031 (2008).
- (21) Y. H. Ma, Y. Chen, M. Gong and Z. F. Liu, arXiv:2007.14893v1.
- (22) B. Aubert et al. (BaBar Collaboration), Phys. Rev. D 76, 092005 (2007); B. Aubert et al. (BaBar Collaboration), Phys. Rev. D 77, 092002 (2008).
- (23) V. L. Ivanov et al., Phys. Lett. B 798, 134946 (2019).
- (24) M. Ablikim et al. (BESIII Collaboration), Phys. Rev. D 102, 012008 (2020).
- (25) M. Ablikim et al (BESIII Collaboration), Phys. Rev. D 104, 032007 (2021).
- (26) A. Abashian et al. (Belle Collaboration), Nucl. Instrum. Methods Phys. Res. Sect. A 479, 117 (2002); also see detector section in J.Brodzicka et al., Prog. Theor. Exp. Phys. 2012, 04D001 (2012).
- (27) S. Kurokawa and E. Kikutani, Nucl. Instrum. Methods Phys. Res. Sect. A 499, 1 (2003), and other papers included in this Volume; T.Abe et al., Prog. Theor. Exp. Phys. 2013, 03A001 (2013) and references therein.
- (28) A. Keshavarzi, D. Nomura and T. Teubner, Phys. Rev. D 97, 114025 (2018).
- (29) G. Rodrigo et al., Eur. Phys. J. C 24, 71 (2002). For a review on the generator, see: S. Actis et al., Eur. Phys. J. C 66, 585 (2010).
- (30) R. Brun et al., GEANT 3.21, CERN DD/EE/84-1, 1984.
- (31) E. Nakano, Nucl. Instrum. Methods A 494, 402 (2002).
- (32) P.A. Zyla et al. (Particle Data Group), Prog. Theor. Exp. Phys. 2020, 083C01(2020) and 2021 update.
- (33) E. A. Kuraev and V. S. Fadin, Sov. J. Nucl. Phys. 41, 466 (1985) [Yad. Fiz. 41, 733 (1985)].
- (34) X. L. Wang et al. (Belle Collaboration), Phys. Rev. D 87, 051101 (2013).