Probing hadronic interaction models with the hybrid data of the Pierre Auger Observatory
Jakub Vícha1 for the Pierre Auger Collaboration2
1 Institute of Physics of the Czech Academy of Sciences
2 Observatorio Pierre Auger, Av. San Martín Norte 304, 5613 Malargüe, Argentina
vicha@fzu.cz
spokespersons@auger.org, https://www.auger.org/archive/authors_2022_05.html
![[Uncaptioned image]](/html/2209.00744/assets/TIFR.png) 21st International Symposium on Very High Energy Cosmic Ray Interactions (ISVHE- CRI 2022)
21st International Symposium on Very High Energy Cosmic Ray Interactions (ISVHE- CRI 2022)
Online, 23-28 May 2022
10.21468/SciPostPhysProc.?
Abstract
Presently large systematic uncertainties remain in the description of hadronic interactions at ultra-high energies and a fully consistent description of air-shower experimental data is yet to be reached. The amount of data collected by the Pierre Auger Observatory using simultaneously the fluorescence and surface detectors in the energy range eV has provided opportunity to perform a multi-parameter test of model predictions. We apply a global method to simultaneously fit the mass composition of cosmic rays and adjustments to the simulated depth of shower maximum, and hadronic signal at ground level. The best description of the hybrid data is obtained for a deeper scale of simulated depth of shower maximum than predicted by hadronic interaction models tuned to the LHC data. Consequently, the deficit of the simulated hadronic signal at ground level, dominated by muons, is alleviated with respect to the unmodified hadronic interaction models. Because of the size of the adjustments to simulated depth of shower maximum and hadronic signal and the large number of events in the sample, the statistical significance of these assumed adjustments is large, greater than 5, even for the combination of the systematic experimental shifts within 1 that are the most favorable for the models.
1 Problems of Models of Hadronic Interaction
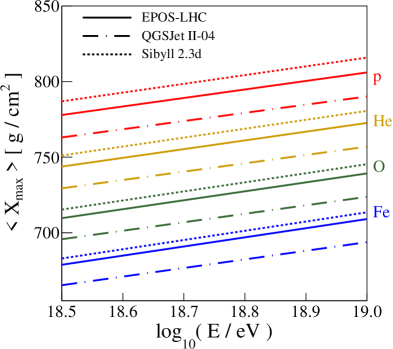
The current models of hadronic interactions (HI models) are known to have problems consistently describing both the ground signals and the longitudinal shower development [1, 2, 3] using the hybrid data of the surface detectors (SD) and fluorescence detectors (FD) at the Pierre Auger Observatory [4]. The ground signal predicted by Monte Carlo (MC) simulation is found lower than measured, with an indication of increasing with energy when the results of more experiments are combined [5]. All these tests of HI models are based on the assumption that the scale of depth of shower maximum () predicted by a given HI model is correct. However, at the energy eV, the uncertainties on the predicted scale, , are larger than about one third of the difference between the two extremes - protons and iron nuclei, see the differences between the three HI models, Epos-lhc [6], Qgsjet II-04 [7], Sibyll 2.3d [8] on the left panel of Fig. 1, see also [9].
2 Extended Testing of Hadronic Interaction Models
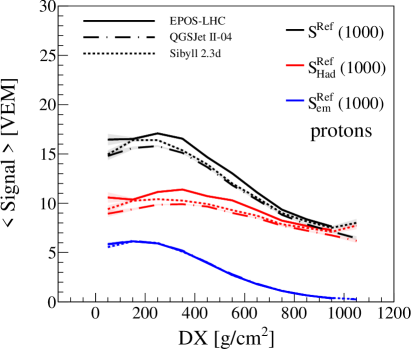
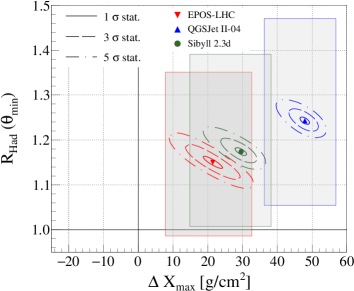
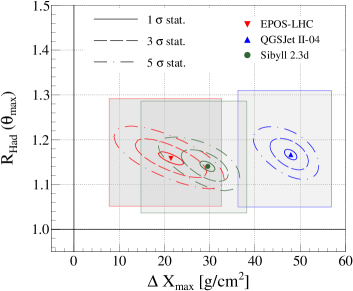
In this work, we consider a more complex test of the HI models in the energy range . This test is motivated by the differences observed in the predictions obtained with HI models for and hadronic part of the total ground signal at 1000 m from the shower core at the Pierre Auger Observatory, see Fig. 1. These differences are approximately primary and energy independent. The differences in the hadronic signals are (zenith-angle) dependent. These features suggest to leave both and free in the fitting procedure.
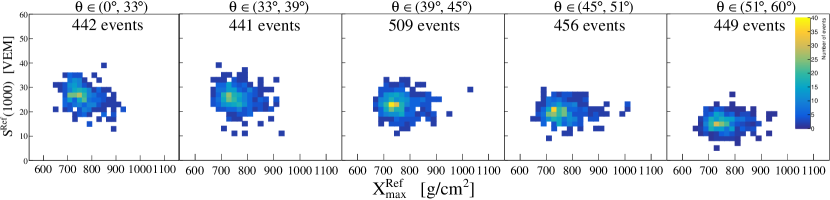
We fit simultaneously five two-dimensional distributions of measured and , see Fig. 2, that are corrected for their energy evolution to a reference energy , see [10] for more details. The influence of changing scale on is incorporated in the method. Implicitly, the nearly model-independent information on mass composition from the correlation between and , see [11], is naturally incorporated in the method.
3 Results of the Test
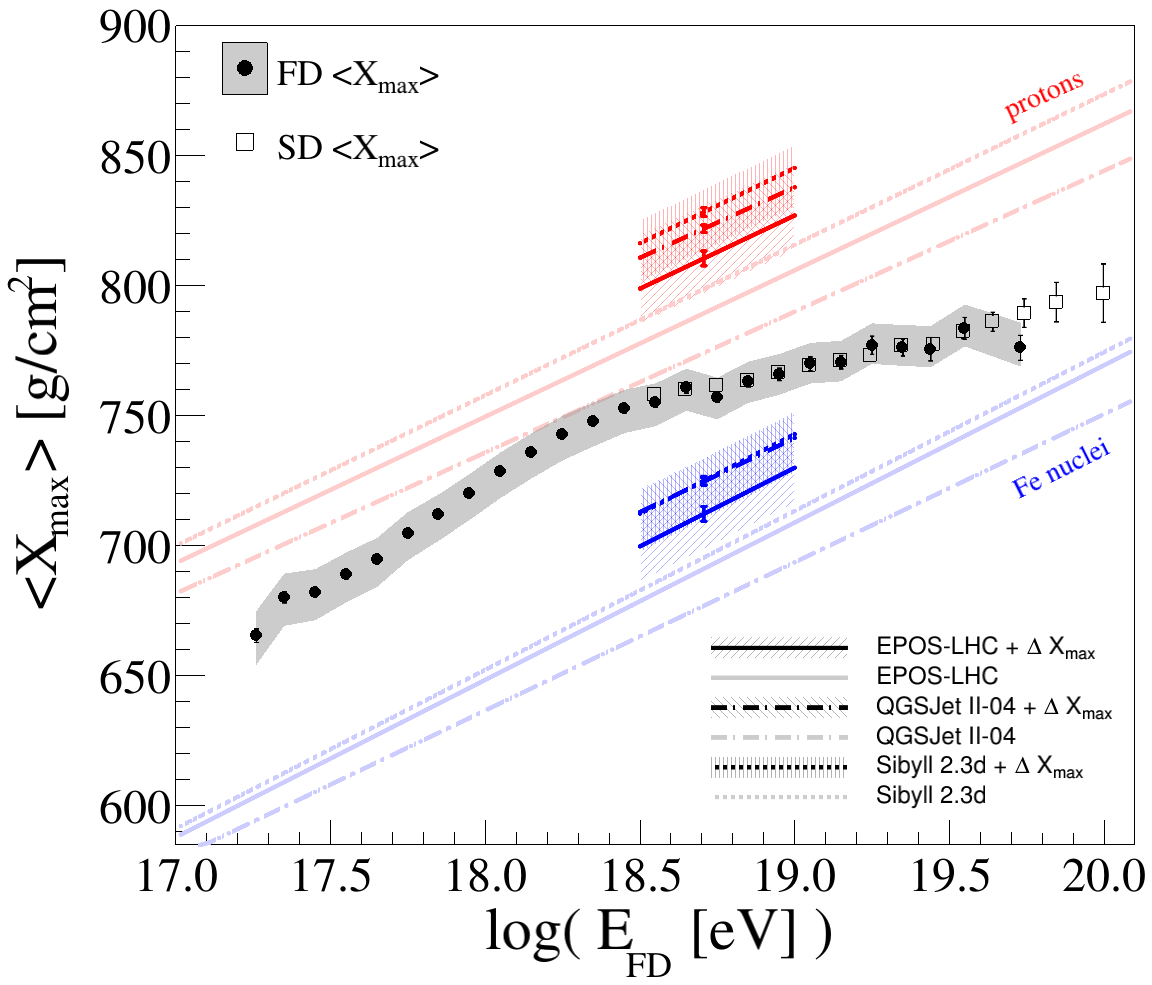
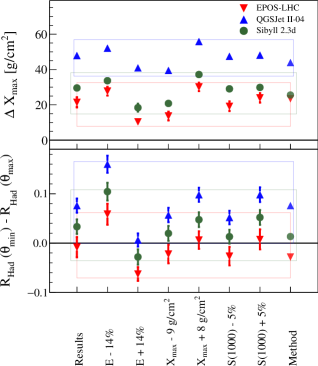
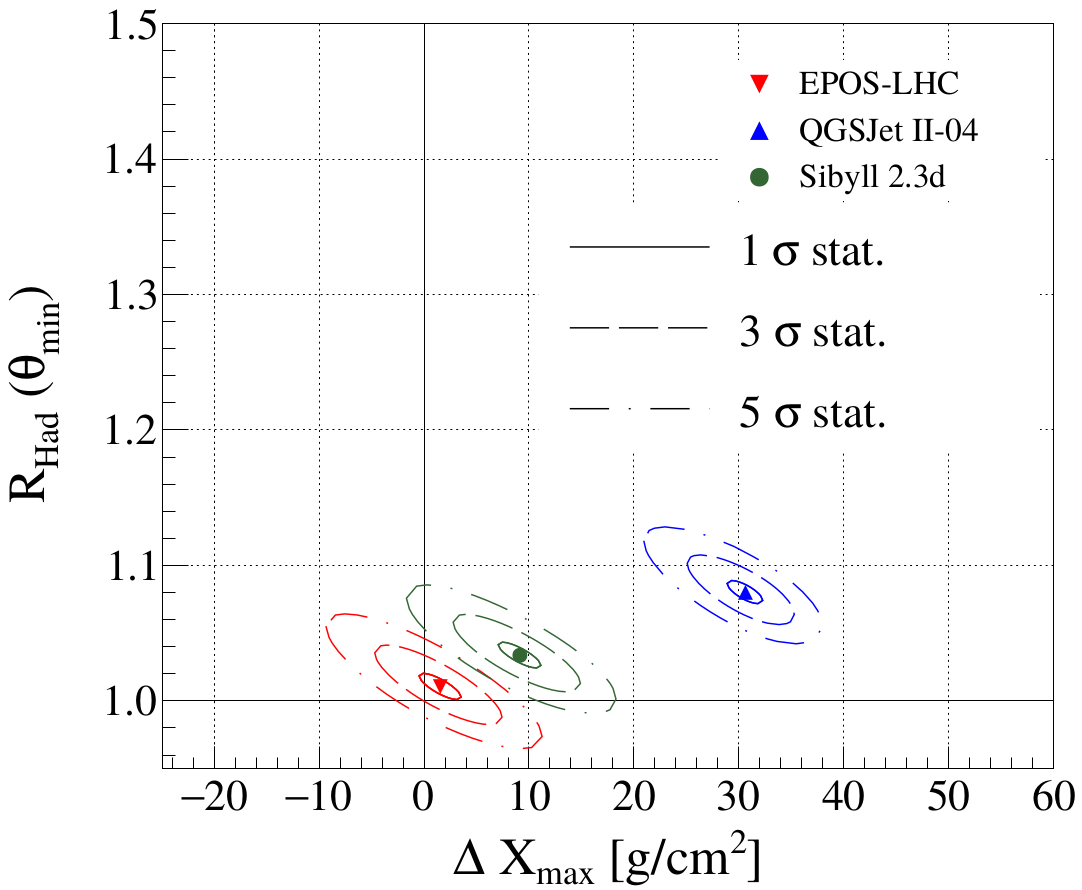
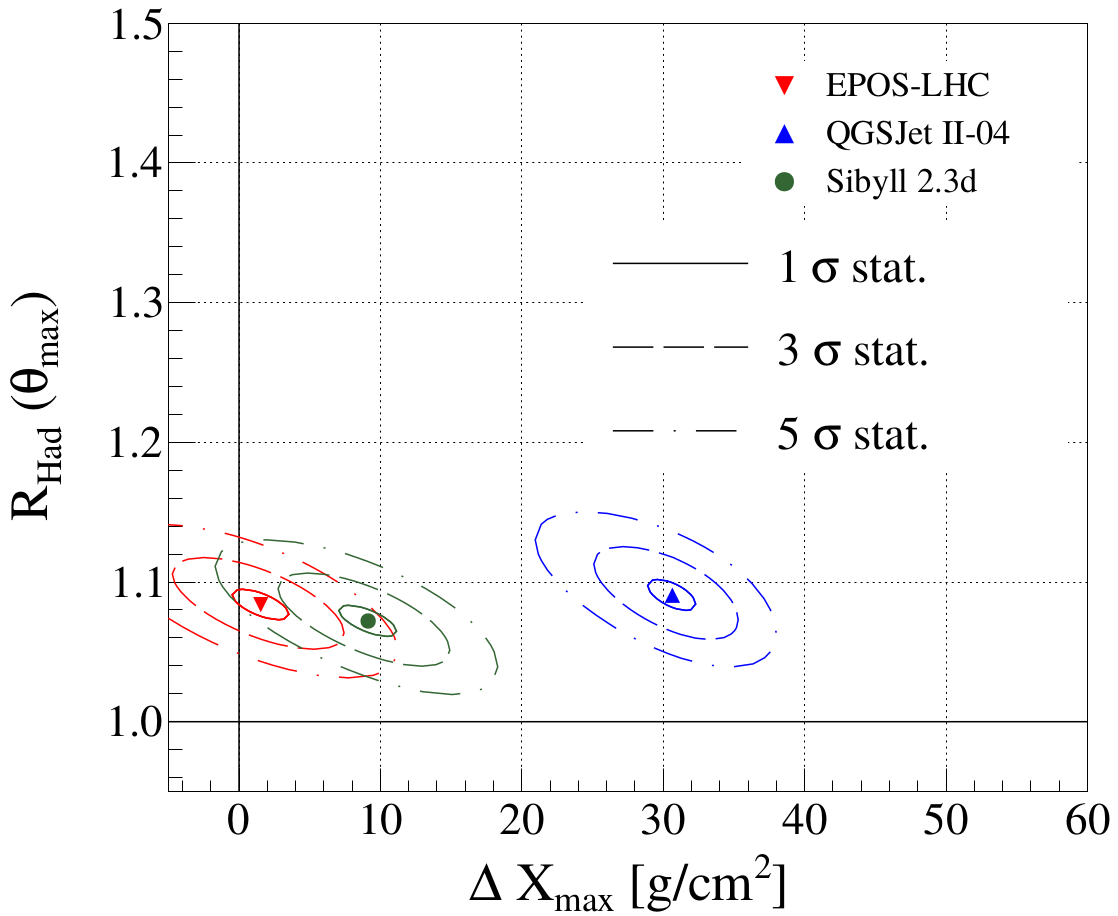
The best description of the hybrid data of the Pierre Auger Observatory is obtained modifying the MC templates by shifting by a parameter and rescaling the hadronic component at two extreme zenith angles by factors and as shown in Fig. 3 with statistical and systematic errors. The overall description of the five two-dimensional distributions by the fits is achieved with -value 2.6% for Epos-lhc, 3.6% for Qgsjet II-04, and 18.0% for Sibyll 2.3d based on detailed MC-MC tests.
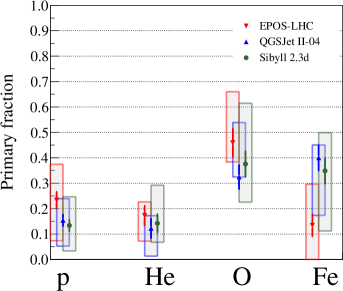
The optimum description of the data is achieved for a deeper scale than predicted by HI models, see also left panel of Fig. 4. Consequently, heavier mass composition and smaller rescaling of the hadronic component is obtained than using previous tests [1] and mass composition fits [12].
Systematic Uncertainties
We have identified four dominant sources of systematic uncertainties influencing our results. Three are related to the experimental uncertainties on the measurement of energy (), of ( g/cm2) and of (). We consider also the uncertainty stemming from the MC-MC tests of the method. The total uncertainty is summed in quadrature and is plotted in Fig. 3 with shaded boxes. The individual systematic contributions to and differences in the two fitted are shown in the right panel of Fig. 4. The size of systematic uncertainty on the energy scale does not allow us to draw any conclusion about the muon spectrum from the differences.
Significance of Data/MC Inconsistency
We perform a scan in all possible combinations of the experimental systematic uncertainties and calculate the statistical significance as
| (1) |
where , and are the statistical uncertainties of the fit for , and , respectively.
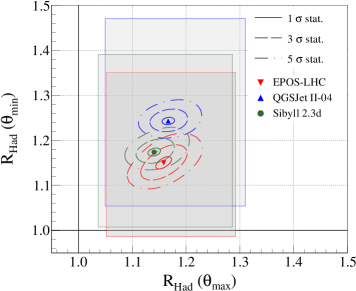
Even for the most favourable combination of the systematic uncertainties that minimizes the significance value is still above 5. This example is shown in Fig. 5.
4 Conclusions
The combined measurements of cosmic-rays with energies between and using the SD and FD of the Pierre Auger Observatory provide event statistics large enough to apply a novel method to test HI models. This method introduces three adjustments to the air-shower observables predicted by the HI models and simultaneously fits the fractions of four primary particles. The results of the method are in tension with the HI models Epos-lhc, Sibyll 2.3d and Qgsjet II-04 by more than 5 with much higher significance in case of the Qgsjet II-04. The best description of the data is obtained when the scale of the MC predictions is deeper by about 20 g/cm2, 30 g/cm2 and 50 g/cm2 for Epos-lhc, Sibyll 2.3d and Qgsjet II-04, respectively. Consequently, the differences between the HI models in the fitted mass composition fractions are decreased and the mass composition is heavier than obtained using the unmodified predictions of the three HI models. For such heavier mass composition, the "muon problem" of the HI models is alleviated with respect to the previous studies, observing 15-25% deficit of the hadronic component of simulated ground signal for all the three studied HI models.
Acknowledgements
This work is supported by the Czech Republic grants of MEYS CR: , , , , .
References
- [1] A. Aab et al., Testing Hadronic Interactions at Ultrahigh Energies with Air Showers Measured by the Pierre Auger Observatory, Phys. Rev. Lett. 117, 192001 (2016), 10.1103/PhysRevLett.117.192001.
- [2] A. Aab et al., Muons in air showers at the Pierre Auger Observatory: Mean number in highly inclined events, Phys. Rev. D 91, 032003 (2015), 10.1103/PhysRevD.91.032003.
- [3] A. Aab et al., Direct measurement of the muonic content of extensive air showers between and eV at the Pierre Auger Observatory, Eur. Phys. J. C 210, 751 (2020), 10.1140/epjc/s10052-020-8055-y.
- [4] A. Aab et al., The Pierre Auger Cosmic Ray Observatory, Nucl. Instrum. Methods Phys. Res. A 798, 172 (2015), doi.org/10.1016/j.nima.2015.06.058.
- [5] J. Albrecht et al., The Muon Puzzle in cosmic-ray induced air showers and its connection to the Large Hadron Collider, Astrophysics and Space Science 367, 27 (2022), 10.1007/s10509-022-04054-5.
- [6] T. Pierog et al., EPOS LHC: Test of collective hadronization with data measured at the cern large hadron collider, Phys. Rev. C 92, 034906 (2015), 10.1103/PhysRevC.92.034906.
- [7] S. Ostapchenko, Monte Carlo treatment of hadronic interactions in enhanced Pomeron scheme: QGSJET-II model, Phys. Rev. D 83, 014018 (2011), 10.1103/PhysRevD.83.014018.
- [8] F. Riehn et al., Hadronic interaction model sibyll 2.3d and extensive air showers, Phys. Rev. D 102, 063002 (2020), 10.1103/PhysRevD.102.063002.
- [9] R. Abbasi and G. Thomson, Uncertainty from Extrapolation of Cosmic Ray Air Shower Parameters, In Proceedings, Ultra-High Energy Cosmic Rays 2016, p. 011015, 10.7566/JPSCP.19.011015 (2018).
- [10] J. Vícha for the Pierre Auger Collaboration, Adjustments to Model Predictions of Depth of Shower Maximum and Signals at Ground Level using Hybrid Events of the Pierre Auger Observatory, In Proc., 37th International Cosmic Ray Conference, PoS(ICRC2021)310, 10.22323/1.395.0310 (2021).
- [11] A. Aab et al., Evidence for a mixed mass composition at the ‘ankle’ in the cosmic-ray spectrum, Physics Letters B 762, 288 (2016), 10.1016/j.physletb.2016.09.039.
- [12] J. Bellido for the Pierre Auger Collaboration, Depth of maximum of air-shower profiles at the Pierre Auger Observatory: Measurements above 1017.2 eV and Composition Implications, In Proc., 35th International Cosmic Ray Conference, PoS(ICRC2017)506, 10.22323/1.301.0506 (2018).
- [13] A. Yushkov for the Pierre Auger Collaboration, Mass composition of cosmic rays with energies above eV from the hybrid data of the Pierre Auger Observatory, In Proc., 36th International Cosmic Ray Conference, PoS(ICRC19)482, 10.22323/1.358.0482 (2019).
- [14] C. J. T. Peixoto for the Pierre Auger Collaboration, Estimating the Depth of Shower Maximum using the Surface Detectors of the Pierre Auger Observatory, In Proc., 36th International Cosmic Ray Conference, PoS(ICRC19)440, 10.22323/1.358.0440 (2019).