Radon variation measurements at the Yangyang underground laboratory
Abstract
The concentration of radon in the air has been measured in the 700 m-deep Yangyang underground laboratory between October 2004 and May 2022. The average concentrations in two experimental areas, called A6 and A5, were measured to be 53.40.2 and 33.50.1 , respectively. The lower value in the A5 area reflects the presence of better temperature control and ventilation. The radon concentrations sampled within the two A5 experimental rooms’ air are found to be correlated to the local surface temperature outside of the rooms, with correlation coefficients and . Therefore, the radon concentrations display a seasonal variation, because the local temperature driven by the overground season influences air ventilation in the experimental areas. A fit on the annual residual concentrations finds that the amplitude occurs each year on August, 31 6 days.
I Introduction
The materials comprising our universe are predominantly radiationless dark components of a nature that is not adequately understood. Based on astrophysical observations, it has been determined that 26% of all energy is formed by this so-called dark matter Aghanim et al. (2020). Theoretically, the composition of dark matter often modeled as various particles beyond the Standard Model Zwicky (1937); Workman and Others (2022), wherein a weakly interacting massive particle (WIMP) is one of the most frequently considered candidates Lee and Weinberg (1977). Searches for WIMPs are being conducted by a number of groups using a variety of experimental approaches Schumann (2019); Gaskins (2016); Kahlhoefer (2017); Aprile et al. (2022); Aalbers et al. (2022). One of these involve attempts to measure the energy deposited by nuclear recoils from WIMP interactions in the material of low-background detectors.
To date, no unambiguous evidence for WIMP–nucleus interactions has been reported, other than an annual modulation of residual events that cannot be explained by known background sources and has been interpreted by some authors as a signal of the yearly changes in the direction of the Earth’s orbital motion in a galactic halo of dark-matter WIMPs Bernabei et al. (2018); Freese et al. (2013). On the other hand, other, more mundane sources of modulations, such as cosmic-ray muon induced reactions, or radon concentrations in the air of the laboratory environment have been suggested and studied Davis (2014); Blum (2011); Tiwari et al. (2017); Adamson et al. (2013); McKinsey (2018). As part of these studies, measurements of the time dependence of the radon concentration are essential.
Radon is produced as a daughter nuclei decay product from the radioactive nuclides in the material of the surrounding tunnel walls. Specifically, this material contains traces of uranium and thorium that are the primary sources of radon. For example, 222Rn (t1/2=3.82 days) is generated from the 238U decay chain and, being an inert gas, it can deposit onto the surfaces of detector materials. Its decay products such as 210Pb (t1/2=22.2 years) and 210Bi (t1/2=5.0 days) decay by emitting a beta particle which can act as background sources at low energies while the other daughter elements like 210Po (t1/2=138.4 days) produces an alpha particle and a nuclear recoil which can affect region of interest in rare decay experiments. Also, when the radon decays into its daughter isotopes, several gamma rays are produced and can contribute to the background spectrum of the dark matter data. Much effort has been made to understand the radon production mechanism and its mitigation in rare decay experiments especially at the underground laboratory environment Pronost et al. (2018); Liu et al. (2018); Pérez-Pérez et al. (2022); Hodák et al. (2019); Murra et al. (2022); Akerib et al. (2020).
The Yangyang underground laboratory hosts two dark matter experiments and one neutrinoless double-beta decay experiment and, since 2004, the underground radon level with both custom-designed and commercially available detectors has been monitored. In this note, we report on the long-term variations in the radon level that is based on an analysis of these measurements.
II Materials and Methods
II.1 Experimental sites at Yangyang underground laboratory
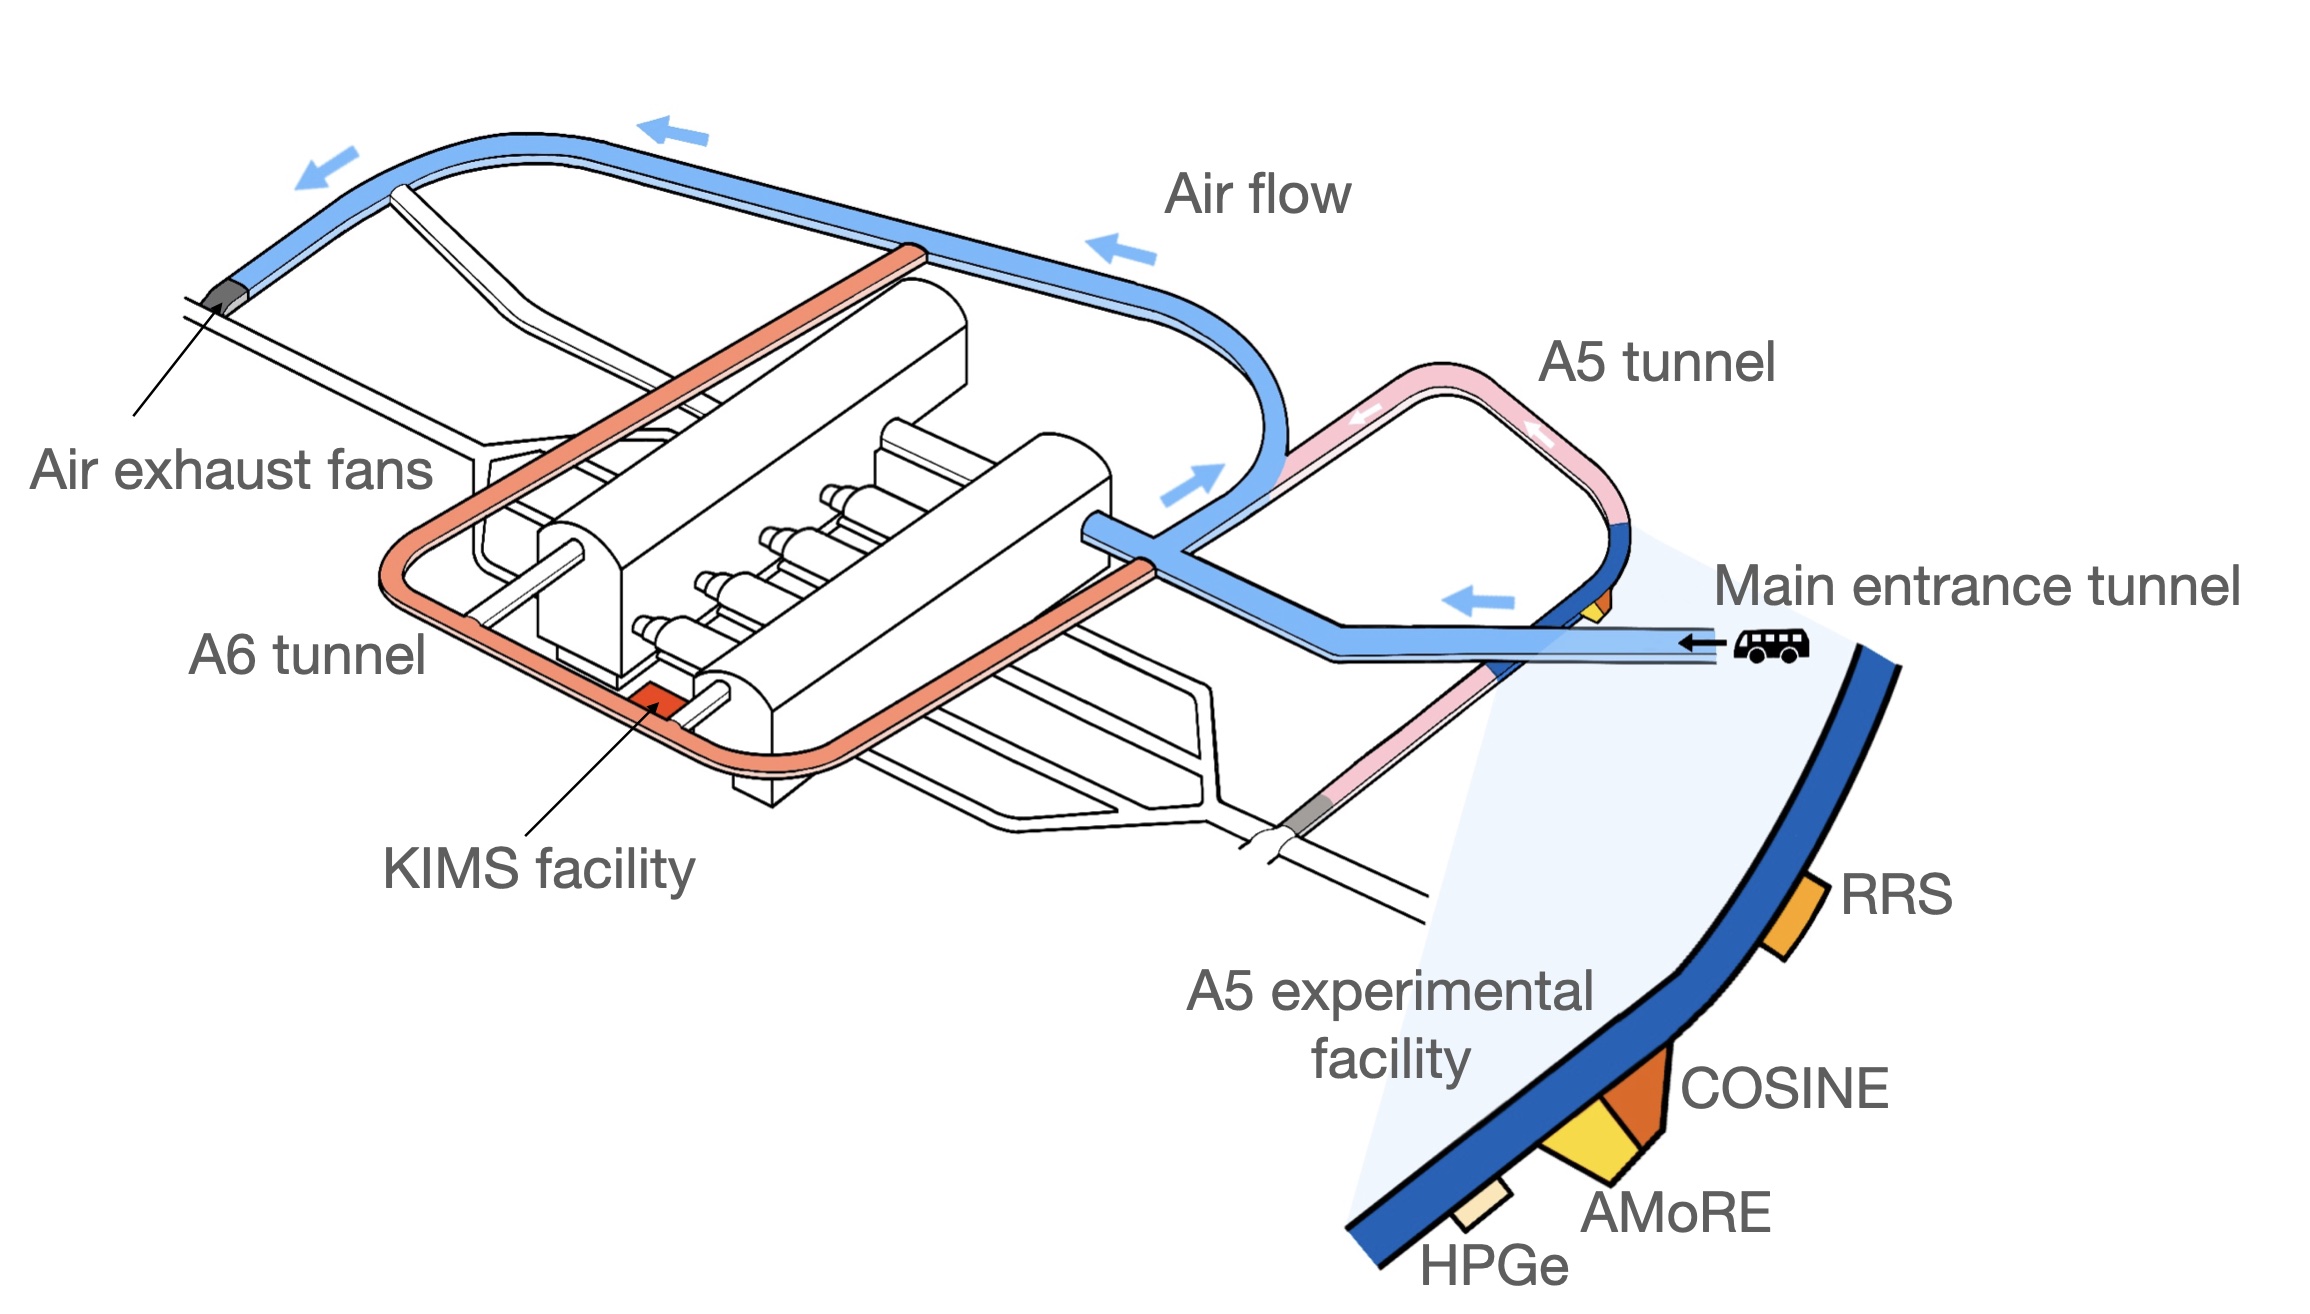
The Yangyang underground laboratory (Y2L) is located adjacent to the underground generator of the Yangyang pumped water plant in east Korea. The plant contains the main access tunnel with auxiliary tunnels, named as A5 and A6, that house the experimental facilities. Fresh air from the surface enters the tunnels through the main ramp way and is pumped out via a separate duct. The power plant operates at minimum two exhaust fans continuously, each with 63000 m3/h capacity. This exchanges the entire air volume of the 2.2 km-long main tunnel and auxiliary spaces once every 40 minutes. Throughout the year, the temperature inside the tunnel is maintained between 22 ∘C and 26 ∘C, and the relative humidity in the areas surrounding the laboratory is kept in the ranges of 60–70%. The minimum granite overburden in these areas is 700 m (1800 meter-water-equivalent depth) and the cosmic-ray muon fluxes at A5 and A6 (two are situated 300 m apart horizontally) are measured to be Prihtiadi et al. (2018, 2021) and Zhu et al. (2005), respectively. The subterranean rock is primarily composed of gneiss that contains 2.1 ppm and 13.0 ppm of uranium and thorium, respectively, as measured by an inductively coupled plasma mass spectrometry Lee et al. (2011).
The Korea Invisible Mass Search (KIMS) experiment Lee et al. (2006) in the A6 tunnel operated a CsI (Tl) crystal array to search for dark matter for over 15 years, and it is currently used for R&D activities associated with the development of ultralow-background crystals. The COSINE-100 experiment Adhikari et al. (2018a, b) uses NaI(Tl) crystals and is currently operating in the A5 experimental space. In addition, other experiments, including a search for neutrinoless double-beta decay experiment (called AMoRE-I) Alenkov et al. (2019) and a high-purity Germanium array (HPGe) Leonard et al. (2021) are operating in other rooms situated in the A5 tunnel. The A5 area is equipped with a radon reduction system (RRS) that supplies radon-filtered air to each experimental room as required. While the RRS is providing radon-reduced air with a flow of 140 m3/h to an experimental room, the measured radon level is 10 to 100 times lower than that of the room air (Since 2015, Ateko system (www.ateko.cz) has been operating at A5 and the specified reduction is a factor 1000 or more.).
Since the A6 tunnel area is separated from the main tunnel by doors, the air flow rate is somewhat restricted. In contrast, the entrance of the A5 tunnel is always open and the tunnel is equipped with its own air supply system that provides relatively robust air circulation. The system supplies the main tunnel air to the end of the A5 tunnel using two 2300 m3/h fans which exchange the branch tunnel air once every hour. A schematic drawing of the Y2L arrangement with the locations of the A5 and A6 areas indicated is provided in Fig. 1.
The COSINE-100 experiment is housed in an environmentally regulated room with controlled humidity and temperature. Its detection room has a floor area of and a ceiling height of . The air control system maintains the room temperature at and relative humidity at . The air in the room is continuously circulated through a HEPA filter, and the number of dust particles larger than is maintained below 1500 per cubic foot. The room air is sampled by a radon detector. These environmental parameters in the experimental room and in the tunnel are monitored online. The details of experimental control are described in Kim et al. (2022).
II.2 Radon Counter Setup
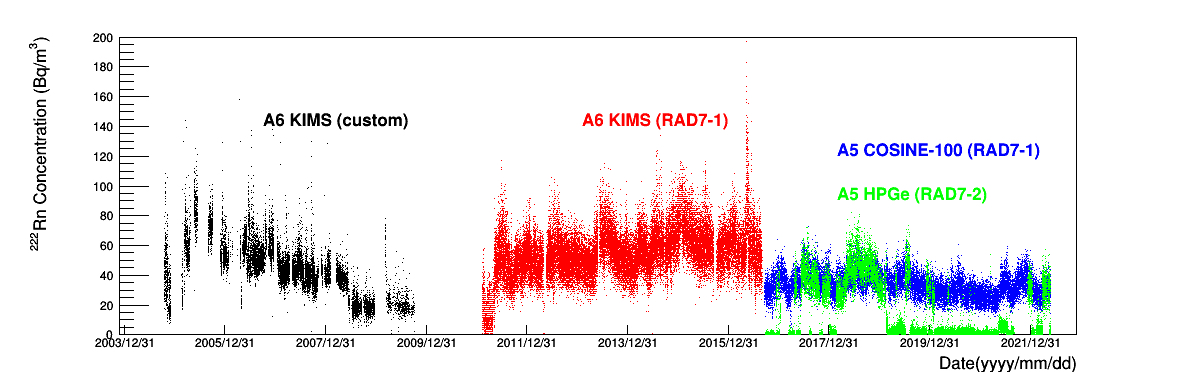
Since 2004, a custom-design radon detector measured the radon concentration at the A6 KIMS detector room. The detector consisted of 69.3 liters of a chamber for air sampling and a 900 mm2 silicon PIN diode for an alpha particle sensor on which an ionized Polonium isotope can attach and decay Lee et al. (2011). In 2011, this detector was replaced with a commercially available detector from Durridge company (RAD7-1) dur (2022). In 2016, the RAD7-1 detector was moved to the COSINE-100 detector room, where it has been functioning ever since. Another commercial counter (RAD7-2, the same model as RAD7-1) was installed in the HPGe detector room in 2016. In the RAD7 devices, a silicon diode sensor is located at the center a drift chamber with an applied electric field. When a 222Rn nucleus decays inside the drift chamber, it produces a positively charged 218Po ion that drifts to and sticks on the surface of the diode’s sensitive area. Within a few minutes, the 218Po nucleus decays into a 214Pb nuclei and an alpha particle, and the alpha particle produces an energy in the diode. The rate per unit volume for these signals reflects the mother 222Rn isotope concentration in the drift chamber air volume. The specified RAD7 detection limit is at 4 Bq/m3. In this way, the total radon level in the room air is measured every two hours and the recorded data are transmitted to a slow monitoring server, as displayed in Fig. 2.
The RAD7 detectors have been cross-calibrated at various locations and cross-checked with a separate custom-made detector, including a commercial ion chamber detector (RadonEye rad (2022)). All these tests yielded consistent results and the RAD7 detectors did not exhibit any abnormal behavior as long as the desiccants were regularly replaced to maintain a stable humidity-level inside the chamber. This new custom detector is the same type and the same dimension as the original A6 KIMS radon counter and is under testing and development phase. The 70 L chamber is made of stainless steel and the sensor uses Hamamatsu Si PIN photodiode (S3204-9, mm2), HV divider, and preamplifier (Hamamatsu H4083). When the RRS output air is directly connected to this custom radon detector, the concentration was measured to be 26.15.6 mBq/m3 which is more than a factor of 1000 reduction.
II.3 Data collection
During the 4762 days of the total operating period between October 2004 and May 2022, radon data were acquired in three distinct periods. At the A6 lab, The KIMS custom-made detector operated for 5 years until October 2009. Those data are reported in Ref. Lee et al. (2011), for which a prescale factor of 10 was applied. After a 16 month period of no measurements, the RAD7-1 detector was installed at the same location. In September 2016, the RAD7-1 detector was moved to the A5 COSINE-100 room for data acquisition. In a similar timeframe, we operated another detector—RAD7-2 in the HPGe room at A5. Overall, the RAD7 detectors were operated continuously with a short dead times that were primarily caused by power outages in the tunnel. The analyses reported here use all of the acquired data.
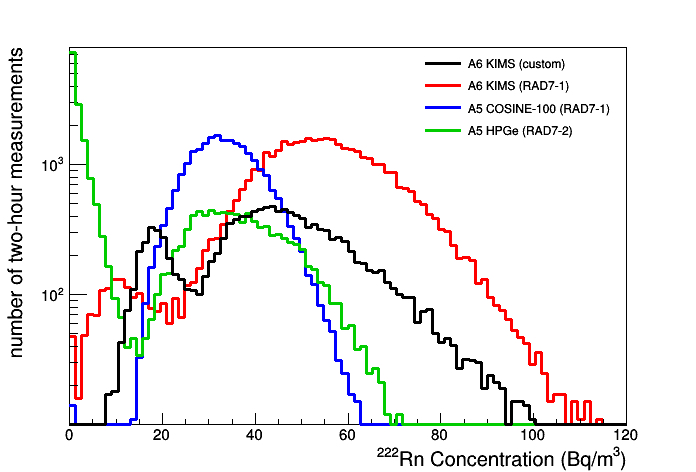
The 222Rn concentration (in Becquerel per cubic meter) is displayed in Figure 2 as a function of the date for all acquired data. In particular, four distinct measurements were acquired for roughly five years and are correspondingly color-coded. As listed in Table 1, the average concentrations were at the level of 1 pCi/L (=37 Bq/m3) at A5, which is relatively low compared to measured levels at other underground labs without RRS operating Pronost et al. (2018); Liu et al. (2018); Pérez-Pérez et al. (2022); Hodák et al. (2019). From late 2008 to late 2010, the temporal variations that occurred in the A6 ventilation system provided increased airflow in that area, which caused lower concentration in that period. The fundamental reason for the occasional short-term spikes in the data is because periods of increased caused by inadequate maintenance of the chamber air desiccant. The detector specified 5 % accuracy at normal humidity levels dur (2022). The distributions of radon concentrations were fitted with a Gaussian function and the fit means and sigmas are obtained. Their statistical uncertainties are obtained as one unit increase from minimum value by a parameter scan against values. The distributions are illustrated in Fig. 3.
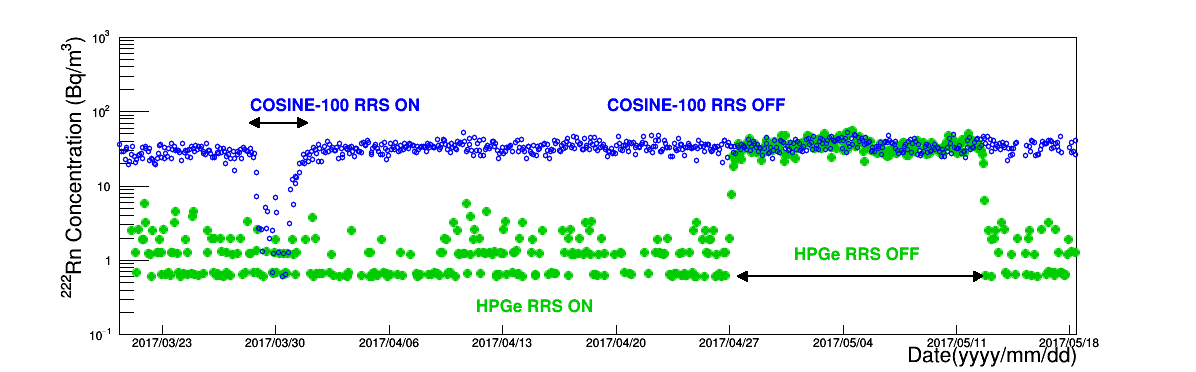
In the case of supplying radon-reduced air into one of the experimental rooms, the radon level sampled by the RAD7 counters is typically reduced to a few Bq/m3. The RRS air was supplied for a short period (less than a week) in the COSINE-100 room when the NaI(Tl) crystal detector installation and special maintenance occur. For the HPGe room and the AMoRE-I room, the RRS air is supplied for more often and longer time span. When the RRS air is supplied for the COSINE-100 detector room, the 222Rn level drops as low as 0.6 Bq/m3 and similarly for the HPGe room. When RRS is stopped, the measured concentration in RAD7-2 (HPGe) show the consistent results as the RAD-1 (COSINE-100) measurements shown in Fig. 4.
The measurement locations, detector type, periods, and measured radon concentrations are summarized in Table 1.
| Counter Type | Period | Fit Mean (Bq/m3)[ Fit Sigma ] | Live days |
|---|---|---|---|
| A6-KIMS Custom | 2004.10.18–2009.10.05 | [ ] | 847 |
| A6-KIMS RAD7-1 | 2011.02.14–2016.09.01 | [ ] | 1872 |
| A5-COSINE-100 RAD7-1 | 2016.09.23–2022.05.27 | [ ] | 2043 |
| A5-HPGe RAD7-2 | 2016.09.28–2022.05.27 | [] | 1845 |
III Results
With the acquired data, we performed analyses among the measurements in terms of their daily concentrations and as a function of time. The daily concentration measured at A5 was 33.50.1 Bq/m3, which was less than that of A6 by 37%. The A6 tunnel is a both-end closed space with minimal airflow, whereas the entrance of the A5 tunnel is one-ended, with air circulation that is superior to that in A5. Additionally, the spread of the measurements is 7.90.1 Bq/m3, and much less than 13.90.3 Bq/m3 for A6.
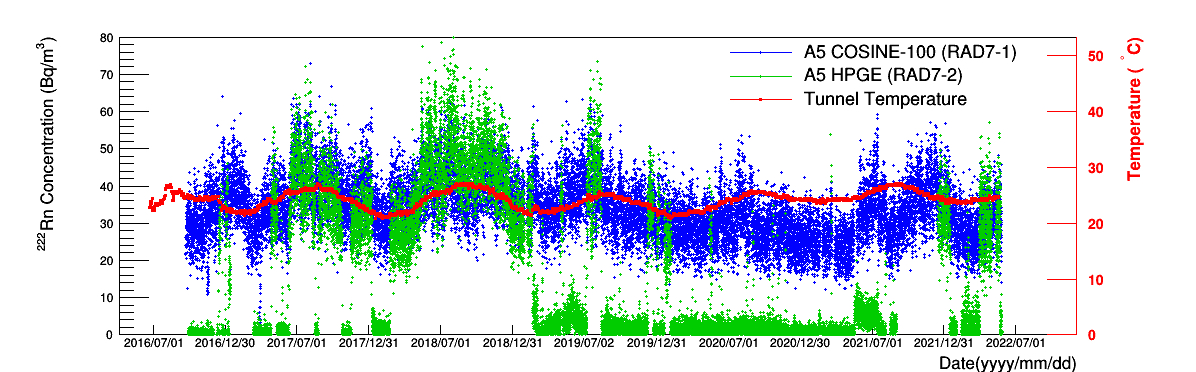
Correlations of long-term variations in the A5 measurements with the tunnel temperatures have also been investigated. The concentrations measured at the A5 COSINE-100 and HPGe rooms were compared to each other as well as with the temperature in the A5 tunnel. The two experimental rooms are separated by a distance of approximately 35 m. When the RRS was not operating, the comparative variations in radon levels were strongly correlated, as depicted in Fig. 5.
Since the power plant company operates air circulation fans at the end of the main tunnel throughout the year, the tunnel temperature is correlated with the surface temperatures in the immediate vicinity. The temperature measured at A5 shows an annual variation between 22 and 26 (Fig. 5). In the Yangyang region, the temperature averaged over the year is 11.8 , with an average minimum of in January and an average maximum of 24.3 in August.
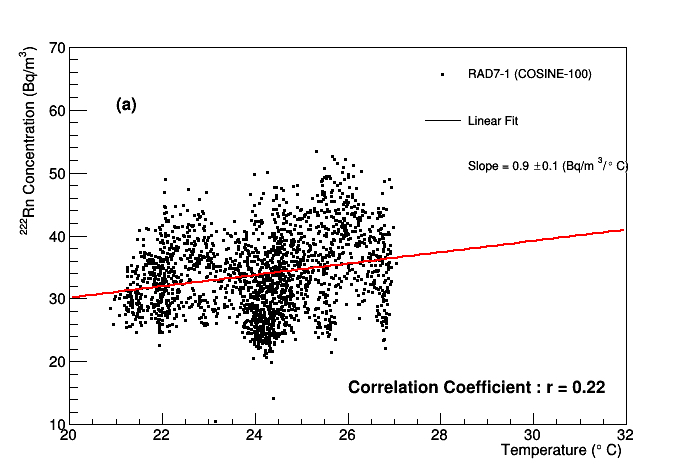
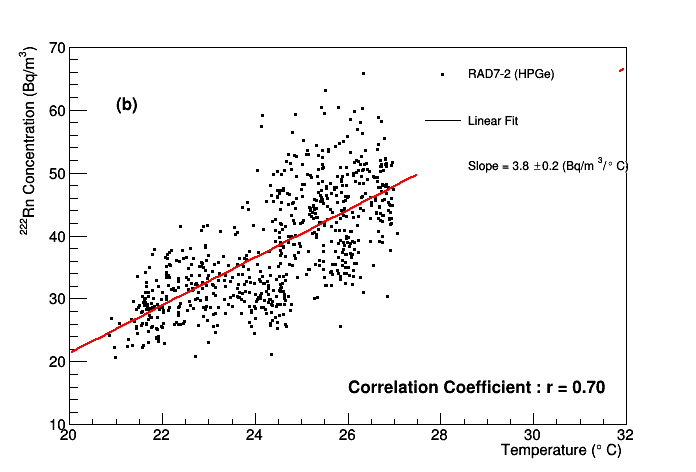
The 222Rn concentrations measured in the COSINE-100 and HPGe rooms are compared with the temperature inside the A5 tunnel in Fig. 6. The A5 COSINE-100 (RAD7-1) radon levels correlate with the tunnel temperature with a correlation coefficient of ; the slope of a linear fit to the data was 0.90.1 Bq/mC. For the A5 HPGe (RAD7-2) levels, when RRS is off, the larger coefficient of is obtained and the slope parameter was 3.80.2 Bq/mC.
For the annual variation study, we applied an additional selection criterion to all of the acquired KIMS and COSINE-100 radon data that eliminated all the data prior to 2011/05/11, for which the knowledge of the ventilation conditions in the A6 tunnel was incomplete. The RAD7-2 (HPGe) data is not used in this analysis because the RRS-off data spans relatively short periods. The combined data period is from 2011/05/11 to 2022/05/27 (4034 days in total) and the final analysis sample contains 3822 live days, which is 95% of all the days in this period. Here, we treat two-hour RAD7 measurement as a single data point, and each daily measurement is the statistical average of the 12, two-hour measurements on that day. The daily averages were further combined into eight-day averages.
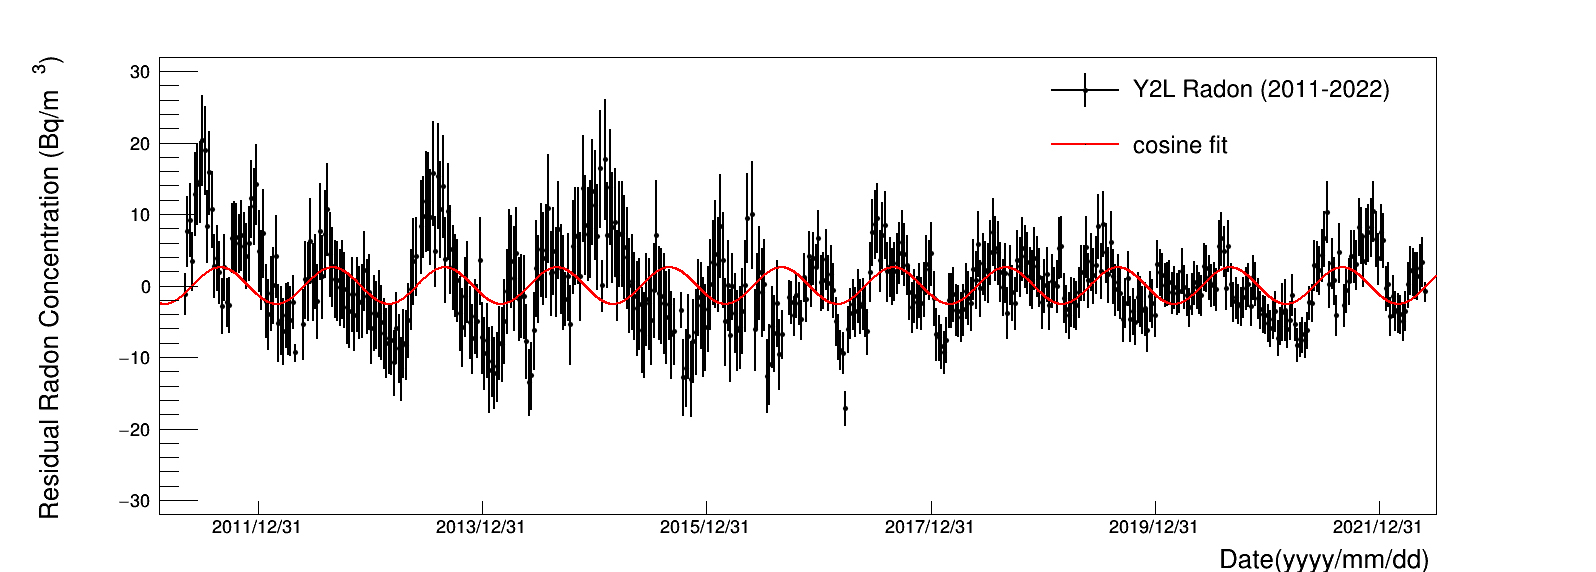
Initially, we evaluated an annual average using a period of 365.25 days, with January 1st as the starting time. After subtracting the average values, the residual concentrations for each year were obtained and combined for the entire analysis period. Then we applied a cosine fit,
| (1) |
to these residuals. In the Eq. 1 fit, the period was fixed at 1 year and we fit for the amplitude and phase using the method. The best-fit was Bq/m3 and the best-fit phase at the amplitude was days with . This corresponds to August days at the positive maximum amplitude. A constant linefit on the same data assuming no modulation shows . With difference of 71.6 between two hypotheses, therefore, no modulation hypothesis is disfavored at more than 8 . The radon-concentration residuals and the results of the fit are displayed in Fig. 7.
For a consistency check, we performed the same fit on residual data that combine A5 and A6 data with only their average concentrations subtracted rather than subtracting the yearly residuals. This fit finds an amplitude of Bq/m3 and a phase of days, which is consistent with the yearly residual fit. The relatively large value from the modulation best-fit has been investigated. We evaluated that the main cause is difference in the residual fluctuations between A5 and A6. The A6 measurements show a larger spread in the 222Rn measurement than that of A5. The cosine fit with only the A5 yearly residuals returns an amplitude of Bq/m3 and a phase of days with improved = 346.1/258. On the other hand, the fit with A6 only data shows worse constraints with an amplitude of Bq/m3 and a phase of days with = 394.0/237. Additionally, the tunnel temperature is affected by other local impacts that can influence the radon measurements. These include occasional power outages, malfunction of branch tunnel’s ventilation system, and excess heat generated by other operating experiments in the same tunnel.
IV Discussion
We fitted the A5 temperature annual variation with the Eq. 1 function plus a constant term using the least square method. We found a phase of 58.45.2 days and an amplitude of C. The best-fit phase is consistent with the best-fit phase of the radon concentration variations. The seasonal variation of the radon concentration has been studied in other places with various models Wojcik et al. (2017); Arvela et al. (2016). They consider that variations of water contents in local soil facilitate radon diffusion when season changes. However, in the Yangyang area, measurements of local indoor 222Rn and soil 226Ra concentrations show weak correlations Kim et al. (2005). Located not far from the sea, the area is relatively windy with an average wind speed of about 2.0 m/s, providing fresh air throughout the year. Moreover, reports show a seasonal variation of indoor radon concentration in Korea is the highest in winter and the lowest in summer Kim et al. (2003), which is opposite of the water diffusion model and what is observed in Y2L. On the other hand, the temperature dependent radon emanation from the surrounding rocks of Y2L could influence the observed radon concentration modulation. However, the temperature variation of the A5 branch tunnel is C from the average value. Therefore, the effect due to the small temperature change may not be the magnitude that we observe in this study Sakoda and Ishimori (2014). Thus, we concluded that the observed radon modulation results from the temperature changes in the air caused by the ventilation system, which drives the temperature variations in the tunnel.
When the main tunnel draws warm air from outside in the summer, the air circulation in the A5 and A6 branch tunnels deteriorates because of the weak temperature gradients between the main and the branch tunnels. Moreover, the air conditioning fans, water cooling systems, and RRS generate more exhaust heat in the summer time at the branch tunnels. Conversely, in the winter, the temperature gradient is higher and the air exchanges more rapidly.
These phase of the radon concentration modulation (Maximum on August 31st) lags that of the DAMA/LIBRA signal (i.e., June 1st). It also lags that of the measured modulation of the cosmic-ray muon rate in the COSINE-100 (June 27th) by about two months. At the moment, the results of the COSINE-100 Adhikari et al. (2022) and ANAIS Amaré et al. (2021) signals for an annual modulation in the recoil nucleus event rate are statistics-limited and, therefore, cannot be directly compared to the radon concentration and muon rate variations.
The 222Rn concentration in the air has been measured over the past 18 years in the Y2L laboratory. The average concentration is 53.40.2 Bq/m3 in the A6 laboratory and 33.50.1 Bq/m3 in the A5 laboratory; the latter is lower by 37% because of better temperature-control and ventilation systems. In this analytical study, we determined that the radon concentration is correlated to the tunnel temperature. The COSINE-100 room radon concentration and tunnel temperature are correlated with the coefficient of r=0.22 while the coefficient between the HPGe radon concentration and tunnel temperature is r=0.70. With the selected data, the yearly residual data were fit with a cosine function and the phase of the maximum amplitude was determined to be August 316 days, which coincides with the phase of temperature variations in the adjoining tunnel. Overall, this is one of the longest running measurements of the radon concentration in underground laboratories.
Acknowledgments
We thank the Korea Hydro and Nuclear Power (KHNP) Company for providing the underground laboratory space at Yangyang. This research was supported by the Chung-Ang University Graduate Research Scholarship in 2022 and by the National Research Foundation of Korea (NRF) grant funded by the Korean government (MSIT) (No. 2021R1A2C1013761).
References
- Aghanim et al. (2020) Aghanim N, et al. Planck 2018 results. VI. Cosmological parameters. Astron. Astrophys. 641 (2020) A6. [Erratum: Astron.Astrophys. 652, C4 (2021)].
- Zwicky (1937) Zwicky F. On the Masses of Nebulae and of Clusters of Nebulae. ApJ 86 (1937) 217.
- Workman and Others (2022) Workman RL, Others. Review of Particle Physics. PTEP 2022 (2022) 083C01. doi:10.1093/ptep/ptac097.
- Lee and Weinberg (1977) Lee BW, Weinberg S. Phys. Rev. Lett. 39 (1977) 165.
- Schumann (2019) Schumann M. Direct Detection of WIMP Dark Matter: Concepts and Status. J. Phys. G 46 (2019) 103003.
- Gaskins (2016) Gaskins JM. A review of indirect searches for particle dark matter. Contemp. Phys. 57 (2016) 496–525.
- Kahlhoefer (2017) Kahlhoefer F. Review of LHC Dark Matter Searches. Int. J. Mod. Phys. A 32 (2017) 1730006.
- Aprile et al. (2022) Aprile E, et al. Search for New Physics in Electronic Recoil Data from XENONnT (2022).
- Aalbers et al. (2022) Aalbers J, et al. First Dark Matter Search Results from the LUX-ZEPLIN (LZ) Experiment (2022).
- Bernabei et al. (2018) Bernabei R, et al. First Model Independent Results from DAMA/LIBRA–Phase2. Universe 4 (2018) 116.
- Freese et al. (2013) Freese K, Lisanti M, Savage C. Colloquium: Annual modulation of dark matter. Rev. Mod. Phys. 85 (2013) 1561.
- Davis (2014) Davis JH. Fitting the annual modulation in DAMA with neutrons from muons and neutrinos. Phys. Rev. Lett. 113 (2014) 081302. doi:10.1103/PhysRevLett.113.081302.
- Blum (2011) Blum K. DAMA vs. the annually modulated muon background. arXiv:1110.0857 (2011).
- Tiwari et al. (2017) Tiwari A, Zhang C, Mei DM, Cushman P. Observation of annual modulation induced by rays from ( , ) reactions at the Soudan Underground Laboratory. Phys. Rev. C 96 (2017) 044609. doi:10.1103/PhysRevC.96.044609. [Erratum: Phys.Rev.C 98, 019901 (2018)].
- Adamson et al. (2013) Adamson P, et al. Comparisons of Annual Modulations in MINOS with the Event Rate Modulation in CoGeNT. Phys. Rev. D 87 (2013) 032005. doi:10.1103/PhysRevD.87.032005.
- McKinsey (2018) McKinsey DN. Is DAMA Bathing in a Sea of Radioactive Argon? arXiv:1803.1011 (2018).
- Pronost et al. (2018) Pronost G, Ikeda M, Nakamura T, Sekiya H, Tasaka S. Development of new radon monitoring systems in the Kamioka mine. PTEP 2018 (2018) 093H01. doi:10.1093/ptep/pty091.
- Liu et al. (2018) Liu C, Ma H, Zeng Z, Cheng J, Li J, Zhang H. Measurements of Radon Concentrations Using CR-39 Detectors in China JinPing Underground Laboratory (2015-2016) (2018).
- Pérez-Pérez et al. (2022) Pérez-Pérez J, et al. Radon Mitigation Applications at the Laboratorio Subterráneo de Canfranc (LSC). Universe 8 (2022) 112. doi:10.3390/universe8020112.
- Hodák et al. (2019) Hodák R, et al. Characterization and long-term performance of the radon trapping facility operating at the modane underground laboratory. Journal of Physics G: Nuclear and Particle Physics 46 (2019) 115105. doi:10.1088/1361-6471/ab368e.
- Murra et al. (2022) Murra M, Schulte D, Huhmann C, Weinheimer C. Design, construction and commissioning of a high-flow radon removal system for XENONnT (2022).
- Akerib et al. (2020) Akerib DS, et al. The LUX-ZEPLIN (LZ) radioactivity and cleanliness control programs. Eur. Phys. J. C 80 (2020) 1044. doi:10.1140/epjc/s10052-020-8420-x.
- Prihtiadi et al. (2018) Prihtiadi H, et al. Muon detector for the COSINE-100 experiment. JINST 13 (2018) T02007.
- Prihtiadi et al. (2021) Prihtiadi H, et al. Measurement of the cosmic muon annual and diurnal flux variation with the COSINE-100 detector. JCAP 02 (2021) 013.
- Zhu et al. (2005) Zhu J, et al. Study on the Muon Background in the Underground Laboratory of KIMS. High Energy Physics and Nuclear Physics 29 (2005) 721.
- Lee et al. (2011) Lee M, et al. Radon Environment in the Korea Invisible Mass Search Experiment and Its Measurement. J. Korean Phys. Soc. 57 (2011) 713.
- Lee et al. (2006) Lee HS, et al. First limit on WIMP cross section with low background CsI(Tl) crystal detector. Phys. Lett. B 633 (2006) 201–208. doi:10.1016/j.physletb.2005.12.035.
- Adhikari et al. (2018a) Adhikari G, et al. Initial Performance of the COSINE-100 Experiment. Eur. Phys. J. C 78 (2018a) 107. doi:10.1140/epjc/s10052-018-5590-x.
- Adhikari et al. (2018b) Adhikari G, et al. An experiment to search for dark-matter interactions using sodium iodide detectors. Nature 564 (2018b) 83–86. doi:10.1038/s41586-018-0739-1. [Erratum: Nature 566, E2 (2019)].
- Alenkov et al. (2019) Alenkov V, et al. First Results from the AMoRE-Pilot neutrinoless double beta decay experiment. Eur. Phys. J. C 79 (2019) 791. doi:10.1140/epjc/s10052-019-7279-1.
- Leonard et al. (2021) Leonard DS, et al. Development of an array of fourteen HPGe detectors having 70% relative efficiency each. Nucl. Instrum. Meth. A 989 (2021) 164954. doi:10.1016/j.nima.2020.164954.
- Kim et al. (2022) Kim H, et al. The environmental monitoring system at the COSINE-100 experiment. JINST 17 (2022) T01001. doi:10.1088/1748-0221/17/01/T01001.
- dur (2022) [Dataset] Durridge rad7 radon detector. https://durridge.com/products/rad7-radon-detector (2022).
- rad (2022) [Dataset] Radoneye rd200 radon detector. http://radoneye.com/ (2022).
- Wojcik et al. (2017) Wojcik M, Zuzel G, Simgen H. Review of high-sensitivity Radon studies. International Journal of Modern Physics A 32 (2017).
- Arvela et al. (2016) Arvela H, Holmgren O, Hanninen P. Effect of soil moisture on seasonal variation in indoor radon concentration: modelling and measurements in 362 Finnish houses. Radiation Protection Dosimetry 168 (2016).
- Kim et al. (2005) Kim Y, et al. Indoor radon, thoron, and thoron daughter concentrations in Korea. International Congress Series 1276 (2005).
- Kim et al. (2003) Kim CK, et al. Nationwide survey of radon levels in Korea. Health Physics 84 (2003).
- Sakoda and Ishimori (2014) Sakoda A, Ishimori Y. Calculation of temperature dependence of radon emanation due to alpha recoil. J Radioanal Nucl Chem 299 (2014).
- Adhikari et al. (2022) Adhikari G, et al. Three-year annual modulation search with cosine-100. Phys. Rev. D 106 (2022) 052005.
- Amaré et al. (2021) Amaré J, et al. Annual modulation results from three-year exposure of anais-112. Phys. Rev. D 103 (2021) 102005.