The alignment between brightest cluster galaxies and host clusters
Abstract
The alignment between brightest cluster galaxies (BCGs) and host clusters can reveal the mystery of formation and evolution for galaxy clusters. We measure cluster orientations in optical based on the projected distribution of member galaxies and in X-ray by fitting the morphology of intra-cluster medium (ICM). Cluster orientations determined in the two wavelengths are generally consistent. The orientation alignment between BCGs and host clusters is confirmed and more significant than previous works. We find that BCGs are more aligned with cluster orientations measured in X-ray than those from optical data. Clusters with a brighter BCG generally show a stronger alignment. We argue that the detected redshift evolution of the alignment is probably caused by observational bias rather than intrinsic evolution. The alignment is not related to the ellipticity of BCGs, and the richness, ellipticity and dynamical state of host clusters. The strong alignment between BCGs and morphology of ICMs may be the consequence of the co-evolution between the central massive galaxy and host clusters.
keywords:
galaxies: clusters: general — galaxies: clusters: intracluster medium1 Introduction
Galaxy clusters are the largest gravitationally bound systems in the Universe, formed by accreting materials along filaments and merging smaller groups or subclusters (e.g., Press & Schechter, 1974; Bower, 1991; Springel et al., 2005; McGee et al., 2009). The anisotropic processes for mass assembly lead clusters and their member galaxies orient non-randomly (e.g., Dubinski, 1998; Altay et al., 2006; Faltenbacher et al., 2008; Knebe et al., 2008). Satellite galaxies in groups or clusters tend to point to the central massive galaxies (e.g., Thompson, 1976; Pereira & Kuhn, 2005; Yang et al., 2006; Faltenbacher et al., 2007; Huang et al., 2018). BCGs are observed to align with their host clusters (hereafter “BCG alignment” or “the alignment” for short, e.g., Sastry, 1968; Niederste-Ostholt et al., 2010; Hao et al., 2011; Huang et al., 2016; West et al., 2017; Wittman et al., 2019). On larger scales, galaxy groups or clusters also orient toward their neighbours statistically (e.g., Binggeli, 1982; Rhee & Katgert, 1987; West, 1989; Wang et al., 2009; Smargon et al., 2012). Investigations on the orientation alignment of galaxies, groups and clusters provide a unique way to understand their formation and evolution histories (see reviews: Joachimi et al., 2015; Kiessling et al., 2015; Kirk et al., 2015).
BCGs are the most massive galaxies in clusters, generally inhabit the dense environment of cluster centers. They gain masses through accreting materials from the ICM or cannibalizing satellite galaxies (e.g., Ostriker & Hausman, 1977; Fabian, 1994; Dubinski, 1998; Nipoti et al., 2018), and show peculiar properties in many aspects when compared to normal elliptical galaxies (e.g., Burns et al., 1981; Best et al., 2007; Lin et al., 2010; Shen et al., 2014; Wen & Han, 2015a). On the one hand, the properties of BCGs are affected by the ambient environment (e.g., Mittal et al., 2009; Kale et al., 2015; Yuan et al., 2016); on the other hand, BCGs can regulate the distribution of surrounding gases and heat them significantly through AGN feedback (e.g., Cattaneo et al., 2009; Ma et al., 2013). The orientation alignment indicates the tight links between BCGs and host clusters.
The formation of the BCG alignment is still controversial: whether the alignment is created primordially and maintained to now, or it appears gradually during the process of mass assembly of BCGs. This could be partly answered by comparing the alignment signal in different redshifts. Niederste-Ostholt et al. (2010) and Hao et al. (2011) found stronger alignment for lower redshift clusters, but Huang et al. (2016) claimed that no clear redshift evolution is detected. By using the Hubble Space Telescope (HST), West et al. (2017) found that the BCG alignment has been clearly set ten billion years ago.
Generally, the mass distribution of galaxy clusters can be well traced by the distribution of their member galaxies (e.g., Broadhurst et al., 2005; Zitrin et al., 2009; Zitrin et al., 2011). The overall orientation of clusters thus can be measured with the positions of member galaxies (e.g., Sastry, 1968; Carter & Metcalfe, 1980). Clear BCG alignment has been detected for large cluster samples (e.g., Niederste-Ostholt et al., 2010; Hao et al., 2011; Huang et al., 2016). Relations between the alignment strength and cluster properties are also discussed. For example, clusters with a more luminous or more dominant BCG usually show more remarkable alignments (e.g., Niederste-Ostholt et al., 2010; Hao et al., 2011; Huang et al., 2016). While marginal or no dependence is found on the richness of clusters (e.g., Hao et al., 2011; Huang et al., 2016).
The cluster mass can also be reflected by the distribution of ICM (e.g., Fabricant et al., 1984; Allen et al., 2002), thus the global orientation of galaxy clusters can be determined from their X-ray morphologies. Based on Einstein images, Porter et al. (1991) found clear BCG alignments with 41 clusters, and Rhee & Latour (1991) got consistent results for 26 clusters. Allen et al. (1995) detected the BCG alignment in 5 clusters observed by the ROSAT. Hashimoto et al. (2008) studied the alignment for 30 clusters with Chandra images, in much higher angular resolution than the Einstein and ROSAT images. Donahue et al. (2016) confirmed the BCG alignment for 25 clusters, no matter the cluster orientation is measured from X-ray (Chandra), Sunyaev-Zel’dovich effect (Bolocam) or lensing (HST) data. All the above X-ray samples are very limited, insufficient to further investigate the influence of cluster properties on the BCG alignment.
The Chandra and XMM-Newton satellites have accumulated massive data for galaxy clusters. Recently, we processed the archival Chandra (Yuan & Han, 2020) and XMM-Newton (Yuan et al., 2022) data homogeneously, and obtained X-ray images for 1844 clusters in total. It is feasible now to measure the orientation of clusters in both optical and X-ray wavelengths for a large sample of clusters. In Section 2, we describe the cluster samples and derive the shape parameters. Results on the BCG alignment are presented in Section 3. A summary is given in Section 4. Throughout this paper, we assume a flat CDM cosmology with km s-1 Mpc-1, and .
2 Data
2.1 Cluster samples
The cluster sample in X-ray is derived from the archival data of the Chandra and XMM-Newton (Yuan & Han, 2020; Yuan et al., 2022). Galaxy clusters are collected in two independent approaches: 1) clusters from targeted observations, and 2) those serendipitously detected. The X-ray images of clusters are processed homogeneously, and smoothed to a certain physical scale of 30 kpc (refer Yuan & Han, 2020; Yuan et al., 2022, for details on the sample collection and image procssing). Finally, 964 clusters are obtained from Chandra images (Yuan & Han, 2020), 1308 clusters are from XMM-Newton images, and a joint sample with 1844 clusters is derived by combining the Chandra and XMM-Newton samples (Yuan et al., 2022).
In optical, the large cluster catalogue derived by Wen & Han (2015b) is used. Wen et al. (2012) identified 132 684 clusters from the photometric data of Sloan Digital Sky Survey (SDSS). Wen & Han (2015b) updated this catalogue based on the SDSS spectroscopic data (Alam et al., 2015), and identified 25 419 new clusters. In total, the sample in Wen & Han (2015b) contains 158 103 clusters.
We cross-match the X-ray joint sample in Yuan et al. (2022) with the optical catalogue in Wen & Han (2015b) within the cluster radius , the radius of a cluster within which the mean matter density is 500 times of the local critical density. Preliminarily, we get 755 clusters overlapped in the X-ray and optical samples.
2.2 Parameters of galaxy clusters
2.2.1 Orientation and ellipticity of BCGs
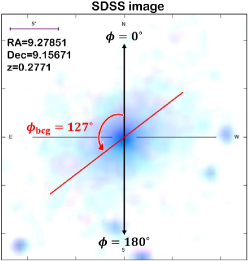
Based on the BCG coordinates in the catalogue of Wen & Han (2015b), we directly get the position angle (deVPhi_r) and the axis ratio (deVAB_r) of BCGs, fitted with the de Vancouleurs model, from the SDSS database (Stoughton et al., 2002).111http://skyserver.sdss.org/dr15/en/tools/crossid/crossid.aspx The BCG ellipticity is defined as
| (1) |
The is measured from the north through the east within . As an example, the upper panel of Fig. 1 shows the SDSS image for the BCG of Abell 68 and the fitted position angle. In the lower panel of Fig. 1, we present the distribution of (dashed) for the 755 overlapped clusters, and find it follows the random distribution quite well.
2.2.2 Orientation and ellipticity of clusters estimated from member galaxies
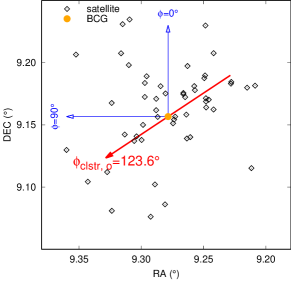
The orientation of clusters can be derived from the distribution of member galaxies (e.g., Kim et al., 2002; Niederste-Ostholt et al., 2010; Huang et al., 2016). First, we calculate the three moments:
| (2) |
where , are the relative angular distances in the right ascension and declination directions, respectively, of the th satellite galaxy to the BCG, is equal to , and is the number of satellite galaxies in the cluster. Here, we only adopt satellite galaxies satisfying: (1) the -band absolute magnitude is brighter than mag, and (2) the projected distance to the BCG is less than . The two parameters and are defined as
| (3) |
Then the position angle and the ellipticity of clusters can be computed through
| (4) |
| (5) |
The is measured from the north through the east within . In Fig. 2, the distribution of member galaxies for the Abell 68 and the corresponding position angle are presented as an example. In the lower panel of Fig. 1, we present the distribution of for 755 clusters and find that the cluster orientations (dash-dotted) are randomly distributed in the projected plane.
The deviation angle between the BCG and host cluster thus can be calculated through
| (6) |
Here the is in .
2.2.3 Orientation and ellipticity of clusters estimated from X-ray images
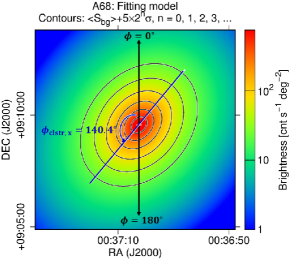
The orientation and ellipticity of host clusters can also be measured by fitting the cluster X-ray images with a two-dimensional -model as (see Yuan & Han, 2020, for details)
| (7) |
where
| (8) |
and
| (9) |
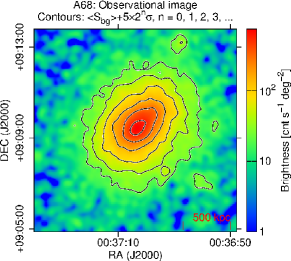
Here is the cluster ellipticity, is the position angle from the north through the east within . The upper panel of Fig. 3 shows the X-ray image of Abell 68 observed by the XMM-Newton, refer Yuan et al. (2022) for details. In the lower panel, the corresponding -model and the fitted cluster orientation are presented. The distribution of (dotted) for 755 clusters is shown in the lower panel of Fig. 1, follows the random distribution perfectly.
The deviation angle between orientations of the BCG and host cluster thus can be calculated with
| (10) |
where the is in the range of .
Since the uncertainty of measured orientations is larger for rounder sources (e.g., see Refregier et al., 2012), previous works usually set a threshold for the ellipticity (e.g., Yang et al., 2006; Niederste-Ostholt et al., 2010). In this paper, we limit ellipticities, including the , and , larger than . Meanwhile, because the measurement of the orientation is inaccurate for clusters with few members, we only use that estimated from clusters with 10 or more satellites, i.e., . Finally, we obtain 411 clusters satisfying the above selection criteria.
2.2.4 Other parameters
To study the relation between BCG alignment and properties of BCGs or host clusters, we get the BCG redshift , the -band absolute magnitude of BCGs , the number of satellite galaxies , and the cluster richness from the catalogue in Wen & Han (2015b). About 90% of the BCG redshifts are estimated from spectroscopic data. The absolute magnitude is evolution-corrected with . The cluster richness is estimated by the total luminosity of member galaxies and can be taken as a good mass proxy of clusters (Wen & Han, 2015b).
In Yuan et al. (2022), we calculated four kinds of dynamical parameters with X-ray images, i.e., the concentration index , the centroid shift , the power ratio , and the morphology index . Since these parameters are tightly correlated with each other (Yuan & Han, 2020), we only take the adaptive morphology index as the dynamical parameter for clusters in following discussions. The morphology index is defined as the best combination of the profile parameter and the asymmetry factor estimated from the maps of surface brightness. It is calibrated by using a complete sample of clusters with known relaxed and disturbed state. Clusters with are relaxed, while those with are regarded as disturbed clusters. All the parameters for the 411 clusters are listed in Table 1.
| Name | RA | DEC | |||||||||||||
|---|---|---|---|---|---|---|---|---|---|---|---|---|---|---|---|
| (J2000) | (J2000) | (∘) | (∘) | (∘) | (∘) | (∘) | |||||||||
| (1) | (2) | (3) | (4) | (5) | (6) | (7) | (8) | (9) | (10) | (11) | (12) | (13) | (14) | (15) | (16) |
| A2697 | 0.79826 | -6.09169 | 0.2335 | -23.70 | 0.14 | 163.2 | 65 | 105.76 | -0.270.01 | 0.13 | 147.6 | 0.21 | 157.0 | 15.6 | 6.2 |
| A2700 | 0.95698 | 2.06647 | 0.0976 | -23.68 | 0.24 | 158.7 | 36 | 71.82 | -0.330.01 | 0.13 | 41.7 | 0.26 | 157.6 | 63.0 | 1.1 |
| WHLJ000524+161309 | 1.34984 | 16.21926 | 0.1156 | -23.40 | 0.18 | 25.8 | 34 | 63.76 | 0.760.01 | 0.13 | 80.6 | 0.30 | 32.1 | 54.8 | 6.3 |
| Z15 | 1.58453 | 10.86429 | 0.1663 | -24.19 | 0.11 | 112.5 | 36 | 63.25 | -0.150.01 | 0.26 | 97.7 | 0.11 | 109.4 | 14.8 | 3.1 |
| ACTCLJ0008.1+0201 | 2.04332 | 2.02009 | 0.3665 | -23.87 | 0.32 | 56.3 | 37 | 72.60 | 1.070.01 | 0.44 | 61.9 | 0.20 | 129.3 | 5.6 | 73.0 |
| ACTLJ0014-0056 | 3.72544 | -0.95236 | 0.5368 | -24.31 | 0.24 | 58.3 | 34 | 101.23 | 0.350.01 | 0.16 | 52.1 | 0.31 | 65.5 | 6.2 | 7.2 |
| CL0016+1626 | 4.63993 | 16.43779 | 0.5551 | -23.66 | 0.42 | 61.6 | 24 | 80.06 | 0.480.01 | 0.17 | 56.9 | 0.20 | 48.0 | 4.7 | 13.6 |
| CL0019.6+0336 | 4.91107 | 3.59926 | 0.2668 | -23.99 | 0.25 | 147.9 | 72 | 140.53 | 0.490.01 | 0.35 | 166.5 | 0.15 | 171.4 | 18.6 | 23.5 |
| PSZ2G114.79-33.71 | 5.15480 | 28.65949 | 0.0949 | -23.55 | 0.19 | 153.8 | 46 | 76.91 | 0.290.01 | 0.29 | 154.4 | 0.29 | 154.7 | 0.6 | 0.9 |
| WHYJ003410-021039 | 8.56122 | -2.08459 | 0.0793 | -23.33 | 0.23 | 19.9 | 27 | 39.00 | 1.240.01 | 0.29 | 13.5 | 0.10 | 0.7 | 6.4 | 19.2 |
Columns: (1) cluster name; (2-3) right ascension and declination in J2000; (4) the BCG redshift; (5 - 7) the -band absolute magnitude, ellipticity and position angle of the BCG; (8) number of selected satellite galaxies in the cluster; (9 - 10) the richness and dynamical paramter — the morphology index of the cluster; (11 - 12) the ellipticity and position angle of the cluster measured from member galaxies; (13 - 14) the cluster ellipticity and position angle determined from the X-ray image; (15) the acute angle between and ; (16) the acute angle between and .
3 Results
3.1 Comparing cluster orientations estimated from optical and X-ray data
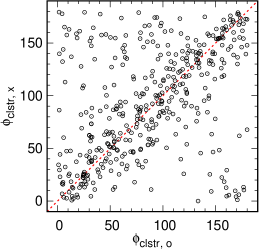
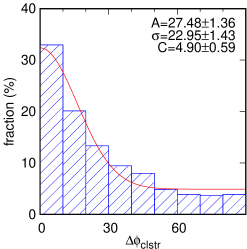
Under the assumption of hydrostatic equilibrium in the gravitational potential well of clusters, the distributions of member galaxies and ICM are both regulated by the mass distribution of galaxy clusters. Thus, it is natural to expect a general agreement between cluster orientations determined from member galaxies and those from the ICM. In the upper-left panel of Fig 4, a good consistency is presented between cluster orientations estimated from optical () and X-ray () data, though few clusters present large deviations. In the upper-right panel of Fig 4, we show the distribution of the differences between cluster orientations measured in optical and X-ray wavelengths, , and fit the distribution with a Gaussian model as
| (11) |
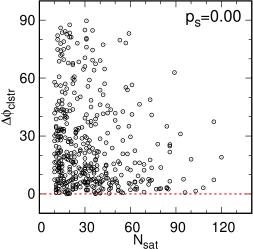
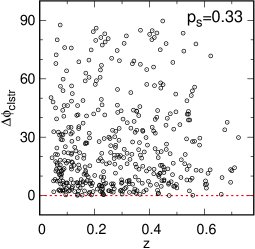
Here is the model amplitude, is the model center and set to 0, is the model width, and is a constant. The typical scatter of the relation is indicated by the of the Gaussian model, which is equal to . The lower-left panel of Fig 4 shows the correlation between the and the number of satellite galaxies in clusters . We assess the degree of correlation with the significance of Spearman rank-order correlation (defined in Press et al., 1992, p. 640), which is a very sensitive indicator for weak but intrinsic tendency, with the zero value for a significant dependence while non-zero values for independence. We find that clusters host more satellite galaxies tend to show better agreement between the and . In the lower-right panel of Fig 4, we find that the is independent of the cluster redshift .
3.2 The BCG alignment
| Sample | |||||
|---|---|---|---|---|---|
| this work, | 10 | 24.34 | 33.710.76 | 19.670.55 | 4.580.29 |
| this work, | 10 | 26.15 | 26.020.37 | 28.100.53 | 3.910.20 |
| N10 | 4 | 38∗ | 7.860.20 | 41.121.54 | 7.930.17 |
| H16 | — | 35.07 | 11.410.27 | 33.421.08 | 6.260.17 |
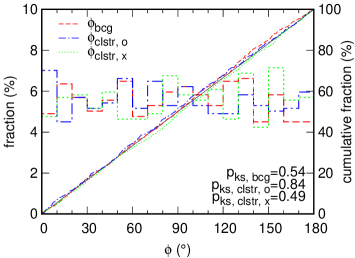
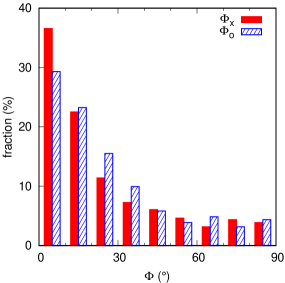
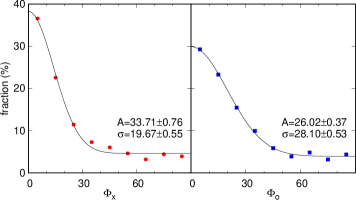
In the upper panel of Fig. 5, we show the distributions of the deviation angles between orientations of BCGs and host clusters. A clear signal of alignment is shown — the fraction of clusters with is significantly larger than those with a larger . We find that the (solid) shows stronger alignment than the (shaded). The distributions of and are fitted with a Gaussian model, as stated in Equation 11 and presented in the lower panels of Fig. 5. The best-fitted parameters for each samples are listed in Table 2. It is clear that the fitted model for has a significantly larger amplitude and a smaller width than those of the . This suggests that the BCG morphology is more aligned with the distribution of ICM than that of satellite galaxies.
In Table 2, the mean deviation angles and fitting parameters for the results obtained by Niederste-Ostholt et al. (2010) and Huang et al. (2016) are also presented. The alignments we obtained are significantly stronger, i.e., larger and smaller and . This is probably because our sample is derived from the common sample in X-ray and optical and under stricter selection criteria, e.g., , which leads our sample has a smaller uncertainty than that of previous works.
3.3 Correlations to properties of BCGs or clusters
Correlations between the alignment strength and various properties of BCGs or clusters have been studied, see Table 3 as a summary. However, many inconsistencies are obtained by different authors. For example, Niederste-Ostholt et al. (2010) and Hao et al. (2011) found that the BCG alignment is more prominent at lower redshifts, while Huang et al. (2016) did not find this trend. Hashimoto et al. (2008) found that clusters with a more elongated BCG generally show stronger BCG alignment, but Huang et al. (2016) argued that the dependence on the BCG ellipticity is probably due to selection effects.
| Reference | Cluster number | -evolution | BCG luminosity | BCG ellipticity | cluster richness | cluster dynamic |
|---|---|---|---|---|---|---|
| (1) | (2) | (3) | (4) | (5) | (6) | (7) |
| Hashimoto et al. (2008) | 30 | – | – | Yes | – | No |
| Niederste-Ostholt et al. (2010) | 7031 | Yes | – | – | Marginal | – |
| Hao et al. (2011) | 11000 | Yes | Yes | – | No | – |
| Huang et al. (2016) | 8237 | No | Yes | No | Marginal | – |
| this work | 411 | No | Yes | No | No | No |
“–” means the parameter is not discussed.
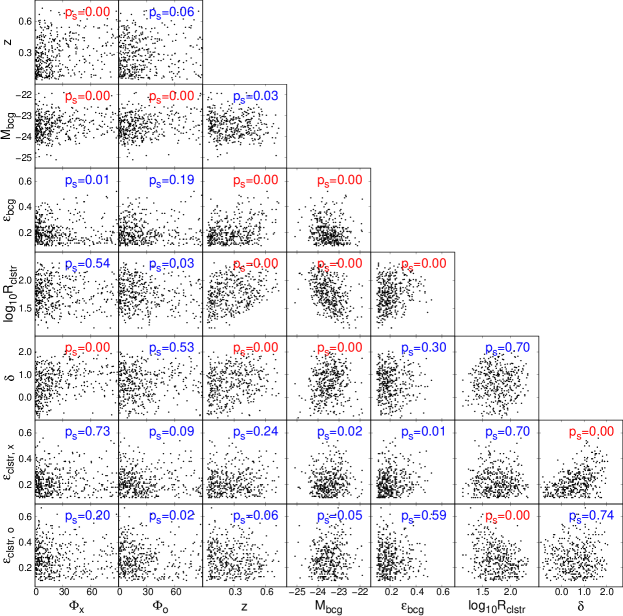
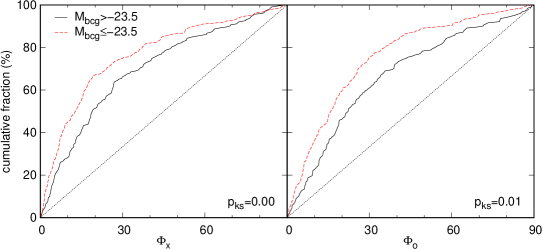
Here we search the relation between the BCG alignment and the redshift , the BCG absolute magnitude and ellipticity , and the richness and dynamical parameter of host clusters. As shown in the leftmost two columns of Fig. 6, only the BCG absolute magnitude shows significant dependence, i.e., , for and simultaneously. In Fig. 7, we divide the 411 clusters into two subsamples with the boundary of mag, and compare the cumulative fraction of the two subsamples for (left panel) and (right panel), respectively. It is clear that the subsample with more luminous BCGs (dashed) presents stronger alignment signal than the fainter subsample (solid). The corresponding probability of the Kolmogorov-Smirnov (KS) test, , between the two subsamples is equal 0.00 for the and equal to 0.01 for the , indicating a significantly different distribution between the two subsamples.
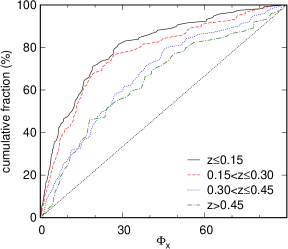
The redshift evolution of the BCG alignment has been discussed (e.g., Niederste-Ostholt et al., 2010; Hao et al., 2011; Huang et al., 2016). In Fig. 6, we find a clear dependence of on the cluster redshift , though the dependence vanishes for the . Fig. 8 shows the cumulative fraction of for subsamples with different ranges of redshift. We find that the distributions are similar between subsamples for (solid) and (dashed), but it changes significantly for the subsample with (dotted), and then keeps stable for (dash-dotted). Considering the discontinuous changes among subsamples with different redshifts, we argue that the changes are not originated from intrinsic evolution, but probably a consequence of observational selection effect, i.e., the uncertainty of BCG orientations measured from the SDSS images becomes larger at .
The Fig. 6 shows the significance of the correlation is equal to 0, but it changes to 0.53 for the correlation. Considering the inconsistency between the and , we conclude that no intrinsic relation is found between the BCG alignment and the dynamical state of host clusters. For other parameters, i.e., the BCG ellipticity , the cluster richness and ellipticity and , the Fig. 6 presents no dependence to both and . The results from literature and that obtained by us are summarized in Table 3.
4 Summary
Investigations on the BCG alignment and the correlations with properties of BCGs and clusters are helpful to understand the co-evolution of clusters and their central massive galaxies. In this work, we combine the large X-ray sample derived by Yuan et al. (2022) and the huge optical catalogue from Wen & Han (2015b). The position angle of BCGs is directly taken from the SDSS database. The orientations of host clusters are calculated in two independent approaches: (1) the is computed with the distribution of member galaxies, and (2) the is obtained by fitting the X-ray image of clusters with an elliptical -model. By setting thresholds on ellipticities and number of satellite galaxies, finally a sample of 411 clusters are obtained.
We find that cluster orientations measured from X-ray images are generally consistent with that determined from optical data. We confirm the BCG alignment and find BCGs are more aligned with the distribution of ICM compared to that of member galaxies. The alignment signal obtained by us is much stronger than that from literature. We find that clusters with more luminous BCGs show stronger BCG alignment statistically. We argue that the detected changes of the BCG alignment related to the redshift is mainly caused by selection effects rather than intrinsic physical evolution. The BCG alignment is independent of the BCG ellipticity, and the richness, ellipticty and dynamical state of host clusters.
Acknowledgements
We thank the referee, Dr. Michael West, for instructive comments which improved the paper. We thank J. L. Han for constructive suggestions and also Hu Zou for helpful discussions. YZS are supported by the science research grants from the China Manned Space Project (No. CMS-CSST-2021-A01, CMS-CSST-2021-B01). WZL acknowledges the support by the National Natural Science Foundation of China (12073036). This research has made use of data obtained from the Chandra Data Archive and software provided by the Chandra X-ray Center (CXC) in the application packages CIAO, ChIPS, and Sherpa. This work is based on observations obtained with XMM-Newton, an ESA science mission with instruments and contributions directly funded by ESA Member States and NASA. Funding for the Sloan Digital Sky Survey IV has been provided by the Alfred P. Sloan Foundation, the U.S. Department of Energy Office of Science, and the Participating Institutions. SDSS acknowledges support and resources from the Center for High-Performance Computing at the University of Utah. The SDSS web site is www.sdss.org.
Data availability
The data underlying this article, including the full version of Table 1 and the X-ray images for all clusters, are available at the webpage: http://zmtt.bao.ac.cn/galaxy_clusters/dyXimages/.
References
- Alam et al. (2015) Alam S., et al., 2015, ApJS, 219, 12
- Allen et al. (1995) Allen S. W., Fabian A. C., Edge A. C., Bohringer H., White D. A., 1995, MNRAS, 275, 741
- Allen et al. (2002) Allen S. W., Schmidt R. W., Fabian A. C., 2002, MNRAS, 335, 256
- Altay et al. (2006) Altay G., Colberg J. M., Croft R. A. C., 2006, MNRAS, 370, 1422
- Best et al. (2007) Best P. N., von der Linden A., Kauffmann G., Heckman T. M., Kaiser C. R., 2007, MNRAS, 379, 894
- Binggeli (1982) Binggeli B., 1982, A&A, 107, 338
- Bower (1991) Bower R. G., 1991, MNRAS, 248, 332
- Broadhurst et al. (2005) Broadhurst T., et al., 2005, ApJ, 621, 53
- Burns et al. (1981) Burns J. O., White R. A., Hough D. H., 1981, AJ, 86, 1
- Carter & Metcalfe (1980) Carter D., Metcalfe N., 1980, MNRAS, 191, 325
- Cattaneo et al. (2009) Cattaneo A., et al., 2009, Nature, 460, 213
- Donahue et al. (2016) Donahue M., et al., 2016, ApJ, 819, 36
- Dubinski (1998) Dubinski J., 1998, ApJ, 502, 141
- Fabian (1994) Fabian A. C., 1994, ARA&A, 32, 277
- Fabricant et al. (1984) Fabricant D., Rybicki G., Gorenstein P., 1984, ApJ, 286, 186
- Faltenbacher et al. (2007) Faltenbacher A., Li C., Mao S., van den Bosch F. C., Yang X., Jing Y. P., Pasquali A., Mo H. J., 2007, ApJ, 662, L71
- Faltenbacher et al. (2008) Faltenbacher A., Jing Y. P., Li C., Mao S., Mo H. J., Pasquali A., van den Bosch F. C., 2008, ApJ, 675, 146
- Hao et al. (2011) Hao J., Kubo J. M., Feldmann R., Annis J., Johnston D. E., Lin H., McKay T. A., 2011, ApJ, 740, 39
- Hashimoto et al. (2008) Hashimoto Y., Henry J. P., Boehringer H., 2008, MNRAS, 390, 1562
- Huang et al. (2016) Huang H.-J., Mandelbaum R., Freeman P. E., Chen Y.-C., Rozo E., Rykoff E., Baxter E. J., 2016, MNRAS, 463, 222
- Huang et al. (2018) Huang H.-J., Mandelbaum R., Freeman P. E., Chen Y.-C., Rozo E., Rykoff E., 2018, MNRAS, 474, 4772
- Joachimi et al. (2015) Joachimi B., et al., 2015, Space Sci. Rev., 193, 1
- Kale et al. (2015) Kale R., Venturi T., Cassano R., Giacintucci S., Bardelli S., Dallacasa D., Zucca E., 2015, A&A, 581, A23
- Kiessling et al. (2015) Kiessling A., et al., 2015, Space Sci. Rev., 193, 67
- Kim et al. (2002) Kim R. S. J., Annis J., Strauss M. A., Lupton R. H., 2002, in Borgani S., Mezzetti M., Valdarnini R., eds, Astronomical Society of the Pacific Conference Series Vol. 268, Tracing Cosmic Evolution with Galaxy Clusters. p. 395
- Kirk et al. (2015) Kirk D., et al., 2015, Space Sci. Rev., 193, 139
- Knebe et al. (2008) Knebe A., Yahagi H., Kase H., Lewis G., Gibson B. K., 2008, MNRAS, 388, L34
- Lin et al. (2010) Lin Y.-T., Ostriker J. P., Miller C. J., 2010, ApJ, 715, 1486
- Ma et al. (2013) Ma C. J., McNamara B. R., Nulsen P. E. J., 2013, ApJ, 763, 63
- McGee et al. (2009) McGee S. L., Balogh M. L., Bower R. G., Font A. S., McCarthy I. G., 2009, MNRAS, 400, 937
- Mittal et al. (2009) Mittal R., Hudson D. S., Reiprich T. H., Clarke T., 2009, A&A, 501, 835
- Niederste-Ostholt et al. (2010) Niederste-Ostholt M., Strauss M. A., Dong F., Koester B. P., McKay T. A., 2010, MNRAS, 405, 2023
- Nipoti et al. (2018) Nipoti C., Giocoli C., Despali G., 2018, MNRAS, 476, 705
- Ostriker & Hausman (1977) Ostriker J. P., Hausman M. A., 1977, ApJ, 217, L125
- Pereira & Kuhn (2005) Pereira M. J., Kuhn J. R., 2005, ApJ, 627, L21
- Porter et al. (1991) Porter A. C., Schneider D. P., Hoessel J. G., 1991, AJ, 101, 1561
- Press & Schechter (1974) Press W. H., Schechter P., 1974, ApJ, 187, 425
- Press et al. (1992) Press W. H., Teukolsky S. A., Vetterling W. T., Flannery B. P., 1992, Numerical recipes in FORTRAN. The art of scientific computing
- Refregier et al. (2012) Refregier A., Kacprzak T., Amara A., Bridle S., Rowe B., 2012, MNRAS, 425, 1951
- Rhee & Katgert (1987) Rhee G. F. R. N., Katgert P., 1987, A&A, 183, 217
- Rhee & Latour (1991) Rhee G. F. R. N., Latour H. J., 1991, A&A, 243, 38
- Sastry (1968) Sastry G. N., 1968, PASP, 80, 252
- Shen et al. (2014) Shen S., Yang X., Mo H., van den Bosch F., More S., 2014, ApJ, 782, 23
- Smargon et al. (2012) Smargon A., Mandelbaum R., Bahcall N., Niederste-Ostholt M., 2012, MNRAS, 423, 856
- Springel et al. (2005) Springel V., et al., 2005, Nature, 435, 629
- Stoughton et al. (2002) Stoughton C., et al., 2002, AJ, 123, 485
- Thompson (1976) Thompson L. A., 1976, ApJ, 209, 22
- Wang et al. (2009) Wang Y., Park C., Yang X., Choi Y.-Y., Chen X., 2009, ApJ, 703, 951
- Wen & Han (2015a) Wen Z. L., Han J. L., 2015a, MNRAS, 448, 2
- Wen & Han (2015b) Wen Z. L., Han J. L., 2015b, ApJ, 807, 178
- Wen et al. (2012) Wen Z. L., Han J. L., Liu F. S., 2012, ApJS, 199, 34
- West (1989) West M. J., 1989, ApJ, 344, 535
- West et al. (2017) West M. J., de Propris R., Bremer M. N., Phillipps S., 2017, Nature Astronomy, 1, 0157
- Wittman et al. (2019) Wittman D., Foote D., Golovich N., 2019, ApJ, 874, 84
- Yang et al. (2006) Yang X., van den Bosch F. C., Mo H. J., Mao S., Kang X., Weinmann S. M., Guo Y., Jing Y. P., 2006, MNRAS, 369, 1293
- Yuan & Han (2020) Yuan Z. S., Han J. L., 2020, MNRAS, 497, 5485
- Yuan et al. (2016) Yuan Z. S., Han J. L., Wen Z. L., 2016, MNRAS, 460, 3669
- Yuan et al. (2022) Yuan Z. S., Han J. L., Wen Z. L., 2022, MNRAS, 513, 3013
- Zitrin et al. (2009) Zitrin A., et al., 2009, MNRAS, 396, 1985
- Zitrin et al. (2011) Zitrin A., Broadhurst T., Barkana R., Rephaeli Y., Benítez N., 2011, MNRAS, 410, 1939