Genesis and Coronal-jet-generating Eruption of a Solar Minifilament Captured by IRIS Slit-raster Spectra
Abstract
We present the first IRIS Mg II slit-raster spectra that fully capture the genesis and coronal-jet-generating eruption of a central-disk solar minifilament. The minifilament arose in a negative-magnetic-polarity coronal hole. The Mg II spectroheliograms verify that the minifilament plasma temperature is chromospheric. The Mg II spectra show that the erupting minifilament’s plasma has blueshifted upflow in the jet spire’s onset and simultaneous redshifted downflow at the location of the compact jet bright point (JBP). From the Mg II spectra together with AIA EUV images and HMI magnetograms, we find: (i) the minifilament forms above a flux-cancelation neutral line at an edge of a negative-polarity network flux clump; (ii) during the minifilament’s fast-eruption onset and jet-spire onset, the JBP begins brightening over the flux-cancelation neutral line. From IRIS2 inversion of the Mg II spectra, the JBP’s Mg II bright plasma has electron density, temperature, and downward (red-shift) Doppler speed of 1012 cm-3, 6000 K, and 10 km s-1, respectively, and the growing spire shows clockwise spin. We speculate: (i) during the slow rise of the erupting minifilament-carrying twisted flux rope, the top of the erupting flux-rope loop, by writhing, makes its field direction opposite that of encountered ambient far-reaching field; (ii) the erupting kink then can reconnect with the far-reaching field to make the spire and reconnect internally to make the JBP. We conclude that this coronal jet is normal in that magnetic flux cancelation builds a minifilament-carrying twisted flux rope and triggers the JBP-generating and jet-spire-generating eruption of the flux rope.
1 Introduction
Solar jets of all sizes are transient eruptive events. They appear as narrow structures that extend outward from the solar surface into the corona (Shibata & Magara, 2011; Raouafi et al., 2016; Innes et al., 2016; Shen, 2021; Schmieder, 2022). They have been often observed in ultraviolet (UV; Pike & Mason 1998; Lu et al. 2019; Zhang et al. 2021a; Joshi et al. 2021; Schmieder et al. 2021), extreme ultraviolet (EUV; Wang et al. 1998; Nisticò et al. 2009; Schmieder et al. 2013; Panesar et al. 2016a; Sterling et al. 2017), and X-ray images (Shibata et al., 1992; Yokoyama & Shibata, 1995; Alexander & Fletcher, 1999; Moore et al., 2018; Lee et al., 2020). Coronal jets typically show a compact base-edge brightening and a bright spire during the eruption onset (Shibata et al., 1992). The base-edge brightening is called the jet bright point (JBP; Sterling et al. 2015). Jets occur all over the solar disk and at the solar limb. They are numerous in the polar regions ( 60 day-1, from Hinode soft X-ray images; Savcheva et al. 2007; Cirtain et al. 2007). From a study of polar coronal hole jets in X-rays, Savcheva et al. (2007) found that their typical lifetime is 10 minutes, typical width is 8000 km and typical length is 5 104 km.
With the availability of high spatial resolution extreme ultraviolet (EUV) images from Solar Dynamics Observatory (SDO; Pesnell et al. 2012)/Atmospheric Imaging Assembly (AIA; Lemen et al. 2012), many single coronal jets studies (e.g. Hong et al., 2011; Shen et al., 2012; Adams et al., 2014; Solanki et al., 2019; Mazumder, 2019) and several multiple jet studies (e.g. Sterling et al., 2015, 2017; Panesar et al., 2016b, 2018a; McGlasson et al., 2019) reported that jets are driven by a minifilament eruption. The JBP often appears near or at the site of the erupting minifilament (Sterling et al., 2015). The length of pre-jet minifilaments is in the range of 10 – 20 103 km (Wang et al., 2000; Sterling et al., 2015; Panesar et al., 2016b), which is significantly smaller than the size of filaments (about 3104 km – 1.1105 km; Bernasconi et al. 2005). The pre-jet minifilament lies in highly sheared magnetic field along a magnetic neutral line (also known as a polarity inversion line; Martin 1986) in a solar filament channel as do all typically-sized solar filaments (Martres et al., 1966; Gaizauskas et al., 1997; Martin, 1998; Mackay et al., 2010).
Several single-jet studies have found evidence of flux cancelation at the base of coronal jets before and during the jet (e.g. Huang et al., 2012; Young & Muglach, 2014a, b; Hong et al., 2019). Recently, Panesar et al. (2016b, 2017, 2018a) investigated the formation and eruption of the minifilament in 10 on-disk quiet-region and 13 on-disk coronal-hole jets. They found that each pre-jet minifilament formed by magnetic flux cancelation at the minifilament’s neutral line. Further flux cancelation at the neutral line triggers the minifilament eruption that drives the coronal jet. Later, McGlasson et al. (2019) studied 60 coronal jets and found that at least 85% of them result from minifilament eruption triggered by magnetic flux cancelation. Consistent results of flux convergence and cancelation in many coronal hole jets were reported by Muglach (2021). Similar flux cancelation before and during eruption has also been observed for some active region jets (Sterling et al., 2016, 2017; Mulay et al., 2016; Yang et al., 2019, 2020; Poisson et al., 2020; Zhang et al., 2021b). Other ideas for driving jets include flux emergence (Shibata et al., 1992; Yokoyama & Shibata, 1995), alfvénic magnetic twist-wave process without a flux rope (Pariat et al., 2009) and building the explosive sheared field by photospheric shearing flows (Kumar et al., 2018, 2019).
Small-scale UV/EUV jets (jetlets; Raouafi & Stenborg 2014) occur at the edges of magnetic network lanes (Panesar et al., 2018b, 2019, 2020b). Although jetlets were initially found to concentrate at the base of plumes (Raouafi & Stenborg, 2014), they were later observed to occur at several locations on the Sun and not limited to the plume regions (Panesar et al., 2018b). Further Panesar et al. (2018b) argued that jetlets are miniature versions of coronal jets because: (i) they occur at neutral lines at the edges of magnetic network lanes; (ii) they show base brightening on the neutral line during the eruption onset, and (iii) flux cancelation at the neutral line leads to the eruption. However, in the UV and EUV images of the UV/EUV jetlets studied by Panesar et al. (2018b, 2019, 2020b), no cool-plasma erupting minifilament-like dark feature is unambiguously seen in any jetlet’s base before and during the jetlet’s eruption onset. Nonetheless, Panesar et al. (2018b) observed twisting motion in one of the jetlets spire, which could be the result of a erupting flux rope from the jetlet base. On average, jetlets are three times smaller ( 5000 km; Panesar et al. 2018b) in the base widths than typical coronal jets ( 18000 km; Panesar et al. 2016b). Their duration is three to four times shorter (3 minutes) than the typical duration of coronal jets ( 10 minutes; Savcheva et al. 2007).
Small-scale filaments have been previously observed and reported using H data, and were proposed to be miniature versions of large-scale solar filaments (Hermans & Martin, 1986; Wang et al., 2000; Lee et al., 2003). However, these studies did not have spectroscopic observations to infer temperatures, densities, and Doppler velocities of minifilaments. Further, these investigations did not explore whether typical coronal jets were driven by the eruptions of their small-scale filaments.
Here, we report observations of a network-edge coronal hole jet, made by the eruption of a minifilament, observed by IRIS Mg II spectra. The observations are UV data from the Interface Region Imaging Spectrograph (IRIS; De Pontieu et al. 2014), EUV images from SDO/AIA, and line of sight magnetograms from SDO/Helioseismic and Magnetic Imager (HMI; Scherrer et al. 2012). To the best of our knowledge, this is the most detailed analysis so far of an on-disk minifilament eruption and coronal jet that is so fully captured by IRIS Mg II spectra raster scans and spectroheliograms and is conspicuous in both. Our purpose is to investigate the properties of a coronal jet (including the pre-jet minifilament formation and evolution, the minifilament eruption, and the JBP) using IRIS Mg II k spectra, and compare these with those observed in simultaneous EUV observations of SDO/AIA.
2 Observations
We searched through the IRIS data library for a jet that was well scanned by the IRIS slit. After checking a large sample of jets captured by IRIS, we found a jet that is in an on-disk coronal hole and is nicely scanned by the IRIS slit. We verified the presence of the jet in SDO/AIA 171 Å data using JHelioviewer software (Müller et al., 2017). In most other cases, either the IRIS slit missed the jet or only a part of the jet was scanned. The jet presented here is exceptional in that its evolution was fully captured under the IRIS slit.
For our analysis, we mainly used data from IRIS (De Pontieu et al., 2014). IRIS observed in its slit-jaw Mg II and Si IV filters, an on-disk coronal hole region in a field of view (FOV) of 231″ 175″, on 08-April-2020 during 17:14 – 22:17 UT. It ran a very large sparse 64-step raster with a step cadence of 1.1 s and a raster cadence of 72 s, making a total of 250 rasters (OBS ID 3645202860). The width of the IRIS slit is 0.33″. The data is summed along the slit by a factor of four, therefore making the pixels of size 0.33″ 0.66″, instead of 0.33″ 0.166″ (unsummed). The spectrograph slit step size is 1″. IRIS also took slit-jaw images (SJIs) in three different channels (Si IV 1400 Å, Mg II k 2796 Å, and Mg II wing 2832 Å) with a cadence of 3 seconds. For our investigation, we mainly focus on the Mg II k line, which samples chromospheric plasma, to study the detailed dynamics of the filament and jet. Because the signal to noise ratio of Si IV 1400 Å SJIs, which see transition region plasma, was low (and barely show some of the jet structure), we only used it as a context image in Figure 1. We summed two consecutive Si IV 1400 Å SJIs to enhance the signal. The IRIS observing sequence was specifically chosen to capture the chromospheric aspects of the eruption at a high cadence, necessitating very short exposure times, and thereby sacrificing the signal to noise in the far-ultraviolet (both in SJIs and spectra). We used level 2 IRIS data111https://www.lmsal.com/hek/hcr?cmd=view-event&event-id=ivo%3A%2F%2Fsot.lmsal.com%2FVOEvent%23VOEvent_IRIS_20200408_171435_3645202860_2020-04-08T17%3A14%3A352020-04-08T17%3A14%3A35.xml that were already calibrated: dark current subtracted, flat-fielded, and corrected for geometrical distortion.
We also used 304, 171, 193, and 211 Å EUV images from SDO/AIA to study the filament and jet in transition region and coronal emission (Lemen et al., 2012). The jet is definitely a coronal jet because it is visible in the hotter AIA channels, e.g. 335 Å and 94 Å. SDO/AIA provides full-disk solar images in seven different EUV channels having a pixel size of 0.6″ and a temporal cadence of 12 s. To study the photospheric roots of the magnetic field in and around the jet-base region, we used line of sight magnetograms from SDO/HMI (Scherrer et al., 2012). The HMI magnetograms have 0.5″ pixels, 45 s temporal cadence and a noise level of about 7 G (Schou et al., 2012; Couvidat et al., 2016). AIA and HMI datasets were downloaded from the JSOC website222http://jsoc.stanford.edu/ajax/exportdata.html. IRIS and SDO data sets were co-aligned and analyzed using SolarSoft routines (Freeland & Handy, 1998). Here, we show images from the AIA 171 and 193 Å channels because these two channels best show the minifilament and jet.
| Minifilament slow-rise start time in AIA 171Å | 20:10 UT |
|---|---|
| Start time of western lobe brightening | 20:11 UT |
| Jet bright point (JBP) start time in both AIA 171Å and IRIS Mg II k line | 20:18 UT |
| Start time of eastern remote brightening | 20:20 UT |
| Jet spire start time in both AIA 171Å and IRIS Mg II k line | 20:20 UT |
| Jet spire duration in both AIA 171Å and IRIS Mg II k line | 10 min |
| Minifilament’s slow-rise plane-of-sky speed | 3.0 0.8 km s-1 |
| Jet spire’s plane-of-sky speed in AIA 171 Å | 30 4 km s-1 |
| Jet spire’s plane-of-sky speed in IRIS Mg II k line | 32 4 km s-1 |
| Positive-polarity flux cancelation rate | 0.33 1018 Mx hr-1 |
| Negative-polarity flux reduction rate | 0.9 1018 Mx hr-1 |
| Physical properties obtained from the IRIS2 inversion of Mg II spectra: | |
| Electron density of JBP | 1012 cm-3 |
| Temperature of JBP | 6000 K |
| Doppler speed of JBP | 10 km s-1 (redshift) |
| Upward Doppler speed in the jet spire’s southern edge | 5.5 – 8.5 km s-1 (blueshift) |
| Downward Doppler speed in the jet spire’s northern edge | 1.2 – 2.1 km s-1 (redshift) |
| Spire’s head-on spin direction | clockwise |
3 Results
3.1 Overview of the Small-scale Jet
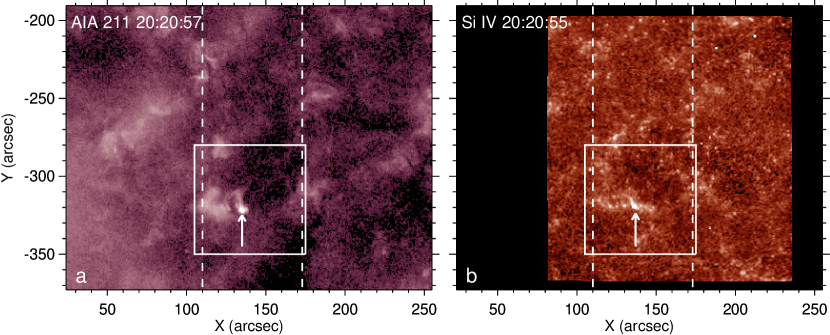
Figure 1 shows the coronal jet in an AIA 211 Å image and an IRIS SJI in the 1400 Å filter. We chose to show an AIA 211 Å image because the coronal hole is best seen in this channel. The jet occurs in a coronal hole region in which negative-polarity flux is dominant. It is rooted at the edge of a lane of negative-polarity magnetic flux, between that majority-polarity (negative) flux and a smaller patch of minority-polarity (positive) flux (Figures 2k,h). As mentioned above, this jet is fully covered by the IRIS slit raster. The two vertical dashed lines in Figure 1 mark the region that is scanned by the IRIS slit for about five hours. The jet peaks around 20:20 UT. We analyze the jet region from 19:30 UT to 21:00 UT to cover the pre-jet and jet evolution well before and after the jet erupts. The white box is the FOV that we analyze in detail and show in most other images (Figures 2, 4, 5, and 6).
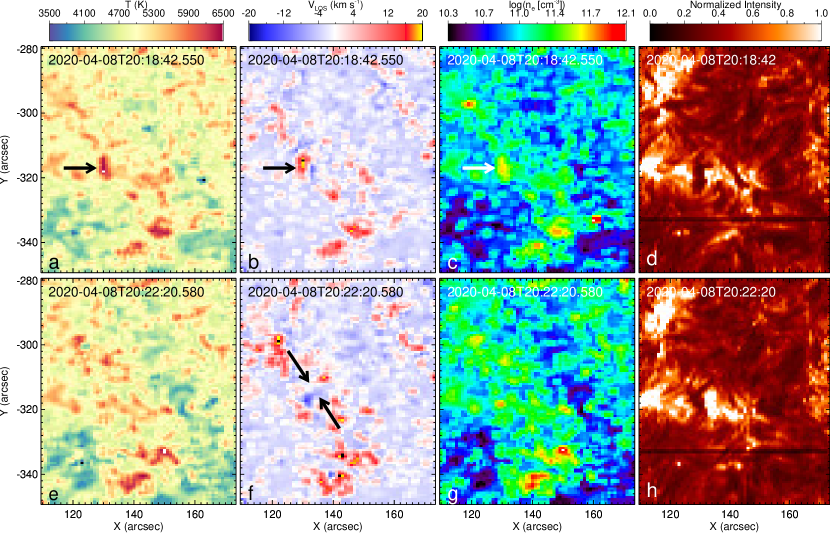
From each raster scan, we made a spectroheliogram at the core of the Mg II k line, at 2796.38 Å. Mg II spectroheliograms and spectra are shown in Figures 4 and 5. The IRIS spectroheliograms clearly show the minifilament in the jet-base region, before and during the eruption. To show the evolution of the minifilament in the Mg II spectra, we made time-wavelength maps at a different location along the slit at each of four close-together slit locations (Figures 4f-i). We also inverted the IRIS Mg II k line spectra with the IRIS2 code (Sainz Dalda et al., 2019) to obtain thermal and dynamical properties of the jet, namely, temperature, line-of-sight velocity, and electron density (Figures 6 and 9). Table 1 lists all the measured parameters of the jet and minifilament.
3.2 Minifilament and Magnetic Field
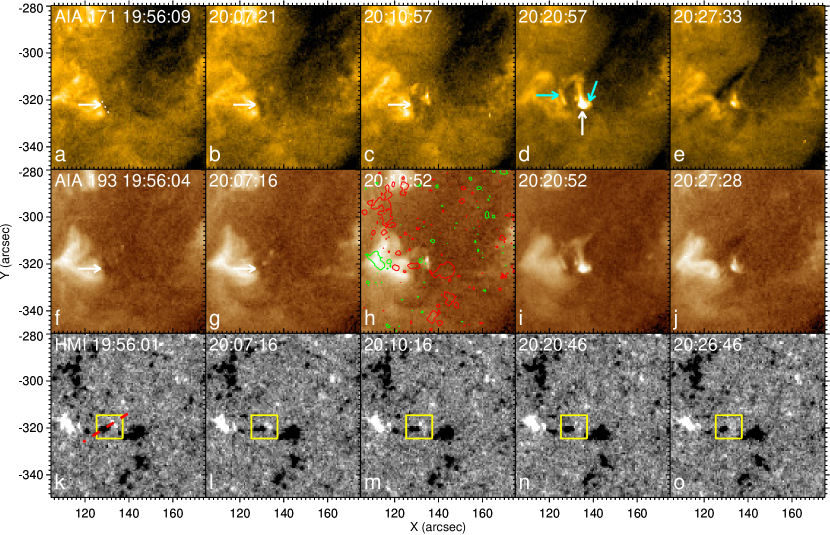
Figure 2(a–e) and Figure 2(f–j) show the jet in AIA 171 and 193 Å images, respectively. A corresponding video (Movie1.mp4) shows the evolution of the jet for 1.5 hours. The minifilament appears as a dark structure. It first shows-up at 19:56 UT in the AIA images and gradually grows longer and wider (white arrows in Figures 2a,f). As described later in Section 3.3, the minifilament shows-up as a dark structure at the same time in IRIS Mg II spectroheliograms as well. By 20:10 UT, it is obviously thicker. The minifilament starts to rise slowly at about 20:10 UT and later, at 20:18 UT, an obvious brightening (JBP in Figure 2d) starts just west of the minifilament at the neutral line, before the start of the jet spire at 20:20 UT. The JBP is also visible in AIA 94 Å images. Flickering brightening appears and disappears at the same location before the start of the relatively brighter JBP. The erupting minifilament-carrying flux rope slowly becomes wider and moves towards the northwest until 20:20 UT and then more rapidly undergoes its blowout eruption. Figures 2d,e show this is a blowout eruption because the width of the bright and dark spire in Figure 2(e) is comparable to the width of the jet base (Moore et al., 2010, 2013; Sterling et al., 2022). Note that the AIA 171 Å images at and near the time of Figure 2e also show a much fainter possible jet spire that extends southeast from near the base of the main jet spire. The faint possible jet spire seen in AIA 171 Å images does not show at all in images from AIA’s relatively hotter 193, 211, and 94 Å channels. Only the production of the much more robust main jet spire extending to the northwest is the focus of this paper. Except for pointing it out here, we ignore the faint possible jet spire extending to the southeast. The jet spire extends outward with an average speed of 30 4 km s-1. As the JBP approaches maximum brightness (Figures 2d,i), some remote brightenings appear to the east and west of the minifilament (see cyan arrows in Figure 2d). The western lobe brightening (downward cyan arrow in Figure 2d) starts at about 20:11 UT and eastern remote brightening (horizontal cyan arrow in Figure 2d) starts at about 20:20 UT. The total duration of the jet spire is 10 minutes (the time from when the spire starts until it fades out in 171 Å images).
Figures 2(k–o) show the photospheric magnetic flux in the jet-base region. The jet occurs at an edge of a lane of flux of the negative-polarity network. The minifilament lies above the magnetic neutral line between the lane of majority-polarity (negative) flux and a small patch of minority-polarity (positive) flux (Figure 2h) that merges with it. We made a time-distance image (Figure 3a) along the red dashed line of Figure 2k, to see the magnetic field evolution at the neutral line and notice that positive flux converges and cancels with the negative network flux at the neutral line (also see yellow box in Figure 2). Eventually the minifilament forms/appears at the canceling neutral line and the JBP also forms at the cancelation location, i.e. on the neutral line on which the filament sat before it erupted (Figure 2). Because the minifilament forms/appears at the canceling neutral line, we interpret that this minifilament forms via the flux cancelation process suggested by van Ballegooijen & Martens (1989) for typical solar filaments.
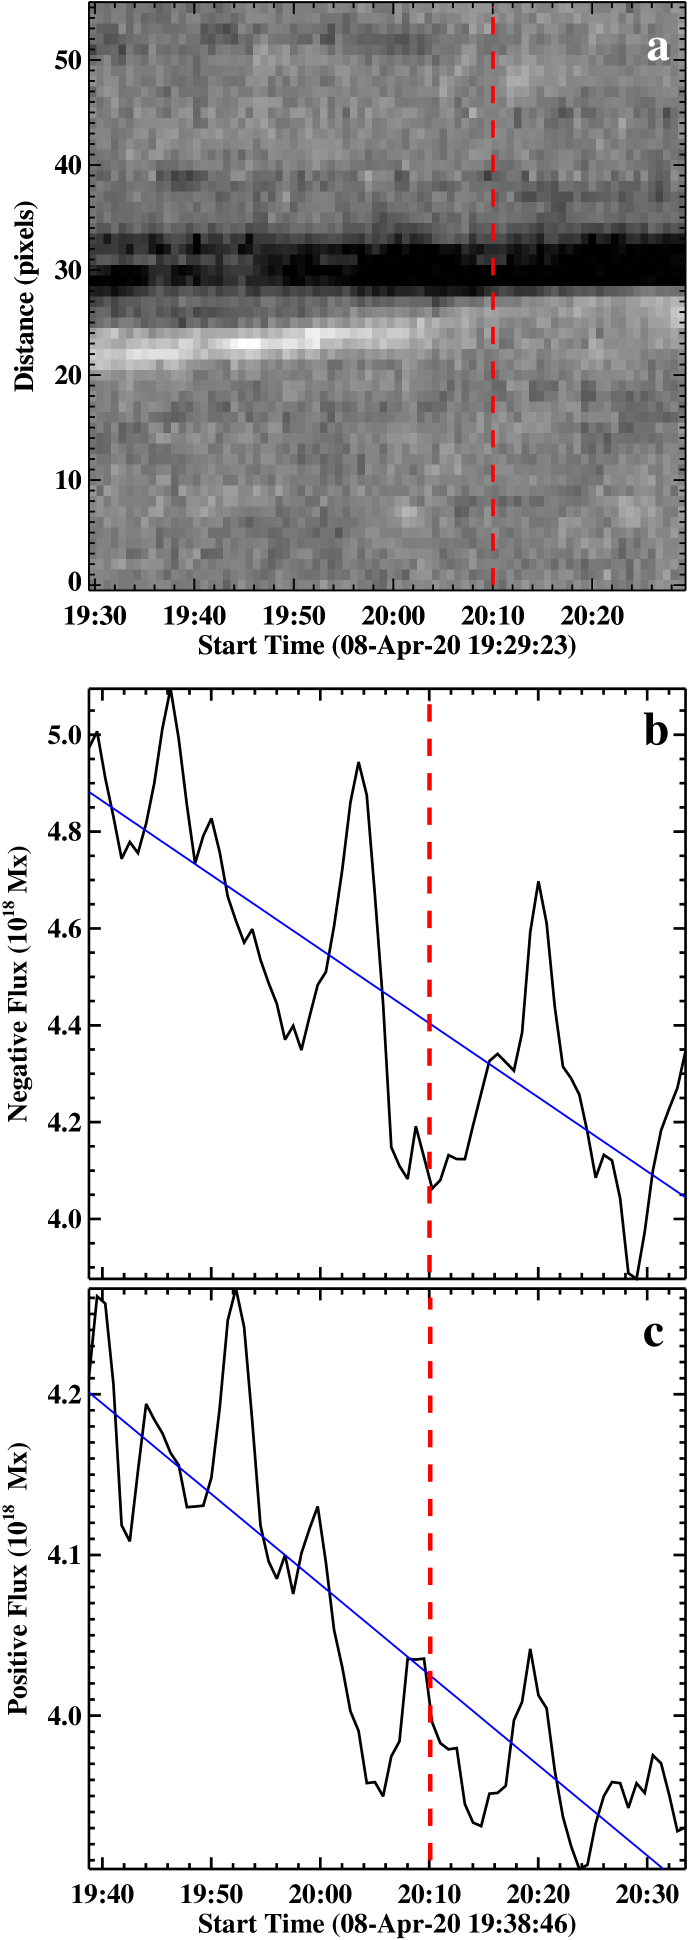
In Figure 3, we show the gradual decline with time of the total negative-polarity flux and total positive-polarity flux. Both plotted magnetic fluxes are measured inside the yellow box in Figure 2 and they indicate that magnetic flux cancels at the neutral line. The bumps in the flux plots are due to the noise level in the magnetograms as we are looking near the detection limit of the HMI magnetograms. Nonetheless, the overall trend in both polarities supports magnetic flux cancelation.
The plot supports our interpretation that flux cancelation takes place at the neutral line before and during the time of the jet, and that cancelation presumably triggers the minifilament eruption. The positive flux drops with a rate of 0.33 1018 Mx hr-1 whereas negative flux drops with a rate of 0.9 1018 Mx hr-1. Movie1 suggests that the decrease in negative flux is roughly three times the decrease in positive flux because some negative flux leaks out the east side of the box and some leaks out the southwest coroner of the yellow box of Figure 3a. Note that this is not the case of unipolar magnetic flux disappearance due to dispersion/fragmentation as found in some magnetic features by Anusha et al. (2017). In our case there is a clear flux convergence and disappearance of both polarities together as is evident from the magnetic flux plots (Figure 3b,c) as well as from Movie1. We interpret that this is flux cancelation via reconnection driven by converging photospheric flows as suggested by, among others, van Ballegooijen & Martens (1989); Moore & Roumeliotis (1992); Tiwari et al. (2014); Kaithakkal & Solanki (2019); Syntelis & Priest (2021); Priest & Syntelis (2021); Hassanin et al. (2022).
It is important to note that even though we were able to isolate each magnetic polarity (negative polarity to some extent) in this case, often only one polarity flux can be properly isolated. In those cases it is accepted that magnetic flux measurement can be made for only one polarity and a reduction in the flux in that polarity alone is evidence of ongoing flux cancelation; see Green et al. (2011) for further details.
3.3 Mg II Spectroscopic Observation of Minifilament
During and before the jet eruption, the IRIS slit raster covered the minifilament and jet spire thus enabling us to perform our spectroscopic analysis of the erupting minifilament and jet. IRIS observed, in the Mg II k resonance lines, the strong emission and absorption at the location of JBP and minifilament, respectively.
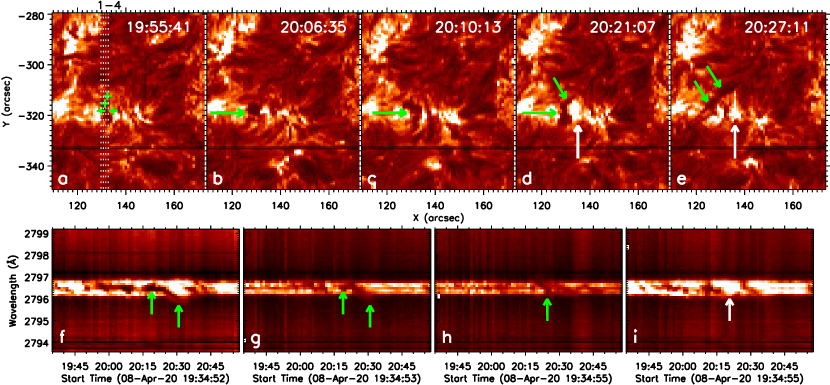
Figures 4(a–e) and Movie2.mp4 show the spectroheliograms of the Mg II k line that are made at 2796.38 Å. The horizontal green arrows point to the evolving dark minifilament structure in the jet base region whereas slanted green arrows point to the jet spire. In accord with the AIA images, the erupting minifilament starts becoming the dark spire at 20:20 UT and after that it continues to escape into the spire as the spire shoots out in the north-west direction (see green arrows in Figure 4e). Finally, it is fully ejected into the spire at 20:30 UT. The white arrows in Figure 4 point to the JBP that grows underneath the erupting filament. The Mg II minifilament appears similar to that reported by Hermans & Martin (1986); Wang et al. (2000) in H.
In Figures 4(f–i), we show the temporal evolution of the spectra at the ‘+’ signs of Figure 4a. These ‘+’ signs are at four different locations along the IRIS slit, three on the minifilament and jet spire, and one on the JBP. The first map of Figure 4f is from the first ‘+’ sign of Figure 4a (from left). Similarly, Figures 4g,h,i are from the second, third and fourth ‘+’ signs, respectively, starting from the left side. The minifilament activity can be seen between 20:15 and 20:30 UT (see green arrows), which is consistent with the activity seen in the spectroheliogram video (Movie2). The time-wavelength map of the JBP location is plotted in Figure 4i. One can see strong emission that appears at the location of the JPB as the minifilament erupts.
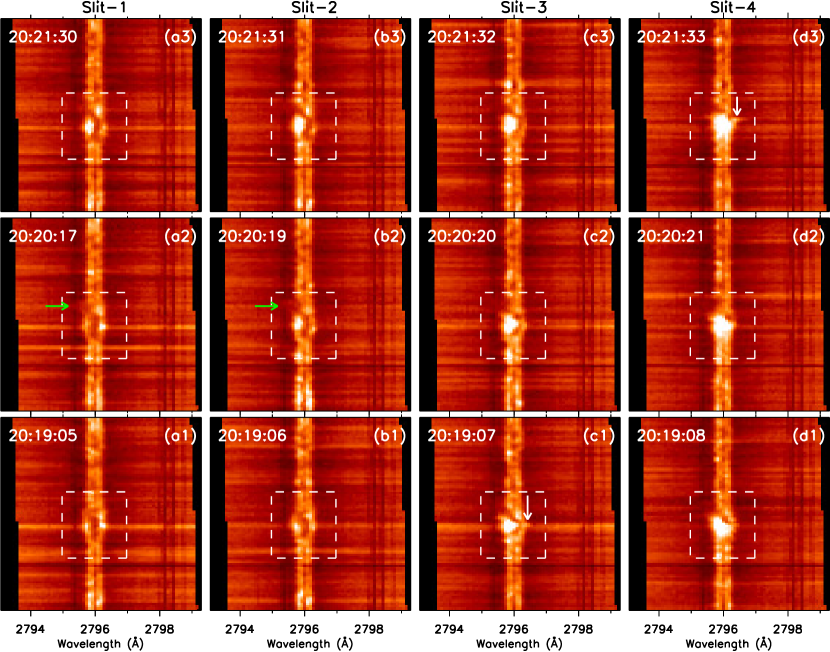
We also track the evolution of the minifilament in the Mg II k line spectra, along the four different slit positions marked in Figure 4a. The slit spectra of the minifilament and the JBP are displayed in Figure 5, at three times. The spectra along the slit position ‘1’ show the Doppler shifts of the minifilament as the JBP turns on (see inside the white boxes of Figure 5a1–a3). One can see that the minifilament gets slightly shifted towards the shorter wavelength side (e.g. in Figure 5a2 as compared to Figure 5a1), which means that the minifilament gets blue-shifted during the eruption. Similar blueshifted upflows can also be seen in the minifilament in the spectra from slit position ‘2’ (green arrow in Figure 5b2). Similar spectra for a minifilament in a coronal bright point has recently been reported by Madjarska et al. (2022). However they did not study the dynamics of the minifilament due to the lack of repeated IRIS raster scans. The spectra of slit position ‘3’ and ‘4’ show the evolution of the JBP. When the JBP forms under the erupting minifilament, the spectra shift towards the red. This redshift shows there are downflows at the location of the JPB (see white arrows in Figure 5c1 and Figure 5d3). As discussed in Section 3.4, this downflow could be caused by magnetic reconnection as a result of which a part of the material moves up and some moves down.
3.4 Inversion of Mg II spectra
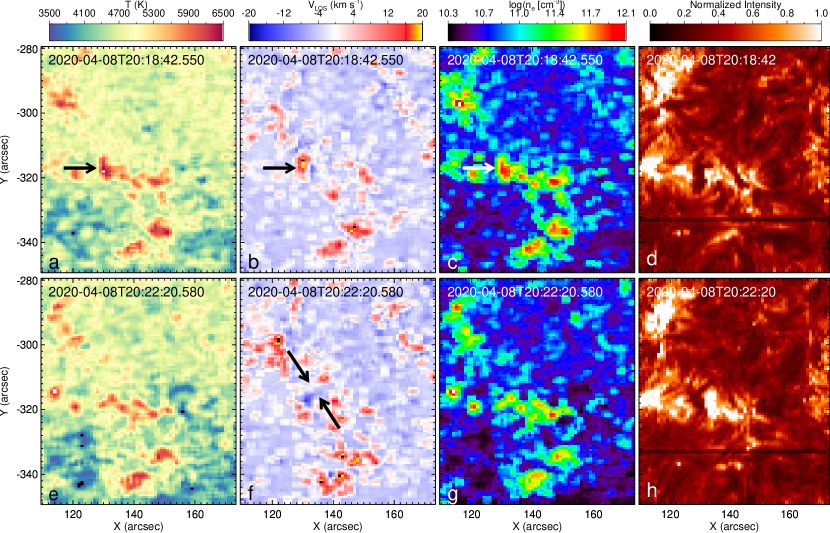
To map the thermal and dynamical properties of the minifilament eruption and jet, we applied the IRIS2 inversion code to the IRIS Mg II spectra. The details of the IRIS2 inversion code are available in the papers by Sainz Dalda et al. (2019) and de la Cruz Rodríguez et al. (2019), and at the LMSAL webpage333https://iris.lmsal.com/iris2/. Figure 6 shows, during the jet onset, the inverted temperature, line of sight velocity (VLOS) and electron density log(ne) maps of the same FOV that is shown in Figure 4(a–e). Those maps are for log() =-4.2. We also looked at maps for log() =-4.0, -4.4, -4.6, -4.8, and -5.0 (the maps for log()=-5.0 are shown in Appendix Section A). The maps show the strongest Doppler signal (JBP redshift and minifilament blueshift) at log() =-4.2. During the slow-rise phase of the minifilament eruption (from 20:10 to 20:19 UT) some parts show varying weak blueshifts of no more than 6 km s-1.
The arrows in Figures 6(a–c) point to the location of the JBP under the rising minifilament (Figure 6d). At that location, we observe enhancement in temperature and density maps. We interpret that the increase in density and temperature is due to the reconnection brightening (i.e. JBP), which forms underneath the minifilament. The inversion maps show downward (red-shift, Figure 6b) Doppler speed of 10 km s-1, and that the JBP’s Mg II bright plasma has electron density and temperature of 1012 cm-3 and 6000 K, respectively. We interpret that the redshifts result from downward flow from the reconnection above. These values correspond to the cool material in the JBP, because the Mg II line is only formed at chromospheric temperatures (de la Cruz Rodríguez et al., 2019). Because the JBP emits in AIA 211 and 94 Å, it is clear that it also contains multi-million degree coronal-temperature plasma (Lemen et al., 2012). The Mg II channel however does not detect emission from those plasmas.
As mentioned above and shown in Figure 6h, the minifilament-carrying flux rope erupts towards the solar north-west. During that stage, we observe upward (blueshift, Figure 6f) Doppler speeds in the range of 5.5 to 8.5 km s-1 with an uncertainty of 1.5 km s-1. The Dopplergram also shows the signature of weak red-shifts (1.2–2.1 1.0 km s-1) just next to the blueshifts (see black arrows in Figure 6f). Registration of the Dopplergram in Figure 6f with the Mg II spectroheliogram in Figure 6h shows that the two opposite Dopplershits are on the opposite edges of the jet spire seen in Figure 6h. The opposite line-of-sight velocities along opposite edges of the jet spire crossed by the IRIS slit is evidence that the jet spire is spinning. Viewed from its top (from the north-west toward the south-east), the jet spire is spinning clockwise about its axis, consistent with clockwise untwisting of the magnetic field in the jet spire. The evidence for the clockwise direction of the spire’s twist is that when viewed from the north-west, the spire’s blue-shifted part seen in the IRIS Mg II spectra is on the left and the weak red-shifted part is on the right.
We note that the redshift is not as strong in this case as the blueshift. Nonetheless, the redshift is slightly above the estimated uncertainties from the IRIS2 inversion. Similar, but stronger, blueshifts and redshifts across the jet spire are also observed by IRIS previously in active region jets (Cheung et al., 2015) and in large penumbral jets (Tiwari et al., 2018) and have been inferred to show twisting/untwisting motions.
3.5 Jet Speed
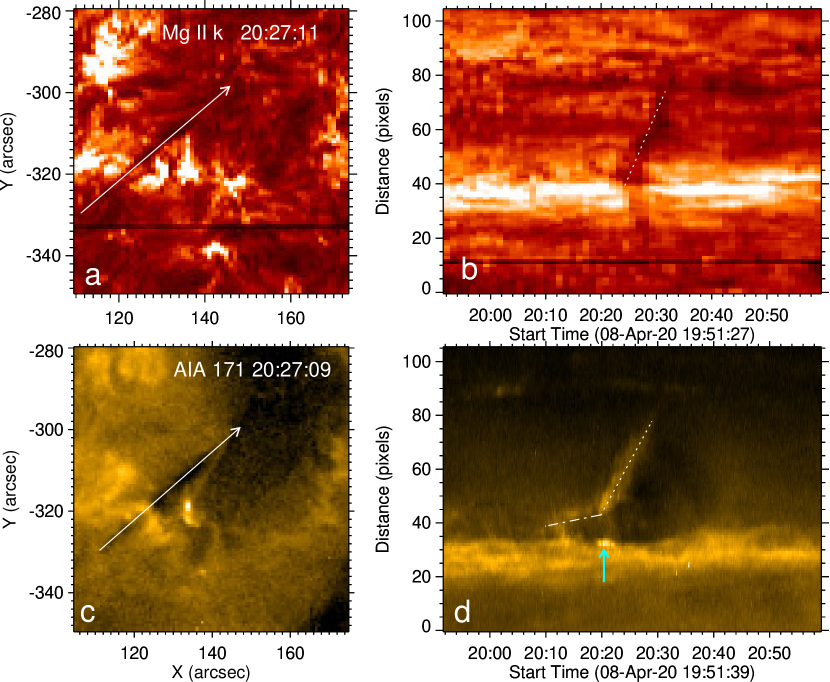
We measured the plane-of-sky speed of the jet in the Mg II spectroheliograms and AIA 171 Å images as it erupts outward. In Figures 7b and 7d, we show the time-distance maps from the diagonal cuts in Figures 7a and 7c, respectively. These cuts are along the spire of the jet. The Mg II time-distance map (Figure 7b), shows the track of the tip of the dark spire. The 171 Å time-distance map shows the trace of the bright tip of the dark spire seen in the 171 Å images. To obtain the speed, we measured the slope of the dotted straight lines drawn along the spire-tip track in each of the two time-distance maps.
The slope of the dotted line in Figure 7b gives 32 4 km s-1 for the speed of the spire’s tip in the Mg II spectroheliograms. The slope of the dotted line in Figure 7d gives 30 4 km s-1 for the speed of the spire’s tip in the AIA 171 Å images. We also estimate the speed of the minifilament during its slow-rise phase, from the slope of the dotted-dashed line; that gives to be 3.0 0.8 km s-1, which is in the range of those speeds reported by Panesar et al. (2020a) for on-disk quiet Sun jets (we notice that the minifilament slow-rise phase was not discernible in the Mg II spectroheliograms, possibly due to its coarser cadence). We repeated the measurements three times, at three different nearby locations along the jet outflows (Figures 7b and 7d) and then calculated the average and standard deviation of the three measurements. That the IRIS slit size is 0.66″ whereas the slit-step size is 1″ was taken into account in the speed measurements from the Mg II spectroheliograms. The observed plane-of-sky speeds are 5 times faster than the Doppler blueshift speeds as shown in Figures 5 and 6.
Our speed measurements show that the plane-of-sky speed of the jet spire’s tip is the same, within error bars, in both sets of images (Mg II and 171 Å). This indicates that the Mg II spectroheliograms and the 171 Å images show the same cool dark plasma component of the spire.
4 Discussion
We have investigated the dynamics and magnetic flux evolution of a central-disk jet eruption in a coronal hole region using IRIS Mg II k spectra, EUV images from SDO/AIA, together with the line of sight SDO/HMI magnetograms. This is the first detailed IRIS Mg II spectroscopic analysis of the genesis and evolution of an on-disk pre-jet minifilament. The IRIS Mg II k spectra and spectroheliograms show (i) a minifilament that contains plasma of chromospheric temperatures similar to the H filaments; (ii) the minifilament starts to form in the jet-base region 10–20 minutes before erupting to make the jet; and (iii) blueshifted upflows in the minifilament’s plasma during the eruption and concurrent redshifted downflow at the JBP that forms underneath the erupting minifilament. AIA images and HMI magnetograms show that the jet occurs at the edge of a clump of negative-polarity network magnetic flux. The jet is seated on the neutral line between the negative network flux clump and a merging small patch of positive flux. The flux cancelation at the neutral line prepares and triggers the minifilament eruption and the blowout eruption of the minifilament flux rope drives the production of the jet. During the eruption onset, the JBP forms on the neutral line on which the minifilament sat prior to its eruption. These results are the same as for larger coronal-jet-generating minifilament eruptions. Furthermore, IRIS2 inversion of the Mg II spectra shows that during the eruption onset the JPB has electron density, temperature, and downward (redshift) Doppler speed of 1012 cm-3, 6000 K, and 10 km s-1, respectively.
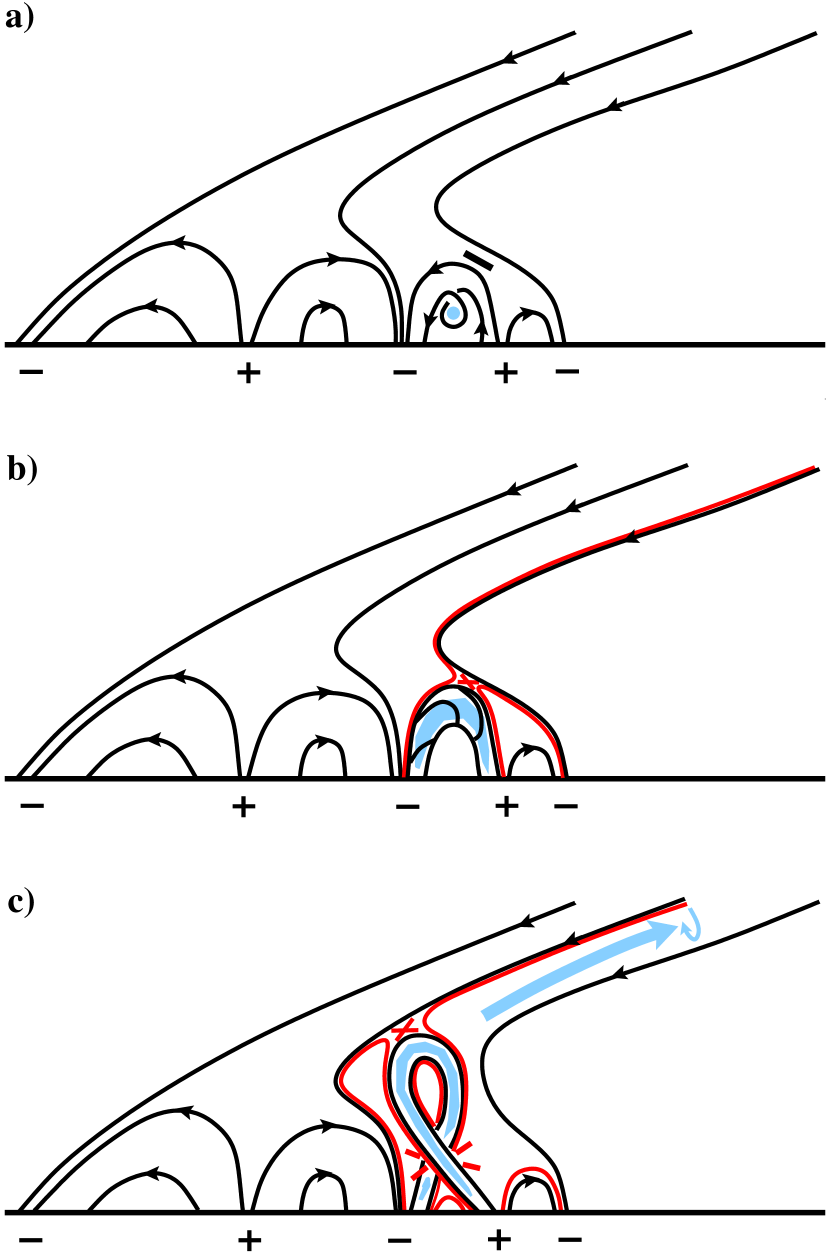
Figure 8 is a schematic of the blowout jet eruption, a schematic that is consistent with our IRIS, AIA, and HMI observations. It shows that the minifilament (shown in sky blue color) sits above the sheared-field neutral line. The cool minifilament plasma is suspended in a twisted flux rope in the sheared-field core of the jet-base magnetic anemone’s lobe that envelops the flux-cancelation PIL. The core field and flux rope have right-handed shear and twist (Figure 8a). Persistent flux cancelation at the neutral line eventually destabilizes the sheared field/flux rope that holds the cool-plasma minifilament, and that field loop erupts outward. The outer envelope of the erupting flux rope reconnects with the ambient far-reaching magnetic field at the magnetic null point (Figure 8b) via breakout reconnection (Antiochos, 1998; Wyper et al., 2017, 2018). This reconnection adds new closed field loops on the west side of the positive flux clump. We observe brightening, shown in Figure 2d, in the western lobe of the jet-base anemone. As the minifilament-carrying flux rope continues to erupt, we speculate that it kinks (writhes) so that the top of the kink loop rotates clockwise. Clockwise rotation of the top of the kink loop results from the right-handed twist in the flux rope going into right-handed writhe twist, which results in the positive-foot leg rotating in front of the negative leg (Figure 8c). Such kinking and/or writhing in large-scale erupting flux ropes has been previously reported in observations and modelling (e.g. Török & Kliem, 2005). Magnetic reconnection occurs between the legs of the writhing field (at the lower X in Figure 8c), which results in a brightening (the JBP that we observe in the AIA images and Mg II spectra; Figures 2d and 4d) at the neutral line. Due to the writhing (kinking), the direction of the magnetic field in the top of erupting flux-rope becomes opposite to that of overlying (presumed open) far-reaching ambient magnetic field, which enables the top of the erupting kink to reconnect with the encountered far-reaching field at the upper X in Figure 8c. This reconnection (1) makes a newly-reconnected loop that has one foot east of the erupting minifilament and (2) transfers right-handed twist to the newly-opened (red) field lines of the spire. The cool-plasma and hot reconnection-heated plasma escape along the newly-reconnected untwisting far-reaching field and appears as the jet spire. We also observe some faint brightening in AIA images at the foot of the western newly-reconnected small loop (downward cyan arrow in Figure 2d). Thus, our results are consistent with our earlier observations of typical coronal jets (Panesar et al., 2016b, 2017; Sterling et al., 2017; Panesar et al., 2018a) and jetlets (Panesar et al., 2018b, 2019). Those are also seen to be driven by minifilament eruptions and to have at the base a minifilament flux-rope core that is built and triggered to erupt by flux cancelation. The schematic is intended to depict the production of the robust jet spire that extends to the northwest from the jet base, the production of the JBP, and the production of the brightening east and west of the JBP.
The lifetime of the jet is 10 minutes, which is similar to that of coronal-hole jets (Shimojo et al., 1996; Savcheva et al., 2007; Panesar et al., 2018a; McGlasson et al., 2019). Our jet spire extends outward with an average speed of 30 4 km s-1, a third the speed of average coronal jets (e.g. Panesar et al., 2016b, 2018a) and jetlets (Panesar et al., 2018b). However, the speeds of some of jets and jetlets measured by Panesar et al. (2016b, 2018a, 2018b) are in the range of 30–50 km s-1.
During the jet onset, we observe along the spire blueshift Doppler speeds (in Mg II k) in the range 5.5 to 8.5 km s-1. Just next to the blueshift, the Dopplergrams also show some weak redshift Doppler speeds (in the range 1.2-2.1 km s-1). The presence of both signs of Doppler shift along the jet spire could be from untwisting motion of the magnetic field in the jet spire, albeit the redshift in this case is much weaker than the blueshift. The presence of blueshift and redshift next to each other leads us to assume clockwise writhing of the minifilament flux rope as it erupts. The untwisting/spinning motion in coronal jets have been seen in many observations (e.g. Pike & Mason, 1998; Kamio et al., 2010; Curdt et al., 2012; Moore et al., 2015; Panesar et al., 2016a; Sterling et al., 2016, 2019) and jet models (e.g. Pariat et al., 2015; Wyper et al., 2018; Zhelyazkov et al., 2018; Wyper et al., 2019; Doyle et al., 2019).
In the past, IRIS spectra have captured stronger both side-by-side opposite Doppler shifts in active region jets (e.g. Cheung et al., 2015; Lu et al., 2019; Ruan et al., 2019; Tiwari et al., 2019; Zhang et al., 2021a) and in large penumbral jets (Tiwari et al., 2018). None of these studies focus on the presence and dynamics of cool-plasma structure that often appears in the jet base in typical coronal jets. In this regard, the present paper is the first detailed study of an on-disk pre-jet minifilament and its jet-generating eruption using IRIS’s Mg II k line spectra. We note that capturing the spatio-temporal evolution of a coronal jet, including its jet-base region and jet spire, under the IRIS slit is difficult due to the required high temporal cadence of the data for studying jet dynamics. Furthermore, due to the large size of normal-size coronal jets and the uncertainty of when and where they occur, often only a small portion of the jet is captured. Future jet observations from multi-slit instruments such as MUSE (De Pontieu et al., 2020) that can scan a bigger FOV at a high temporal cadence and dense raster will give us opportunity to study a larger sample of jets in EUV channels. The high-resolution observations of the Swedish Solar Telescope, and DKIST, together with IRIS, will shed more light on the formation mechanism of chromospheric structures such as pre-jet minifilaments. Again, however, the main challenge would remain to capture such events, like the one we studied here, during an observation, due to smaller FOV and limited raster cadence of ground-based observations.
The appearance of our minifilament in the Mg II line is similar to such small-scale filaments observed in H (Hermans & Martin, 1986; Wang et al., 2000; Lee et al., 2003): the filaments reside above magnetic neutral lines at edges of network flux clumps in quiet-Sun regions; they erupt during flux cancelation at the neutral line; the filaments stop reappearing and erupting when all of the minority-polarity magnetic flux patch has canceled. Our observations are in agreement with the above mentioned studies, which indicate that a minifilament is a small-scale analog of larger-scale filaments. The main differences are that in the above-mentioned studies H minifilaments were not necessarily accompanied by typical coronal jets, and that they did not include spectroscopic observations of minifilaments. Furthermore, in the present work we are able to invert the Mg II spectra using IRIS2 technique to determine velocities, temperatures, and densities of the pre-jet minifilament and the JBP.
5 Conclusion
Using IRIS Mg II rastered spectra and spectroheliograms, and SDO data (AIA EUV images and HMI magnetograms), we investigate the formation of a minifilament in an on-disk coronal hole and the detailed dynamics of the minifilament’s eruption that makes a coronal jet. The minifilament forms on and erupts from a magnetic neutral line at which flux cancelation is occurring in the base of the jet. In this way, the eruption of the observed small-scale coronal jet appears to work in the same way as the blowout minifilament eruptions that make many other coronal jets. We suppose that, a la van Ballegooijen & Martens (1989), the flux cancelation gradually builds up shear in the magnetic field that holds the minifilament of cool plasma and makes a minifilament-carrying flux rope from that sheared field, and that, a la Moore & Roumeliotis (1992) the flux cancelation eventually triggers the flux rope’s blowout eruption.
To our knowledge, our coronal jet is the first whose dynamics is fully captured in rastered IRIS spectra and analyzed in detail. This IRIS jet shows all of the characteristics of typical coronal jets. In particular, we have found direct evidence of flux cancelation at the underlying neutral line forming a sheared field/flux rope holding a minifilament and triggering that core field’s jet-generating eruption. Some minifilament plasma is blueshifted during the eruption, while some is redshifted in down-flow at the JBP. We expect that similar observations, including UV spectra, of jets of all sizes, including jetlets and jet-like campfires (Panesar et al., 2021), will further clarify jet eruption mechanisms, the similarity of jets of all sizes, and whether and how network jets and jetlets might drive coronal heating.
We thank the referee for useful comments that improved the presentation of the manuscript. NKP acknowledges support from NASA’s HGI, SDO/AIA, and HSR grants. SKT gratefully acknowledges support by NASA’s HGI and Hinode grants. RLM and ACS were supported by funding from NASA’s HGI and HSR grants. BDP was supported by NASA contract NNG09FA40C (IRIS). We acknowledge the use of IRIS and SDO/AIA/HMI data. AIA is an instrument onboard the Solar Dynamics Observatory, a mission for NASA’s Living With a Star program. IRIS is a NASA small explorer mission developed and operated by LMSAL with mission operations executed at NASA Ames Research center and major contributions to downlink communications funded by ESA and the Norwegian Space Centre. This work has made use of NASA ADSABS. We thank Alberto Sainz Dalda for discussions on IRIS2 inversion code.
References
- Adams et al. (2014) Adams, M., Sterling, A. C., Moore, R. L., & Gary, G. A. 2014, ApJ, 783, 11, doi: 10.1088/0004-637X/783/1/11
- Alexander & Fletcher (1999) Alexander, D., & Fletcher, L. 1999, Sol. Phys., 190, 167, doi: 10.1023/A:1005213826793
- Antiochos (1998) Antiochos, S. K. 1998, ApJ, 502, L181, doi: 10.1086/311507
- Anusha et al. (2017) Anusha, L. S., Solanki, S. K., Hirzberger, J., & Feller, A. 2017, A&A, 598, A47, doi: 10.1051/0004-6361/201527738
- Bernasconi et al. (2005) Bernasconi, P. N., Rust, D. M., & Hakim, D. 2005, Sol. Phys., 228, 97, doi: 10.1007/s11207-005-2766-y
- Cheung et al. (2015) Cheung, M. C. M., De Pontieu, B., Tarbell, T. D., et al. 2015, ApJ, 801, 83, doi: 10.1088/0004-637X/801/2/83
- Cirtain et al. (2007) Cirtain, J. W., Golub, L., Lundquist, L., et al. 2007, Science, 318, 1580, doi: 10.1126/science.1147050
- Couvidat et al. (2016) Couvidat, S., Schou, J., Hoeksema, J. T., et al. 2016, Sol. Phys., 291, 1887, doi: 10.1007/s11207-016-0957-3
- Curdt et al. (2012) Curdt, W., Tian, H., & Kamio, S. 2012, Sol. Phys., 280, 417, doi: 10.1007/s11207-012-9940-9
- de la Cruz Rodríguez et al. (2019) de la Cruz Rodríguez, J., Leenaarts, J., Danilovic, S., & Uitenbroek, H. 2019, A&A, 623, A74, doi: 10.1051/0004-6361/201834464
- De Pontieu et al. (2020) De Pontieu, B., Martínez-Sykora, J., Testa, P., et al. 2020, ApJ, 888, 3, doi: 10.3847/1538-4357/ab5b03
- De Pontieu et al. (2014) De Pontieu, B., Title, A. M., Lemen, J. R., et al. 2014, Sol. Phys., 289, 2733, doi: 10.1007/s11207-014-0485-y
- Doyle et al. (2019) Doyle, L., Wyper, P. F., Scullion, E., et al. 2019, ApJ, 887, 246, doi: 10.3847/1538-4357/ab5d39
- Freeland & Handy (1998) Freeland, S. L., & Handy, B. N. 1998, Sol. Phys., 182, 497, doi: 10.1023/A:1005038224881
- Gaizauskas et al. (1997) Gaizauskas, V., Zirker, J. B., Sweetland, C., & Kovacs, A. 1997, ApJ, 479, 448, doi: 10.1086/512788
- Green et al. (2011) Green, L. M., Kliem, B., & Wallace, A. J. 2011, A&A, 526, A2, doi: 10.1051/0004-6361/201015146
- Hassanin et al. (2022) Hassanin, A., Kliem, B., Seehafer, N., & Török, T. 2022, ApJ, 929, L23, doi: 10.3847/2041-8213/ac64a9
- Hermans & Martin (1986) Hermans, L. M., & Martin, S. F. 1986, in Coronal and Prominence Plasmas, ed. A. I. Poland, 369
- Hong et al. (2011) Hong, J., Jiang, Y., Zheng, R., et al. 2011, ApJ, 738, L20, doi: 10.1088/2041-8205/738/2/L20
- Hong et al. (2019) Hong, J., Yang, J., Chen, H., et al. 2019, ApJ, 874, 146, doi: 10.3847/1538-4357/ab0c9d
- Huang et al. (2012) Huang, Z., Madjarska, M. S., Doyle, J. G., & Lamb, D. A. 2012, A&A, 548, A62, doi: 10.1051/0004-6361/201220079
- Innes et al. (2016) Innes, D. E., Bučík, R., Guo, L.-J., & Nitta, N. 2016, Astronomische Nachrichten, 337, 1024, doi: 10.1002/asna.201612428
- Joshi et al. (2021) Joshi, R., Schmieder, B., Tei, A., et al. 2021, A&A, 645, A80, doi: 10.1051/0004-6361/202039229
- Kaithakkal & Solanki (2019) Kaithakkal, A. J., & Solanki, S. K. 2019, A&A, 622, A200, doi: 10.1051/0004-6361/201833770
- Kamio et al. (2010) Kamio, S., Curdt, W., Teriaca, L., Inhester, B., & Solanki, S. K. 2010, A&A, 510, L1, doi: 10.1051/0004-6361/200913269
- Kumar et al. (2018) Kumar, P., Karpen, J. T., Antiochos, S. K., et al. 2018, ApJ, 854, 155, doi: 10.3847/1538-4357/aaab4f
- Kumar et al. (2019) —. 2019, ApJ, 873, 93, doi: 10.3847/1538-4357/ab04af
- Lee et al. (2020) Lee, K.-S., Hara, H., Watanabe, K., et al. 2020, ApJ, 895, 42, doi: 10.3847/1538-4357/ab8bce
- Lee et al. (2003) Lee, S., Yun, H. S., Chae, J., & Goode, P. R. 2003, Journal of Korean Astronomical Society, 36, S21, doi: 10.5303/JKAS.2003.36.spc1.021
- Lemen et al. (2012) Lemen, J. R., Title, A. M., Akin, D. J., et al. 2012, Sol. Phys., 275, 17, doi: 10.1007/s11207-011-9776-8
- Lu et al. (2019) Lu, L., Feng, L., Li, Y., et al. 2019, ApJ, 887, 154, doi: 10.3847/1538-4357/ab530c
- Mackay et al. (2010) Mackay, D. H., Karpen, J. T., Ballester, J. L., Schmieder, B., & Aulanier, G. 2010, Space Sci. Rev., 151, 333, doi: 10.1007/s11214-010-9628-0
- Madjarska et al. (2022) Madjarska, M. S., Mackay, D. H., Galsgaard, K., Wiegelmann, T., & Xie, H. 2022, A&A, 660, A45, doi: 10.1051/0004-6361/202142439
- Martin (1986) Martin, S. F. 1986, in NASA Conference Publication, Vol. 2442, NASA Conference Publication, ed. A. I. Poland
- Martin (1998) Martin, S. F. 1998, Sol. Phys., 182, 107, doi: 10.1023/A:1005026814076
- Martres et al. (1966) Martres, M. J., Michard, R., & Soru-Iscovici. 1966, Annales d’Astrophysique, 29, 249
- Mazumder (2019) Mazumder, R. 2019, Astronomy Reports, 63, 404, doi: 10.1134/S1063772919050044
- McGlasson et al. (2019) McGlasson, R. A., Panesar, N. K., Sterling, A. C., & Moore, R. L. 2019, ApJ, 882, 16, doi: 10.3847/1538-4357/ab2fe3
- Moore et al. (2010) Moore, R. L., Cirtain, J. W., Sterling, A. C., & Falconer, D. A. 2010, ApJ, 720, 757, doi: 10.1088/0004-637X/720/1/757
- Moore & Roumeliotis (1992) Moore, R. L., & Roumeliotis, G. 1992, in Lecture Notes in Physics, Berlin Springer Verlag, Vol. 399, IAU Colloq. 133: Eruptive Solar Flares, ed. Z. Svestka, B. V. Jackson, & M. E. Machado, 69
- Moore et al. (2015) Moore, R. L., Sterling, A. C., & Falconer, D. A. 2015, ApJ, 806, 11, doi: 10.1088/0004-637X/806/1/11
- Moore et al. (2013) Moore, R. L., Sterling, A. C., Falconer, D. A., & Robe, D. 2013, ApJ, 769, 134, doi: 10.1088/0004-637X/769/2/134
- Moore et al. (2018) Moore, R. L., Sterling, A. C., & Panesar, N. K. 2018, ApJ, 859, 3, doi: 10.3847/1538-4357/aabe79
- Muglach (2021) Muglach, K. 2021, ApJ, 909, 133, doi: 10.3847/1538-4357/abd5ad
- Mulay et al. (2016) Mulay, S. M., Tripathi, D., Del Zanna, G., & Mason, H. 2016, A&A, 589, A79, doi: 10.1051/0004-6361/201527473
- Müller et al. (2017) Müller, D., Nicula, B., Felix, S., et al. 2017, A&A, 606, A10, doi: 10.1051/0004-6361/201730893
- Nisticò et al. (2009) Nisticò, G., Bothmer, V., Patsourakos, S., & Zimbardo, G. 2009, Sol. Phys., 259, 87, doi: 10.1007/s11207-009-9424-8
- Panesar et al. (2020a) Panesar, N. K., Moore, R. L., & Sterling, A. C. 2020a, ApJ, 894, 104, doi: 10.3847/1538-4357/ab88ce
- Panesar et al. (2016a) Panesar, N. K., Sterling, A. C., & Moore, R. L. 2016a, ApJ, 822, L23, doi: 10.3847/2041-8205/822/2/L23
- Panesar et al. (2017) —. 2017, ApJ, 844, 131, doi: 10.3847/1538-4357/aa7b77
- Panesar et al. (2018a) —. 2018a, ApJ, 853, 189, doi: 10.3847/1538-4357/aaa3e9
- Panesar et al. (2016b) Panesar, N. K., Sterling, A. C., Moore, R. L., & Chakrapani, P. 2016b, ApJ, 832, L7, doi: 10.3847/2041-8205/832/1/L7
- Panesar et al. (2018b) Panesar, N. K., Sterling, A. C., Moore, R. L., et al. 2018b, ApJ, 868, L27, doi: 10.3847/2041-8213/aaef37
- Panesar et al. (2021) Panesar, N. K., Tiwari, S. K., Berghmans, D., et al. 2021, ApJ, 921, L20, doi: 10.3847/2041-8213/ac3007
- Panesar et al. (2020b) Panesar, N. K., Tiwari, S. K., Moore, R. L., & Sterling, A. C. 2020b, ApJ, 897, L2, doi: 10.3847/2041-8213/ab9ac1
- Panesar et al. (2019) Panesar, N. K., Sterling, A. C., Moore, R. L., et al. 2019, ApJ, 887, L8, doi: 10.3847/2041-8213/ab594a
- Pariat et al. (2009) Pariat, E., Antiochos, S. K., & DeVore, C. R. 2009, ApJ, 691, 61, doi: 10.1088/0004-637X/691/1/61
- Pariat et al. (2015) Pariat, E., Dalmasse, K., DeVore, C. R., Antiochos, S. K., & Karpen, J. T. 2015, A&A, 573, A130, doi: 10.1051/0004-6361/201424209
- Pesnell et al. (2012) Pesnell, W. D., Thompson, B. J., & Chamberlin, P. C. 2012, Sol. Phys., 275, 3, doi: 10.1007/s11207-011-9841-3
- Pike & Mason (1998) Pike, C. D., & Mason, H. E. 1998, Sol. Phys., 182, 333, doi: 10.1023/A:1005065704108
- Poisson et al. (2020) Poisson, M., Bustos, C., López Fuentes, M., Mandrini, C. H., & Cristiani, G. D. 2020, Advances in Space Research, 65, 1629, doi: 10.1016/j.asr.2019.09.026
- Priest & Syntelis (2021) Priest, E. R., & Syntelis, P. 2021, A&A, 647, A31, doi: 10.1051/0004-6361/202038917
- Raouafi & Stenborg (2014) Raouafi, N.-E., & Stenborg, G. 2014, ApJ, 787, 118, doi: 10.1088/0004-637X/787/2/118
- Raouafi et al. (2016) Raouafi, N. E., Patsourakos, S., Pariat, E., et al. 2016, Space Sci. Rev., 201, 1, doi: 10.1007/s11214-016-0260-5
- Ruan et al. (2019) Ruan, G., Schmieder, B., Masson, S., et al. 2019, ApJ, 883, 52, doi: 10.3847/1538-4357/ab3657
- Sainz Dalda et al. (2019) Sainz Dalda, A., de la Cruz Rodríguez, J., De Pontieu, B., & Gošić, M. 2019, ApJ, 875, L18, doi: 10.3847/2041-8213/ab15d9
- Savcheva et al. (2007) Savcheva, A., Cirtain, J., Deluca, E. E., et al. 2007, PASJ, 59, 771, doi: 10.1093/pasj/59.sp3.S771
- Scherrer et al. (2012) Scherrer, P. H., Schou, J., Bush, R. I., et al. 2012, Sol. Phys., 275, 207, doi: 10.1007/s11207-011-9834-2
- Schmieder (2022) Schmieder, B. 2022, arXiv e-prints, arXiv:2201.11541. https://arxiv.org/abs/2201.11541
- Schmieder et al. (2021) Schmieder, B., Joshi, R., & Chandra, R. 2021, arXiv e-prints, arXiv:2111.09002. https://arxiv.org/abs/2111.09002
- Schmieder et al. (2013) Schmieder, B., Guo, Y., Moreno-Insertis, F., et al. 2013, A&A, 559, A1, doi: 10.1051/0004-6361/201322181
- Schou et al. (2012) Schou, J., Scherrer, P. H., Bush, R. I., et al. 2012, Sol. Phys., 275, 229, doi: 10.1007/s11207-011-9842-2
- Shen (2021) Shen, Y. 2021, Proceedings of the Royal Society of London Series A, 477, 217, doi: 10.1098/rspa.2020.0217
- Shen et al. (2012) Shen, Y., Liu, Y., Su, J., & Deng, Y. 2012, ApJ, 745, 164, doi: 10.1088/0004-637X/745/2/164
- Shibata & Magara (2011) Shibata, K., & Magara, T. 2011, Living Reviews in Solar Physics, 8, 6, doi: 10.12942/lrsp-2011-6
- Shibata et al. (1992) Shibata, K., Ishido, Y., Acton, L. W., et al. 1992, PASJ, 44, L173
- Shimojo et al. (1996) Shimojo, M., Hashimoto, S., Shibata, K., et al. 1996, PASJ, 48, 123, doi: 10.1093/pasj/48.1.123
- Solanki et al. (2019) Solanki, R., Srivastava, A. K., Rao, Y. K., & Dwivedi, B. N. 2019, Sol. Phys., 294, 68, doi: 10.1007/s11207-019-1453-3
- Sterling et al. (2019) Sterling, A. C., Harra, L. K., Moore, R. L., & Falconer, D. A. 2019, ApJ, 871, 220, doi: 10.3847/1538-4357/aaf1d3
- Sterling et al. (2015) Sterling, A. C., Moore, R. L., Falconer, D. A., & Adams, M. 2015, Nature, 523, 437, doi: 10.1038/nature14556
- Sterling et al. (2016) Sterling, A. C., Moore, R. L., Falconer, D. A., et al. 2016, ApJ, 821, 100, doi: 10.3847/0004-637X/821/2/100
- Sterling et al. (2017) Sterling, A. C., Moore, R. L., Falconer, D. A., Panesar, N. K., & Martinez, F. 2017, ApJ, 844, 28, doi: 10.3847/1538-4357/aa7945
- Sterling et al. (2022) Sterling, A. C., Moore, R. L., & Panesar, N. K. 2022, ApJ, 927, 127, doi: 10.3847/1538-4357/ac473f
- Syntelis & Priest (2021) Syntelis, P., & Priest, E. R. 2021, A&A, 649, A101, doi: 10.1051/0004-6361/202140474
- Tiwari et al. (2014) Tiwari, S. K., Alexander, C. E., Winebarger, A. R., & Moore, R. L. 2014, ApJ, 795, L24, doi: 10.1088/2041-8205/795/1/L24
- Tiwari et al. (2018) Tiwari, S. K., Moore, R. L., De Pontieu, B., et al. 2018, ApJ, 869, 147, doi: 10.3847/1538-4357/aaf1b8
- Tiwari et al. (2019) Tiwari, S. K., Panesar, N. K., Moore, R. L., et al. 2019, ApJ, 887, 56, doi: 10.3847/1538-4357/ab54c1
- Török & Kliem (2005) Török, T., & Kliem, B. 2005, ApJ, 630, L97, doi: 10.1086/462412
- van Ballegooijen & Martens (1989) van Ballegooijen, A. A., & Martens, P. C. H. 1989, ApJ, 343, 971, doi: 10.1086/167766
- Wang et al. (2000) Wang, J., Li, W., Denker, C., et al. 2000, ApJ, 530, 1071, doi: 10.1086/308377
- Wang et al. (1998) Wang, Y.-M., Sheeley, Jr., N. R., Socker, D. G., et al. 1998, ApJ, 508, 899, doi: 10.1086/306450
- Wyper et al. (2017) Wyper, P. F., Antiochos, S. K., & DeVore, C. R. 2017, Nature, 544, 452, doi: 10.1038/nature22050
- Wyper et al. (2018) Wyper, P. F., DeVore, C. R., & Antiochos, S. K. 2018, ApJ, 852, 98, doi: 10.3847/1538-4357/aa9ffc
- Wyper et al. (2019) —. 2019, MNRAS, 490, 3679, doi: 10.1093/mnras/stz2674
- Yang et al. (2019) Yang, B., Yang, J., Bi, Y., et al. 2019, ApJ, 887, 220, doi: 10.3847/1538-4357/ab557e
- Yang et al. (2020) Yang, J., Hong, J., Li, H., & Jiang, Y. 2020, ApJ, 900, 158, doi: 10.3847/1538-4357/aba7c0
- Yokoyama & Shibata (1995) Yokoyama, T., & Shibata, K. 1995, Nature, 375, 42, doi: 10.1038/375042a0
- Young & Muglach (2014a) Young, P. R., & Muglach, K. 2014a, Sol. Phys., 289, 3313, doi: 10.1007/s11207-014-0484-z
- Young & Muglach (2014b) —. 2014b, PASJ, 66, S12, doi: 10.1093/pasj/psu088
- Zhang et al. (2021a) Zhang, Q. M., Huang, Z. H., Hou, Y. J., et al. 2021a, A&A, 647, A113, doi: 10.1051/0004-6361/202038924
- Zhang et al. (2021b) Zhang, Y.-J., Zhang, Q.-M., Dai, J., Xu, Z., & Ji, H.-S. 2021b, Research in Astronomy and Astrophysics, 21, 262, doi: 10.1088/1674-4527/21/10/262
- Zhelyazkov et al. (2018) Zhelyazkov, I., Zaqarashvili, T. V., Ofman, L., & Chandra, R. 2018, Advances in Space Research, 61, 628, doi: 10.1016/j.asr.2017.06.003
Appendix A Appendix Information
Figure 9 shows the inverted temperature, line of sight velocity (VLOS) and electron density log(ne) maps of the same time and FOV as shown in Figure 6, but for log() =-5.0. The observed Doppler speeds are of the same order as found for log() =-4.2. The average temperature and electron density of the JBP are 6300 K and 2.8 1012 cm-3, respectively.