A JWST/NIRCam Study of Key Contributors to Reionization: The Star-forming and Ionizing Properties of UV-faint Galaxies
Abstract
Spitzer/IRAC imaging has revealed that the brightest galaxies often exhibit young ages and strong nebular line emission, hinting at high ionizing efficiency among early galaxies. However, IRAC’s limited sensitivity has long hindered efforts to study the fainter, more numerous population often thought largely responsible for reionization. Here we use CEERS JWST/NIRCam data to characterize 116 UV-faint (median M) galaxies. The SEDs are typically dominated by young (10–50 Myr), low-mass () stellar populations, and we find no need for extremely high stellar masses (). Considering previous studies of UV-bright (M) galaxies, we find evidence for a strong (5–10) increase in specific star formation rate toward lower luminosities (median sSFR=103 Gyr-1 in CEERS). The larger sSFRs imply a more dominant contribution from OB stars in the relatively numerous UV-faint population, perhaps suggesting that these galaxies are very efficient ionizing agents (median erg-1 Hz). In spite of the much larger sSFRs, we find little increase in [OIII]H EWs towards fainter MUV (median 780 ). If confirmed, this may indicate that a substantial fraction of our CEERS galaxies possess extremely low metallicities (3% ) where [OIII] emission is suppressed. Alternatively, high ionizing photon escape fractions or bursty star formation histories can also weaken the nebular lines in a subset of our CEERS galaxies. While the majority of our objects are very blue (median ), we identify a significant tail of very dusty galaxies () at 0.5 which may contribute significantly to the star formation rate density.
keywords:
galaxies: high-redshift – dark ages, reionization, first stars – galaxies: evolution1 Introduction
The epoch of hydrogen reionization reflects when galaxy formation began impacting the large-scale ionization state of the Universe (Dayal & Ferrara, 2018; Robertson, 2022). Current observational constraints imply that nearly all hydrogen atoms in the intergalactic medium were reionized by (Bosman et al., 2022), with this process approximately halfway complete by (e.g. Davies et al., 2018; Mason et al., 2018; Jung et al., 2020; Planck Collaboration et al., 2020; Wang et al., 2020; Yang et al., 2020; Goto et al., 2021). Given the rapidly declining quasar luminosity function at , it has long been thought that star-forming galaxies are likely the dominant contributors to reionization (e.g. Madau et al., 1999; Ciardi et al., 2000), motivating much effort to characterize these systems in detail.
Thanks to a large collection of dedicated surveys, our initial understanding of galaxies present during the reionization era has emerged over the past two decades. In the mid-to-late 2000s, the first small samples of Lyman-break galaxies at were identified in deep near-infrared images taken with ground-based facilities as well as the NICMOS camera on the Hubble Space Telescope (HST; Bouwens et al. 2004; Bouwens et al. 2008; Kneib et al. 2004; Yan & Windhorst 2004; Mannucci et al. 2007; Stanway et al. 2008b). Our census of these early galaxies advanced tremendously in the 2010s following the installation of the Wide Field Camera 3 (WFC3) on HST, affording an 40 increased near-IR survey efficiency relative to NICMOS. To date, several deep HST imaging surveys have been conducted in both blind and gravitationally lensed fields (Bouwens et al., 2011; Grogin et al., 2011; Koekemoer et al., 2011; Trenti et al., 2011; Windhorst et al., 2011; Illingworth et al., 2013; Lotz et al., 2017; Coe et al., 2019) resulting in the discovery of approximately 1000 Lyman-break galaxies at with intrinsic UV continuum luminosities spanning three orders of magnitude (; e.g. McLure et al. 2013; Atek et al. 2015; Bouwens et al. 2015, 2021; Finkelstein et al. 2015, 2022a; McLeod et al. 2016; Livermore et al. 2017; Ishigaki et al. 2018; Oesch et al. 2018; Salmon et al. 2020). The derived UV continuum luminosity functions at have revealed a characteristic UV luminosity () equivalent to with a steep faint-end slope () that steadily steepens with increasing redshift (e.g. Finkelstein et al., 2015; Ishigaki et al., 2018; Bouwens et al., 2021), indicating a highly dominant population of UV-faint () galaxies in the early Universe. From the WFC3 data, the UV continuum slopes of galaxies were typically found to be very blue with (where ; e.g. McLure et al. 2011; Dunlop et al. 2012; Finkelstein et al. 2012; Rogers et al. 2013; Bouwens et al. 2014; Bhatawdekar & Conselice 2021), suggesting little-to-no dust attenuation in most systems. However, the rest-UV regime probed by WFC3 lacked the information necessary to characterize the stellar populations dominating the observed spectral energy distributions (SEDs).
Prior to the launch of the James Webb Space Telescope (JWST), our primary insights into the ages and stellar masses of galaxies have come from the Infrared Array Camera (IRAC) on board the Spitzer Space Telescope which could probe the rest-optical emission of reionization-era systems. Early studies frequently found strong photometric excesses between the near-infrared and IRAC 3–5m data of faint galaxies, which was at the time interpreted as extremely strong Balmer breaks indicative of very old (300 Myr) and massive () stellar populations (e.g. Egami et al., 2005; Eyles et al., 2007; Stark et al., 2009; González et al., 2010). Not only did this imply extremely rapid stellar mass growth at , but also little evolution in galaxy specific star formation rates (sSFRs) towards earlier epochs in contrast to expectations (e.g. Weinmann et al., 2011; Davé et al., 2011, 2012; Dayal & Ferrara, 2012).
By the early 2010s it was realized that high equivalent width (EW) rest-optical nebular emission lines (e.g. H, H, and [OIII]4959,5007) can significantly boost the IRAC broadband photometry from high-redshift galaxies (e.g. Schaerer & de Barros, 2009, 2010; Ono et al., 2010; Labbé et al., 2013; Stark et al., 2013; de Barros et al., 2014; González et al., 2014; Smit et al., 2014). This meant that the IRAC photometric excesses seen in many faint galaxies could potentially be explained by either a very strong Balmer break, or very high EW lines powered by a much younger (50 Myr), lower-mass () stellar population. Because higher EW nebular lines are typically associated with more efficient production of hydrogen ionizing photons (e.g. Chevallard et al., 2018; Tang et al., 2019), these alternative solutions could have substantial implications for our understanding of how galaxies contributed to reionization. Unfortunately, breaking this degeneracy proved to be very challenging given that IRAC data suffered from inadequate sensitivity ( at 5 in the deepest fields), strong source confusion due to its broad point spread function (FWHM2″), and limited sampling of the rest-optical SED with only two filters at 3–5m. The sensitivity limitations of IRAC alone frequently forced studies of faint () reionization-era galaxy SEDs to resort to stacking, leaving much uncertainty on the demographics of ages, stellar masses, sSFRs, and nebular line strengths among this population. While deep IRAC data in lensing fields enabled studies to overcome some of these issues (e.g. Huang et al., 2016; Strait et al., 2020), the numbers of UV-faint galaxies detected at high IRAC S/N remained small, necessitating further work to characterize this population.
The successful development, launch, and commissioning of JWST now provides the opportunity to completely transform our understanding of typical (; ) reionization-era galaxies. In this work, we specifically focus on utilizing the greatly improved 1–5m imaging capabilities of JWST/NIRCam. By reaching 5 depths of with just 1 hour integrations, NIRCam is 30,000 more sensitive than IRAC at 3–5m ( in 120 hours; e.g. Labbé et al. 2013; Oesch et al. 2013). Such a dramatic gain in sensitivity would alone revolutionize our ability to characterize the rest-optical SEDs of individual faint reionization-era galaxies. Thankfully, JWST/NIRCam also provides two other key improvements over Spitzer/IRAC enabling us to push our understanding of systems even further. The large mirror size of JWST results in a 15-fold improvement in angular resolution over Spitzer at 3–5m, greatly mitigating past source confusion issues that would cause large numbers of viable candidates to be discarded from rest-optical analyses. Finally, NIRCam provides a large suite of medium- and broad-band filters at 3–5m which not only improves photometric redshift precision (since the strongest nebular lines impact different bands at different redshifts), but also greatly alleviates degeneracies in interpreting photometric excesses as arising from strong Balmer breaks versus very high-EW nebular lines. Consequently, NIRCam data is able to substantially clarify not only the star-forming properties of UV-faint reionization-era galaxies, but their ionizing properties as well.
Our primary goal in this work is to begin developing a much clearer picture of the physical properties (e.g. ages, stellar masses, sSFRs, nebular line EWs, and dust optical depths) of typical (sub-) reionization-era galaxies by characterizing their rest-UVoptical SEDs in detail with JWST/NIRCam imaging data. To do so, we utilize data from the Cosmic Evolution Early Release Science (CEERS111https://ceers.github.io/; Finkelstein et al. 2017, 2023) survey which provides deep NIRCam imaging in seven bands from 1–5m, including four bands at 3–5m. We focus our attention on UV-selected Lyman-break galaxies at where the 3–5m filter set of CEERS/NIRCam affords rich insight into both the strength of nebular emission lines as well as the underlying rest-optical continuum.
The structure of this paper is as follows. We begin by describing the imaging data, source extraction, photometric calculations, sample selection, and photoionization modelling in §2. We then present the variety of NIRCam SEDs measured among our sample of 116 Lyman-break galaxies, discussing implications for demographics in ages, stellar masses, and sSFRs of typical reionization-era systems (§3.1). Next we discuss two unexpected yet seemingly important classes of sub- galaxies that are newly revealed with the NIRCam data (§3.2–3.3). We then combine the results from our faint galaxy sample with previous wide-area results on the UV-bright population (where IRAC data was sufficiently sensitive) to begin investigating any UV luminosity dependence on sSFR or nebular line EWs (§3.4). Finally, we briefly discuss whether we find evidence of extremely massive () galaxies in our sample, comparing with recent JWST/NIRCam studies (§3.5).
Throughout this paper, we quote all magnitudes in the AB system, assume a Chabrier (2003) initial mass function (IMF) with limits of 0.1–300 , and adopt a flat CDM cosmology with parameters , , and . We provide a catalog listing coordinates, magnitudes, and inferred physical properties among our sample.
2 Imaging Data and Sample Selection
We begin this section by describing the CEERS JWST/NIRCam imaging data over the Extended Groth Strip (EGS) field, as well as the overlapping optical HST/ACS imaging utilized for our dropout selection (§2.1). Our source extraction and photometric calculations are then detailed in §2.2, wherein we also describe and demonstrate a custom algorithm that removes contaminating flux from nearby objects to help produce reliable photometry. The Lyman-break criteria used to select our final galaxy sample are described in §2.3 where we also provide a brief description of the photometric properties of the sample. Finally, we describe the star-forming photoionization model SED fitting procedure used to infer the physical properties for each of our galaxies in §2.4.
2.1 JWST and HST Imaging in EGS
The CEERS JWST/NIRCam imaging utilized in this work were taken in June 2022 and cover 40 arcmin2 over the EGS field in six broadband filters (F115W, F150W, F200W, F277W, F356W, and F444W) as well as one medium-band filter (F410M). In the redshift window we aim to select galaxies (), the rest-optical SED is probed by at least three of these NIRCam filters (F356W, F410M, and F444W) while F277W additionally covers part of the rest-optical regime at . The availability of F410M photometry in particular delivers key information on whether any photometric excesses in these bands are likely driven by a strong Balmer break or contamination from high-EW nebular line emission.
Before detailing our NIRCam image reduction and photometric calculations, we first briefly describe the optical HST imaging that we employ to identify Lyman-break galaxies across the CEERS NIRCam footprint. The EGS field possesses deep imaging in three optical filters (F435W, F606W, and F814W) taken with the Advanced Camera for Surveys (ACS) as part of the following HST surveys: the All-Wavelength Extended Groth Strip International Survey (AEGIS; Davis et al. 2007), the Cosmic Assembly Near-infrared Deep Extragalactic Legacy Survey (CANDELS; Grogin et al. 2011; Koekemoer et al. 2011), and the Ultraviolet Imaging of the Cosmic Assembly Near-infrared Deep Extragalactic Legacy Survey Fields (UVCANDELS222https://archive.stsci.edu/hlsp/uvcandels; PI: Teplitz). All ACS data from these surveys were processed into co-added calibrated mosaics using the grizli software (Brammer et al., 2022) as part of the Complete Hubble Archive for Galaxy Evolution (CHArGE) project (Kokorev in prep.). The CHArGE data products also include mosaics in various HST/WFC3 bands compiled from archival data. All mosaics from CHArGE are aligned to the Gaia astrometric frame with the ACS (WFC3) mosaics set to a pixel scale of 40 mas/pixel (80 mas/pixel).
Co-added mosaics for each NIRCam band are produced by first downloading the uncalibrated (*_rate.fits) NIRCam exposures from the MAST Portal.333https://mast.stsci.edu/portal/Mashup/Clients/Mast/Portal.html These data are processed through the JWST Science Calibration Pipeline444https://jwst-pipeline.readthedocs.io/en/latest/index.html where we group exposures by NIRCam filter, pointing, and module combination to achieve precise astrometric alignment (see Chen et al. 2023). We utilize the most recent NIRCam photometric calibration reference files, (first released as jwst_0942.pmap in early October 2022), and have verified that the total F150W and F200W magnitudes of bright isolated objects in our final mosaics are on average consistent with the WFC3/F160W and WIRCam/ magnitudes, respectively, reported in previous EGS catalogs (Skelton et al., 2014; Stefanon et al., 2017). After individual co-added images (*_i2d.fits) are output from the stage 3 step of the pipeline, we align each (one per filter, pointing, and module combination) to the Gaia frame. Because the surface density of Gaia stars is very low across the CEERS footprint (3 per module area), direct alignment is not feasible. Instead we utilize tweakreg555https://drizzlepac.readthedocs.io/en/latest/tweakreg.html to align each co-added image to the CHArGE WFC3/F160W mosaic (which is pre-registered to Gaia), yielding precise relative alignment (RMS6–15 mas). With consistent astrometry across the individual co-adds, we then resample all images for each filter onto a fixed grid with pixel scale of 30 mas/pixel. Background subtraction is then performed on each mosaic using the sep package (Barbary, 2016).
As a last step to producing our final mosaics, we mitigate noise. To do so, we first run Source Extractor (Bertin & Arnouts, 1996) on the F200W mosaic. The output source catalog is used to mask objects in the uncalibrated NIRCam exposures before performing a row-by-row background subtraction on these images, largely following the algorithm666https://www.stsci.edu/jwst/science-planning/proposal-planning-toolbox/simulated-data produced by the CEERS team to minimize noise (Bagley et al., 2023). The background-subtracted uncalibrated files are then re-processed as described in the above paragraph to produce our final mosaics.
When performing aperture photometry on the JWST and HST data, we must account for the fact that the width of the point spread function (PSF) varies by a factor of 4 across the different mosaics (FWHM45–180 mas). One option is to convolve all mosaics to the lowest-resolution PSF (WFC3/160W) prior to calculating photometry. However, doing so would significantly weaken the sensitivity in the shortest-wavelength bands which probe the Lyman-alpha break at our redshifts of interest (). To mitigate this effect, we choose to convolve all long-wavelength (LW) NIRCam mosaics (F277W, F356W, F410M, F444W) to the PSF of WFC3/F160W while convolving all ACS and short-wavelength (SW) NIRCam mosaics (F115W, F150W, F200W) to the PSF of ACS/F814W. As described below, we introduce a scaling factor to the aperture size used for the LW vs. ACS+SW photometry to account for the differing PSFs. For each mosaic, we generate an empirical PSF by stacking the normalized surface brightness profiles of at least five stars within the mosaic footprint that were visually inspected to be unsaturated and isolated. Convolution kernels are then created using the photutils package (Bradley et al., 2022), where we verify that the encircled energy distributions after convolution agree with that of the target PSF (WFC3/F160W for LW and ACS/F814W for ACS+SW) to within 2% accuracy at radii 0.05″.
2.2 Source Extraction and Photometry
Objects within the CEERS footprint are identified by running Source Extractor on an inverse-variance weighted stack of the PSF-convolved F150W and F200W mosaics, yielding a total of 51,000 sources. We stack the F150W and F200W mosaics for the detection image as we aim to perform a rest-UV selection of in this work. The resulting catalog was also utilized in Whitler et al. (2023a) to select galaxies at which appear as F115W dropouts.
The photometry of each object identified by source extractor is calculated following procedures adopted in past HST-based analyses of galaxies (e.g. Oesch et al., 2013; Bouwens et al., 2015, 2021; Finkelstein et al., 2015, 2022a; Endsley et al., 2021). We begin by measuring the flux contained in elliptical apertures with a Kron (1980) factor of which is expected to result in approximately maximum signal to noise (Finkelstein et al., 2022a). The associated photometric error in each band is calculated as the standard deviation of flux contained in equally-sized Kron apertures randomly distributed in nearby empty regions of the sky as determined from a Source Extractor segmentation map specific to each band. Because we have homogenized the ACSSW and LW mosaics to different PSFs (ACS/F814W and WFC3/F160W, respectively; §2.1), we multiply the aperture size used for the LW bands by a factor of 1.5 which reflects the typical F444W vs. F200W size ratio of twelve UV-bright galaxy candidates measured from the PSF-homogenized mosaics (Chen et al., 2023).
The photometry (and their associated errors) are corrected to total values by first multiplying by the ratio of flux measured in vs. apertures. This correction factor is computed from the PSF-homogenized F200W mosaic for the ACSSW photometry given that our selection requires a 5 detection in F200W (§2.3). Since we do not explicitly require a detection in any individual LW band, the correction factor for the photometry in these four bands are computed from an inverse variance-weighted stack of their mosaics to maximize S/N. Finally we correct for flux outside the apertures using our constructed ACS/F814W and WFC3/F160W mosaics as well as their reported encircled energy distributions at large radii (1″).
While our PSF-homogenized mosaics have very high angular resolution (FWHM0.2″), it is still possible for our photometric apertures to be contaminated by considerable flux from neighboring objects. This can introduce significant offsets to not only the total magnitudes of our sources, but also the colors between the SW and LW NIRCam photometry given the different adopted PSF homogenization. To address this concern, we have developed a neighbor subtraction algorithm that is largely based off techniques previously developed for IRAC deconfusion (e.g. Wuyts et al., 2007; Labbé et al., 2010; McLeod et al., 2016; Song et al., 2016; Endsley et al., 2021). In short, this algorithm fits a Sérsic profile (convolved with the appropriate PSF) to each neighboring object identified in the Source Extractor catalog within a 44 arcsec2 region. The fit is performed on the non PSF-homogenized image of each band independently, adopting the source parameters output by Source Extractor as starting values and iterating to find the best-fitting solution via a least-squares optimization. Once the best-fitting surface brightness parameters are determined for each of the non-homogenized images, we then subtract the flux of neighboring objects from the corresponding PSF-homogenized images by convolving the inferred Sérsic profiles with the F814W or F160W PSF for the ACSSW and LW data, respectively.
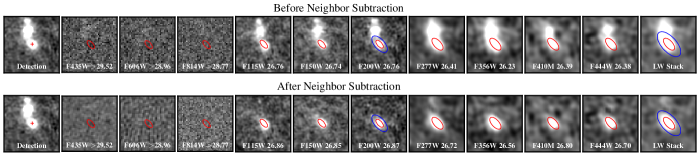
We demonstrate the performance and benefit of our neighbor subtraction algorithm in Fig. 1. In this example, significant flux from a bright neighboring low-redshift object is contaminating the Kron apertures for one of our galaxies, thereby artificially boosting the measured fluxes. Because the LW photometry is performed with a larger aperture size and a broader homogenized PSF, the impact of the contaminating flux is systematically stronger for the LW bands than ACSSW. For this particular example, subtracting the surface brightness profiles of neighboring objects decreases the measured SW fluxes by 0.1 mag while the LW fluxes decrease by 0.3–0.4 mags. Not correcting for this contaminating flux would therefore result in seemingly stronger SW-to-LW colors, potentially giving the false impression of a stronger Balmer break and hence higher stellar mass and older age. Given these potential effects, we produce two photometric catalogs – one that implements the neighbor subtraction algorithm and one without neighbor subtraction – and perform our galaxy selection on each. This ensures that we identify the maximum number of viable reionization-era galaxies, as some may have biased colors or ACS detections in the original catalog due to contaminating flux from neighbors.
2.3 Selection of Lyman-break Galaxies
We perform a Lyman-break selection to identify galaxies at across the June 2022 CEERS footprint. At , the intergalactic medium is highly opaque to both Lyman-series ( Å) and Lyman-continuum (LyC; Å) emission (e.g. Inoue et al., 2014). Accordingly, we expect galaxies at to show negligible emission in bands that lie blueward of 9100 Å, resulting in a strong dropout in the HST/ACS photometry relative to that of NIRCam F115W. With this in mind, we develop the follow initial cuts to identify Lyman-break galaxies within CEERS:
-
1.
S/N2 in F435W, F606W, and F814W
-
2.
F606WF115W1.7 and F814WF115W1.7
-
3.
F115WF200W1.0
-
4.
F814WF115W(F115WF200W)1.5
Here, the flux densities in the dropout bands (F606W and F814W) are set to their 1 upper limit in cases of non-detections (S/N1), consistent with the approach of previous works (e.g. Bouwens et al., 2015; Endsley et al., 2021). The first two selection criteria above ensure that the photometry are consistent with expectations of a Lyman-alpha break at . The third and fourth criteria limit our sample to objects that show a much redder F814WF115W color relative to F115WF200W, thereby requiring the presence of a sharp break while still allowing objects with very red rest-UV slopes () to enter our sample (see §3.3). The overlapping CEERS+ACS area over which we are able to apply our selection is 31 arcmin2.
In addition to the above cuts, we add the following selection criteria to help remove spurious detections and low-redshift interlopers. First, we require that each selected source be detected at S/N5 in F200W, S/N3 in F150W, as well as S/N3 in at least two LW NIRCam bands. Second, we enforce the condition to remove faint low-redshift sources showing 1–1.5 detections in each ACS band. As defined in Bouwens et al. (2015), where and represent, respectively, the measured flux density and its error in a given ACS band, while is the absolute value of the flux density. Finally, we limit our sample to sources with F200W28 as fainter galaxies generally cannot be reliably identified given the typical depths of the ACS imaging ( 3 in each).
We visually inspect each object satisfying the above selection criteria, removing any impacted by artifacts (e.g. diffraction spikes or ‘snowballs’) or that appear to likely be a spurious detection, often resulting from diffuse emission of nearby bright objects. While it is expected that the surface density of cool brown dwarfs is low in the EGS field (0.1 arcmin-2; Ryan & Reid 2016), these objects can yield near-infrared colors mimicking a Lyman-alpha break (e.g. Stanway et al., 2008a). We search for any bright point source objects with colors consistent with a brown dwarf solution, using both the empirical SPEX 0.8–2.5m brown dwarf spectral library (Burgasser, 2014), as well as the Sonora777https://github.com/aburgasser/splat/tree/master/resources/SpectralModels/sonora18 suite of 0.4–50m model brown dwarf spectra (Marley et al., 2021) as references. One likely brown dwarf is identified with this procedure (reasonably consistent with the expected EGS surface density from Ryan & Reid 2016), and we remove this object from our sample.
We select galaxies from both our standard photometry catalog, as well as that generated after applying our neighbor subtraction algorithm (§2.2). To ensure that the measured fluxes and colors are reliable, we carefully inspect the postage stamps in every band to ensure that the Kron apertures are not being contaminated by flux from neighboring sources. We only use photometry from the neighbor-subtracted catalog for objects where, upon visual inspection, it is plausible that flux from neighboring objects could be contaminating the apertures. For each such object, we also verify that our neighbor-subtraction algorithm is yielding smooth residuals around the Kron apertures (i.e. that it is not significantly over/under-subtracting flux from neighboring sources within or near the apertures). A small percentage of our remaining candidates fail these checks and are removed from the sample.
Due to the powerful sensitivity and angular resolution of the NIRCam mosaics, a subset of our identified galaxy candidates clearly show multiple emission components separated by 0.5″ which are identified as separate systems by Source Extractor. We treat any such multi-component galaxy as a single system by computing their photometry in manually constructed elliptical apertures that contain the emission from all individual components satisfying our selection criteria described above. If necessary, we subtract the surface brightness profiles of other neighboring systems if their flux appears to significantly contaminate the manually-constructed apertures.
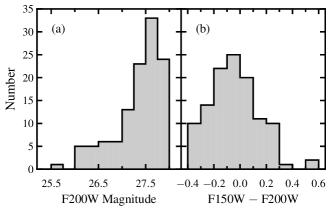
Our final sample consists of 116 Lyman-break candidates across the June 2022 CEERS footprint. Here, we briefly summarize the photometric properties of this sample before using the full multi-band SEDs to infer physical properties in the following sub-section. The F200W magnitudes of the galaxies range between to (Fig. 2a), indicating that our sample spans a factor of 10 in UV luminosity. As expected from the steep faint-end slope of the UV luminosity function (e.g. Finkelstein et al., 2015; Ishigaki et al., 2018; Bouwens et al., 2021), the sample is heavily weighted towards fainter objects yielding a median F200W 27.3. The decline in selection efficiency at (Fig. 2a) is expected given the depths of the ACS imaging and our Lyman-break cuts. The sample also shows a wide range of F150WF200W colors ( to 0.60; Fig. 2b) which reflects the distribution of rest-UV slopes across our 116 galaxies. The median F150WF200W color of our sample is , consistent with a nearly flat rest-UV slope ( where ) as expected from WFC3 analyses of similarly faint systems (e.g. Bouwens et al., 2014; Bhatawdekar & Conselice, 2021).
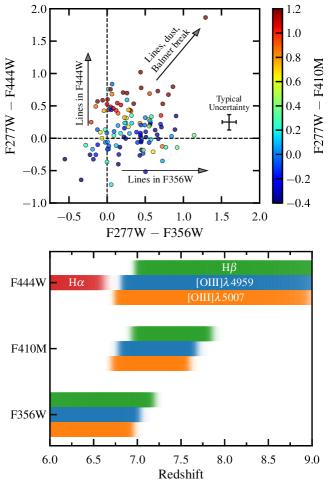
At the F356W, F410M, and F444W bands fully probe the rest-optical and can be contaminated by strong line emission (i.e. [OIII]4959,5007, H and H; see Fig. 3). Previous work with Spitzer/IRAC imaging has demonstrated that a significant fraction of the galaxy population exhibits very high EW line emission (1000 Å rest-frame; Smit et al. 2014, 2015; Roberts-Borsani et al. 2016; Endsley et al. 2021), which can result in substantial photometric excesses (0.5 mag) in the above NIRCam bands, particularly in F410M given its smaller bandwidth. The impact of such strong line emission is apparent in the F277WF356W vs. F277WF444W color-color space our sample (Fig. 3). We identify objects with very red (1) F277WF356W colors yet fairly flat (0) F277WF444W colors, likely indicating galaxies at where the combined EW of [OIII]+H is boosting F356W considerably more than H in F444W. Conversely, a subset of galaxies show very red F277WF444W colors yet flat F277WF356W which are likely objects at where [OIII]+H redshifts out of F356W and into F444W (Fig. 3). There are also objects with red colors in both F277WF356W and F277WF444W which can arise from strong lines at where [OIII]5007 falls in both F356W or F444W (Fig. 3), though the presence of significant dust attenuation or relatively old stellar populations yielding strong Balmer breaks can lead to such colors as well. Fortunately, the F410M photometry as well as the rest-UV slopes help differentiate between these various effects as we demonstrate below.
2.4 Photoionization Modelling
We now infer the physical properties of each of the 116 Lyman-break galaxy candidates in our CEERS sample using the SED-fitting code BayEsian Analysis of GaLaxy sEds (beagle; Chevallard & Charlot 2016). beagle fits the input ACSNIRCam photometry to a suite of SED photoionization models, employing the Bayesian multinest algorithm (Feroz & Hobson, 2008; Feroz et al., 2009) to produce a posterior probability distribution for each free physical parameter. The Gutkin et al. (2016) photoionization models used here include both stellar and nebular emission that were computed by processing the latest Bruzual & Charlot (2003) stellar population synthesis models (see Gutkin et al. 2016) through cloudy (Ferland et al., 2013).
Consistent with many previous studies at (e.g. Ono et al., 2012; Labbé et al., 2013; Stark et al., 2013; González et al., 2014; Smit et al., 2014; Salmon et al., 2015; Song et al., 2016; De Barros et al., 2019; Stefanon et al., 2022), we assume a constant star formation history (CSFH) in our beagle fits. It has been demonstrated that adopting a non-parametric star formation history (SFH) can yield considerably larger stellar masses (0.5–1 dex), particularly for objects with very young CSFH ages (10 Myr) where light from a recent burst is dominating the observed emission (Carnall et al., 2019; Leja et al., 2019; Lower et al., 2020; Johnson et al., 2021b; Tacchella et al., 2022; Topping et al., 2022a; Whitler et al., 2023a, b). For these galaxies with very young SEDs, non-parametric SFH fits that disfavor extremely rapid changes in SFR (i.e. the ‘continuity’ prior) tend to add much more star formation at earlier times that is outshined by the recent burst, resulting in stellar masses up to 2 dex higher than that inferred from CSFH fits. Therefore, non-parametric SFH models with a continuity prior effectively place an upper limit on the stellar mass permitted by the SED (depending on the assumed formation redshift), whereas CSFH fits place an approximate lower limit. While dynamical mass and rest-frame near-infrared SED constraints can help distinguish between these two SFHs (e.g. Tang et al., 2022; Topping et al., 2022a), such information does not yet exist for our sample. Because one of our key goals is to compare the stellar populations dominating the observed rest-UVoptical SEDs among our galaxies versus that in brighter galaxies (§3.4), we opt to assume a CSFH in our fiducial models. We will consider the impact of non-parametric SFH models for a subset of our objects in §3.3 and §3.5, but note that none of our conclusions rely on absolute measures of stellar mass (or sSFR).
For our beagle fits, we assume a Chabrier (2003) stellar initial mass function with mass range 0.1–300 , a fixed dust-to-metal mass ratio of , and an SMC dust attenuation curve (Pei, 1992). In beagle the dust opacity is parameterized as the V-band optical depth, , which is allowed to vary between 0.001 to 5 with a log-uniform prior. For ease of understanding what these dust optical depths imply for UV emission, we often quote the attenuation at 1500 Å rest-frame, , which is equivalent to 5.2 in the SMC attenuation law. The redshift is allowed to vary in the range with a uniform prior, and IGM absorption is incorporated using the empirical model of Inoue et al. (2014). We adopt log-uniform priors on both stellar mass and ionization parameter, allowing for values in the range and , respectively. Galaxy ages are allowed to take values between 1 Myr and the age of the Universe at the sampled redshift with a log-uniform prior as well. Finally, we adopt a log-uniform prior on metallicity allowing for values of , where we set an upper limit of 50% to avoid unreasonable solutions of near-solar metallicity in faint reionization-era galaxies. In these fiducial beagle fits, the stellar and ISM metallicities are equivalent.
The resulting fiducial beagle fits are generally able to provide a good match to the measured photometry of our Lyman-break galaxies, with a median best-fitting of 6.5 (from 10 fitted photometric points) across the full sample and for 92% of the objects. In §3.5, we discuss in detail one object for which our fiducial beagle fits struggle to precisely match the NIRCam photometry and consider other model solutions. When reporting the inferred physical properties for a given galaxy, we adopt the median of the posterior probability distribution as the fiducial value with 1 errors taken as the inner 68% credible interval from the posterior. To calculate the rest-UV slopes of our galaxies, we fit to the photometry of NIRCam bands determined to fall entirely between the line and the Balmer break (i.e. 1216–3600 Å rest-frame) given the inferred redshift specific to each galaxy. Errors on the rest-UV slope are computed by randomly sampling the redshift from the beagle posterior as well as photometric flux densities given the measured values and their errors. The absolute UV magnitudes, , are defined at 1500 Å rest-frame and are computed from the output redshift and SED posteriors. We list a subset of measured and inferred physical properties of all 116 galaxies in our sample in Table 1.
| ID | RA | Dec | F200W | F444W | log(/) | sSFR | [OIII]+H EW | |||
|---|---|---|---|---|---|---|---|---|---|---|
| [deg] | [deg] | [nJy] | [nJy] | [Gyr-1] | [Å] | [mag] | ||||
| 30 | 214.8311941 | 52.7908058 | 37.02.2 | 32.08.4 | 6.57 | 7.2 | 641 | 2526 | 0.1 | |
| 271 | 214.8248633 | 52.7968353 | 28.02.0 | 25.24.1 | 6.64 | 7.9 | 24 | 547 | 0.0 | |
| 480 | 214.8116349 | 52.7996698 | 27.82.6 | 70.74.6 | 6.33 | 8.5 | 6 | 300 | 0.1 | |
| 1091 | 214.8022041 | 52.8058379 | 40.83.2 | 34.34.5 | 6.65 | 7.8 | 42 | 753 | 0.0 | |
| 1137 | 214.8159100 | 52.8064007 | 227.23.0 | 477.17.0 | 6.96 | 10.0 | 2 | 157 | 1.1 |
3 Results
Due to the limitations of previous near-infrared facilities, it has long been very challenging to constrain the SEDs and hence physical properties (e.g. stellar mass, sSFR, age, nebular line EWs) of typical () galaxies in the reionization era. Spitzer/IRAC imaging suffered from inadequate sensitivity, strong source confusion, as well as poor sampling of the rest-optical emission with only two broadband filters at 3–5m. While HST/WFC3 was able to deliver relatively sensitive photometry at 1.0–1.6m, imaging in moderate-sized (100 arcmin2) fields like EGS often reached only (Grogin et al., 2011; Koekemoer et al., 2011), thus limiting insight into the rest-UV emission from typical reionization-era galaxies in these fields as well. With the tremendous advancements in 1–5m imaging sensitivity, angular resolution, and filter suite enabled by JWST/NIRCam, we now begin characterizing the rest-UV+optical SEDs of typical reionization-era galaxies in detail.
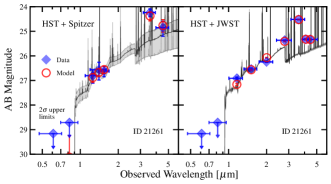
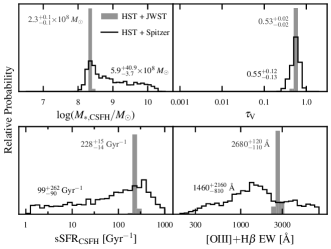
Before describing the results of our full CEERS sample in this section, here we first briefly demonstrate how the NIRCam data from CEERS greatly improve our understanding of galaxies in EGS relative to what was previously possible with HST and Spitzer data. In Fig. 4, we directly compare the rest UV+optical SED constraints for a typical (F150W27) galaxy in our sample when using HST and Spitzer photometry (Stefanon et al., 2017) versus JWST/NIRCam. Even with the deep HST and Spitzer data over the EGS field, this galaxy is only marginally detected (3) in the WFC3 and IRAC 4.5m bands, resulting in little constraining power on the shape of the SED. Consequently, the stellar mass, dust optical depth, sSFR, and [OIII]+H EW are all highly uncertain from previous data (see Fig. 4). With the CEERS/NIRCam imaging, this scenario changes dramatically. The galaxy is detected at S/N20 in every NIRCam band, revealing a strong and highly-significant F356W excess indicative of high-EW [OIII]+H emission at , as well as now a clearly red rest-UV slope over the large dynamic range in wavelength space covered by NIRCam, thus confidently implying strong dust attenuation. From the sensitive 7-band 1–5m NIRCam photometry, uncertainties on inferred physical properties decrease to approximately 0.05–0.1 dex, a vast improvement relative to the typical 0.5–1 dex uncertainties from HST+Spitzer data (see Fig. 4).
In the remainder of this section, we utilize the advanced 1–5m imaging capabilities of NIRCam to first characterize the physical properties (e.g. age, stellar mass, dust optical depth) of our large (N=116) CEERS galaxy sample (§3.1). In each of the following two sub-sections, we discuss an unexpected population of galaxies identified in our sample: sources with young SEDs and weak [OIII]+H emission (§3.2) as well as very red galaxies that likely lie at given their signatures of strong optical line emission (§3.3). We then combine the results from our CEERS sample with past studies of the UV-bright galaxy population to assess whether reionization-era galaxy sSFRs or [OIII]+H EWs correlate strongly with UV luminosity (§3.4). Finally, we discuss whether we find any evidence of extremely massive () galaxies at , comparing with previous works (§3.5).
3.1 Demographics of UV-faint Galaxies
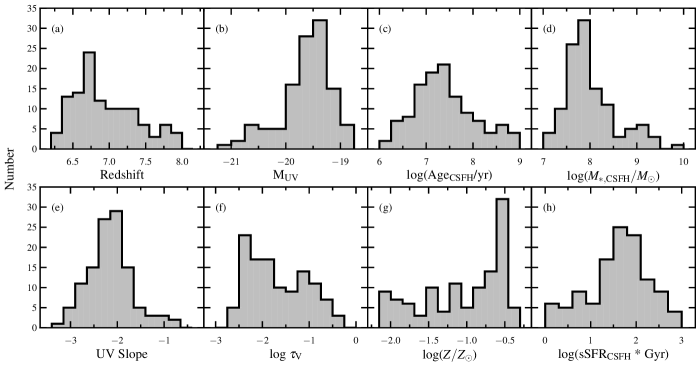
Before detailing the NIRCam SEDs among our sample of 116 Lyman-break galaxies, we first briefly describe two basic properties of this sample – their photometric redshifts and absolute UV magnitudes. As expected from our dropout selection criteria (§2.3), the photometric redshifts of galaxies in our sample range between and (Fig. 5a). The median redshift of the sample is closer to the low end of the distribution (), consistent with expectations of a declining UV luminosity function at higher redshifts (e.g. Finkelstein et al., 2015; Ishigaki et al., 2018; Bouwens et al., 2021). The inferred absolute UV magnitudes of the CEERS galaxies encompass the range with a median (Fig. 5b), consistent with the F200W magnitude distribution measured among the sample (see Fig. 2a). Adopting a characteristic UV luminosity of at (e.g. Bowler et al., 2017; Bowler et al., 2020; Harikane et al., 2022a), the typical galaxy in our sample has a UV luminosity of 0.4 with the full sample spanning 0.2–1.6 . The vast majority (92%) of galaxies in our sample are classified as sub- systems.
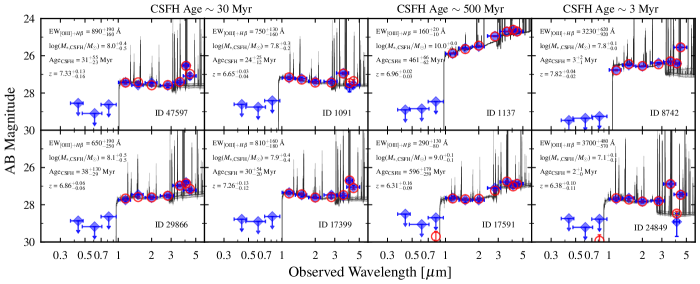
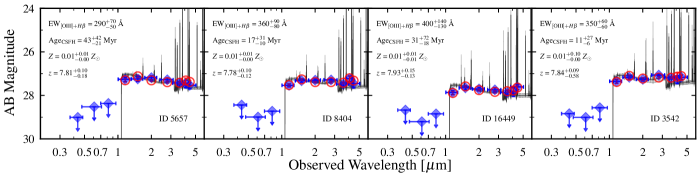
Now equipped with four deep photometric data points at 3–5m (including in one medium band), we begin investigating the rest-optical SEDs of relatively faint (0.4 ) galaxies in the reionization era. The CEERS/NIRCam data clearly reveal a variety of CSFH ages among UV-faint Lyman-break galaxies (Fig. 6). For the bulk of our sample, the measured flux density in either F356W, F410M, or F444W is consistent with extrapolating a power-law SED from the rest-UV photometry (see left two columns of Fig. 6). This implies that young (30 Myr) stellar populations dominate their rest-UV+optical SEDs yielding large specific star formation rates (30 Gyr-1). Nonetheless, we do identify a subset of objects with F356W, F410M, and F444W flux densities boosted by mag relative to the rest-UV, with approximately equal excesses in each of the these three bands (see third column of Fig. 6). Such photometry imply the presence of a prominent Balmer break, consistent with relatively evolved stellar populations (100–500 Myr) and low-to-moderate (2–10 Gyr-1). In addition to sources showing signs of prominent Balmer breaks, we also find a subset of galaxies exhibiting a very strong (1–2 mag) photometric excess in F356W, F410M, or F444W, with the extent of the excess differing significantly from band to band (see rightmost column of Fig. 6). The photometric excess patterns of these galaxies are consistent with contamination from exceptionally high-EW nebular lines ([OIII]+H EW1500 Å), implying very young CSFH ages (10 Myr) and correspondingly very large (100 Gyr-1). We find a very similar fraction of very young (=1–10 Myr) and relatively old (50–550 Myr) galaxies in our sample (28% and 29%, respectively), with the remaining 43% of our sample having moderately young CSFH ages (10–50 Myr; see Fig. 5c).
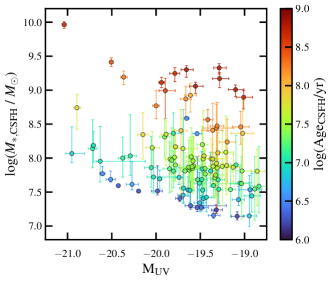
NIRCam imaging enables not only much stronger constraints on the stellar population ages dominating the SEDs of sub- galaxies, but also on the stellar masses (see Fig. 4). As expected from the typically young CSFH ages (30 Myr) and faint UV luminosities () of our galaxies, we find that our sample is largely composed of low-mass () objects in context of our CSFH models. The median CSFH stellar mass of our galaxies is = , with individual objects having stellar masses ranging over 2 dex from to (see Fig. 5d). We show our CEERS galaxies on the stellar mass versus UV luminosity plane in Fig. 7, where we color-code the data point for each galaxy by its CSFH age. Unsurprisingly, we find that more luminous objects tend to have larger inferred stellar masses. As discussed in §2.4, for galaxies with very young SEDs our CSFH fits are only modeling light from a recent burst resulting in low-mass () solutions, though it is likely that some of these systems have true stellar masses that are substantially (3) larger. In sections §3.3 and §3.5, we consider the impact of adopting non-parametric SFH models for a subset of our sample.
Because the CEERS/NIRCam data deliver sensitive imaging across 1–5m, we can investigate not only the rest-optical SEDs of our galaxies, but their rest-UV slopes as well. As expected from previous studies using HST/WFC3 data (McLure et al. 2011; Dunlop et al. 2012; Finkelstein et al. 2012; Rogers et al. 2013; Bouwens et al. 2014; Bhatawdekar & Conselice 2021), we find that our relatively faint () CEERS galaxies tend to have blue UV slopes (; see Fig. 5e). Consequently, our beagle SED fitting results imply little dust attenuation in the majority of our sample (median or mag; Fig. 5f). The vs. relation of our galaxies is presented in Topping et al. (2022b). Therein, we discussed a subset of extremely blue objects () exhibiting NIRCam SEDs consistent with not only negligible dust attenuation, low metallicities (5% ), and young CSFH ages (20 Myr), but also high ionizing photon escape fractions (%) which mitigate reddening from nebular continuum emission.
In each of the following two sub-sections, we discuss an unexpected population of Lyman-break galaxies identified in our sample that we have not yet detailed. The first population we discuss are objects with NIRCam SEDs suggesting both young CSFH ages yet relatively weak [OIII]+H emission. Next, we describe a surprisingly large number of galaxies with very red UV slopes, as well as strong long-wavelength photometric excesses which likely place each system at . We argue that the abundance of each of these galaxy classes may have important implications for our understanding of star formation, ionizing photon escape, and chemical evolution in the reionization era.
3.2 The Nature of Weak [OIII]+H Emitters at
Even prior to the launch of JWST, it was relatively easy to identify galaxies with very high [OIII]+H EWs (1000 Å) given that these objects would show a substantial (1 mag) excess in one of the Spitzer/IRAC bands, yielding a bright (and relatively high S/N) detection (e.g. Smit et al., 2014, 2015; Roberts-Borsani et al., 2016; De Barros et al., 2019; Strait et al., 2020; Endsley et al., 2021). However, it has remained very difficult to quantify the population of sub-) reionization-era galaxies with low [OIII]+H EWs given that these sources would generally remain poorly detected in IRAC. With the highly advanced 3–5m imaging capabilities of NIRCam, it is now possible to not only easily identify, but also characterize weak [OIII]+H emitters among sub- reionization-era galaxies. As expected, we identify a subset of galaxies in our CEERS sample that exhibit NIRCam SEDs consistent with both relatively old stellar populations (300 Myr) and weak [OIII]+H emission (EW500 Å; see e.g. IDs 1137 and 17591 in Fig. 6). The comparatively weak nebular lines in these evolved objects are expected given that the rest-optical continuum will be boosted over time by the build-up of A stars, while the nebular line luminosity will remain roughly constant as OB stars undergo short life cycles. However, as detailed below we also find a seemingly significant population of UV-faint Lyman-break galaxies with SEDs implying both young CSFH ages and weak [OIII]+H.
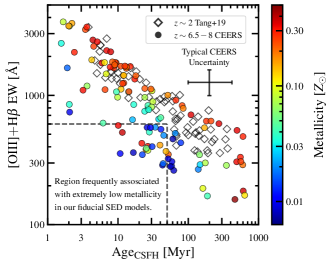
The CEERS NIRCam data reveal several candidate galaxies with strong Lyman-alpha breaks (F814WF115W=1.5–2.7; median 1.8) as well as SEDs implying young CSFH ages yet also little-to-no photometric excesses in the long-wavelength bands. We show the SEDs of four such objects in our sample in Fig. 8 where it can be seen that their F356W, F410M, or F444W photometry are reasonably consistent with a power-law SED extrapolated from the shorter-wavelength NIRCam photometry. The lack of significant Balmer breaks in these systems indicates that their light-weighted ages are young (50 Myr), implying that a substantial portion of their emergent light should be coming from recently-formed OB stars which are highly efficient producers of LyC photons. Accordingly, we might expect to see strong nebular line emission in such seemingly young objects, as indeed found among a sample of UV-faint (median ) extreme emission line galaxies (EELGs) at where [OIII]+H EWs800 Å are nearly ubiquitous at 50 Myr (Tang et al. 2019; see Fig. 9). However, we find little-to-no significant photometric excesses in the long-wavelength bands for several of the young galaxies in our sample, implying considerably lower [OIII]+H EWs at fixed CSFH age relative to . From our fiducial beagle fits, young (50 Myr), relatively weak [OIII]+H emitters (EW600 Å) comprise 18% (21/116) of our CEERS sample, suggesting that they may be a significant class of sub- reionization-era galaxies that are comparatively rare at . While the Tang et al. (2019) EELG sample mentioned above was selected on [OIII] emission, the adopted selection threshold of [OIII]5007 EW225 Å still allows for the inclusion of relatively weak [OIII]+H emitters (EW350–600 Å) and such galaxies were indeed found with 100–500 Myr (Fig. 9). Below, we discuss potential physical origins for the weak [OIII]+H and young SEDs that appear present in our sample, though we emphasize that spectroscopic follow-up will be necessary to confirm their redshifts.
In the context of our fiducial beagle fits, the combination of young CSFH age (50 Myr) and relatively low [OIII]+H EW (600 Å) is frequently reproduced with extremely low metallicities (1–3% ; see Fig. 9). In such metal-poor models, [OIII] emission is greatly weakened relative to the more chemically evolved (20% ) systems with similarly high (20 Gyr-1) found at both lower redshifts () and bright UV magnitudes () at (e.g. Endsley et al. 2021; Tang et al. 2021). Even though H EWs increase with decreasing metallicity, the relative contribution of [OIII]4959,5007 to [OIII]+H is generally far more dominant ([OIII]/H 5–10; e.g. Steidel et al. 2016; Maseda et al. 2018; Sanders et al. 2018; Tang et al. 2019) such that extremely low metallicities result in much smaller total [OIII]+H EWs at fixed .
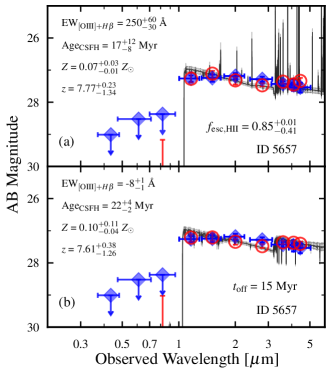
While our fiducial beagle models demonstrate that extremely low metallicity solutions can reproduce relatively weak [OIII]+H emission at young CSFH ages (see Figs. 8 and 9), here we discuss two alternative physical explanations. Because nebular emission lines are byproducts of the interaction between hydrogen ionizing photons and gas in the ISM, these lines can be weakened at high LyC escape fractions (; e.g. Zackrisson et al. 2013). If the LyC leakage is driven by density-bounded conditions, we would expect to see weaker [OIII] and H emission at very high (Plat et al., 2019). In Fig. 10a, we illustrate how high escape fractions () can also plausibly explain weak [OIII]+H in a subset of galaxies with young SEDs (see also Topping et al. 2022b). Here, we are using the beagle photoionization models introduced in Plat et al. (2019) which allow for non-zero ionizing photon escape from HII regions within the galaxy (i.e. ) due to density-bounded conditions. While such ionizing photons must also travel through the ISM and CGM to reach the intergalactic medium, sources with large would be prime candidates for key contributors to reionization.
Another way nebular line emission can be weakened in a seemingly young galaxy is if that object has experienced a sharp decline in star formation rate within the past 10 Myr, resulting in very few (if any) remaining OB stars. To illustrate how such a star formation history could reproduce young CSFH SEDs with weak [OIII]+H, we take our fiducial beagle fitting setup but force the SFR to 0 /yr over the most recent 15 Myr (with a constant non-zero SFR at 15 Myr). Such a recent turnoff in star formation can produce SEDs that provide a satisfactory match the observed NIRCam photometry for a subset of our young weak [OIII]+H emitters (see Fig. 10b). In these solutions, the observed SED is dominated by light from a population of stars that started forming 50 Myr ago and assembled 109 before star formation plummeted in the most recent 15 Myr. From an empirical standpoint, such bursty star formation histories are consistent with the presence of extremely high (100 Gyr-1) systems we identify in our sample. With implied mass-doubling times of 10 Myr, these galaxies are caught in a phase of intense star formation activity that likely was proceeded and will be followed by periods with much lower SFRs. A subset of our young, weak [OIII]+H emitters may reflect these periods of relatively inactive star formation. Consistent with this picture, recent high-resolution hydrodynamic simulations also predict that galaxies frequently undergo episodes of extreme star formation between periods of weak-to-moderate star formation (e.g. Ceverino et al., 2018; Ma et al., 2018).
It is currently not clear which of these three physical scenarios is responsible for the apparent young SEDs with weak [OIII]+H. In principle, low metallicities, high , and bursty star formation histories could contribute to the effect in different galaxies. Fortunately, future JWST surveys will soon allow us to not only confirm the existence of these reionization-era systems, but also better understand the physical origin of their SEDs. For example, direct temperature measurements could test for the presence of extremely metal-poor populations (Arellano-Córdova et al., 2022; Schaerer et al., 2022; Taylor et al., 2022; Curti et al., 2023; Rhoads et al., 2023; Trump et al., 2023). Moreover, with very deep NIRSpec spectra it will be possible to determine if O stars are contributing significantly to the rest-UV continuum emission by searching for P-Cygni profiles of e.g. CIV1540. A complete lack of such O-star features would be consistent with the bursty star formation history scenario discussed above, while we would expect O stars to contribute significantly to the rest-UV continuum in the very high and extremely low metallicity scenarios.
3.3 Very Red UV-faint Galaxies in Small Areas
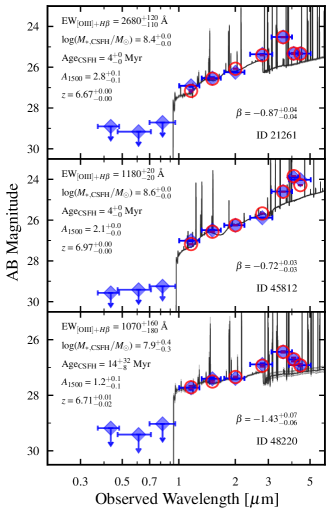
We identify three very red galaxies with strong line emission in our CEERS sample. The NIRCam SEDs of these three objects are shown in Fig. 11 where they all exhibit long-wavelength photometric excesses implying [OIII]+H EW800 Å as well as high S/N () short-wavelength photometry implying red UV slopes ( ). The combination of very strong Ly breaks (F814WF115W 2.1) and clear signatures of strong nebular line contamination in each of these galaxies gives us confidence that they are robust reionization-era systems. The photometric redshifts and absolute UV magnitudes of these galaxies span = 6.7–7.0 and , respectively, indicating that they all fall under the classification of sub- sources. However, as expected from their very red UV-slopes () all four systems are inferred to be heavily reddened ( = 1.0–2.8 mag) implying that they would have appeared as UV-bright () galaxies in the absence of dust.
Given the implied large dust reservoirs in these systems, we would perhaps expect them to be fairly massive (109 ; e.g. Dayal et al. 2022; Ferrara et al. 2022). While our CSFH beagle fits suggest that these objects have relatively low stellar mass (1–4108 ), such fits account for only the recent burst suggesting that significantly higher stellar mass solutions may be feasible (e.g. Carnall et al., 2019; Tacchella et al., 2022; Whitler et al., 2023b). Indeed, we find that stellar masses of 109 to 31010 are possible when adopting prospector non-parametric SFH models utilizing the continuity prior. For these non-parametric fits, we adopt the setup described in Whitler et al. (2023b) where there are eight time bins for the SFH, with the two most recent time bins fixed to 0–3 Myr and 3–10 Myr ago, and the rest evenly spaced in logarithmic lookback time out to an assumed formation redshift of .
In recent years, a growing number of Lyman-break galaxies have been identified with fairly high S/N (5) near-IR photometry implying very red UV slopes (; e.g. Bowler et al. 2014; Smit et al. 2015; Stefanon et al. 2019; Endsley et al. 2021) and a considerable number of these objects are now spectroscopically confirmed via far-infrared follow-up (Smit et al., 2018; Bouwens et al., 2022; Fujimoto et al., 2022; Endsley et al., 2023). However, all of these previously-known very red systems appear UV luminous () even in the presence of the substantial dust reddening. This is a direct result of the limited near-IR sensitivity of ground-based cameras as well as HST/WFC3, making it very challenging to confidently identify red galaxies at more typical UV luminosities (). NIRCam’s greatly improved near-IR sensitivity (and SED sampling) relative to WFC3 changes this scenario dramatically as illustrated in Fig. 4. One of our very red CEERS galaxies (ID 21261) is only marginally detected in the CANDELS EGS WFC3 data (S/N3) such that it was previously impossible to quantify the UV slope with high confidence. With CEERS/NIRCam data, this object is detected at S/N20 in F115W, F150W, and F200W, clearly revealing a strong increase in flux density over 1500–2500 Å rest-frame indicating a very red UV slope () and strong dust attenuation ( 2.8).
The fact that the NIRCam data reveal three very red () galaxies in the CEERS area suggests that there remains a significant tail of heavily dust-reddened galaxies down to at least 0.5 in the reionization era (see also Barrufet et al. 2023; Rodighiero et al. 2023; Pérez-González et al. 2023). This may have important consequences for our understanding of the extent to which obscured star formation contributes to stellar mass assembly in the very early Universe. The dust optical depths inferred by our beagle fits imply that 70–90% of the star formation in our three young, very red CEERS galaxies is obscured, resulting in individual obscured CSFH SFRs of 4–92 yr-1 for each object. Even though these young, very red systems represent only 3% of our CEERS sample by number, their combined obscured SFRCSFH (145 yr-1) makes up 19% of all (unobscuredobscured) inferred stellar mass growth across our full sample (745 yr-1). The obscured SFRs of our young, very red galaxies may even be underestimated from the beagle SED fits. ALMA follow-up has shown that the total SFR inferred from the rest-UV+optical SED is often a factor of 2 lower than the SFR derived by combining UV and far-infrared data, at least among very UV-bright () galaxies (Topping et al., 2022a). Moreover, at least one very red UV-bright galaxy (COS-87259; ) has been found to be extremely bright in the far-infrared with SCUBA-2 and ALMA data, implying an obscured star formation rate of 1300 yr-1 (Endsley et al. 2022, 2023; see also the similar object in GOODS-N described in Fujimoto et al. 2022). Deep far-infrared follow-up will be critical to assess the extent of obscured star formation in the relatively UV-faint (0.5 ) and very red galaxies identified from deep JWST data.
3.4 The MUV Dependence of sSFRs and [OIII]+H EWs
Within the past few years, it has become possible to statistically characterize the sSFRs and [OIII]+H EWs of UV-bright () galaxies thanks to the growing collection of deg2 data sets with deep optical, near-infrared, and IRAC imaging (e.g. Mauduit et al. 2012; McCracken et al. 2012; Jarvis et al. 2013; Steinhardt et al. 2014; Ashby et al. 2018; Aihara et al. 2022). These UV-luminous reionization-era galaxies tend to exhibit SEDs consistent with high [OIII]+H EWs (700 Å) as well as young CSFH ages and hence large (Stefanon et al. 2019; Endsley et al. 2021; Topping et al. 2022a; Whitler et al. 2023b). In the more local Universe (), it has been shown that such galaxy properties are clearly associated with high ionizing photon production efficiency (Chevallard et al., 2018; Tang et al., 2019), as well as perhaps higher LyC escape fractions (e.g. Izotov et al., 2016; Flury et al., 2022; Saxena et al., 2022). Unfortunately, our understanding of sSFRs and [OIII]+H EWs at fainter magnitudes has been hindered by IRAC’s poor sensitivity, leaving much uncertainty on the possible extent to which galaxy ionizing properties correlate with UV luminosity in the reionization era (e.g. Finkelstein et al., 2019; Naidu et al., 2020). Now equipped with deep NIRCam imaging, we can begin constraining the demographics of sSFRs and [OIII]+H EWs among sub- galaxies to compare with the more UV-luminous population.
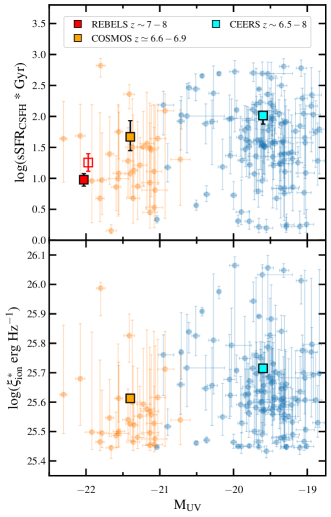
We find that the NIRCam SEDs of CEERS galaxies generally imply very large CSFH specific star formation rates, with 63% of our sample having a fiducial 30 Gyr-1 (see Fig. 5h). Following previous studies (Topping et al., 2022a), we compute the median of our sample and its associated uncertainty by bootstrap resampling values from the beagle posteriors. That is, we randomly select 116 galaxies with replacement from our CEERS sample, pulling a from the beagle posterior probability distribution for each galaxy, and repeat this process 10000 times. This yields a median and inner 68% credible interval Gyr-1 (Fig. 12), consistent with a scenario in which the bulk of UV-faint (0.4 ) reionization-era systems have recently experienced a strong upturn in their star formation activity.
We compare the derived among our relatively faint CEERS sample (median ) with results obtained from very UV-luminous galaxies whose rest-optical properties have been characterized with IRAC data. Leveraging ultra-deep optical narrow-band imaging across the 1.5 deg2 COSMOS UltraVISTA field, we previously assembled a large sample of UV-bright () Lyman-break galaxies at where the IRAC 3.6m band is contaminated by [OIII]+H while the 4.5m band cleanly probes the rest-optical continuum (Endsley et al., 2021). After only considering objects with robust IRAC deconfusion, we obtain a final sample of 36 UV-bright (median ) COSMOS galaxies (see Whitler et al. 2023b). We fit these COSMOS galaxies with beagle adopting the same prior set that we use for the CEERS sample, finding a median inferred Gyr-1, potentially hinting at a modest (2) increase in between 2 and 0.4 at (see Fig. 12).
To better test for any UV luminosity dependence on at , we also consider the large (N=40) sample of extremely UV-bright (median ) galaxies observed with ALMA as part of the Reionization Era Bright Emission Line Survey (REBELS; Bouwens et al. 2022). From similar beagle rest-UVoptical SED fits, the 4 REBELS sample has an inferred median Gyr-1 (Topping et al., 2022a), which is nearly an order of magnitude lower than that of our CEERS sample (Fig. 12). Given the availability of ALMA data, the CSFH sSFRs of the REBELS objects were also determined using unobscuredobscured SFRs computed from the UV and IR luminosities (and the same CSFH stellar masses). While this approach results in a slightly higher median for the REBELS sample ( Gyr-1; Topping et al. 2022a), the data remain consistent with an approximately 5 higher typical sSFR at 0.4 relative to 4 (Fig. 12). It may be possible that the rest-UVoptical SED fits also significantly underestimate the for a subset of the CEERS galaxies, particularly those with very red UV slopes (; §3.3). Such a scenario would only boost the inferred median of our CEERS sample, thereby strengthening our conclusions of a strong correlation with . However, the typically bluer UV-slopes of fainter galaxies suggest that obscured star formation likely plays a less important role in for the CEERS sample as a whole.
The strong UV luminosity correlation with described above implies that the light emerging from UV-faint galaxies is generally more heavily dominated by recently-formed OB stars relative to UV-bright systems at the same epoch. This in turn may suggest that fainter, more numerous reionization-era galaxies are often more efficient producers of LyC photons. To explore this, we consider the inferred ionizing photon production efficiencies () among the CEERS and COSMOS samples, where is defined as the rate at which LyC photons are produced () divided by the intrinsic stellar UV continuum luminosity at 1500 Å (i.e. that corrected for both dust attenuation and nebular continuum emission) and assuming an escape fraction of . From our fiducial beagle fits, we find a very high median among the CEERS galaxies ( = 25.71) which is 0.1 dex higher than that inferred from the brighter COSMOS systems ( = 25.61; see Fig. 12). Moreover, we infer that 21% of the CEERS galaxies possess extremely high ( erg-1 Hz) compared to only 6% in the COSMOS sample. The implied increase in towards lower luminosities may suggest that UV-faint galaxies contribute more to reionization than predicted in models that assume is independent of (Naidu et al., 2020). Larger values at lower luminosities would also alleviate requirements for a high among the numerous, faint galaxy population in order to reach the LyC photon budget necessary for reionization. Nonetheless, the very blue UV slopes () of typical sub- reionization-era galaxies suggest these systems may often be efficient leakers of LyC photons (e.g. Chisholm et al., 2022).
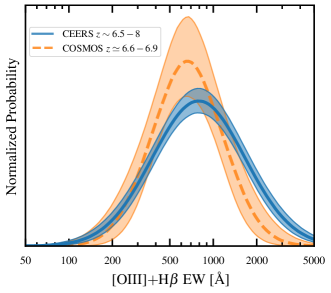
Having investigated the dependence of CSFH sSFR on UV luminosity at , we now turn our attention to the [OIII]+H EWs which we expect to be closely tied to (e.g. Tang et al., 2019). For this analysis, we infer the distribution of [OIII]+H EWs among our CEERS sample and compare to that of the UV-bright COSMOS sample described above (Endsley et al., 2021; Whitler et al., 2023b). Following the approach of Endsley et al. (2021), the EW distribution of each sample is assumed to follow a log-normal shape and is constrained by the beagle posterior probability distribution of all input galaxies adopting the Bayesian formalism of Boyett et al. (2022). We find that the log-normal [OIII]+H EW distribution of our CEERS sample is described by a median EW of Å and a standard deviation of dex (see Fig. 13). This EW distribution is consistent with the first JWST spectroscopic EW measurements of individual sub- galaxies (e.g. Schaerer et al., 2022).
Given the strong decrease in towards brighter found above (Fig. 12), we might expect to see evidence of considerably lower [OIII]+H EWs among the COSMOS galaxies. However, the data are consistent with only a slight difference between the COSMOS (2 ) and CEERS (0.4 ) EW distributions, with that of the COSMOS galaxies parametrized by a median EW of 650 Å and standard deviation of 0.24 dex (Fig. 13). This result is in part driven by the considerable subset (18%) of our CEERS sample showing SEDs consistent with both high (20 Gyr-1) and relatively low [OIII]+H EWs (600 Å; see §3.2), as such a population is not evident from IRAC data in COSMOS. While our fiducial fits match the photometry of these young, weak [OIII]+H emitters by pushing the models to extremely low metallicity (thereby yielding the extended tail in the metallicity distribution shown in Fig. 5g), we have shown that alternative solutions (e.g. high or a recent strong downturn in SFR) can also provide acceptable fits to the photometry of these objects. Given that the [OIII]+H EWs are largely constrained by the photometric colors, we do not expect the inferred values to strongly depend on SED model assumptions, though we leave a detailed investigation of possible systematics in the inferred [OIII]+H EW distribution to future works. Upcoming Cycle 1 JWST surveys will clarify the extent to which and [OIII]+H EW correlate with UV luminosity in the reionization era by extending to wider areas (e.g. COSMOS-Webb, PRIMER), pushing to deeper depths (e.g. JADES, NGDEEP), and delivering spectra (e.g. FRESCO, UNCOVER). Spectroscopic efforts will simultaneously provide more direct constraints on LyC photon production efficiency, helping build our understanding of the relative contribution of UV-bright vs. UV-faint galaxies to cosmic reionization.
3.5 The Stellar Masses of UV-faint Galaxies
Shortly after NIRCam imaging first became available, several candidates were identified in small (40 arcmin2) fields (Castellano et al., 2022; Finkelstein et al., 2022b; Naidu et al., 2022b; Adams et al., 2023; Atek et al., 2023; Donnan et al., 2023; Harikane et al., 2023; Labbé et al., 2023; Leethochawalit et al., 2023; Morishita & Stiavelli, 2023; Whitler et al., 2023a; Yan et al., 2023) some of which were reported to show SEDs suggesting extremely large stellar masses (; Naidu et al. 2022a; Labbé et al. 2023). The large abundance of very early massive galaxies implied by these initial studies poses strong challenges for our understanding of baryon accretion onto the largest halos thought to exist at these epochs in context of CDM (Boylan-Kolchin, 2023; Ferrara et al., 2023; Lovell et al., 2023). While this potentially points to a failure in our basic understanding of cosmology and/or galaxy formation, it is worth investigating whether considerably lower mass solutions may be viable for some of these reported extremely massive candidates. Here we specifically focus on comparing our stellar mass results with the sample in Labbé et al. (2023), hereafter L23, since they also utilize the CEERS data and their redshift selection window best overlaps with that considered in this work ().
Our fiducial beagle CSFH fits suggest that the NIRCam SEDs of CEERS galaxies are consistent with low stellar masses. Specifically, we infer a median stellar mass of among our full sample, with only a small fraction (9%) of objects having and only one with (ID 1137 in Fig. 6) as illustrated in Figs. 5d and 7. In contrast to our findings, L23 report the identification of six massive () galaxies in the CEERS/NIRCam area, including one object with an extremely high mass (). After cross-matching the L23 galaxy coordinates with our catalog, we find one object which overlaps between the two samples. This galaxy (ID 45812 in our catalog) is the most massive object in the Labbé et al. (2023) sample with a reported . Upon investigating why the other five L23 galaxies do not enter our sample, we find that two (including the second most massive object reported in L23) fall outside the ACS/F435W footprint and thus were not considered for high-redshift candidate selection in this work. The final three L23 galaxies are very faint in F150W and F200W and thus were not identified in our rest-UV detection image by source extractor (§2.2). L23 utilized a F277WF356WF444W stack for their detection image which more closely resembles a rest-optical selection, though we emphasize that our rest-UV source extractor catalog does contain the two highest-mass () galaxies reported in L23.
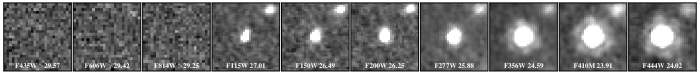
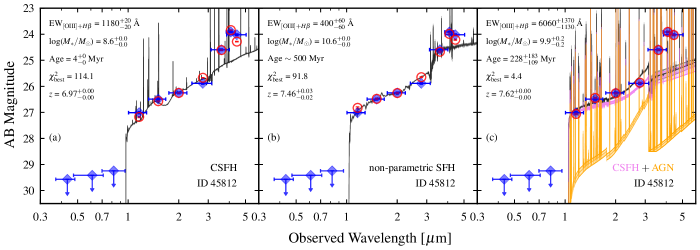
The NIRCam SED of the L23 source that overlaps with our selection (ID 45812) is shown in Fig. 14, revealing an extremely red UV slope () as well as very strong photometric excesses in F356W, F410M, and F444W relative to F277W. Given the exceptional brightness of this source in the three reddest NIRCam bands (), the strength of the photometric excesses is confidently found to vary considerably from band to band. Because of the high S/N pattern of the LW excesses, our CSFH beagle fits strongly prefer a solution where the SED is dominated by a very young (4 Myr) stellar population yielding strong nebular line emission ([OIII]+H EW Å; see Fig. 14a). The nebular line solution allows for more flexibility in the LW colors relative to a solution where the photometric excesses are the result of an approximately power-law rest-optical continuum boosted by an extremely strong Balmer break. As expected from the very young solution, our CSFH fits yield a relatively low stellar mass of , which is about 200 lower than the solution reported by L23. These beagle CSFH fits demonstrate that relatively low-mass () solutions are plausible for the highest mass object reported in L23 which would alleviate tension with models of galaxy formation (Boylan-Kolchin, 2023; Lovell et al., 2023). Below we comment on models that yield more massive solutions.
It is well known in the literature that CSFH models can significantly underpredict the total stellar mass for galaxies with young SEDs given that these models will only account for stars formed during the recent burst (e.g. Carnall et al. 2019; Leja et al. 2019; Lower et al. 2020). Adopting non-parametric SFH models that disfavor rapid changes in the star formation rate will necessarily predict considerably more stellar mass assembly before the onset of the recent burst (see §2.4). Such non-parametric SFH models have been employed in a number of recent studies focusing on galaxies (e.g. Tacchella et al., 2022; Topping et al., 2022a; Stefanon et al., 2023; Tacchella et al., 2023; Whitler et al., 2023a, b), including L23 which helps explain the extremely high stellar mass they report for ID 45812 ( ). As expected, when we fit our photometry for ID 45812 with the non-parametric SFH models described above (following the approach of Whitler et al. 2023b with a uniform prior formation redshift from ), we obtain a substantially higher mass solution (1010.6 ) relative to our beagle CSFH fits (see Fig. 14b). However, we note that the non-parametric SFH fit still requires rapid, strong changes in SFR to match the measured photometry for ID 45812. In the SFH posterior, nearly all of the stellar mass forms between and (SFR200 yr-1), with very little star formation activity thereafter (SFR1 yr-1) until the most recent few Myr when star formation ramps back up to power the high S/N excess in F410M.
As can be seen in Fig. 14, neither the CSFH nor non-parametric SFH models are able to precisely reproduce the observed LW colors of ID 45812 (the most massive galaxy reported in L23), with each resulting in best-fitting across the 10 fitted data points. Notably, we clearly identify the characteristic 6-pointed diffraction pattern of JWST in the F356W, F410M, and F444W detections of this source (see Fig. 14), indicating that the light dominating the LW bands is coming from a very compact region ( pc). While this is by no means conclusive evidence of an AGN in ID 45812, it at least opens the possibility that the LW excesses are significantly assisted by AGN line emission and we consider whether allowing for such emission (in addition to that from star formation) provides sufficient flexibility in model nebular line strengths and line ratios to better match the data. Utilizing the beagle AGN models (Vidal-García et al., 2022), we find that including type II narrow-line AGN emission yields a good fit to the measured photometry (best-fitting ; Fig. 14c). In this scenario, the substantial nebular line contribution from an AGN alleviates the need for a very recent upturn of star formation activity, thereby allowing for a much older CSFH solution (200 Myr) and a corresponding higher mass-to-light ratio. The resulting inferred stellar mass of with the SFAGN models falls between that predicted from the (star formation only) CSFH and non-parametric SFH models described above.
We emphasize that the morphological constraints from JWST can only place a weak upper limit on the effective radius of 45812 in the longest-wavelength bands ( pc) and it is therefore not at all clear whether the detections in this band are due to emission from a point-source like an AGN or, alternatively, a very compact star-forming region. Our primary goal here is to simply demonstrate that allowing for more flexibility in line ratios and line strengths from a model including AGN line emission is one possible way to achieve a good fit () to the measured photometry, and that such a fit yields a moderately massive ( ) solution. Spectroscopic follow-up will be necessary to clarify the origin of the strong long-wavelength excesses seen in 45812.
Should later spectroscopic results suggest that the photometric excesses seen from 45812 are primarily powered by AGN emission lines, we consider what this may imply for the abundance of AGN at the highest redshifts. From the beagle AGN fit, we infer an accretion luminosity of erg/s. Adopting the bolometric AGN luminosity function from Shen et al. (2020), we estimate that such luminous AGN are expected to exist at over the 32 arcmin2 area of CEERS covered by our selection. Therefore, if 45812 is found to contain such a luminous AGN, it would imply that either this was an exceedingly fortuitous discovery, or these types of AGN are far more common than previously thought in the reionization era. Again, we emphasize that spectroscopic follow-up of 45812 (and similar photometric candidates identified in recent months over relatively small fields; Furtak et al. 2022; Akins et al. 2023) will be crucial to better assess whether these objects have interesting implications for the abundance of moderately luminous AGN in the first Gyr of cosmic history.
To summarize our key conclusions in this sub-section, our results suggest that the photometry of ID 45812 can be reproduced with models that predict relatively moderate stellar mass (109-10 ). Nevertheless, because this object shows signatures of a very young SED (4 Myr), we do find a wide (2 dex) range of possible stellar mass solutions depending on model assumptions. This is indicative of the challenges faced when attempting to infer the absolute stellar masses of galaxies with extremely young SEDs, as was discussed in Whitler et al. (2023b). Fortunately, there are steps that can be taken to help tighten the range of possible stellar masses for galaxies with very young SEDs. Dynamical mass estimates from NIRCam WFSS or NIRSpec IFU observations would clarify whether very massive () solutions are plausible for any of these systems (e.g. Tang et al., 2022; Topping et al., 2022a), while targeted searches for the most luminous galaxies would help constrain any rigorous star formation activity at much earlier epochs (e.g. Castellano et al., 2022; Harikane et al., 2022b; Naidu et al., 2022b; Donnan et al., 2023; Harikane et al., 2023).
4 Summary and Future Directions
In this work, we characterize the star-forming and ionizing properties of 116 UV-faint Lyman-break galaxies in the CEERS ERS data. This task is made possible by the greatly improved sensitivity, angular resolution, and filter suite of JWST/NIRCam relative to Spitzer/IRAC, resulting in far better constraining power on the demographics of rest-optical SEDs among sub- reionization-era galaxies (see Fig. 4). We infer the physical properties of each CEERS galaxy by fitting their 0.4–5m photometry to a suite of star-forming photoionization model SEDs with beagle (Chevallard & Charlot, 2016; Gutkin et al., 2016). Following many previous studies at , we adopt constant star formation history (CSFH) models for our fiducial fits, and we comment on how alternative star formation histories would change our results. To promote comparisons between independent analyses, we provide an online catalog (see Table 1) listing coordinates, flux densities, and inferred physical properties among our sample. Our main conclusions are summarized below, where we note how future observations can help clarify outstanding questions raised by our results.
-
1.
The photometric redshifts of galaxies in our sample range between and with a median of , while the inferred absolute UV magnitudes fall between with a median of (see Fig. 5). Adopting a characteristic UV luminosity corresponding to M (e.g. Bowler et al., 2017; Harikane et al., 2022a), this implies that the typical galaxy in our sample is 0.4 and 92% of our sources are classified as sub- systems.
-
2.
The NIRCam data clearly reveal a wide variety of CSFH ages among the sample (Fig. 6). For the bulk of galaxies in our sample, the measured flux density in either F356W, F410M, or F444W is consistent with extrapolating a power-law SED from the rest-UV photometry, implying that their SEDs are dominated by young stellar populations (30 Myr). Nonetheless, we do identify a considerable subset of objects (30% of the sample) with significant and nearly equal flux excesses in the three reddest NIRCam bands, implying the presence of a prominent Balmer break consistent with relatively evolved stellar populations (100-500 Myr). Another 30% of galaxies in our sample show very strong long-wavelength photometric excesses with the extent of the excess varying significantly from band to band, implying contamination from exceptionally high-EW nebular lines ([OIII]+H EW1500 Å) powered by very young stellar populations (10 Myr). In context of our fiducial CSFH models, this broad distribution in ages directly implies that sub- reionization-era galaxies have a wide diversity of (2 Gyr-1 to 500 Gyr-1).
-
3.
We find that UV-faint (0.4 ) galaxies typically have very large specific star formation rates (median Gyr-1; see Fig. 12), consistent with a scenario in which many of these systems recently experienced a strong upturn in their star formation activity. Combining our results with previous Spitzer/IRAC studies of the UV-bright galaxy population (Endsley et al., 2021; Topping et al., 2022a; Whitler et al., 2023b), we find evidence for a strong (5–10) increase in between 4 and 0.4 (Fig. 12). This implies that recently-formed OB stars contribute a larger fraction of the emergent light from fainter galaxies, resulting in a slight increase in the typical ionizing photon production efficiency in the CEERS sample (median 1025.71 erg-1 Hz in CEERS) relative to the UV-bright systems ( 1025.61 erg-1 Hz). This 0.1 dex increase in coupled with the steep faint-end slope of the UV luminosity function could imply that sub- reionization-era galaxies contribute more to reionization than previously thought. Future JWST surveys will help clarify the relative contribution of bright vs. faint galaxies to cosmic reionization by extending to wider areas (e.g. COSMOS-Webb, PRIMER), pushing to deeper depths (e.g. JADES, NGDEEP), and delivering spectra (e.g. FRESCO, UNCOVER).
-
4.
We infer the [OIII]+H EW distribution among UV-faint (0.4 ) galaxies assuming it follows a log-normal function, finding a median EW = 780 Å with a standard deviation of 0.32 dex (Fig. 13). Despite the fact that we find much larger among our CEERS galaxies, we find only a slight increase in the [OIII]+H EWs relative to more UV-luminous systems (2 ; Fig. 13). This is largely due to the substantial fraction (18%) of our CEERS galaxies that show SEDs consistent with high (20 Gyr-1) yet relatively weak [OIII]+H (EW600 Å; see Fig. 8). Such a population is not evident among brighter galaxies from IRAC data, nor among existing samples at covering similar [OIII]+H EWs (Tang et al., 2019). In context of our fiducial CSFH beagle models, young SEDs with weak [OIII]+H are often reproduced with extremely low metallicities (3% ; see Fig. 9) which greatly suppresses the [OIII] emission. However, we also demonstrate that high ionizing photon escape fractions () or a recent (10 Myr) sharp decline in star formation rate can also reproduce the SEDs for a subset of our galaxies (Fig. 10). Future spectroscopic observations will be necessary to not only confirm the existence of this seemingly important class of faint reionization-era galaxies, but also to better determine the physical origin of their weak [OIII]+H.
-
5.
As expected from previous studies utilizing deep HST/WFC3 data, we find that our UV-faint CEERS galaxies generally exhibit very blue UV slopes (median ; Fig. 5). Nonetheless, we identify three galaxies with high S/N (20) short-wavelength NIRCam photometry indicating very red UV slopes (), as well as long-wavelength photometric excesses implying strong [OIII]+H (EW800 Å) at (Fig. 11). While all three systems are classified as 0.3–0.5 from the data, their very red UV slopes imply that they would appear as far more luminous galaxies in the absence of dust (1–4 ). The fact that we identify three such objects in CEERS suggests that there remains a significant tail of heavily dust-reddened galaxies down to faint MUV. The beagle fits imply that 70–90% of their star formation is obscured which in total contributes 19% of all (unobscuredobscured) stellar mass growth inferred among our CEERS sample, even though these objects make up only 3% of the sample by number. Deep far-infrared follow-up will be critical to assess the extent of obscured star formation in UV-faint yet very red galaxies identified from deep JWST data.
-
6.
Our fiducial CSFH beagle fits imply that the NIRCam SEDs of UV-faint () galaxies are consistent with low stellar masses (median ), and only one object in our sample has 1010 . We investigate one object in our sample that was reported to have an extremely large stellar mass ( ) in a previous work (Labbé et al., 2023) which challenges models of galaxy formation (Boylan-Kolchin, 2023; Ferrara et al., 2023; Lovell et al., 2023). This galaxy shows an extremely red UV slope () with a high S/N LW photometric excess pattern that implies strong nebular line emission and hence a very young (4 Myr) SED. Because the recent burst may be outshining an older stellar population, we find a very wide range of plausible stellar mass solutions for this galaxy (108.6 to 1010.6 ) depending on the assumed star formation history (Fig. 14a,b). Given the extreme LW brightness of this object, we are able to clearly identify the characteristic 6-pointed diffraction pattern of JWST in the F356W, F410M, and F444W detections (see Fig. 14). While this is by no means conclusive evidence of an AGN (spectroscopic follow-up is necessary), it at least opens the possibility that the LW excesses are significantly assisted by AGN line emission and we find that the inclusion of such models yield a good fit to the measured photometry with (Fig. 14c). Dynamical mass estimates from future spectroscopic observations will help clarify the range of plausible stellar mass solutions for galaxies with very young SEDs (e.g. Tang et al., 2022; Topping et al., 2022a).
Acknowledgements
The authors thank the CEERS team for their hard work designing and executing the CEERS program. In addition, we thank the entire JWST team for their work designing, building, commissioning, and developing tools for the telescope. Finally, we thank the anonymous referree for helpful constructive comments, Mengtao Tang for providing information on their EELG sample, Gabe Brammer for providing the ACS imaging mosaics of the EGS field as part of CHArGE program, as well as Jacopo Chevallard for access to the beagle tool used for much of our SED fitting analysis.
RE and DPS acknowledge funding from JWST/NIRCam contract to the University of Arizona, NAS5-02015. DPS acknowledges support from the National Science Foundation through the grant AST-2109066. LW acknowledges support from the National Science Foundation Graduate Research Fellowship under Grant No. DGE-2137419.
This material is based in part upon High Performance Computing (HPC) resources supported by the University of Arizona TRIF, UITS, and Research, Innovation, and Impact (RII) and maintained by the UArizona Research Technologies department.
This work made use of the following software: numpy (Harris et al., 2020); matplotlib (Hunter, 2007); scipy (Virtanen et al., 2020); astropy888https://www.astropy.org/, a community-developed core Python package for Astronomy (Astropy Collaboration et al., 2013; Price-Whelan et al., 2018); Source Extractor (Bertin & Arnouts, 1996) via sep (Barbary, 2016); photutils (Bradley et al., 2022); beagle (Chevallard & Charlot, 2016); multinest (Feroz & Hobson, 2008; Feroz et al., 2009); prospector Johnson et al. (2021b); dynesty (Speagle, 2020); sedpy (Johnson, 2021); and fsps (Conroy et al., 2009; Conroy & Gunn, 2010) via python-fsps (Johnson et al., 2021a).
Data Availability
The HST/ACS and JWST/NIRCam images used in this work are available through the Mikulski Archive for Space Telescopes (https://mast.stsci.edu/). We provide an online catalog listing the coordinates, magnitudes, and inferred physical properties of our galaxy sample in CEERS. Additional data products will be made available upon reasonable request to the corresponding author.
References
- Adams et al. (2023) Adams N. J., et al., 2023, MNRAS, 518, 4755
- Aihara et al. (2022) Aihara H., et al., 2022, PASJ, 74, 247
- Akins et al. (2023) Akins H. B., et al., 2023, arXiv e-prints, p. arXiv:2304.12347
- Arellano-Córdova et al. (2022) Arellano-Córdova K. Z., et al., 2022, ApJ, 940, L23
- Ashby et al. (2018) Ashby M. L. N., et al., 2018, The Astrophysical Journal Supplement Series, 237, 39
- Astropy Collaboration et al. (2013) Astropy Collaboration et al., 2013, A&A, 558, A33
- Atek et al. (2015) Atek H., et al., 2015, ApJ, 800, 18
- Atek et al. (2023) Atek H., et al., 2023, MNRAS, 519, 1201
- Bagley et al. (2023) Bagley M. B., et al., 2023, ApJ, 946, L12
- Barbary (2016) Barbary K., 2016, The Journal of Open Source Software, 1, 58
- Barrufet et al. (2023) Barrufet L., et al., 2023, MNRAS, 522, 449
- Bertin & Arnouts (1996) Bertin E., Arnouts S., 1996, A&AS, 117, 393
- Bhatawdekar & Conselice (2021) Bhatawdekar R., Conselice C. J., 2021, ApJ, 909, 144
- Bosman et al. (2022) Bosman S. E. I., et al., 2022, MNRAS, 514, 55
- Bouwens et al. (2004) Bouwens R. J., et al., 2004, ApJ, 616, L79
- Bouwens et al. (2008) Bouwens R. J., Illingworth G. D., Franx M., Ford H., 2008, ApJ, 686, 230
- Bouwens et al. (2011) Bouwens R. J., et al., 2011, ApJ, 737, 90
- Bouwens et al. (2014) Bouwens R. J., et al., 2014, ApJ, 793, 115
- Bouwens et al. (2015) Bouwens R. J., et al., 2015, ApJ, 803, 34
- Bouwens et al. (2021) Bouwens R. J., et al., 2021, AJ, 162, 47
- Bouwens et al. (2022) Bouwens R. J., et al., 2022, ApJ, 931, 160
- Bowler et al. (2014) Bowler R. A. A., et al., 2014, MNRAS, 440, 2810
- Bowler et al. (2017) Bowler R. A. A., Dunlop J. S., McLure R. J., McLeod D. J., 2017, MNRAS, 466, 3612
- Bowler et al. (2020) Bowler R. A. A., Jarvis M. J., Dunlop J. S., McLure R. J., McLeod D. J., Adams N. J., Milvang-Jensen B., McCracken H. J., 2020, MNRAS, 493, 2059
- Boyett et al. (2022) Boyett K. N. K., Stark D. P., Bunker A. J., Tang M., Maseda M. V., 2022, MNRAS, 513, 4451
- Boylan-Kolchin (2023) Boylan-Kolchin M., 2023, Nature Astronomy,
- Bradley et al. (2022) Bradley L., et al., 2022, astropy/photutils: 1.5.0, doi:10.5281/zenodo.6825092, https://doi.org/10.5281/zenodo.6825092
- Brammer et al. (2022) Brammer G., Strait V., Matharu J., Momcheva I., 2022, grizli, Zenodo, doi:10.5281/zenodo.6672538, https://doi.org/10.5281/zenodo.6672538
- Bruzual & Charlot (2003) Bruzual G., Charlot S., 2003, MNRAS, 344, 1000
- Burgasser (2014) Burgasser A. J., 2014, in Astronomical Society of India Conference Series. (arXiv:1406.4887)
- Carnall et al. (2019) Carnall A. C., Leja J., Johnson B. D., McLure R. J., Dunlop J. S., Conroy C., 2019, ApJ, 873, 44
- Castellano et al. (2022) Castellano M., et al., 2022, ApJ, 938, L15
- Ceverino et al. (2018) Ceverino D., Klessen R. S., Glover S. C. O., 2018, MNRAS, 480, 4842
- Chabrier (2003) Chabrier G., 2003, PASP, 115, 763
- Chen et al. (2023) Chen Z., Stark D. P., Endsley R., Topping M., Whitler L., Charlot S., 2023, MNRAS, 518, 5607
- Chevallard & Charlot (2016) Chevallard J., Charlot S., 2016, MNRAS, 462, 1415
- Chevallard et al. (2018) Chevallard J., et al., 2018, MNRAS, 479, 3264
- Chisholm et al. (2022) Chisholm J., et al., 2022, MNRAS, 517, 5104
- Ciardi et al. (2000) Ciardi B., Ferrara A., Governato F., Jenkins A., 2000, MNRAS, 314, 611
- Coe et al. (2019) Coe D., et al., 2019, ApJ, 884, 85
- Conroy & Gunn (2010) Conroy C., Gunn J. E., 2010, ApJ, 712, 833
- Conroy et al. (2009) Conroy C., Gunn J. E., White M., 2009, ApJ, 699, 486
- Curti et al. (2023) Curti M., et al., 2023, arXiv e-prints, p. arXiv:2304.08516
- Davé et al. (2011) Davé R., Oppenheimer B. D., Finlator K., 2011, MNRAS, 415, 11
- Davé et al. (2012) Davé R., Finlator K., Oppenheimer B. D., 2012, MNRAS, 421, 98
- Davies et al. (2018) Davies F. B., et al., 2018, ApJ, 864, 142
- Davis et al. (2007) Davis M., et al., 2007, ApJ, 660, L1
- Dayal & Ferrara (2012) Dayal P., Ferrara A., 2012, MNRAS, 421, 2568
- Dayal & Ferrara (2018) Dayal P., Ferrara A., 2018, Phys. Rep., 780, 1
- Dayal et al. (2022) Dayal P., et al., 2022, MNRAS, 512, 989
- De Barros et al. (2019) De Barros S., Oesch P. A., Labbé I., Stefanon M., González V., Smit R., Bouwens R. J., Illingworth G. D., 2019, MNRAS, 489, 2355
- Donnan et al. (2023) Donnan C. T., et al., 2023, MNRAS, 518, 6011
- Dunlop et al. (2012) Dunlop J. S., McLure R. J., Robertson B. E., Ellis R. S., Stark D. P., Cirasuolo M., de Ravel L., 2012, MNRAS, 420, 901
- Egami et al. (2005) Egami E., et al., 2005, ApJ, 618, L5
- Endsley et al. (2021) Endsley R., Stark D. P., Chevallard J., Charlot S., 2021, MNRAS, 500, 5229
- Endsley et al. (2022) Endsley R., et al., 2022, MNRAS, 512, 4248
- Endsley et al. (2023) Endsley R., et al., 2023, MNRAS, 520, 4609
- Eyles et al. (2007) Eyles L. P., Bunker A. J., Ellis R. S., Lacy M., Stanway E. R., Stark D. P., Chiu K., 2007, MNRAS, 374, 910
- Ferland et al. (2013) Ferland G. J., et al., 2013, Rev. Mex. Astron. Astrofis., 49, 137
- Feroz & Hobson (2008) Feroz F., Hobson M. P., 2008, MNRAS, 384, 449
- Feroz et al. (2009) Feroz F., Hobson M. P., Bridges M., 2009, MNRAS, 398, 1601
- Ferrara et al. (2022) Ferrara A., et al., 2022, MNRAS, 512, 58
- Ferrara et al. (2023) Ferrara A., Pallottini A., Dayal P., 2023, MNRAS, 522, 3986
- Finkelstein et al. (2012) Finkelstein S. L., et al., 2012, ApJ, 756, 164
- Finkelstein et al. (2015) Finkelstein S. L., et al., 2015, ApJ, 810, 71
- Finkelstein et al. (2017) Finkelstein S. L., et al., 2017, The Cosmic Evolution Early Release Science (CEERS) Survey, JWST Proposal ID 1345. Cycle 0 Early Release Science
- Finkelstein et al. (2019) Finkelstein S. L., et al., 2019, ApJ, 879, 36
- Finkelstein et al. (2022a) Finkelstein S. L., et al., 2022a, ApJ, 928, 52
- Finkelstein et al. (2022b) Finkelstein S. L., et al., 2022b, ApJ, 940, L55
- Finkelstein et al. (2023) Finkelstein S. L., et al., 2023, ApJ, 946, L13
- Flury et al. (2022) Flury S. R., et al., 2022, ApJ, 930, 126
- Fujimoto et al. (2022) Fujimoto S., et al., 2022, Nature, 604, 261
- Furtak et al. (2022) Furtak L. J., et al., 2022, arXiv e-prints, p. arXiv:2212.10531
- González et al. (2010) González V., Labbé I., Bouwens R. J., Illingworth G., Franx M., Kriek M., Brammer G. B., 2010, ApJ, 713, 115
- González et al. (2014) González V., Bouwens R., Illingworth G., Labbé I., Oesch P., Franx M., Magee D., 2014, ApJ, 781, 34
- Goto et al. (2021) Goto H., et al., 2021, ApJ, 923, 229
- Grogin et al. (2011) Grogin N. A., et al., 2011, ApJS, 197, 35
- Gutkin et al. (2016) Gutkin J., Charlot S., Bruzual G., 2016, MNRAS, 462, 1757
- Harikane et al. (2022a) Harikane Y., et al., 2022a, ApJS, 259, 20
- Harikane et al. (2022b) Harikane Y., et al., 2022b, ApJ, 929, 1
- Harikane et al. (2023) Harikane Y., et al., 2023, ApJS, 265, 5
- Harris et al. (2020) Harris C. R., et al., 2020, Nature, 585, 357
- Huang et al. (2016) Huang K.-H., et al., 2016, ApJ, 817, 11
- Hunter (2007) Hunter J. D., 2007, Computing in Science & Engineering, 9, 90
- Illingworth et al. (2013) Illingworth G. D., et al., 2013, ApJS, 209, 6
- Inoue et al. (2014) Inoue A. K., Shimizu I., Iwata I., Tanaka M., 2014, MNRAS, 442, 1805
- Ishigaki et al. (2018) Ishigaki M., Kawamata R., Ouchi M., Oguri M., Shimasaku K., Ono Y., 2018, ApJ, 854, 73
- Izotov et al. (2016) Izotov Y. I., Orlitová I., Schaerer D., Thuan T. X., Verhamme A., Guseva N. G., Worseck G., 2016, Nature, 529, 178
- Jarvis et al. (2013) Jarvis M. J., et al., 2013, MNRAS, 428, 1281
- Johnson (2021) Johnson B. D., 2021, bd-j/sedpy: sedpy v0.2.0, doi:10.5281/zenodo.4582723, https://doi.org/10.5281/zenodo.4582723
- Johnson et al. (2021a) Johnson B., et al., 2021a, dfm/python-fsps: python-fsps v0.4.1rc1, Zenodo, doi:10.5281/zenodo.4737461
- Johnson et al. (2021b) Johnson B. D., Leja J., Conroy C., Speagle J. S., 2021b, ApJS, 254, 22
- Jung et al. (2020) Jung I., et al., 2020, ApJ, 904, 144
- Kneib et al. (2004) Kneib J.-P., Ellis R. S., Santos M. R., Richard J., 2004, ApJ, 607, 697
- Koekemoer et al. (2011) Koekemoer A. M., et al., 2011, ApJS, 197, 36
- Kron (1980) Kron R. G., 1980, ApJS, 43, 305
- Labbé et al. (2010) Labbé I., et al., 2010, ApJ, 716, L103
- Labbé et al. (2013) Labbé I., et al., 2013, ApJ, 777, L19
- Labbé et al. (2023) Labbé I., et al., 2023, Nature, 616, 266
- Leethochawalit et al. (2023) Leethochawalit N., et al., 2023, ApJ, 942, L26
- Leja et al. (2019) Leja J., Carnall A. C., Johnson B. D., Conroy C., Speagle J. S., 2019, ApJ, 876, 3
- Livermore et al. (2017) Livermore R. C., Finkelstein S. L., Lotz J. M., 2017, ApJ, 835, 113
- Lotz et al. (2017) Lotz J. M., et al., 2017, ApJ, 837, 97
- Lovell et al. (2023) Lovell C. C., Harrison I., Harikane Y., Tacchella S., Wilkins S. M., 2023, MNRAS, 518, 2511
- Lower et al. (2020) Lower S., Narayanan D., Leja J., Johnson B. D., Conroy C., Davé R., 2020, ApJ, 904, 33
- Ma et al. (2018) Ma X., et al., 2018, MNRAS, 478, 1694
- Madau et al. (1999) Madau P., Haardt F., Rees M. J., 1999, ApJ, 514, 648
- Mannucci et al. (2007) Mannucci F., Buttery H., Maiolino R., Marconi A., Pozzetti L., 2007, A&A, 461, 423
- Marley et al. (2021) Marley M. S., et al., 2021, ApJ, 920, 85
- Maseda et al. (2018) Maseda M. V., et al., 2018, ApJ, 854, 29
- Mason et al. (2018) Mason C. A., Treu T., Dijkstra M., Mesinger A., Trenti M., Pentericci L., de Barros S., Vanzella E., 2018, ApJ, 856, 2
- Mauduit et al. (2012) Mauduit J. C., et al., 2012, PASP, 124, 714
- McCracken et al. (2012) McCracken H. J., et al., 2012, A&A, 544, A156
- McLeod et al. (2016) McLeod D. J., McLure R. J., Dunlop J. S., 2016, MNRAS, 459, 3812
- McLure et al. (2011) McLure R. J., et al., 2011, MNRAS, 418, 2074
- McLure et al. (2013) McLure R. J., et al., 2013, MNRAS, 432, 2696
- Morishita & Stiavelli (2023) Morishita T., Stiavelli M., 2023, ApJ, 946, L35
- Naidu et al. (2020) Naidu R. P., Tacchella S., Mason C. A., Bose S., Oesch P. A., Conroy C., 2020, ApJ, 892, 109
- Naidu et al. (2022a) Naidu R. P., et al., 2022a, arXiv e-prints, p. arXiv:2208.02794
- Naidu et al. (2022b) Naidu R. P., et al., 2022b, ApJ, 940, L14
- Oesch et al. (2013) Oesch P. A., et al., 2013, ApJ, 773, 75
- Oesch et al. (2018) Oesch P. A., Bouwens R. J., Illingworth G. D., Labbé I., Stefanon M., 2018, ApJ, 855, 105
- Ono et al. (2010) Ono Y., Ouchi M., Shimasaku K., Dunlop J., Farrah D., McLure R., Okamura S., 2010, ApJ, 724, 1524
- Ono et al. (2012) Ono Y., et al., 2012, ApJ, 744, 83
- Pei (1992) Pei Y. C., 1992, ApJ, 395, 130
- Pérez-González et al. (2023) Pérez-González P. G., et al., 2023, ApJ, 946, L16
- Planck Collaboration et al. (2020) Planck Collaboration et al., 2020, A&A, 641, A6
- Plat et al. (2019) Plat A., Charlot S., Bruzual G., Feltre A., Vidal-García A., Morisset C., Chevallard J., Todt H., 2019, MNRAS, 490, 978
- Price-Whelan et al. (2018) Price-Whelan A. M., et al., 2018, AJ, 156, 123
- Rhoads et al. (2023) Rhoads J. E., et al., 2023, ApJ, 942, L14
- Roberts-Borsani et al. (2016) Roberts-Borsani G. W., et al., 2016, ApJ, 823, 143
- Robertson (2022) Robertson B. E., 2022, ARA&A, 60, 121
- Rodighiero et al. (2023) Rodighiero G., Bisigello L., Iani E., Marasco A., Grazian A., Sinigaglia F., Cassata P., Gruppioni C., 2023, MNRAS, 518, L19
- Rogers et al. (2013) Rogers A. B., McLure R. J., Dunlop J. S., 2013, MNRAS, 429, 2456
- Ryan & Reid (2016) Ryan R. E. J., Reid I. N., 2016, AJ, 151, 92
- Salmon et al. (2015) Salmon B., et al., 2015, ApJ, 799, 183
- Salmon et al. (2020) Salmon B., et al., 2020, ApJ, 889, 189
- Sanders et al. (2018) Sanders R. L., et al., 2018, ApJ, 858, 99
- Saxena et al. (2022) Saxena A., et al., 2022, MNRAS, 511, 120
- Schaerer & de Barros (2009) Schaerer D., de Barros S., 2009, A&A, 502, 423
- Schaerer & de Barros (2010) Schaerer D., de Barros S., 2010, A&A, 515, A73
- Schaerer et al. (2022) Schaerer D., Marques-Chaves R., Barrufet L., Oesch P., Izotov Y. I., Naidu R., Guseva N. G., Brammer G., 2022, A&A, 665, L4
- Shen et al. (2020) Shen X., Hopkins P. F., Faucher-Giguère C.-A., Alexander D. M., Richards G. T., Ross N. P., Hickox R. C., 2020, MNRAS, 495, 3252
- Skelton et al. (2014) Skelton R. E., et al., 2014, ApJS, 214, 24
- Smit et al. (2014) Smit R., et al., 2014, ApJ, 784, 58
- Smit et al. (2015) Smit R., et al., 2015, ApJ, 801, 122
- Smit et al. (2018) Smit R., et al., 2018, Nature, 553, 178
- Song et al. (2016) Song M., et al., 2016, ApJ, 825, 5
- Speagle (2020) Speagle J. S., 2020, MNRAS, 493, 3132
- Stanway et al. (2008a) Stanway E. R., Bremer M. N., Lehnert M. D., 2008a, MNRAS, 385, 493
- Stanway et al. (2008b) Stanway E. R., Bremer M. N., Squitieri V., Douglas L. S., Lehnert M. D., 2008b, MNRAS, 386, 370
- Stark et al. (2009) Stark D. P., Ellis R. S., Bunker A., Bundy K., Targett T., Benson A., Lacy M., 2009, ApJ, 697, 1493
- Stark et al. (2013) Stark D. P., Schenker M. A., Ellis R., Robertson B., McLure R., Dunlop J., 2013, ApJ, 763, 129
- Stefanon et al. (2017) Stefanon M., et al., 2017, ApJS, 229, 32
- Stefanon et al. (2019) Stefanon M., et al., 2019, ApJ, 883, 99
- Stefanon et al. (2022) Stefanon M., Bouwens R. J., Labbé I., Illingworth G. D., Oesch P. A., van Dokkum P., Gonzalez V., 2022, ApJ, 927, 48
- Stefanon et al. (2023) Stefanon M., Bouwens R. J., Labbé I., Illingworth G. D., Gonzalez V., Oesch P. A., 2023, ApJ, 943, 81
- Steidel et al. (2016) Steidel C. C., Strom A. L., Pettini M., Rudie G. C., Reddy N. A., Trainor R. F., 2016, ApJ, 826, 159
- Steinhardt et al. (2014) Steinhardt C. L., et al., 2014, The Astrophysical Journal, 791, L25
- Strait et al. (2020) Strait V., et al., 2020, ApJ, 888, 124
- Tacchella et al. (2022) Tacchella S., et al., 2022, ApJ, 927, 170
- Tacchella et al. (2023) Tacchella S., et al., 2023, MNRAS, 522, 6236
- Tang et al. (2019) Tang M., Stark D. P., Chevallard J., Charlot S., 2019, MNRAS, 489, 2572
- Tang et al. (2021) Tang M., Stark D. P., Chevallard J., Charlot S., Endsley R., Congiu E., 2021, MNRAS, 501, 3238
- Tang et al. (2022) Tang M., Stark D. P., Ellis R. S., 2022, MNRAS, 513, 5211
- Taylor et al. (2022) Taylor A. J., Barger A. J., Cowie L. L., 2022, ApJ, 939, L3
- Topping et al. (2022a) Topping M. W., et al., 2022a, MNRAS, 516, 975
- Topping et al. (2022b) Topping M. W., Stark D. P., Endsley R., Plat A., Whitler L., Chen Z., Charlot S., 2022b, ApJ, 941, 153
- Trenti et al. (2011) Trenti M., et al., 2011, ApJ, 727, L39
- Trump et al. (2023) Trump J. R., et al., 2023, ApJ, 945, 35
- Vidal-García et al. (2022) Vidal-García A., Plat A., Curtis-Lake E., Feltre A., Hirschmann M., Chevallard J., Charlot S., 2022, arXiv e-prints, p. arXiv:2211.13648
- Virtanen et al. (2020) Virtanen P., et al., 2020, Nature Methods, 17, 261
- Wang et al. (2020) Wang F., et al., 2020, ApJ, 896, 23
- Weinmann et al. (2011) Weinmann S. M., Neistein E., Dekel A., 2011, MNRAS, 417, 2737
- Whitler et al. (2023a) Whitler L., Endsley R., Stark D. P., Topping M., Chen Z., Charlot S., 2023a, MNRAS, 519, 157
- Whitler et al. (2023b) Whitler L., Stark D. P., Endsley R., Leja J., Charlot S., Chevallard J., 2023b, MNRAS, 519, 5859
- Windhorst et al. (2011) Windhorst R. A., et al., 2011, ApJS, 193, 27
- Wuyts et al. (2007) Wuyts S., et al., 2007, ApJ, 655, 51
- Yan & Windhorst (2004) Yan H., Windhorst R. A., 2004, ApJ, 612, L93
- Yan et al. (2023) Yan H., Ma Z., Ling C., Cheng C., Huang J.-S., 2023, ApJ, 942, L9
- Yang et al. (2020) Yang J., et al., 2020, ApJ, 897, L14
- Zackrisson et al. (2013) Zackrisson E., Inoue A. K., Jensen H., 2013, ApJ, 777, 39
- de Barros et al. (2014) de Barros S., Schaerer D., Stark D. P., 2014, A&A, 563, A81