Supercooling of the A phase of 3He
Abstract
Abstract:
Because of the extreme purity, lack of disorder, and complex order parameter, the first-order superfluid 3He A-B transition is the leading model system for first order transitions in the early universe. Here we report on the path dependence of the supercooling of the A phase over a wide range of pressures below 29.3 bar at nearly zero magnetic field. The A phase can be cooled significantly below the thermodynamic A-B transition temperature. While the extent of supercooling is highly reproducible, it depends strongly upon the cooling trajectory: The metastability of the A phase is enhanced by transiting through regions where the A phase is more stable. We provide evidence that some of the additional supercooling is due to the elimination of B phase seeds formed upon passage through the superfluid transition. A greater understanding of the physics is essential before the 3He can be exploited to model transitions in the early universe.
*Correspondence to: jmp9@cornell.edu
Department of Physics, Cornell University, Ithaca, NY, 14853, USA
Physics Department, Technion, Haifa, Israel
Department of Physics and Astronomy, University of Sussex, Falmer, Brighton BN1 9QH, UK
Department of Physics and Helsinki Institute of Physics, PL 64, FI-00014 University of Helsinki, Finland
VTT Technical Research Centre of Finland Ltd, Espoo, Finland
Department of Physics, Royal Holloway University of London, Egham, TW20 0EX, Surrey, UK
Introduction
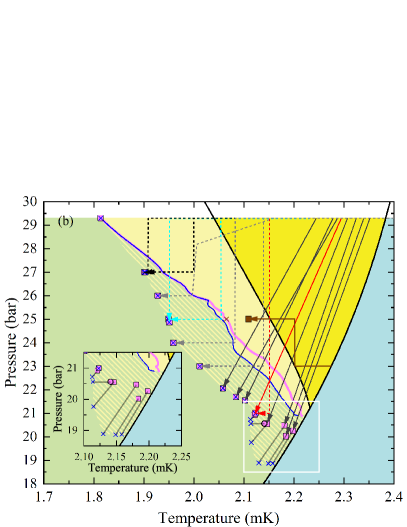
The condensation of 3He pairs into a superfluid state occurs via a second order phase transition at a pressure dependent transition temperature, , shown in Figure 1. The anisotropic A phase is favored at high temperatures and pressures, while the isotropic B phase is the stable phase below the line7, 2. In zero magnetic fields the equilibrium phase diagram exhibits a polycritical point3 (PCP) at which the line of first order transitions () intersects the line of second order transitions () at 21.22 bar and 2.273 mK. The transition between the A and B phases is first order and thus subject to hysteresis. At the PCP, the bulk free energies of the A, B superfluid phases and the normal state are equal.

The A phase is highly metastable, and can persist down to extremely low temperatures for long times ( 1 day) at high pressures, providing surfaces of the container are smooth10. Standard homogeneous nucleation theory11, 12 argues that the transition from metastable A to stable B is mediated by thermal fluctuations that produce bubbles of characteristic size . For small bubbles (size less than the critical radius, ), the interfacial energy cost () is larger than the bulk free energy gain (), but for large bubbles the opposite holds. Thus, if thermal fluctuations create a bubble with , it rapidly shrinks. Conversely, a bubble with will grow. This model13, applied to 3He, leads to 1.5 m, and an activation energy which is many orders of magnitude above the thermal energy14, 15, 16 implying an unobservably small nucleation rate. Surface defects potentially alter the energetics (most surfaces favor the A phase17 and there is no clean explanation of how they would mediate the A-B transition). Despite extensive experimental5, 6, 18, 19, 10, 20, 21, 22, 4 (Figure 1) and theoretical investigations23, 24, 12, 26, 27, 28, the mechanism for B phase nucleation remains a mystery.
Laboratory studies of the dynamics of first order phase transitions have cosmological implications. Importantly, the possibility of first order symmetry-breaking phase transitions 29, 30 in the early universe have been used to explain baryon asymmetry31. The same physics also produces gravitational waves32, 33, 34, 35 that are thought to be detectable in future space based detectors such as Laser Interferometer Space Antenna (LISA) 36, 37. Experimental confirmation of its applicability to a laboratory system would lend more weight to the calculations of gravitational wave production for LISA and other future probes of the early Universe. However, the theory of first order phase transitions in the early Universe38, 39 is based on the same homogeneous nucleation theory which fails to explain the behavior of 3He.
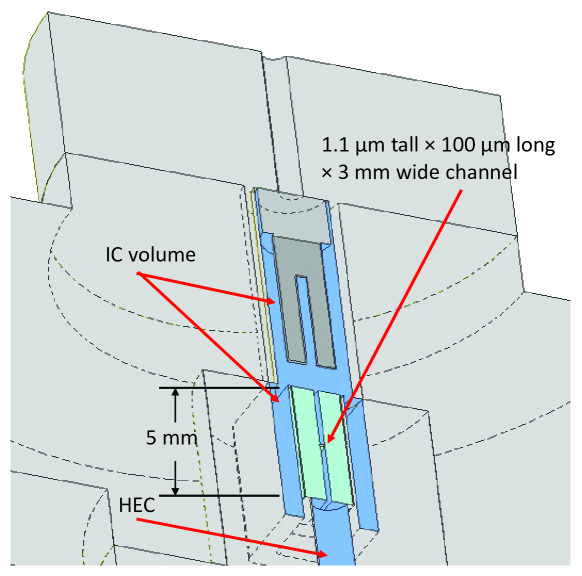
Here we study the nucleation of B phase in a pair of chambers connected by a high aspect-ratio “letterbox” channel (Figure 2). Both the geometry and the surface qualities are relevant: The smaller chamber (denoted the Isolated Chamber (IC)) incorporates “ordinary” as-machined coin silver surfaces. It also houses a quartz fork whose resonant properties (frequency and quality factor, ) allow us to infer the phase of the 3He in the chamber. The IC is separated from a larger chamber containing sintered silver by a micromachined channel construction consisting of a 1.1 m tall 3 mm wide 100 m long channel and 200 m tall 3 mm wide 2.5 mm long lead-in channels on either side. This construction was nanofabricated in silicon and capped with glass2 (See also Supplementary Note 1). The silver sinter containing chamber (denoted the Heat Exchange Chamber (HEC)) incorporates a quartz fork similar to that contained in the IC. The A phase is stabilized in confined spaces, and the narrow channel potentially prevents the propagation of an A-B phase boundary from one chamber to the other – allowing the transitions to be independent.

In an earlier publication4, we reported initial observations of the reproducibility of B phase nucleation and an unexpected path dependence for the A phase’s stability. From those experiments it was unclear whether the path dependence was limited to the region near the PCP and there were few clues about the microscopic origin of the phenomenon. Here, we have expanded the region investigated to include the highest pressure readily accessible to us (the pressure of the minimum of the 3He melting curve, 29.3 bar) and have designed a series of protocols which provide significantly more clarity about the phenomenon.
As already emphasized, homogeneous nucleation theory is unable to explain the nucleation of the B phase from the A phase: There is a vanishing probability that thermal fluctuations produce a B phase bubble which is larger than the critical radius. The transition can be triggered9, 20, 41 by bringing a radioactive source near 3He – which is consistent with models where energetic particles (either deliberately introduced or due to Cosmic rays) are responsible for the observed A-B phase transition16, 20, 41. Those models can not explain why when 3He is repeatedly cooled6, 4, the transition consistently occurs along the same temperature and pressure line (dubbed the catastrophe line6). Alternate models such as Q balls27 or Resonant Tunneling (RT)28 have been proposed to explain this behavior. Those field-theory inspired models, however, are not consistent with the path dependence seen in our experiments.
In an attempt to explain our observations, we note that the silver sinter contains a large number of chambers which are connected to the bulk fluid by narrow channels or constrictions. We hypothesise that, upon traversing , the B phase is formed in some of these chambers, while the A phase is formed in the bulk. For computational expediency we specify these chambers to be filled with B phase. However, confinement would result in a distorted order parameter quite different from the bulk B phase. Surface tension stabilizes the requisite A-B domain walls at sufficiently small constrictions. The size of the largest stable domain wall depends on pressure and temperature: In the A region of the phase diagram, the A phase will rush in to any of the chambers whose opening is larger than this size. Conversely, the (path dependent) catastrophe line will be determined by the size of the smallest constriction that connects to a B-filled chamber. This model is similar to the lobster-pot scenario which was proposed for understanding the nucleation of the A phase from B12.
Cavities in the sinter are unable to explain all of our observations, and it is likely that some other mechanism is also at play. For example, the A phase order parameter (in standard experimental geometries) may contain complicated textures with highly frustrated points that may act as seeds for the B phase. Such seeds may involve B-inclusions, or just precursor regions where the A order parameter is strongly suppressed. While some of this structure forms spontaneously due to the Kibble-Zurek mechanism42, 43, much of the spatial complexity is likely due to surface effects: Surfaces constrain the orientation of the order parameter and surface corrugations or scratches can lead to complicated disgyrations and other structures44, perhaps containing seeds of B phase. Similar to the cavity scenario, the observed A-B transition is set by the size of the “largest” seed, whose catastrophe temperature is highest. These largest seeds are also the most fragile and may be eliminated by exposure to high pressures where the A phase is most stable. The key feature of the the path-dependence in both scenarios is which seeds survive. Development of an understanding of this pressure dependence is essential if 3He is to to be a useful model for phase transitions in the early Universe.
We emphasize that the order parameter of helium is contained in a high dimensional space, and the paths connecting the A and B phases are strongly influenced by surfaces, textures, and distortions from confinement. Nucleation can occur through both thermal fluctuations and quantum tunneling, the latter of which can display interference effects which are particularly sensitive to such changes in the energy landscape38. Models of nucleation in inhomogeneous settings contain a multitude of complexities45.
Results
0.1 Experimental details.
The normal-superfluid and A-B transitions were detected using quartz forks located in the IC and HEC. The temperatures were obtained with reference to a 3He melting curve thermometer46 mounted on the cold plate of the nuclear demagnetization stage. For details of the operation of the forks and of the thermometry, we refer to the methods section.
0.2 Supercooling at constant pressure.
The first set of measurements were carried out while cooling at a constant rate (10 K/hr) and fixed pressure. Figure 3(a) shows the temperatures at which the A-B phase transition was detected in the HEC (pink triangles) and the IC (blue triangles). Below 23.8 bar the HEC transition occurs at a substantially higher temperature than in the IC. In this regime we believe that the A phase is stable in the channel: It acts as a plug, preventing the A-B wave-front from propogating from the HEC to the IC. The silver sinter in the HEC leads to more complicated variations of the order parameter, and it is reasonable that the HEC and IC contain different B phase seeds with different catastrophe temperatures. Between 23.8 bar and 26 bar there is a decrease in the separation between the two transitions, which suggests that the A-B wave-front is only weakly pinned by the channel. Above 26 bar the two transitions happen simultaneously, and we conclude that in this regime the channel is unable to sustain an A-B interface once the transition is initiated in the HEC. (see the Discussion section and Supplementary Notes 2 and 3).

0.3 Supercooling after decreasing pressure.
In our model the largest degree of supercooling should occur for trajectories passing through the regions where the A phase is most stable (ie. at high pressure). To explore this feature, we first cool at our highest accessible pressure (29.3 bar) followed by depressurizing and further cooling. In Figure 3(b) we illustrate several such trajectories. The solid black lines show cooling trajectories where we maintained an approximately constant of the fork in the IC. This constant- condition yields a path which is roughly parallel to . For these trajectories we depressurized by 4-6 bar during the first day, followed by proceeding at 1.3 bar per day, or less. During the rapid part of the ramp, but not during the slow part, there was some viscous heating observed in the IC.
We found that the extent of supercooling was significantly greater than what we achieved while cooling at constant pressure (denoted by pink (HEC) and blue (IC) lines instead of data points in Figure 3(b)). With the exception of the four lowest constant runs (closest to ), the A-B transitions occurred simultaneously in both chambers, and are depicted in Figure 3(b) as co-incident crosses and squares. The same symbols (crosses for IC and squares for HEC) are used to denote the observed coordinates of the pressure varied transitions for the four lowest points. A temperature correction is applied to the IC data to account for thermal offsets between the chambers.
To further explore the path dependence, we considered the trajectories shown as dashed lines in Figure 3(b). These begin with constant-pressure cooling at 29.3 bar, followed by fixed temperature depressurizations and fixed pressure cooling. In all cases we observe significantly more supercooling than in Figure 3(a). Crucially, there appears to be a definitive locus of points in the plane on which all of the trajectories fall. As illustrated by the dotted black and cyan paths (terminating at 25 and 27 bar), one finds the same A-B transition points when cooling after depressurizing or depressurizing at constant temperature – as long as the trajectory passed through the A phase at 29.3 bar.
In Supplementary Note 4 we present a detailed comparison between the 23 bar fixed pressure run, and one of the trajectories passing through 29.3 bar before cooling at 23 bar. We find that the only detectable difference is the temperature of the A-B transition. There are no signs of thermal gradients, viscous heating, or other systematic effects.
0.4 Other supercooling results.
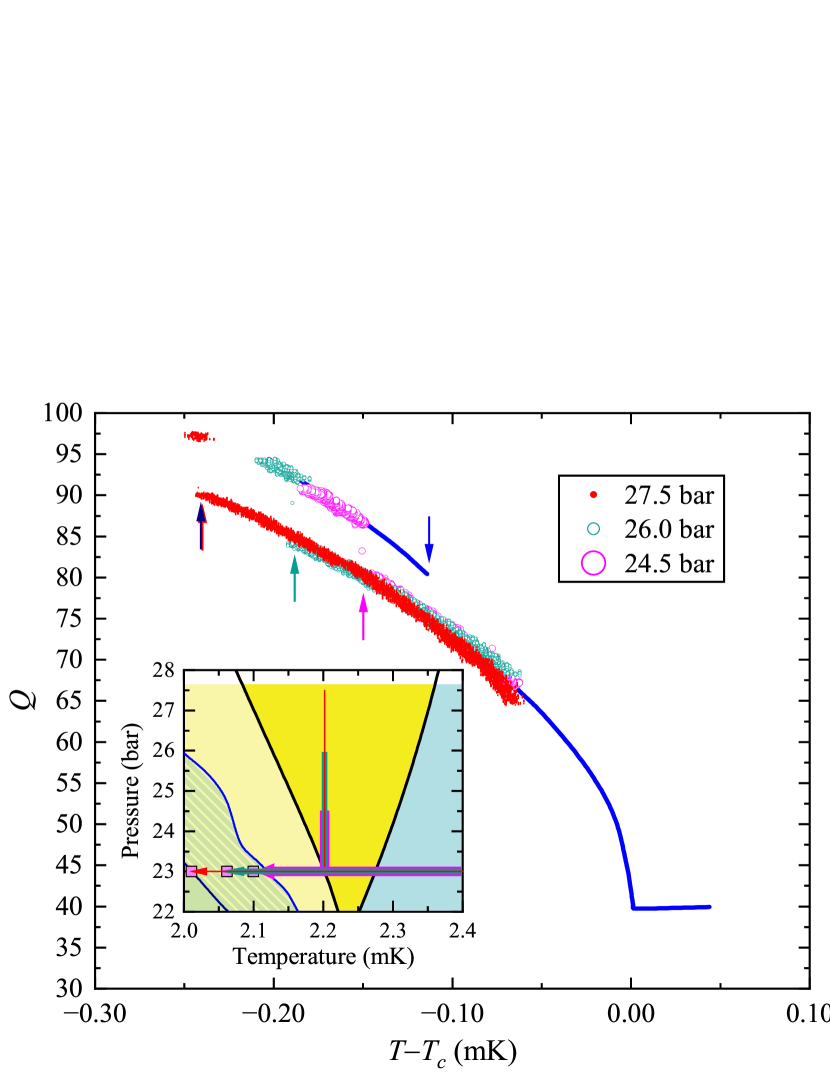
Figure 4 illustrates four additional runs, each of which involve cooling at 23 bar. The blue curve shows the quality factor of the quartz oscillator in the HEC during cooling. It jumps discontinuously at mK ( = mK), indicating the A-B phase transition. For the other three runs, the helium is cooled to 2.2 mK, and then slowly pressurized to 24.5 bar, 25 bar, or 27.5 bar. The pressure is then reduced back to 23 bar, and the temperature is reduced further. As expected from our model, the degree of supercooling is a monotonic function of : The B phase seeds are suppressed by excursions deep into the equilibrium A phase. In these regions the free energy differences between the A and B phases are largest compared to the thermodynamics barriers. Note, the changes caused by these excursions are subtle enough that they do not appreciably change the quality factors (aside from shifting the A-B transition).
The brown path in Figure 3(b) illustrates the reverse effect. We traverse the stable A phase at 23 bar. We then increase the pressure to 26 bar before continuing to cool. We find that the A-B transition occurs at a higher temperature than if we simply cool at 26 bar. This path avoids the regions of the phase diagram where the A phase is most stable.
To ensure that the supercooling is not significantly affected by the sweep rate, we repeated the experiment in Figure 4, varying the rate of pressurizing and depressurizing during the jog from 23 bar to 27 bar and back. We varied this rate from 1.3 bar/day to 27.5 bar/day, finding no difference in the degree of supercooling after completing the cooling at 10 K/hr.
To verify the stability of the A phase obtained after depressurization, we selected a trajectory that terminated below the PCP from Figure 3(b). After cooling through , starting from 29.3 bar and 2.15 mK we depressurized (at fixed ) to 20.5 bar and stopped at a point within 3 K of the the temperature where we previously observed the transition. We waited at this for 1 day. We then slowly cooled at a rate of 0.5 K/hr until we observed the transition in the HEC approximately 2 K below the previously observed result (open pink circle in Figure 3(b)). Thus the supercooled A phase has a lifetime in excess of 24 hours, and any dynamics which happen on this timescale do not appear to significantly influence the catastrophe line. Further, the A-B transition in the IC () occurred at a lower temperature than the transition in the HEC, consistent with the other depressurization runs terminating in this part of the phase diagram (see Figure 3(b) and its inset).
Discussion
We analyze our data by considering the model from our introduction, where the B phase grows from seeds which are contained in small chambers with a distribution of narrow necks. While cooling through the A phase, the A phase intrudes on the chambers with the largest openings: The size of the remaining B seeds determines the path-dependent location of the observed A-B transition. Similar logic should apply to the cases where the B seeds are at the nodes of frustrated textures or distortions.
In order to balance forces, an equilibrium domain wall between the A and B phase must be bowed with a mean curvature , where is the surface tension and is the difference in free energy densities between the two phases. As detailed in the Supplementary Note 3, a circular hole in a flat plate with diameter will prevent the intrusion of the A phase if , where the contact angle is determined by surface energies. Conversely, in the B region of the phase diagram, the same orifice will prevent the B phase from exiting if – the contact angle does not appear in this expression because the B phase typically does not wet a surface. Note: these equations are sensitive to our modelling of the geometry of the orifice, and the contact angle depends on the surface properties.

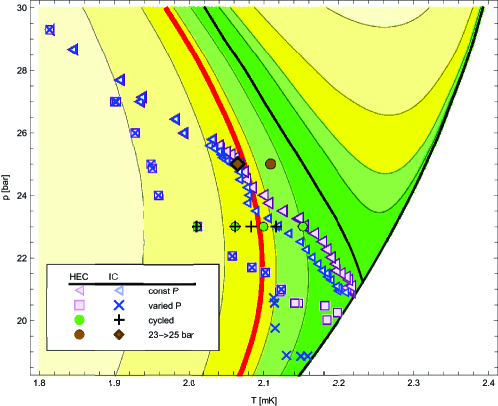
In Figure 5 we show contours of constant and constant , calculated using a Landau-Ginzburg theory and assuming minimal pairbreaking boundary conditions, corresponding to smooth surfaces. (See Supplementary Notes 2 and 3. Supplementary Note 5 deals with the results obtained for maximally pairbreaking boundary conditions. There is some ambiguity in the temperature dependence of the Landau-Ginzburg parameters, and Supplementary Note 6 discusses an alternative model.) As can be seen, vanishes at the equilibrium A-B transition, where the two phases have the same free energy. It also vanishes at . The dark green regions show where it is small. The largest values of are found at high pressure, and the largest values of are found at low temperature. Our model would predict that for a given cooling trajectory at the A-B catastrophe line will coincide with the largest value of encountered while cooling: ie. . For example, a constant pressure cooled trajectory at 23.25 bar will almost touch the contour between the light and dark green regions in the A phase. The A-B transition is therefore expected to be at the same contour in the B phase. All of the varied-pressure trajectories pass through the A phase close to the contour that separates the two lightest shades of yellow – and one therefore expects the catastrophe line to follow the corresponding B contour.
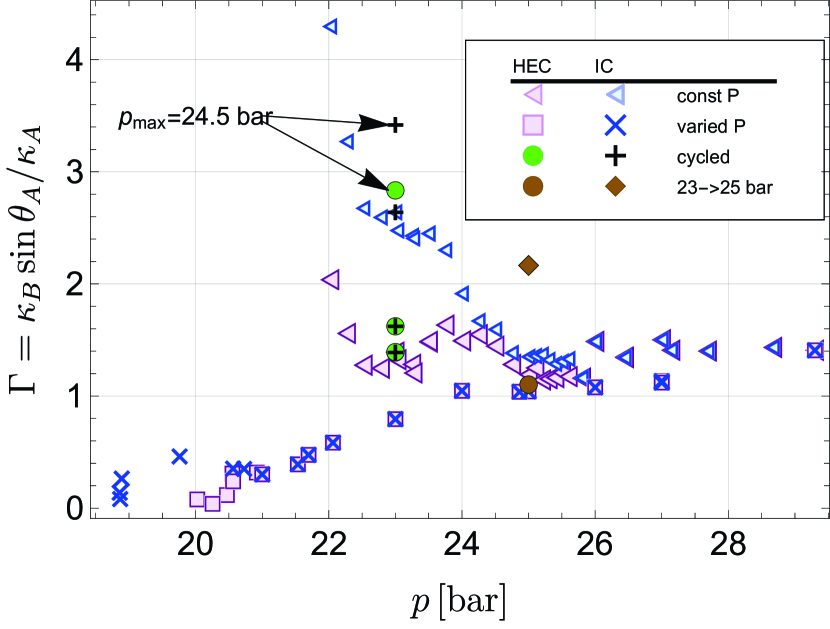
To better quantify the data, in Figure 6 we plot the ratio vs. the pressure at which the A-B transition was observed. There is a remarkable data collapse for all pressures above 24 bar, despite the fact that the trajectories (pressure-varied or constant-pressure) are very different. The ratio is larger than the expected value of 1, and is essentially constant. Variations in the geometry or boundary conditions could cause this ratio to be different from unity – for example, the contact angle could be slightly less than what is predicted by the theory. Previous experiments have directly tested aspects of our model of the AB phase boundary17, including measuring equilibrium contact angles, surface tensions, and surface energies at low pressure. A number of theoretical works have also addressed the issue18, 19, 20.
Below 24 bar the fixed pressure HEC and IC A-B transition data separate. Below 20.5 bar, a similar separation occurs in the pressure varied runs. These features naturally correspond to when the channel connecting the HEC and IC can no longer support a domain wall. This feature is apparent in Figure 5, where we draw a red line which corresponds to the contour with m-1. To the right of this line the transitions in the IC and HEC occur independently, while to the left they occur simultaneously. The IC data points which follow this red line correspond to events where the pre-existing B phase in the HEC propogates through the channel, and do not represent independent nucleation events. This includes the points below the PCP accessed by depressurization and then cooling at constant pressure. As argued in Supplementary Note 3, the B phase can propogate into the channel when , where m is the height of the channel. Our inferred contact angle () is larger than typical values predicted by the Landau-Ginzburg theory with minimal () or maximal () pairbreaking boundary conditions (See Supplementary Figure 4). This may be a feature of the glass and silicon surfaces in the channel, or it may point towards limitations in the accuracy of our theoretical model.
Between 22.5 and 23.8 bar, the constant pressure cooled transitions in the HEC continue to agree with our model, with (pink triangles). Over the same range the IC data clusters near (blue triangles), and it is likely that the transition is completely independent of the HEC. This clustering suggests that a similar model may apply there, but with different surface geometries and boundary conditions, or the involvement of different order parameter structures. The HEC contains sintered silver, with clear candidates for B-containing chambers. The IC incorporates as-machined coin silver surfaces, with no obvious cavities which could be playing the role of the sinter in the HEC.
An additional potential mechanism for heterogeneous nucleation involves the presence of surface defects, or features, which favour a distorted order parameter. The simplest model would treat this as a B phase seed, pinned at the surface with an associated A-B interface. The model of the catastrophe line would be analogous to the one we proposed for the sinter 51. Given the multicomponent nature of the superfluid 3He order parameter (a complex 3 3 matrix), the nature of the spatially dependent order parameter of this seed region is complex. The path dependence could reflect evolution of the order parameter structures that alter the energetics of the transformation from the A phase to the B phase, without the benefit of an actual interface that would be present if a “seed” of B phase were present.
The curvature vanishes at the as one approaches the polycritical point from above, and hence diverges near there for all of the constant pressure data. At these pressures the distribution of B seeds are likely determined by kinetic processes occurring during the normal-superfluid transition rather than details of the cooling trajectory. As emphasized in our previous work4, it is surprising that we form the A phase when cooling at pressures below the PCP even in magnetic fields below 0.1 mT.
Below 24 bar, falls for the pressure varied data. This suggests that a separate mechanism is at play: The A-B transition occurs before our model would predict. Below 20.5 bar the transition in the IC and HEC separate. The ratio for the HEC data continues to fall, further indicating a mechanism in the HEC which goes beyond our model. Between 20.5 and 19 bar the transition in the IC is likely not an independent nucleation event, but rather due to the A-B domain wall breaking through the channel (corresponding to the red line in Figure 5). This appears as a plateau Figure 6. The cluster of IC transitions at 19 bar are likely independent nucleation events.
Figure 6 contains two additional outliers. The green discs and black crosses show for the pressure cycled transitions depicted in Figure 4. The trajectories that cycled to 26 bar and 27.5 bar agree very well with the rest of the data. The trajectory that cycled to 24.5 bar, however, shows more supercooling than expected, and a surprisingly large value of . While we do not understand why the HEC shows such a large degree of supercooling, the IC transition coincides with the red line in Figure 5, and is likely due to the physics of the superfluid in the channel connecting the chambers. Similarly, the brown diamond corresponds to the trajectory in Figure 3(b) which was cooled at p= 23 bar to 2.2 mK, pressurized to 25 bar, and then further cooled. It also lies on the red line in Figure 5 and is presumed to correspond to the B phase being conveyed through the channel. The transition in the HEC for this trajectory (brown disc) agrees well with our model.
Finally we note that the domain wall between the A and B phases has a finite width, extending over a few temperature dependent coherence lengths (see Eqn. 5 in Supplementary Note 2 and Supplementary Figure 2). Near the temperature dependent coherence length diverges, . The resulting “thick” domain walls are likely to have different elastic properties and may not have a well defined curvature. This feature may account for some of the decrease in the ratio plotted in Figure 6 for the pressure varied runs that extended to transitions near .
While we have developed a coherent picture, we emphasize that a number of mysteries still remain. First, we do not have an explanation for the appearance of the A phase upon crossing for a range of pressures below the tricritical point. Second, we do not have a model for the nucleation of B seeds during the transition from the normal phase into the superfluid. Third, we have yet to establish the exact form of order parameter features which hold the those seeds. This is particularly true in the IC, which lacks any natural cavities.
In conclusion, we find that the supercooling of the A phase can be extended considerably by transiting through high pressure regions where the A phase is more stable (measured by the ratio of the A-B free energy difference per coherence length to the surface tension). The path dependence observed here is remarkable, and is only possible because of the purity of 3He and the relatively large energy barriers between the superfluid phases. The supercooled liquid is stable at pressures as low as 18.6 bar which can be contrasted to the lowest stable pressure for bulk 3He, 21.23 bar. We found that the lifetime of the metastable fluid exceeded one day at 19.8 bar. For a significant part of the phase diagram the degree of supercooling appears to be determined by the maximum value of encountered – a quantity which corresponds to the inverse size of an aperture which can support an A-B domain wall.
Despite these insights, aspects of the A-B transition remains enigmatic. In the superfluid 3He environment of this experiment we have made a study of the systematics of heterogeneous nucleation by exploring a variety of trajectories in the pressure-temperature plane. We have shown that the surface energy of the A-B interface (strongly dependent on p and T), and the contact angle with surfaces play a central role in this nucleation process. On the other hand in previous work on superfluid 3He confined in a nanofluidic cavity52 negligible supercooling was observed. The transformation from the A to the B phase involves a transit through a multi-dimensional landscape that could be hysteretic with pressure. To develop the A-B phase transition as a model for the first order transitions in the early universe, identification of all mechanisms is essential. As we observe in our analog system, it is possible that the early universe was not homogeneous, but may have contained structures such as topological defects or primordial black holes which could play a role in the nucleation of first order phase transitions 53, 54. Further studies will include those of superfluid 3He confined in nano-structured environments, in which nucleation is studied in precisely engineered volumes, coupled to bulk liquid through “valves” which effectively isolate that volume from nucleation events in the bulk liquid and heat exchanger, and in which NMR is used as a non-invasive probe. Similar structures might also be used to seed the non-equilibrium Polar phase and other phases that are not by themselves stable or naturally occurring in the bulk. In turn, analogs of these structures might provide insights into the underpinnings of transitions in the early Universe.
Methods
0.5 Fork operation.
The two quartz forks were each driven at constant voltage (small enough so that no drive dependent heating was observed) from a signal generator. A current preamplifier was used as the first stage of amplification before the received signal was sent to a lock-in amplifier. The lock-in’s reference frequency was ported from a signal generator. By measuring and fitting the (complex) frequency dependent non-resonant signal in the circuit, the (anti-symmetric) quadrature component of the received signal (after background subtraction) was used to infer the difference between the drive frequency and the resonant frequency, while the in-phase component was used to infer the “” or Quality factor of the fork. The forks were maintained within 10 Hz of the resonant frequency (near 32 kHz) with factors varying from 40 at , to about 200 at the lowest temperatures at high pressure. In operation the forks could track the well without attention. At the A-B transition, Figure 4, the increased by 10 abruptly, providing a clear signature of the transition.
0.6 Thermometry.
The temperature of the HEC detected at was found to lag the temperature of the melting curve thermometer (mounted on the demagnetization stage) by only 1-2 K providing the warming and cooling rates were less than 10 K/hr. We estimate the accuracy of our inferred A-B transition temperatures to be 3 K, as long as the cooling rate was held constant in a given A-B transition run. The cooling rate of the nuclear stage was controlled by adjusting the rate of decrease of the current in the magnet and could be reliably set to be a constant 10 K or even held constant ( 3 K) for periods as long as a day. The temperature of the fork in the IC lagged that of the HEC by 15 K (inferred by observing the differences in the observed while cooling at constant temperature). In all graphs the data has been adjusted for this lag. The inferred temperature of 3He in the IC were similarly adjusted appropriately while cooling at constant pressure if the supercooled transitions in the IC and HEC occurred at different times (ie below 24.5 bar see Figure 3)(a).
0.7 Pressure control.
Pressure was regulated using a temperature controlled “bomb” consisting of a 10 cm3 volume in the form of a 9.5 mm diameter stainless steel tube. An insulated Nichrome wire was wound on this tube and was connected to a 0-25 W power source whose output was set by a digital proportional integral and differential controller. The bomb was semi-isolated from the lab environment by being contained in a large cylindrical tube 5 cm id x 25 cm long open at both ends and mounted vertically. The pressure could be monitored by a digital Heise DXD 0-40 bar pressure gauge, allowing for high resolution with minimum volume in the system. A 0.3 cm3 volume filled with silver sinter was used as an additional heat sink to thermalize the 3He before it entered into the main HEC chamber. In this way we were able to vary the pressure by as much as 5 bar/day without incurring significant heating, allowing large pressure changes to be effected quote rapidly. A-B transitions were observed while the pressure was constant or being varied by 0.7-1.3 bar/day in order to avoid any issues with viscous heating in the channel. Due to the limited heat we could apply to the bomb, pressure changes greater than 5 bar required multiple steps, where we would stop and reset the pressure in the external gas handling system.
This work was supported at Cornell by the NSF under DMR-2002692 (Parpia), PHY-2110250 (Mueller), and in the UK by EPSRC under EP/J022004/1 and by STFC under ST/T00682X/1. In addition, the research leading to these results has received funding from the European Union’s Horizon 2020 Research and Innovation Programme, under Grant Agreement no 824109. Fabrication was carried out at the Cornell Nanoscale Science and Technology Facility (CNF) with assistance and advice from technical staff. The CNF is a member of the National Nanotechnology Coordinated Infrastructure (NNCI), which is supported by the National Science Foundation (Grant NNCI-1542081).
Correspondence and requests for materials should be addressed to J.M.P.
(email: jmp9@cornell.edu).
Experimental work and analysis was principally carried out by Y.T. with early contributions by D.L and A.E. assisted by A.C. with further support from E.N.S. and J.M.P. Presentation of figures was the joint work of Y.T and A.E. assisted by K.Z., M.H. and D.L.. N.Z had established most of the routines for the phase locked loop operation of the quartz fork for earlier experiments. E.M significantly contributed to exploration of the phase diagram and the writing of the manuscript, and N.Z and T.S.A. established and carried out the nano-fabrication of the channel. M.H. and K.Z. in conjunction with E.M. explored the relationship of to and calculated the contours of constant . J.M.P. supervised the work and J.M.P., E.M. and J.S. had leading roles in formulating the research and writing this paper. All authors contributed to revisions to the paper.
The data that supports this study will be made available through Cornell University e-commons data repository at https://doi.org/10.7298/4fhq-e356.
The authors declare that they have no competing interests.
References:
References
- 1 Greywall, D. 3He specific heat and thermometry at millikelvin temperatures. Physical Review B 33, 7520 – 7538 (1986). URL http://dx.doi.org/10.1103/PhysRevB.33.7520.
- 2 Wiman, J. J. & Sauls, J. A. Strong-coupling and the stripe phase of 3-He. Journal of Low Temperature Physics 184, 1054–1070 (2016). URL https://doi.org/10.1007/s10909-016-1632-7.
- 3 Paulson, D. N., Kojima, H. & Wheatley, J. C. Profound effect of a magnetic field on the phase diagram of superfluid . Phys. Rev. Lett. 32, 1098–1101 (1974). URL https://link.aps.org/doi/10.1103/PhysRevLett.32.1098.
- 4 Lotnyk, D. et al. Path-dependent supercooling of the superfluid transition. Phys. Rev. Lett. 126, 215301 (2021). URL https://link.aps.org/doi/10.1103/PhysRevLett.126.215301.
- 5 Kleinberg, R. L., Paulson, D. N., Webb, R. A. & Wheatley, J. C. Supercooling and superheating of the AB transition in superfluid 3He near the polycritical point. J. Low Temp. Phys. 17, 521–528 (1974). URL https://doi.org/10.1007/BF00655071.
- 6 Hakonen, P. J., Krusius, M., Salomaa, M. M. & Simola, J. T. Comment on “ucleation of - from the phase: A cosmic-ray effect?”. Phys. Rev. Lett. 54, 245–245 (1985). URL https://link.aps.org/doi/10.1103/PhysRevLett.54.245.
- 7 Fukuyama, H., Ishimoto, H., Tazaki, T. & Ogawa, S. melting curve below 15 mk. Phys. Rev. B 36, 8921–8924 (1987). URL https://link.aps.org/doi/10.1103/PhysRevB.36.8921.
- 8 Swift, G. W. & Buchanan, D. S. Nucleation and Growth of 3He-B in 3He-A. Jpn. J. Appl. Phys. 26, 1828 (1987). URL https://doi.org/10.7567/jjaps.26s3.1828.
- 9 Schiffer, P., O’Keefe, M. T., Hildreth, M. D., Fukuyama, H. & Osheroff, D. D. Strong supercooling and stimulation of the transition in superfluid . Phys. Rev. Lett. 69, 120–123 (1992). URL https://link.aps.org/doi/10.1103/PhysRevLett.69.120.
- 10 Schiffer, P., O’Keefe, M. T., Hildreth, M. D., Fukuyama, H. & Osheroff, D. D. Strong supercooling and stimulation of the a-b transition in superfluid . Phys. Rev. Lett. 69, 120–123 (1992). URL https://link.aps.org/doi/10.1103/PhysRevLett.69.120.
- 11 Cahn, J. W. & Hilliard, J. E. Free energy of a nonuniform system. i. interfacial free energy. J. Chem. Phys. 28, 258–267 (1958). URL https://doi.org/10.1063/1.1744102.
- 12 Langer, J. S. Statistical theory of the decay of metastable states. Annals Phys. 54, 258–275 (1969).
- 13 Osheroff, D. D. & Cross, M. C. Interfacial surface energy between the superfluid phases of . Phys. Rev. Lett. 38, 905–909 (1977). URL https://link.aps.org/doi/10.1103/PhysRevLett.38.905.
- 14 Kaul, R. & Kleinert, H. Surface energy and textural boundary conditions between a and b phases of 3he. Journal of Low Temperature Physics 38, 539–552 (1980). URL https://doi.org/10.1007/BF00115487.
- 15 Bailin, D. & Love, A. Instantons in Superfluid He-3. J. Phys. A 13, L271 (1980).
- 16 Leggett, A. J. Nucleation of - from the phase: A cosmic-ray effect? Phys. Rev. Lett. 53, 1096–1099 (1984). URL https://link.aps.org/doi/10.1103/PhysRevLett.53.1096.
- 17 Ambegaokar, V., deGennes, P. G. & Rainer, D. Landau-ginsburg equations for an anisotropic superfluid. Phys. Rev. A 9, 2676–2685 (1974). URL https://link.aps.org/doi/10.1103/PhysRevA.9.2676.
- 18 Buchanan, D. S., Swift, G. W. & Wheatley, J. C. Velocity of propagation of the interface in hypercooled . Phys. Rev. Lett. 57, 341–344 (1986). URL https://link.aps.org/doi/10.1103/PhysRevLett.57.341.
- 19 Boyd, S. T. P. & Swift, G. W. New mode of growth of - in hypercooled -: Evidence of a spin supercurrent. Phys. Rev. Lett. 64, 894–897 (1990). URL https://link.aps.org/doi/10.1103/PhysRevLett.64.894.
- 20 BÀuerle, C., Yu. M. Bunkov, Fisher, S. N., Godfrin, H. & Pickett, G. R. Laboratory simulation of cosmic string formation in the early universe using superfluid 3He. Nature 382, 332–334 (1996). URL https://doi.org/10.1038/382332a0.
- 21 Yu. M. Bunkov, and O. D. Timofeevskaya. “osmological” scenario for phase transition in superfluid . Phys. Rev. Lett. 80, 4927–4930 (1998). URL https://link.aps.org/doi/10.1103/PhysRevLett.80.4927.
- 22 Bartkowiak, M. et al. Primary and secondary nucleation of the transition between the and phases of superfluid . Phys. Rev. Lett. 85, 4321–4324 (2000). URL https://link.aps.org/doi/10.1103/PhysRevLett.85.4321.
- 23 Leggett, A. J. Leggett responds. Phys. Rev. Lett. 54, 246–246 (1985). URL https://link.aps.org/doi/10.1103/PhysRevLett.54.246.
- 24 Yip, S. & Leggett, A. J. Dynamics of the phase boundary. Phys. Rev. Lett. 57, 345–348 (1986). URL https://link.aps.org/doi/10.1103/PhysRevLett.57.345.
- 25 Leggett, A. J. & Yip, S. K. Nucleation and growth of in the supercooled -phase. In Pitaevskii, L. P. & Halperin, W. P. (eds.) Helium Three, no. 26 in Modern Problems in Condensed Matter Sciences, chapt. 8, 523–707 (Elsevier, Amsterdam, 1990), third edn.
- 26 Leggett, A. J. High-energy low-temperature physics: Production of phase transitions and topological defects by energetic particles in superfluid . J. Low Temp. Phys. 126, 775–804 (2002). URL https://doi.org/10.1023/A:1013878104932.
- 27 Ki Hong, D. Q-balls in superfluid 3He. J. Low Temp. Phys. 71, 483–494 (1988). URL https://doi.org/10.1007/BF00116874.
- 28 Tye, S.-H. H. & Wohns, D. Resonant tunneling in superfluid 3He. Phys. Rev. B 84, 184518 (2011). URL https://link.aps.org/doi/10.1103/PhysRevB.84.184518.
- 29 Kirzhnits, D. A. Weinberg model in the hot universe. JETP Lett. 15, 529–531 (1972). [Pisma Zh. Eksp. Teor. Fiz.15,745(1972)].
- 30 Kirzhnits, D. A. & Linde, A. D. Macroscopic Consequences of the Weinberg Model. Phys. Lett. 42B, 471–474 (1972).
- 31 Kuzmin, V. A., Rubakov, V. A. & Shaposhnikov, M. E. On the Anomalous Electroweak Baryon Number Nonconservation in the Early Universe. Phys. Lett. B 155, 36 (1985).
- 32 Witten, E. Cosmic Separation of Phases. Phys.Rev. D30, 272–285 (1984).
- 33 Hogan, C. J. Gravitational radiation from cosmological phase transitions. MNRAS 218, 629–636 (1986).
- 34 Mazumdar, A. & White, G. Review of cosmic phase transitions: their significance and experimental signatures. Rept. Prog. Phys. 82, 076901 (2019). 1811.01948.
- 35 Hindmarsh, M. B., Lüben, M., Lumma, J. & Pauly, M. Phase transitions in the early universe. SciPost Phys. Lect. Notes 24, 1 (2021). 2008.09136.
- 36 Amaro-Seoane, P. et al. Laser interferometer space antenna (2017). URL https://arxiv.org/abs/1702.00786.
- 37 Caprini, C. et al. Detecting gravitational waves from cosmological phase transitions with LISA: an update. JCAP 03, 024 (2020). 1910.13125.
- 38 Callan, C. G. & Coleman, S. Fate of the false vacuum. ii. first quantum corrections. Phys. Rev. D 16, 1762–1768 (1977). URL https://link.aps.org/doi/10.1103/PhysRevD.16.1762.
- 39 Linde, A. D. Decay of the False Vacuum at Finite Temperature. Nucl.Phys. B216, 421 (1983).
- 40 Zhelev, N. et al. Fabrication of microfluidic cavities using Si-to-glass anodic bonding. Review of Scientific Instruments 89, 073902 (2018). URL http://dx.doi.org/10.1063/1.5031837.
- 41 Ruutu, V. M. H. et al. Vortex formation in neutron-irradiated superfluid 3he as an analogue of cosmological defect formation. Nature 382, 334–336 (1996). URL https://doi.org/10.1038/382334a0.
- 42 Kibble, T. W. B. Topology of cosmic domains and strings. J. Phys. A: Math. Gen. 9, 1387–1398 (1976). URL https://doi.org/10.1088.
- 43 Zurek, W. H. Cosmological experiments in superfluid helium? Nature 317, 505–508 (1985). URL https://doi.org/10.1038/317505a0.
- 44 Maki, K. Planar textures in superfluid 3he-a. Journal of Low Temperature Physics 32, 1–17 (1978). URL https://doi.org/10.1007/BF00116903.
- 45 Chaikin, P. M. & Lubensky, T. C. Principles of Condensed Matter Physics (Cambridge University Press, 1995).
- 46 Greywall, D. Thermal conductivity of normal liquid 3He. Physical Review B 29, 4933 – 4945 (1984). URL http://dx.doi.org/10.1103/PhysRevB.29.4933.
- 47 Bartkowiak, M. et al. Interfacial energy of the superfluid phase interface in the zero-temperature limit. Phys. Rev. Lett. 93, 045301 (2004). URL https://link.aps.org/doi/10.1103/PhysRevLett.93.045301.
- 48 Kaul, R. & Kleinert, H. Surface energy and textural boundary conditions between a and b phases of 3 he. Journal of Low Temperature Physics 38, 539–552 (1980).
- 49 Schopohl, N. Spatial dependence of the order parameter of superfluid at the a-b phase boundary. Phys. Rev. Lett. 58, 1664–1667 (1987). URL https://link.aps.org/doi/10.1103/PhysRevLett.58.1664.
- 50 Thuneberg, E. V. A-b interface of superfluid in a magnetic field. Phys. Rev. B 44, 9685–9691 (1991). URL https://link.aps.org/doi/10.1103/PhysRevB.44.9685.
- 51 Balibar, S., Mizusaki, T. & Sasaki, Y. Comments on heterogeneous nucleation in helium. J. Low Temp. Phys. 120, 293–314 (2000).
- 52 Zhelev, N. et al. The A-B transition in superfluid helium-3 under confinement in a thin slab geometry. Nature Communications 8, 15963 (2017). URL http://dx.doi.org/10.1038/ncomms15963.
- 53 Hiscock, W. A. Nucleation of vacuum phase transitions by topological defects. Phys. Lett. B 366, 77–81 (1996). gr-qc/9510003.
- 54 Gregory, R., Moss, I. G. & Withers, B. Black holes as bubble nucleation sites. JHEP 03, 081 (2014). 1401.0017.
Supplementary Note 1: Experimental details
The measurement of the AB transition occurs independently (at low pressures in pressure varied transitions and below 24 bar under constant pressure cooling) in the small volume isolated chamber (IC). The IC is connected to a chamber containing a sintered silver heat exchanger (HEC) through a 1.1 m high, 3 mm wide, and 100 m long channel with 200 m tall 3 mm wide 2.45 mm long “lead-in” sections at either end. The 1.1 m height section appears to be filled with the B phase at all temperatures and pressures to the left of the contour highlighted in Fig. 5 of the main paper. To the right of this line the channel isolates the two chambers, and the transitions occur independently. To the left of this line, the B phase nucleated in one chamber will grow into the other. The physical arrangement is illustrated in Fig. 2 of the main paper. The channel (Supplementary Figure 1, shown in light blue) was nanofabricated in 1 mm thick silicon, capped with 1 mm thick sodium doped glass, anodically bonded to the silicon2 and then glued into a coin silver carrier.
The volume of the IC is estimated to be 0.14 0.02 cm3, and the area of all wetted surfaces in the IC was estimated to be 14.5 0.5 cm2. In comparison, the HEC had a volume of 0.72 0.1 cm3 and a surface area of 3.5 0.5 m2 due to the heat exchanger.
Supplementary Note 2: Landau Ginzburg theory
Superfluid 3He has a complex order parameter which can be represented by a 3 3 matrix , where corresponds to a spin angular momentum index, and an orbital angular momentum index: both take on 3 possible values: . The gap matrix is , where the momentum can be taken to lie on the Fermi surface. The -phase corresponds to a rotation of , for which the orbital angular momentum points in the direction, and the gap matrix has a node in that direction. If one ignores dipolar interactions, is a completely arbitrary vector of fixed magnitude. The phase corresponds to a rotation of . This is an isotropic fully gapped state with the spin and orbital angular momenta entangled with one-another.
In equilibrium the order parameter minimizes a free energy . We neglect dipolar terms, which are on a smaller energy scale. Near , the resulting bulk free energy density is written3, 4, 5, 6
The coefficients are
| (1) | |||||
| (2) | |||||
| (3) |
We use transition temperatures tabulated by Greywall4, 7, converted to the PLTS scale using the procedure in Ref. 8. The density of states at the Fermi Surface is , and is the normal-superfluid transition temperature.
At , the strong coupling -coefficients are , and we use the ’s which are tabulated by Regan, Wiman, and Sauls (RWS)9, who calculated the values from first principles. The weak coupling ’s are . We rescale the RWS pressures by a factor of 1.01 so that the polycritical point occurs at the experimental bar.
We estimate the temperature dependence of the strong-coupling coefficients by taking . We choose in order to correctly match the experimental A-B transition temperature7, which are well approximated by . As explained below, the A-B equilibrium line is at . We therefore take
| (4) |
This results in at , and bar. Previous works4, 9 which used , find a somewhat shifted A-B line. Some of the quantities we calculate are quite sensitive to the location of the transition, necessitating the extra empirical parameter.
We have also explored other approaches to correct for this shift in the A-B line. Supplementary Note 6 presents one of those, where we simply rescale the parameters, . We have also repeated the analysis with alternative strong-coupling parameters in the literature 6, 4. All models give similar predictions, once the location of the equilibrium AB transition line is corrected.
The gradient terms in the free energy are typically written as
| (5) |
with , and
| (6) |
It is convenient to scale the energy and order parameter in order to make the equations dimensionless. Thus we take , , and choose such that . We also rescale lengths by the temperature dependent correlation length , to arrive at a dimensionless equation. Here the Ginzburg-Landau coherence length is .
For the bulk A and B phases we take and . These ansatzes yield free energy densities of the form , where denotes the phase, and the quartic coefficients for each phase are and . Here we use the convention that appending indices yields the sum, so . Minimizing with respect to , gives . The equilibrium AB transition occurs when these energies are equal to one-another, ie .
We use a finite difference approach to find the structure of the AB domain wall, taking to be a function of one spatial coordinate, . We minimize the free energy with the constraint that takes on its bulk A and bulk B form at and . For the minimization we use a Broyden, Fletcher, Goldfarb, Shanno quasi-Newton method, discretizing space into 200 segments, each of which is 5% of the correlation length. Supplementary Figure 2 illustrates how the components of vary in space, as well as the local energy density. We define the position of the domain wall by the location of the peak in the local energy density, . The surface tension is then extracted as . Here are the bulk free energies.

We similarly find the surface energy associated with bulk A or B phase contacting the chamber’s wall: . We consider two extreme boundary conditions: minimal and maximal pairbreaking. The former models specular scattering of quasiparticles from the wall 10, and the latter corresponds to quasiparticle retroreflection 11.
For maximal pairbreaking, the order parameter simply vanishes at the wall. For minimal pairbreaking the component of the order parameter normal to the surface vanishes, , where are the components of the normal vector to the wall. The other components have zero slope, . Here is the component of which is perpendicular to the surface.
For minimal pairbreaking one can align the A phase order parameter so that . While there is some temperature and pressure variation, . For maximal pairbreaking, and . The fact that for maximal pairbreaking can be traced to the contribution of the various gradient terms in Eq. (5).
Supplementary Note 3: Stability of a domain wall across an orifice
In our experiment we observe path dependent hysteresis in the A to B phase transition. The simplest model which could account for this observation involves positing that the cell contains a large number of small chambers connected to the main fluid via small orifices. Leggett and Yip12 described such chambers as “lobster pots,” and used them to explain related hysteretic phenomena. The orifices have a distribution of sizes, and each of the chambers contain B-fluid. The bulk fluid is A. The stability of an AB domain wall across such an orifice was theoretically studied by Viljas and Thuneberg13. As we review below, each AB boundary is only stable if the orifice size is smaller than some critical value , where depends on pressure and temperature. If , and we are in the part of the phase diagram where the A-phase is stable, the bulk A-phase will rush into the chamber, destroying the B-seed. Conversely, in the B-region of the diagram, the B-phase will rush out, converting the bulk to B. The same argument can be used to analyze the ability of the 1.1 m letterbox channel to prevent the B-phase from propagating from the HEC to IC.
In this model, the system’s memory comes from the distribution of chambers which contain B, and the catastrophe line is set by the largest orifice of a B-chamber. We emphasize that this chamber model is merely intended to be an easily analyzed toy. It is likely that the true B-seeds involve frustrated A textures, whose modeling is complex. These may be bulk textures, or they may involve boundaries. Similar energetic considerations will be at play – regardless of the microscopics. The relevant scales are the free-energy difference between the two phases, the domain wall surface tension, and the size of the texture.
The chamber model seems particularly relevant for describing the sinter in the HEC. Even there, however, the geometry is likely more complicated. As argued by Leggett and Yip12, the openings of the chambers can be tapered, or have some other asymmetry, which will lead to quantitative discrepancies.
We treat the A-B domain wall as an elastic membrane. Consequently, the equilibrium domain wall will be bowed, with the phase with higher free energy on the inside. Balancing forces implies that in equilibrium its mean curvature is , where is the difference in free energy density between the fluids on each side of the wall, and is the surface tension14. The mean curvature is the arithmetic mean of the two principle curvatures: spherical and cylindrical surfaces of radius respectively have and .
Supplementary Figure 3 shows a number of simple geometries for a domain wall spanning a constriction. Panels (a) and (b) show the case where the constriction can be modeled as a hole in a flat sheet. In (a) the A phase has lower free energy than B, and the domain wall bows into the B region. Equating forces at the edge of the aperture requires , where and are the surface energy associated with each phase, and is the angle that the surface makes with the walls – which also corresponds to half the angle subtended by the opening, as measured from the center of the arc which defines the domain wall. Consequently, the domain wall is stable if . Panel (b) shows the case where B has a lower free energy than A. Since , surface energies are never relevant and the domain wall is stable if .
Panel (c) of Supplementary Figure 3 shows the case where the constriction has parallel sides. This models the letterbox channel connecting the HEC and IC. Because , such a configuration is never stable with B inside the chamber and A outside. The illustrated configuration is stable as long as . Here the angle that the domain wall makes with the surface, , is complementary to the angle subtended by the domain wall, . Thus the domain wall is stable if . Specializing to the case of a slit, where , this expression simplifies to , which does not depend on the AB surface tension. Equality coincides with the equilibrium A to B phase transition in a thin channel: .
The pressure and temperature dependence of the contact angle is illustrated in Supplementary Figure 4 for both minimal and maximal pairbreaking boundary conditions. The A-phase surface energy vanishes for minimal pairbreaking, resulting in a significantly smaller contact angle. Due to the behavior of the strong-coupling parameters, the contact angle is slightly larger at high temperatures and high pressures.
(a)
 (b)
(b)
 (c)
(c)


Supplementary Note 4: Comparing constant pressure and pressure varied A-B transitions
In the main document we established that the degree of metastability of the A-phase depended on the trajectory taken through the phase diagram. Here we compare two trajectories. Supplementary Figure 5(a) shows the quality factor of the HEC fork during cooling (blue) and heating (red) at 23 bar. Supplementary Figure 5(b) shows the same cooling data, and overlays the measured while first cooled at 29.3 bar to 2.15 mK, and then depressurized to 23 bar (in the A phase) followed by cooling at constant pressure. Data is only shown for the part of the trajectory at 23 bar. In all cases the A-B transition is visible as a discontinuity in . The degree of metastablity is enhanced by transiting through the 29.3 bar A-phase; however, the in both phases is consistent, showing that the additional supercooling cannot be due to a pressure lag, heating effects, or a significant change in the properties of the bulk fluid.


Supplementary Note 5: Comparison of boundary conditions
To highlight the role of boundary conditions, we reproduce the analysis used for Figs. 5 and 6 of the main paper, but using maximal pairbreaking boundary conditions. As seen in Supplementary Figure 6, the maximal pairbreaking contours of are shifted to slightly higher pressures compared to the minimal pairbreaking shown in Fig. 5 of the main paper. This results in a larger value of , plotted in Supplementary Figure 7. Given that our model predicts , we conclude that minimal pairbreaking better describes the surfaces of the silver sinter. This is consistent with previous experiments 21.


Supplementary Note 6: Alternate renormalization of the Ginzburg-Landau parameters
In Supplementary Note 2, we explain how we introduce a phenomenological scaling function which allows the Landau-Ginzburg theory to correctly model the pressure dependence of the AB phase transition line. Here we present an alternative approach, where we simply rescale the Regan, Wiman, and Sauls coefficients9, taking .
We again use the approximation that . Using the fact that the A-B transition occurs when , We conclude
| (7) |
which yields at bar.
Figure 8 shows the results of using this alternative approach to modeling the experiment. While the renormalization scheme causes small changes in the results, our general conclusions are unchanged. This concordance gives us confidence in our results.
The most notable difference between the renormalization schemes is in the cycled paths, which are cooled at 23 bar, transit to higher pressure, and then continue cooling at 23 bar (shown as green circles and black ”+” marks). In Fig. 8 the outliers are somewhat less extreme than in the main text. The model dependence of for these points indicates that one should be cautious about ascribing too much significance to them.

Supplement References:
References
- 1
- 2 Zhelev, N. et al. Fabrication of microfluidic cavities using Si-to-glass anodic bonding. Rev. Sci. Instrum. 89, 073902 (2018). URL http://dx.doi.org/10.1063/1.5031837.
- 3 Vollhardt, D. & Woelfle, P. The Superfluid Phases Of Helium 3 (Dover, Mineola New York, 2013). URL https://doi.org/10.1201/b12808.
- 4 Wiman, J. J. & Sauls, J. A. Superfluid phases of in nanoscale channels. Phys. Rev. B 92, 144515 (2015). URL https://link.aps.org/doi/10.1103/PhysRevB.92.144515.
- 5 Wiman, J. J. & Sauls, J. A. Strong-coupling and the stripe phase of 3-He. J. Low Temp. Phys. 184, 1054–1070 (2016). URL https://doi.org/10.1007/s10909-016-1632-7.
- 6 Choi, H., Davis, J. P., Pollanen, J., Haard, T. M. & Halperin, W. P. Strong coupling corrections to the ginzburg-landau theory of superfluid . Phys. Rev. B 75, 174503 (2007). URL https://link.aps.org/doi/10.1103/PhysRevB.75.174503.
- 7 Greywall, D. 3He specific heat and thermometry at millikelvin temperatures. Phys. Rev. B 33, 7520–7538 (1986). URL http://dx.doi.org/10.1103/PhysRevB.33.7520.
- 8 Tian, Y., Smith, E. N. & Parpia, J. Conversion between melting curve scales below 100 m. Journal of Low Temperature Physics 184, 1573–7357 (2022). URL https://doi.org/10.1007/s10909-022-02721-z.
- 9 Regan, R. C., Wiman, J. J. & Sauls, J. A. Vortex phase diagram of rotating superfluid . Phys. Rev. B 101, 024517 (2020). URL https://link.aps.org/doi/10.1103/PhysRevB.101.024517.
- 10 Ambegaokar, V., deGennes, P. G. & Rainer, D. Landau-ginsburg equations for an anisotropic superfluid. Phys. Rev. A 9, 2676–2685 (1974). URL https://link.aps.org/doi/10.1103/PhysRevA.9.2676.
- 11 Sauls, J. A. Surface states, edge currents, and the angular momentum of chiral -wave superfluids. Phys. Rev. B 84, 214509 (2011). URL https://link.aps.org/doi/10.1103/PhysRevB.84.214509.
- 12 Leggett, A. J. & Yip, S. K. Nucleation and growth of in the supercooled -phase. In Pitaevskii, L. P. & Halperin, W. P. (eds.) Helium Three, no. 26 in Modern Problems in Condensed Matter Sciences, chapt. 8, 523–707 (Elsevier, Amsterdam, 1990), third edn.
- 13 Viljas, J. & Thuneberg, E. Stability of a–b phase boundary in a constriction. Physica B: Condensed Matter 329-333, 86–87 (2003). URL https://doi.org/10.1016/s0921-4526(02)01889-6.
- 14 Isenberg, C. The science of soap films and soap bubbles (Dover Publications, Mineola, NY, 1992).
- 15 Bartkowiak, M. et al. The unique superfluid 3he a-b interface: Surface tension and contact angle. Journal of Low Temperature Physics 126, 533–538 (2002). URL https://doi.org/10.1023/a:1013758916085.
- 16 Bartkowiak, M. et al. Superfluid a–b surface tension. Physica B: Condensed Matter 329-333, 122–125 (2003). URL https://doi.org/10.1016/s0921-4526(02)01919-1.
- 17 Bartkowiak, M. et al. Interfacial energy of the superfluid phase interface in the zero-temperature limit. Phys. Rev. Lett. 93, 045301 (2004). URL https://link.aps.org/doi/10.1103/PhysRevLett.93.045301.
- 18 Kaul, R. & Kleinert, H. Surface energy and textural boundary conditions between a and b phases of 3 he. Journal of Low Temperature Physics 38, 539–552 (1980).
- 19 Schopohl, N. Spatial dependence of the order parameter of superfluid at the a-b phase boundary. Phys. Rev. Lett. 58, 1664–1667 (1987). URL https://link.aps.org/doi/10.1103/PhysRevLett.58.1664.
- 20 Thuneberg, E. V. A-b interface of superfluid in a magnetic field. Phys. Rev. B 44, 9685–9691 (1991). URL https://link.aps.org/doi/10.1103/PhysRevB.44.9685.
- 21 Heikkinen, P. J. et al. Fragility of surface states in topological superfluid 3He. Nat. Commun. 12, 1574 (2021). URL https://doi.org/10.1038/s41467-021-21831-y.