The supernova remnant SN 1006 as a Galactic particle accelerator
Abstract
The origin of cosmic rays is a pivotal open issue of high-energy astrophysics. Supernova remnants are strong candidates to be the Galactic factory of cosmic rays, their blast waves being powerful particle accelerators. However, supernova remnants can power the observed flux of cosmic rays only if they transfer a significant fraction of their kinetic energy to the accelerated particles, but conclusive evidence for such efficient acceleration is still lacking. In this scenario, the shock energy channeled to cosmic rays should induce a higher post-shock density than that predicted by standard shock conditions. Here we show this effect, and probe its dependence on the orientation of the ambient magnetic field, by analyzing deep X-ray observations of the Galactic remnant of SN 1006. By comparing our results with state-of-the-art models, we conclude that SN 1006 is an efficient source of cosmic rays and obtain an observational support for the quasi-parallel acceleration mechanism.
Università degli Studi di Palermo, Dipartimento di Fisica e Chimica E. Segrè, Piazza del Parlamento 1, 90134 Palermo, Italy
INAF-Osservatorio Astronomico di Palermo, Piazza del Parlamento 1, 90134 Palermo, Italy,
Department of Astronomy and Astrophysics & Enrico Fermi Institute, The University of Chicago, 5640 S Ellis Ave, Chicago, IL 60637, USA
Université Paris-Saclay, Université Paris Cité, CEA, CNRS, AIM, 91191, Gif-sur-Yvette, France
Anton Pannekoek Institute, GRAPPA, University of Amsterdam, PO Box 94249, 1090 GE Amsterdam, The Netherlands
GRAPPA, University of Amsterdam, Science Park 904, 1098 XH Amsterdam, The Netherlands
Introduction
Cosmic rays (CRs) are extremely energetic particles, mainly composed by protons. It is widely accepted that the bulk of cosmic rays (below the knee at approximately eV) stems within our Galaxy, playing a significant role in its energy budget[1]. Several convincing indications point towards supernova remnants (SNRs) as their most likely source[2].
Shock waves in SNRs can accelerate particles through the first-order Fermi mechanism (or diffusive shock acceleration, DSA). The capability of SNRs of accelerating electrons is testified by the ubiquitous synchrotron radio emission detected at their shock fronts[3], associated with approximately GeV electrons. X-ray synchrotron emission from ultrarelativistic (about TeV) electrons has been first detected in the remnant of the supernova observed in 1006 AD[4] (hereafter SN 1006) and, afterward, in other young SNRs[5]. Accelerated protons in SNRs might provide ray emission through interaction with protons in their environment leading to production and subsequent decay. TeV ray emission from a handful of shell-like SNRs has been observed[6], while GeV emission has been detected in about remnants[7]. In SN 1006, ray emission has been detected in both the TeV and GeV bands, with the HESS observatory[8] and Fermi telescope[9], respectively, but its nature is uncertain, since ray emission can also be produced by inverse Compton from ultrarelativistic electrons (leptonic scenario). Indications for a hadronic origin of the rays have been obtained in a few cases[10, 11, 12, 13], confirming that SNR shocks can indeed accelerate hadrons.
The identification of SNRs as the main Galactic factory of CRs is still based on plausibility arguments and many important open issues need to be addressed[14]. To prove that SNRs are CR factories, it is necessary to show that they indeed supply the power needed to sustain the Galactic CRs (of the order of erg s-1). Considering the rate of supernovae in our Galaxy (about per century), SNRs should transfer about of their characteristic kinetic energy (approximately erg) into CRs[15]. The loss of such a large fraction of the ram energy is expected to alter the shock dynamics with respect to the adiabatic case. Nonlinear DSA predicts the formation of a shock precursor (travelling ”ahead” of the main shock) that modifies the shock structure. This shock modification should result in an increase of the total shock compression ratio, , and a decrease of the post-shock temperature with respect to the Rankine-Hugoniot (adiabatic) values[16, 17, 18, 19]. Recent self-consistent hybrid (kinetic ions and fluid electrons) simulations show that efficient acceleration of CRs leads also to the formation of a shock postcursor where non-linear magnetic fluctuations and CRs drift away from the shock front, moving downstream[20, 21]. This postcursor is quantitatively more important for shock modification than the precursor; it acts as an additional energy sink, providing an increase of , even with a moderate acceleration efficiency: when the CR pressure is about of the bulk ram pressure, the total compression ratio ranges approximately between .
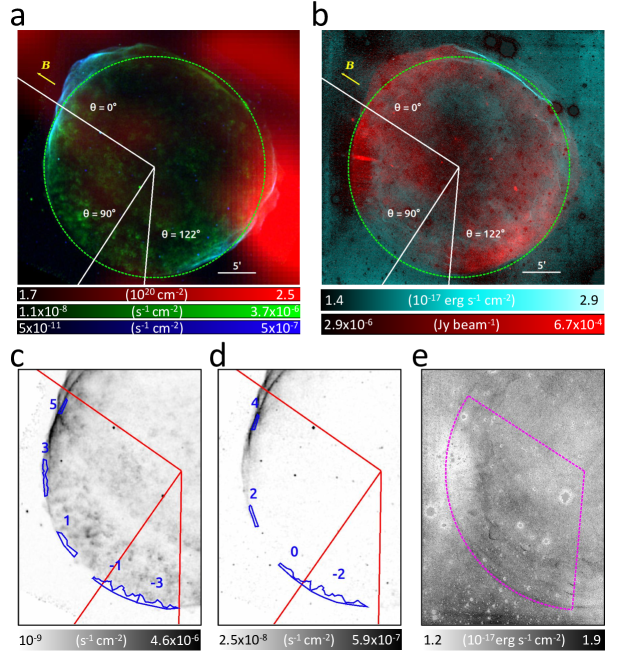
SN 1006 is an ideal target to reveal shock modification. Thanks to its height above the Galactic plane (approximately pc), the remnant evolves in a fairly uniform environment (in terms of density and magnetic field). Moreover, SN 1006 shows regions with prominent particle acceleration, where shock modification might be present, together with regions where there are no indications of particle acceleration and where we do not expect shock modification. In particular, the bilateral radio, X-ray and ray morphology of SN 1006 clearly reveals nonthermal emission in the northeastern and southwestern limbs. X-ray synchrotron emission in nonthermal limbs, seen notably above 2.5 keV, identifies sites of electron acceleration to TeV energies, whereas the lack of nonthermal emission in the southeastern and northwestern limbs marks regions without considerable particle acceleration, where the X-ray emission is mainly thermal (see Fig. 1, panel a). It has been shown that the efficiency of diffusive shock acceleration increases by decreasing the angle between the ambient magnetic field and the shock velocity[22]. There is strong evidence that the bilateral morphology of SN 1006 can be explained in the framework of this quasi-parallel scenario, with the ambient magnetic field, B0, oriented approximately in the southwest-northeast direction[23, 24, 25]. If these nonthermal limbs are also sites of efficient hadron acceleration, the signature of shock modification is expected to be stored in the X-ray emission of the shocked interstellar medium[17] (ISM). The amount of shock modification, namely an increase in the post-shock density, should raise near the nonthermal limbs (i.e., in quasi-parallel conditions), being smaller in thermal regions, where the shock velocity and B0 are almost perpendicular. Shock modification is expected to reshape the remnant structure, by reducing the distance between the forward shock and the outer border of the expanding ejecta (i. e., the “contact discontinuity”). However, this effect (observed in SN 1006[26, 27]) can also be explained as a natural result of ejecta clumpiness[28], without the need of invoking shock modification.
A first attempt to observe azimuthal variations in shock compressibility was performed by analyzing the XMM-Newton X-ray observations of the southeastern limb of SN 1006[29]. In this region, the X-ray emission is mainly thermal but contaminated by the contribution of shocked ejecta. Nevertheless, a spatially resolved spectral analysis showed a faint X-ray emitting component associated with the shocked ISM. The density of this component can be inferred from its emission measure (, defined as the integral of the square of the thermal particle density over the volume of the X-ray emitting plasma). The post-shock density shows hints of azimuthal modulation, with a minimum around (i.e., quasi-perpendicular conditions) and a rapid increase toward the nonthermal limbs, suggestive of a higher shock compressibility. This analysis was restricted to a small portion of the shell (approximately ), without including regions with quasi-parallel conditions, and limited by the spatial resolution of the XMM-Newton telescope (comparable to the distance between the shock and ejecta). It was thus not possible to isolate regions with ISM emission only, and all the spectra were contaminated by the ejecta contribution, requiring additional assumptions (namely, pressure equilibrium between ejecta and ISM) to estimate the volume occupied by the ISM and then its density.
Here, we identify shock modification in SN 1006 by studying the azimuthal profile of the post-shock density, and overcome the aforementioned limitations by combining deep X-ray observations performed with XMM-Newton (https://www.cosmos.esa.int/web/xmm-newton) and Chandra telescopes (https://chandra.harvard.edu/), to benefit from spectroscopy sensitivity and high-spatial resolution of the post-shock region.
Results
Spatially resolved spectral analysis
Panel a of Fig. 1 shows the soft ( keV, mainly thermal emission) and hard ( keV, nonthermal emission) X-ray maps of SN 1006, together with HI distribution in the ambient medium[30]. Panel b shows the Balmer Hα image[31] and the radio continuum map. The ambient magnetic-field orientation is superimposed on the maps, with angle assumed at the center of the northeastern limb. The position of the forward shock is indicated by its Balmer optical emission (panel b and e of Fig.1) in thermal limbs, and by the hard X-ray synchrotron filaments in nonthermal limbs (panel a of Fig.1).
The spatial distribution of the ambient atomic hydrogen around SN 1006 is quite homogeneous[32, 30] and the only structures detected are localized in the western and northwestern rims (Fig. 1, panel a). None are observed in the regions considered for our analysis, where the ambient medium appears uniform. While we cannot exclude small fluctuations in the ambient density, they are undetected with current radio data. We consider two additional pieces of evidence supporting a uniform upstream medium in this sector of the remnant. The first one is the fairly circular shape of the shock front from the southern to northeastern rim: the shock velocity (and then its radius) depends on the ambient density, and the almost constant shock radius shown in Fig. 1 indicates a uniform environment. The second piece of evidence is the faint and fairly uniform surface brightness of the Hα emission (whose intensity depends on the local density) in this sector of the shell (see panel e in Fig. 1). These two conditions support the scenario of a tenuous and homogeneous ambient medium. Therefore, we interpret azimuthal modulations in the post-shock density as ascribed only to variations in .
We define nine narrow spatial regions immediately behind the forward shock for X-ray spectral studies, excluding the regions contaminated by the ejecta (see lower panels of Fig. 1). The superior spatial resolution of Chandra allows us to identify the outermost ejecta, whose projected position in the plane of the sky is marked by ripples of thermal emission. Abrupt variations in the X-ray surface brightness of thermal emission show the position of the contact discontinuity. In particular, the X-ray surface brightness of the outermost ejecta is more than 10 times larger than that of the background (, i.e., the surface brightness outside the shell), while the X-ray surface brightness within regions in the southeastern limb (i.e., regions ) is only . The inner border of these regions corresponds to a surface brightness contour level at , thus marking the sharp separation between ejecta and ISM emission. In regions , the contribution of synchrotron emission to the X-ray surface brightness dominates. Therefore, in this part of the remnant we selected very narrow regions, immediately behind the shock front, by carefully excluding visible ejecta clumps. We investigate a large portion of the shell (), including regions with quasi-parallel conditions where shock modification is expected to be at its maximum.
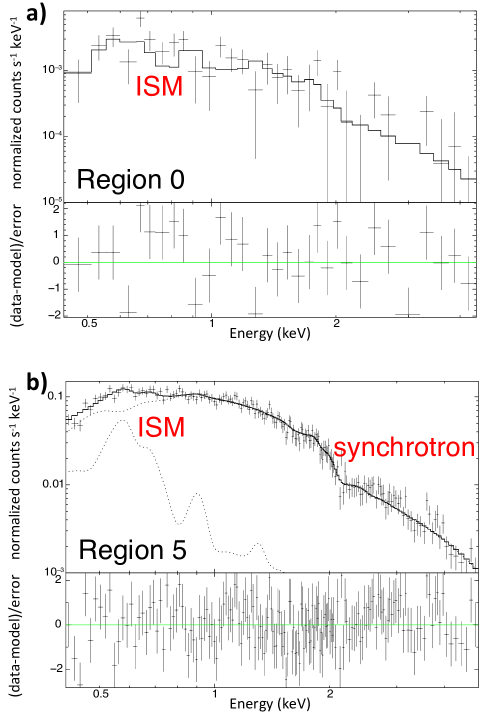
Panel a of Fig. 2 shows the X-ray spectrum extracted from region , revealing the shocked ambient medium at approximately , where we do not observe prominent particle acceleration and the shock is adiabatic (). The spectrum can be modelled by an isothermal optically thin plasma in non-equilibrium of ionization (parametrized by the ionization parameter , defined as the time integral of the density reckoned from the impact with the shock). The post-shock density of the plasma is cm-3, in good agreement with previous estimates in this part of the shell[29], (as well as the electron temperature, approximately keV, and s cm-3), but our values are obtained without any ad-hoc assumptions. The interstellar absorption is expected to be uniform in the portion of the shell analyzed, and we fix the absorbing column density to , in agreement with radio observations[32]. We detect the shocked ISM emission in all regions, with a statistical significance . Panel b of Fig. 2 shows that the ISM contribution is clearly visible at low energies even in the spectrum of region 5 (at approximately ) where the X-ray emission is dominated by synchrotron radiation. We found that the electron temperature in the shocked ISM is consistent with being constant over all the explored regions (though with large uncertainties), and letting it free to vary does not improve the quality of the fits. So we fixed it to the best-fit value obtained in region 0 ( keV), where we obtain the most precise estimate (see, methods subsection X-ray data analysis). In case of shock modification, we expect the ion temperature to be lower in regions with efficient hadron acceleration. This should also reduce the electron temperature, but this effect is predicted to be quite small[33]. Moreover, this reduction may be compensated by the fact that strong magnetic turbulence in quasi-parallel regions should favor electron heating (by heat exchange with ions). We expect much larger variations of the shock compression ratio, so we trace the shock modification by focusing on the post-shock density. We estimate the density from the best fit value of the in each spectral region (by numerically computing the volume of the emitting plasma, see, methods subsection X-ray data analysis).
Azimuthal profile of the post-shock density
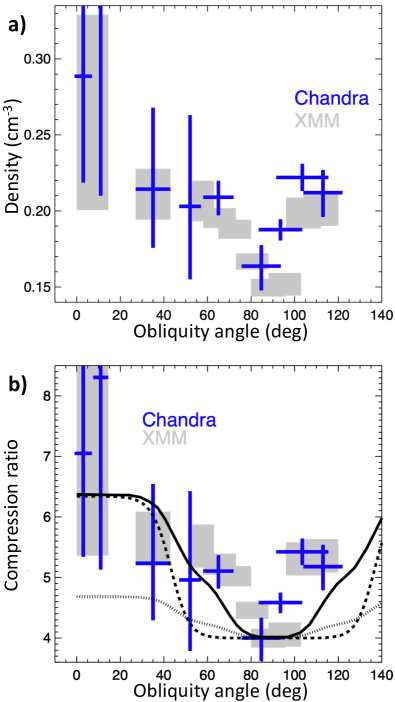
Figure 3 (panel a) shows the azimuthal modulation of the post-shock density of the ISM.
We verified that the estimates of the density are not affected by contamination from the ejecta. Ejecta can be easily identified because of their higher surface brightness with respect to the ISM. If we extract the spectra by slightly changing the shape of the extraction regions, so as that their inner boundaries include ejecta knots, the plasma density increases artificially (and the quality of the fit decreases). For example, by moving inwards the inner boundary of region 0 (region 3), and enhancing its projected area by less than ( for region 3), we find that the plasma density changes from cm-3 up to cm-3 in region 0 (and from cm-3 to cm-3 in region 3). Conversely, by reducing the size of the extraction regions, the plasma density stays constant, thus indicating that the medium within each region is fairly uniform (e.g., by reducing the projected area of region 0 and region 3 by about , we find cm-3, in region 0, and cm-3 in region 3). We conclude that Fig. 3 traces the azimuthal density modulation of the shocked ISM.
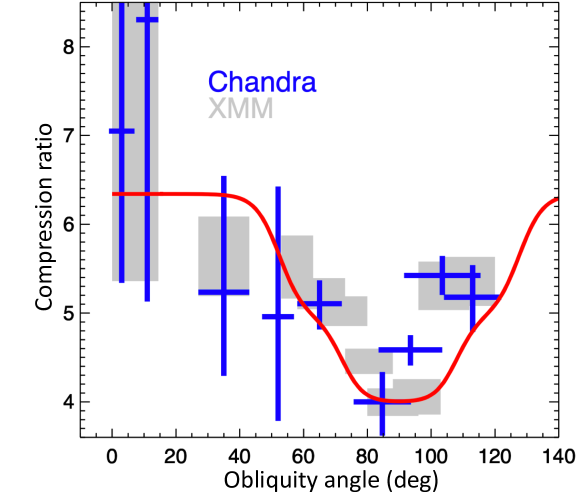
As explained above, it is thus hard to explain this density modulation as a result of inhomogeneities in the upstream medium. These inhomogeneities, if present, would affect the shock velocity (, which is proportional to the inverse of the square root of the ambient density), inducing a of approximately km s-1 between region 0 and region 5 (for a shock velocity in region 5 of[31] km s-1). This would produce a difference in the shock radius of about cm (corresponding to at 2.2 kpc[34]) between region 0 and region 5 in only 250 yr. This is at odds with observations, which show a very circular shape of the shock front (see Fig. 1, panel e), whose radius vary less than between region 0 and region 5 (see, methods subsection X-ray data analysis for details). We then consider the density modulation as a tracer of azimuthal variations in the shock compression ratio. Assuming in region 0 (i. e., at , where the acceleration is inefficient), Fig. 3 (panel b) shows a higher compressibility in quasi-parallel conditions, where the shock compression ratio raises up to approximately .
To further constrain the observed increase of the post-shock density towards quasi-parallel conditions, we added the data from the XMM-Newton Large Program of observations of SN 1006 (approximately ks). We updated the previous results obtained for 8 regions in the southeastern limb[29] (from around to approximately ) to correct for the effects of the telescope point spread function (see, methods subsection X-ray data analysis). In addition, we extended the study to quasi-parallel regions by analyzing the XMM-Newton spectra including region 3 and region 4-5 (together). We adopted the same model as that adopted for Chandra data. The agreement between results obtained with the two telescopes is remarkable (see Fig. 3) and the combination of the reliability provided by the high Chandra spatial resolution (which excludes contamination from ejecta) and the sensitivity of XMM-Newton (which provides more precise estimates) confirms the azimuthal modulation of the post-shock density.
In the XMM-Newton spectra, the higher post-shock density in region 4-5 with respect to region 0 is confirmed even by letting the electron temperature and interstellar absorption free to vary in the fitting process. In particular, we found that the quality of the fit of the spectrum of region 4-5 worsens significantly by imposing the plasma density to be the same as that observed in region 0, even by letting both and free to vary ( with 181 d.o.f., with keV and cm-2, to be compared with with 182 d.o.f., see Table 1). Moreover, we notice that by imposing a low post-shock density in region 4-5, the best-fit value of the ionization parameter ( s cm-3) increases by a factor of about with respect to that reported in Table 1, thus still indicating the need for a higher post-shock density in quasi-parallel regions.
Discussions
From observations, the azimuthal profile of the post-shock density shown in Fig. 3 can be explained by a higher shock compression ratio in quasi-parallel regions than in quasi-perpendicular regions.
From theory, self-consistent kinetic simulations[22] unveiled that the injection of thermal protons into DSA is maximum at quasi-parallel regions, where efficiency can reach 10-15%, and suppressed at quasi-perpendicular shocks. Prominent shock modification () is therefore expected only in quasi-parallel regions[20, 21], while quasi-perpendicular shocks should show approximately . While injection of thermal ions is typically suppressed for[22] , re-acceleration of pre-existing Galactic CRs (seeds) can provide a modest acceleration efficiency (approximately ), thus playing a role in shock modification up to[35] , in agreement with the observed trend in Figure 3. CR acceleration also leads to the amplification of the pre-shock magnetic field in the quasi-parallel regions, where synchrotron emission is more prominent and magnetic fields are more turbulent, as attested by radio polarization maps[25]. Also, quasi-perpendicular regions exhibit synchrotron emission in the radio but not in the X-rays, which points to the presence of GeV but not TeV electrons, again consistent with acceleration in the unperturbed Galactic magnetic field[2].
The solid curve in Fig. 3 (panel b) shows the expected trend of vs. , obtained by assuming a quasi-parallel acceleration efficiency , with a cut-off at approximately . Such values are chosen based on self-consistent hybrid simulations[36], which attest to thermal ions being spontaneously injected into DSA for quasi-parallel shocks[37]. Always guided by simulations, which show that more oblique shocks are able to efficiently accelerate pre-existing CR seeds[38], we have also a component of reaccelerated CRs with efficiency and cutoff at . Since both accelerated and re-accelerated particles can effectively amplify the initial magnetic field, we pose the normalized magnetic pressure . We also note that magnetic-field amplification and high are consistent with the non-detection of X-ray emission from the precursor of SN 1006[39].
The profile shown by the solid curve in Fig. 3 (panel b) is in line with the observed data-points. As a comparison, we also include the expected profiles obtained without CR re-acceleration (with , dashed curve), and without postcursor effects[20] (, , , dotted curve).
The theoretical curves in Fig. 3, while capturing the zero-th order azimuthal dependence of on , do not account for the possible refined geometry of the magnetic field in the SN 1006 field. A comparison between radio maps and MHD simulations (not including shock modification)[24] suggests that the local magnetic field may be tilted by with respect to the line of sight, with a gradient of the field strength of the order of over 10 pc, roughly laying in the plane of the sky (parallel to the limbs) and pointing toward the Galactic plane. In general, a finite tilt would stack regions with different shock inclinations along each line of sight, thereby reducing the contrast between the regions with maximum and minimum ; nevertheless, since the expected is maximum for (see Fig. 3), any tilt would not induce any major modification to the curves in Fig. 3. The presence of a gradient, instead, has been shown[24] to reduce the angular distance between the two polar caps, producing a narrow minimum in the versus profile, remarkably similar to that observed (see, methods subsection Modeling the shock modification). Since the simple geometry assumed in this paper captures well the bilateral morphology of SN 1006 and its azimuthal variations, we defer the study of the corrections induced by more elaborate field geometries to a forthcoming publication.
Finally, we consider the effects that the shock modification should induce on the spectrum of the accelerated particles. In the context of the classical theory of non-linear DSA [40, 41], a shock compression ratio larger than 4 leads to CR spectra harder than , while radio observations suggest for SN 1006 a radio spectral index of 0.6[42], corresponding to a CR spectrum . Nevertheless, when the postcursor physics is taken into account in the calculation of the CR spectral index[21], for the parameters chosen in the paper for the q-parallel regions (, ), one obtains and a CR spectrum , in remarkable agreement with the observed radio index. In conclusion, our findings show an azimuthal modulation of the post-shock density in SN 1006, which is consistent with a substantial deviation of the shock compression ratio from the value of (expected for strong shocks) in regions of prominent particle acceleration, where electrons are accelerated to TeV energies. The inferred values of compression ratios and CR slopes are compatible with those expected in CR-modified shocks when the effects of the postcursor are also accounted for[20, 21]. Moreover, the azimuthal variation of (Fig. 3) attests to the prominence of parallel acceleration and to the important role played by the re-acceleration of pre-existing Galactic CRs for oblique shocks.
METHODS
X-ray data analysis
We analyzed Chandra observations 13737, 13738, 13739, 13740, 13741, 13742, 13743, 14423, 14424, 14435 (PI F. Winkler) performed between April and June 2012, with a total exposure time of 669.85 ks, and observation 9107 (PI R. Petre) performed on June 2008 for a total exposure time of 68.87 ks (see Table 2). All observations were reprocessed with CIAO 4.12[43] and CALDB 4.9.0 (https://heasarc.gsfc.nasa.gov/docs/heasarc/caldb/caldb_intro.html).
Mosaic images of SN 1006 were obtained by combining the different pointings with the CIAO task merge_obs (https://cxc.cfa.harvard.edu/ciao/ahelp/merge_obs.html). In particular, we produced vignetting-corrected mosaic images of the flux (in counts s-1 cm-2) in the keV band (shown in green in Fig. 1) and in the keV band (light blue in Fig. 1).
The contact discontinuity in SN 1006 is very close to the forward shock[26, 27]. To measure the ISM post-shock density, we then extract X-ray spectra by selecting narrow regions between the contact discontinuity and the shock front. Regions selected for spatially resolved spectral analysis are shown in Fig. 1. By assuming at the center of the northeastern radio limb, the azimuthal range explored is . In this azimuthal range, the spherical shape of the shock front, combined with the extremely faint and uniform HI emission, clearly point toward a uniform ambient environment. We do not consider regions with negative values of because of the lack of spherical shape in the remnant therein, combined with the superposition of several shock fronts (which make it difficult to correctly estimate the volume of the X-ray emitting plasma). We do not consider regions with because it is not possible to select regions not contaminated by the ejecta emission, given that several ejecta knots reaching the shock front (and even protruding beyond it) can be observed in the soft X-ray image (Fig. 1, panel c) for approximately . Beyond approximately the shell loses its spherical shape and interacts with an atomic cloud[30, 44] (Fig. 1, panel a).
Spectra, together with the corresponding Auxiliary Response File, ARF, and Redistribution Matrix File, RMF, were extracted via the CIAO tool specextract (https://cxc.cfa.harvard.edu/ciao/ahelp/specextract.html). Background spectra were extracted from regions selected out of the remnant, without point-like sources and, when possible, in the same chip as the source regions. We verified that the results of our spectral analysis are unaffected by the selection of other background regions. Spectra were rebinned by adopting the “optimal binning” procedure[45]. As a cross-check, we also rebinned the spectra so as to get at least 25 counts per spectral bin, obtaining the same results, though with slightly larger error bars. Spectral analysis was performed with XSPEC version12.10.1f[46] in the keV band, by adopting statistics. Spectra extracted from the same region of the sky in different observations were fitted simultaneously. We found out that all our results do not change significantly by modeling the spectrum of the background, instead of subtracting it, and by using Cash statistics instead of -minimization in the fitting process.
Thermal emission from the shocked ISM was described by an isothermal plasma in non equilibrium of ionization with a single ionization parameter, (model NEI in XSPEC, https://heasarc.gsfc.nasa.gov/xanadu/xspec/manual/node195.html, based on the database AtomDB version 3.09, see http://www.atomdb.org/Webguide/webguide.php). Though we adopt a state-of-the-art spectral model, we acknowledge that there may be limitations in the description of the emission stemming from an under-ionized plasma with a very low ionization parameter, such as the one studied here. However, we expect this effect to introduce almost the same biases (if any) in all regions, and not be responsible for the density profile shown in Fig. 3. We found that the electron temperature in the shocked ISM is consistent with being constant over all the explored regions and fixed it to the best-fit value obtained in region 0 ( keV), where we get the most precise estimate (error bars approximately keV at the confidence level). This value is in remarkable agreement with that measured in a similar region with XMM-Newton[29]. We included the effects of interstellar absorption by adopting the model TBABS (https://heasarc.gsfc.nasa.gov/xanadu/xspec/manual/node268.html) within XSPEC. The interstellar absorption is expected to be uniform in the portion of the shell analyzed and we fixed the absorbing column density to , in agreement with radio observations[32]. We performed the F-test in all regions, finding that the quality of the spectral fittings does not improve significantly by letting , or free to vary. The ISM emission measure and ionization parameter, , were left free to vary in the fitting procedure.
We verified that this model provides an accurate description of spectra extracted from regions in the thermal southeastern limb (namely regions ) and an additional nonthermal component does not improve significantly the quality of the fits, its normalization being consistent with 0 at less than the 99% confidence level. However, in regions there is a significant synchrotron emission. We then added a synchrotron component when fitting the spectra from these regions and modeled the synchrotron emission by considering the electron spectrum in the loss-dominated case[47], since this model is particularly well suited for SN 1006[48] (our results and conclusions do not change by adopting an exponentially cut-off power-law distribution of electrons (XSPEC/SRCUT model, https://heasarc.gsfc.nasa.gov/xanadu/xspec/manual/node228.html) to describe synchrotron emission, as done in previous works[27, 29]). Normalization and break energy of the synchrotron emission were left free to vary in the fittings. The normalization of the thermal component is significantly larger than 0 at the confidence level in all regions.
Table 1 shows the best fit results for all the regions, with errors at the 68% confidence level. We derive the average plasma density, , in each spectral region from the corresponding best-fit value of the emission measure of the plasma (, where is the plasma density and is its volume). The volume is calculated with the following method (see Supplementary Software 1 for further details). We project the regions shown in Fig. 1 on a uniform grid with pixel size ( correspond to about at a distance of 2.2 kpc[34]). For each pixel, we calculate the corresponding depth as the length of the chord along the line of sight intercepted by the sphere that maps the shock front, and compute the volume accordingly, We then sum over all the pixels within a given region. The radius of the sphere marking the shock front slightly depends on the region considered, ranging from in region +5 to in region 0, but we use the same center for all the regions (namely, , ). We verified the precision and reliability of our method by considering more regular regions, like those adopted in previous works[29], where the volume can be calculated analytically. We found differences between the numerical and analytical values. The volumes of the emitting plasma in the regions adopted for spectral analysis are listed in Table 1 and were used to derive from . We verified that our results and conclusions do not change by adopting the PSHOCK model within XSPEC to model the thermal emission. The PSHOCK model assumes a linear distribution of the ionization parameter versus emission measure[49], ranging from zero (at the shock front) up to a maximum value ( which is a free parameter in the fit), instead of a single, “mean”, ionization parameter as the NEI model. The best-fit ISM density obtained in region 0 and region 5 with the PSHOCK model is cm-3 and cm-3, respectively (to be compared with cm-3 and cm-3 obtained with the NEI model). As expected, the maximum ionization parameter is approximately a factor of 2 higher than the mean obtained with the NEI model ( s cm-3 and s cm-3, to be compared with s cm-3 and s cm-3).
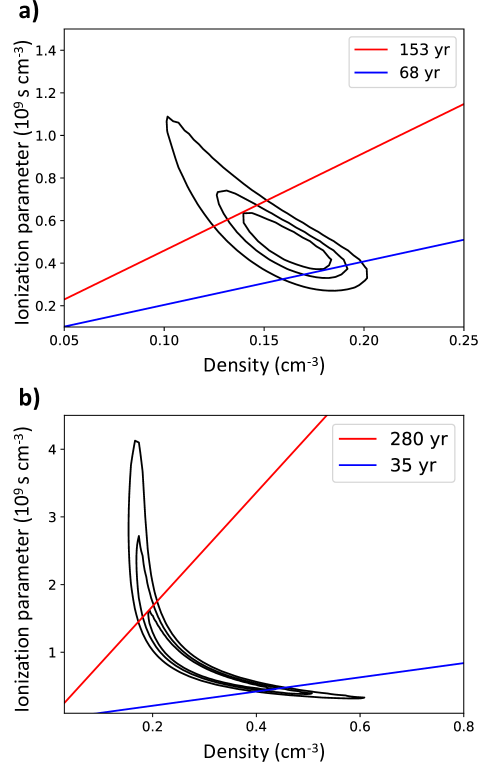
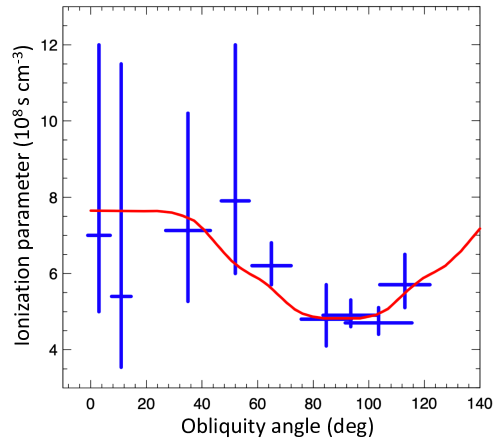
Table 1 shows the best-fit values of the ionization parameter (where is the time-averaged plasma density, and is the mean time elapsed since the shock impact within the region) in all regions. Figure 4 shows the confidence contours of the ISM density (as derived from the ) and , in region 0 and region 5. Since both and depend on the plasma density, it is possible to estimate . The figure includes isochrones in the ) space, showing that we obtain very reasonable estimates of the mean time elapsed after the shock impact ( yr).
The radial size of the extraction regions changes from case to case, and so does their inner boundary, which is closer to the shock front in some regions (e.g., region 3, 4, 5) than in others (e.g., region -1 and region -2). Therefore, is not strictly the same for all regions, and the ionization parameter does not depend only on the plasma density (we expect lower in the narrow regions around the northeastern polar cap). However, we find that, especially for regions with similar radial size, higher values of the post-shock density are associated with higher values of , as shown in Table 1 and Fig. 5. The azimuthal profile of the ionization parameter shown in Fig. 5 is then consistent with the density profile shown in Fig. 3.
In the framework of the XMM-Newton Large Program of observations of SN 1006 (PI A. Decourchelle), we analyze the EPIC observation 0555630201 (see Table 2). XMM-Newton EPIC data were processed with the Science Analysis System software, V18.0.0 (see the Users Guide to the XMM-Newton Science Analysis System”, Issue 17.0, 2022 https://xmm-tools.cosmos.esa.int/external/xmm_user_support/documentation/sas_usg/USG/). Event files were filtered for soft protons contamination by adopting the ESPFILT task (https://xmm-tools.cosmos.esa.int/external/sas/current/doc/espfilt/espfilt.html), thus obtaining a screened exposure time of 89 ks, 94 ks and 51 ks for MOS1, MOS2[50] and pn[51] data, respectively. We selected events with PATTERN for the MOS cameras, PATTERN for the pn camera, and FLAG0 for both.
We extracted EPIC spectra from region 3 and the union of region 4 and region 5 (hereafter region 4-5, extraction regions are shown in Fig. 1). Spectra were rebinned by adopting the optimal binning precedure and spectral analysis was performed with XSPEC in the keV band by adopting the model described above for the analysis of Chandra spectra. MOS and pn spectra were fitted simultaneously. We point out that Chandra and XMM-Newton spectra were fitted independently.
Best fit values are shown in Table 1, with errors at the 68% confidence level. Regions selected for spectral analysis are located at the rim of the shell and part of the ISM X-ray emission is spread outside the outer border of the regions, because of the relatively large point spread function of the telescope mirrors (corresponding to about full width half maximum). We quantified this effect by assuming that the ISM emission is uniformly distributed in each spectral region and found that approximately of the ISM X-ray emission leaks out of each region. We address this issue by correcting the measured plasma emission measure accordingly. This has a small effect on the density estimate, considering that the density is proportional to the square root of the emission measure. However, we applied this correction to derive the density estimates shown in Table 1 and in Fig. 3 as well as to revise the previous values obtained in the southeastern limb[29] and also shown in Table 3 and Fig. 3.
Modeling the shock modification
Efficient acceleration of CRs has always been associated with an increase in the shock compressibility [16, 52, 41] as due to the softer equation of state of relativistic CRs, whose adiabatic index is 4/3 (rather than 5/3) and the escape of particles from upstream, which effectively makes the shock behave as partially radiative[53, 54]. In this case, though, CR spectra would become significantly harder than above a few GeV, at odds with ray observations of individual SNRs[55, 56].
Unprecedentedly-long hybrid simulations of non-relativistic shocks have recently revealed an effect that was not accounted for in the classical DSA theory, namely that the CR-amplified magnetic turbulence may have a sizable speed with respect to the shocked plasma, resulting in a postcursor, i.e., a region behind the shock where both CRs and magnetic fields drift away from the shock faster than the fluid itself[20, 21]. The postcursor-induced shock modification has two main implications: on one hand, it acts as a sink of energy, which leads to an enhanced compression, and on the other hand it advects CRs away from the shock at a faster rate, which leads to steeper spectra[57]. The relevance of the postcursor is controlled by the post-shock Alfvén velocity[20] relative to the downstream fluid velocity, and can therefore be inferred from observations in which shock velocity and downstream density and magnetic field are constrained; simple estimates for both radio SNe and historical SNRs return a remarkable agreement between observations and theory[21, 58].
It has been shown[20] that it is possible to calculate the shock compression ratio given the post-shock pressures in CRs and magnetic fields ( and ), normalized to the upstream bulk pressure. We then consider the contribution of CRs injected from the thermal pool[22, 59, 20] and re-accelerated seeds[35], which both are expected to produce magnetic turbulence via the Bell instability for strong shocks[60, 35]. The dependence on the shock obliquity is modelled after hybrid simulations and modulated with
| (1) |
We consider , corresponding to the pressure in CR protons injected from the thermal pool, reaccelerated seeds, and B fields, respectively; with such a prescription, each pressure is maximum at and drops over an interval centered at , respectively. The solid line in Figure 3 shows the prediction for efficiencies , , and ; all these values are not the result of a best fitting, but rather motivated by simulations[22, 60, 35] and successfully applied to the study of individual SNRs[11, 58].
Note that, with the current parametrization, the total efficiency at parallel regions is , which is reasonable when acceleration of He nuclei is added on top of protons [61].
We also explored a different configuration of the ambient magnetic field, by including the effects of a gradient of the field strength (as suggested by the slantness of the radio limbs[24]) on the shock obliquity. By adopting the formalism described above, with , , and , we obtain the profile shown in Fig. 6.
Data Availability
The Chandra and XMM-Newton data analyzed in this paper are publicly available in the Chandra Data Archive and XMM-Newton Science Archive, respectively. Table 2 provides the direct link to each observation. Datasets generated during the current study are available from the corresponding author on reasonable request. Source data are provided with this paper.
Code Availability
Chandra data were processed by adopting the CIAO software package, available at https://cxc.cfa.harvard.edu/ciao/. XMM-Newton data were analyzed by using the SAS package, available at https://www.cosmos.esa.int/web/xmm-newton/download-and-install-sas. XSPEC, the software adopted for X-ray spectral analysis, is available at https://heasarc.gsfc.nasa.gov/xanadu/xspec/. The Python code that we developed to calculate the volumes is provided as Supplementary Software.
References
References
- [1] Sreekumar, P. et al. Constraints on the cosmic rays in the Small Magellanic Cloud. Phys. Rev. Lett. 70, 127–129 (1993).
- [2] Blasi, P. The origin of galactic cosmic rays. A&A Rev. 21, 70 (2013).
- [3] Green, D. A. A revised catalogue of 294 Galactic supernova remnants. Journal of Astrophysics and Astronomy 40, 36 (2019).
- [4] Koyama, K. et al. Evidence for shock acceleration of high-energy electrons in the supernova remnant sn:1006. Nature 378, 255 (1995).
- [5] Vink, J. Supernova remnants: the X-ray perspective. A&A Rev. 20, 49 (2012).
- [6] H. E. S. S. Collaboration et al. Population study of Galactic supernova remnants at very high -ray energies with H.E.S.S. A&A 612, A3 (2018).
- [7] Acero, F. et al. The First Fermi LAT Supernova Remnant Catalog. ApJS 224, 8 (2016).
- [8] Acero, F. et al. First detection of VHE -rays from SN 1006 by HESS. A&A 516, A62 (2010).
- [9] Condon, B., Lemoine-Goumard, M., Acero, F. & Katagiri, H. Detection of Two TeV Shell-type Remnants at GeV Energies with FERMI LAT: HESS J1731-347 and SN 1006. ApJ 851, 100 (2017).
- [10] Tavani, M. et al. Direct Evidence for Hadronic Cosmic-Ray Acceleration in the Supernova Remnant IC 443. ApJ 710, L151–L155 (2010).
- [11] Morlino, G. & Caprioli, D. Strong evidence for hadron acceleration in Tycho’s supernova remnant. A&A 538, A81 (2012).
- [12] Ackermann, M. et al. Detection of the Characteristic Pion-Decay Signature in Supernova Remnants. Science 339, 807–811 (2013).
- [13] Slane, P. et al. A CR-hydro-NEI Model of the Structure and Broadband Emission from Tycho’s Supernova Remnant. ApJ 783, 33 (2014).
- [14] Gabici, S. et al. The origin of Galactic cosmic rays: Challenges to the standard paradigm. International Journal of Modern Physics D 28, 1930022–339 (2019).
- [15] Hillas, A. M. TOPICAL REVIEW: Can diffusive shock acceleration in supernova remnants account for high-energy galactic cosmic rays? Journal of Physics G Nuclear Physics 31, R95–R131 (2005).
- [16] Drury, L. O. An introduction to the theory of diffusive shock acceleration of energetic particles in tenuous plasmas. Reports on Progress in Physics 46, 973–1027 (1983).
- [17] Decourchelle, A., Ellison, D. C. & Ballet, J. Thermal X-Ray Emission and Cosmic-Ray Production in Young Supernova Remnants. ApJ 543, L57–L60 (2000).
- [18] Blasi, P. A semi-analytical approach to non-linear shock acceleration. Astroparticle Physics 16, 429–439 (2002).
- [19] Vink, J., Yamazaki, R., Helder, E. A. & Schure, K. M. The Relation Between Post-shock Temperature, Cosmic-ray Pressure, and Cosmic-ray Escape for Non-relativistic Shocks. ApJ 722, 1727–1734 (2010).
- [20] Haggerty, C. C. & Caprioli, D. Kinetic Simulations of Cosmic-Ray-modified Shocks. I. Hydrodynamics. ApJ 905, 1 (2020).
- [21] Caprioli, D., Haggerty, C. C. & Blasi, P. Kinetic Simulations of Cosmic-Ray-modified Shocks. II. Particle Spectra. ApJ 905, 2 (2020).
- [22] Caprioli, D. & Spitkovsky, A. Simulations of Ion Acceleration at Non-relativistic Shocks. I. Acceleration Efficiency. ApJ 783, 91 (2014).
- [23] Rothenflug, R. et al. Geometry of the non-thermal emission in SN 1006. Azimuthal variations of cosmic-ray acceleration. A&A 425, 121–131 (2004).
- [24] Bocchino, F., Orlando, S., Miceli, M. & Petruk, O. Constraints on the local interstellar magnetic field from non-thermal emission of SN1006. A&A 531, A129 (2011).
- [25] Reynoso, E. M., Hughes, J. P. & Moffett, D. A. On the Radio Polarization Signature of Efficient and Inefficient Particle Acceleration in Supernova Remnant SN 1006. AJ 145, 104 (2013).
- [26] Cassam-Chenaï, G., Hughes, J. P., Reynoso, E. M., Badenes, C. & Moffett, D. Morphological Evidence for Azimuthal Variations of the Cosmic-Ray Ion Acceleration at the Blast Wave of SN 1006. ApJ 680, 1180–1197 (2008).
- [27] Miceli, M. et al. Thermal emission, shock modification, and X-ray emitting ejecta in SN 1006. A&A 501, 239–249 (2009).
- [28] Orlando, S., Bocchino, F., Miceli, M., Petruk, O. & Pumo, M. L. Role of Ejecta Clumping and Back-reaction of Accelerated Cosmic Rays in the Evolution of Type Ia Supernova Remnants. ApJ 749, 156 (2012).
- [29] Miceli, M. et al. XMM-Newton evidence of shocked ISM in SN 1006: indications of hadronic acceleration. A&A 546, A66 (2012).
- [30] Miceli, M. et al. Shock-Cloud Interaction and Particle Acceleration in the Southwestern Limb of SN 1006. ApJ 782, L33 (2014).
- [31] Winkler, P. F. et al. A High-resolution X-Ray and Optical Study of SN 1006: Asymmetric Expansion and Small-scale Structure in a Type Ia Supernova Remnant. ApJ 781, 65 (2014).
- [32] Dubner, G. M., Giacani, E. B., Goss, W. M., Green, A. J. & Nyman, L.-Å. The neutral gas environment of the young supernova remnant SN 1006 (G327.6+14.6). A&A 387, 1047–1056 (2002).
- [33] Patnaude, D. J., Ellison, D. C. & Slane, P. The Role of Diffusive Shock Acceleration on Nonequilibrium Ionization in Supernova Remnants. ApJ 696, 1956–1963 (2009).
- [34] Winkler, P. F., Gupta, G. & Long, K. S. The SN 1006 Remnant: Optical Proper Motions, Deep Imaging, Distance, and Brightness at Maximum. ApJ 585, 324–335 (2003).
- [35] Caprioli, D., Zhang, H. & Spitkovsky, A. Diffusive shock re-acceleration. J. of Plasma Phys. 84, 715840301 (2018).
- [36] Caprioli, D. & Spitkovsky, A. Simulations of Ion Acceleration at Non-relativistic Shocks: I. Acceleration Efficiency. ApJ 783, 91 (2014).
- [37] Caprioli, D., Pop, A. & Spitkovsky, A. Simulations and Theory of Ion Injection at Non-relativistic Collisionless Shocks. ApJ Letters 798, 28 (2015).
- [38] Caprioli, D., Zhang, H. & Spitkovsky, A. Diffusive shock re-acceleration. JPP (2018). URL http://adsabs.harvard.edu/abs/2018arXiv180101510C.
- [39] Morlino, G., Amato, E., Blasi, P. & Caprioli, D. Spatial structure of X-ray filaments in SN 1006. MNRAS 405, L21–L25 (2010).
- [40] O’C. Drury, L. An introduction to the theory of diffusive shock acceleration of energetic particles in tenuous plasmas. Reports of Progress in Physics 46, 973–1027 (1983). URL http://adsabs.harvard.edu/abs/1983RPPh...46..973D.
- [41] Malkov, M. A. & O’C. Drury, L. Nonlinear theory of diffusive acceleration of particles by shock waves. Rep. Prog. Phys. 64, 429–481 (2001). URL http://adsabs.harvard.edu/abs/2001RPPh...64..429M.
- [42] Green, D. A. A revised catalogue of 294 Galactic supernova remnants. Journal of Astrophysics and Astronomy 40, 36 (2019).
- [43] Fruscione, A. et al. CIAO: Chandra’s data analysis system. In Silva, D. R. & Doxsey, R. E. (eds.) Society of Photo-Optical Instrumentation Engineers (SPIE) Conference Series, vol. 6270 of Society of Photo-Optical Instrumentation Engineers (SPIE) Conference Series, 62701V (2006).
- [44] Miceli, M. et al. Modeling the shock-cloud interaction in SN 1006: Unveiling the origin of nonthermal X-ray and -ray emission. A&A 593, A26 (2016).
- [45] Kaastra, J. S. & Bleeker, J. A. M. Optimal binning of X-ray spectra and response matrix design. A&A 587, A151 (2016).
- [46] Arnaud, K. A. XSPEC: The First Ten Years. In ASP Conf. Ser. 101: Astronomical Data Analysis Software and Systems V, 17 (1996).
- [47] Zirakashvili, V. N. & Aharonian, F. A. Nonthermal Radiation of Young Supernova Remnants: The Case of RX J1713.7-3946. ApJ 708, 965–980 (2010).
- [48] Miceli, M. et al. The shape of the cutoff in the synchrotron emission of SN 1006 observed with XMM-Newton. A&A 556, A80 (2013).
- [49] Borkowski, K. J., Lyerly, W. J. & Reynolds, S. P. Supernova Remnants in the Sedov Expansion Phase: Thermal X-Ray Emission. ApJ 548, 820–835 (2001).
- [50] Turner, M. J. L. et al. The European Photon Imaging Camera on XMM-Newton: The MOS cameras : The MOS cameras. A&A 365, L27–L35 (2001). URL http://cdsads.u-strasbg.fr/cgi-bin/nph-bib_query?bibcode=2001A%26A...365L..27T&db_key=AST.
- [51] Strüder, L. et al. The European Photon Imaging Camera on XMM-Newton: The pn-CCD camera. A&A 365, L18–L26 (2001). URL http://cdsads.u-strasbg.fr/cgi-bin/nph-bib_query?bibcode=2001A%26A...365L..18S&db_key=AST.
- [52] Jones, F. C. & Ellison, D. C. The plasma physics of shock acceleration. Space Science Rev. 58, 259–346 (1991).
- [53] Drury, L. O. & Voelk, J. H. Hydromagnetic shock structure in the presence of cosmic rays. ApJ 248, 344–351 (1981).
- [54] Caprioli, D., Blasi, P. & Amato, E. On the escape of particles from cosmic ray modified shocks. MNRAS 396, 2065–2073 (2009).
- [55] Caprioli, D. Understanding hadronic gamma-ray emission from supernova remnants. J. Cosmology Astropart. Phys 2011, 026 (2011).
- [56] Caprioli, D. Cosmic-ray acceleration in supernova remnants: non-linear theory revised. J. Cosmology Astropart. Phys 7, 38 (2012).
- [57] Bell, A. R. The acceleration of cosmic rays in shock fronts. I. MNRAS 182, 147–156 (1978).
- [58] Diesing, R. & Caprioli, D. Steep Cosmic-Ray Spectra with Revised Diffusive Shock Acceleration. ApJ 922, 1 (2021).
- [59] Caprioli, D., Pop, A.-R. & Spitkovsky, A. Simulations and Theory of Ion Injection at Non-relativistic Collisionless Shocks. ApJ 798, L28 (2015).
- [60] Caprioli, D. & Spitkovsky, A. Simulations of Ion Acceleration at Non-relativistic Shocks: II. Magnetic Field Amplification. ApJ 794, 46 (2014).
- [61] Caprioli, D., Yi, D. T. & Spitkovsky, A. Chemical Enhancements in Shock-Accelerated Particles: Ab initio Simulations. Phys. Rev. Lett. 119, 171101 (2017).
- [62] Petruk, O. et al. Aspect angle for interstellar magnetic field in SN 1006. MNRAS 393, 1034–1040 (2009).
Correspondence to M. Miceli (email: marco.miceli@unipa.it).
We thank F. Winkler for kindly providing us with the Hα map of SN 1006. We thank P. Plucinsky for helpful suggestions on the Chandra data analysis. MM, SO, FB, EG, and GP acknowledge financial contribution by the PRIN INAF 2019 grant and the INAF mainstream program. DC is supported by NASA grant 80NSSC20K1273 and NSF grants AST-1909778, AST-2009326 and PHY-2010240. JV’s and EG’s work on this paper has received funding from the European Union’s Horizon 2020 research and innovation programme under grant agreement No 101004131 (SHARP). AD acknowledges support by the Centre National d’Etudes Spatiales (CNES). M.M. and R.G. acknowledge support by the INAF Mini-Grant “X-raying shock modification in supernova remnants”’ The scientific results reported in this article are based in part on data obtained from the Chandra Data Archive. This research has made use of software provided by the Chandra X-ray Center (CXC) in the application package CIAO. Results are based in part on observations obtained with XMM-Newton, an ESA science mission with instruments and contributions directly funded by ESA Member States and NASA
M. M. conceived and coordinated the project, led the XMM-Newton data analysis and wrote the manuscript. R. G. led the analysis of the Chandra observations. D. C. devised the theoretical modeling of shock modification. A. D., J. V., S. O. and G. P., provided insights on the analysis and on the interpretation of the results. E. G. and F. B. collaborated to the X-ray data analysis. All authors discussed the results and implications and commented on the manuscript at all stages.
The authors declare no competing interests.
| Chandra | ||||||
| Region | Volume ( cm3) | ( cm-3) | ( s cm-3) | ( eV) | (cm-3) | |
| XMM-Newton | ||||||
| Region | Volume ( cm3) | ( cm-3) | ( s cm-3) | ( eV) | (cm-3) | |
| Azimuthal opening angle (∘) | Region name[29] | Density (cm-3) |
|---|---|---|