Perfusion assessment via local remote photoplethysmography (rPPG)
Abstract
This paper presents an approach to assess the perfusion of visible human tissue from RGB video files. We propose metrics derived from remote photoplethysmography (rPPG) signals to detect whether a tissue is adequately supplied with blood. The perfusion analysis is done in three different scales, offering a flexible approach for different applications. We perform a plane-orthogonal-to-skin rPPG independently for locally defined regions of interest on each scale. From the extracted signals, we derive the signal-to-noise ratio, magnitude in the frequency domain, heart rate, perfusion index as well as correlation between specific rPPG signals in order to locally assess the perfusion of a specific region of human tissue. We show that locally resolved rPPG has a broad range of applications. As exemplary applications, we present results in intraoperative perfusion analysis and visualization during skin and organ transplantation as well as an application for liveliness assessment for the detection of presentation attacks to authentication systems.
1 Introduction
Perfusion assessment and vital sign monitoring have been addressed in recent years with a vast amount of possible solutions. The range of proposed applications last from clinical diagnostics and monitoring up to liveliness analysis in security applications.
Especially, the assessment of perfusion is challenging as an analysis of the blood flow requires temporally continuous, and at the same time, locally resolved information. Most solutions do not meet all these requirements. Global vital signs can be measured objectively and continuously using a monitoring system with sensors attached to the patient. Heart rate (HR) measurement is usually based on photoplethysmography (PPG) [43] measuring optically the light transmission and reflectance caused by blood flow [30] with a sensor directly placed on the skin of the patient. The same principle is used in remote photoplethysmography (rPPG), which allows contactless measurements of the HR with a regular RGB camera[24, 33, 15, 37]. The majority of rPPG-related literature addresses the extraction of global vital signs. Only little work has been published on locally resolved rPPG signals to, e.g., analyze the blood flow through human tissue, mainly in the human face [38, 43, 15, 13].
Although the assessment of optimal blood flow is essential for many medical procedures, e.g. tissue or organ transplantation, in order to evaluate the surgical success, the current gold standard is still subjective clinical assessment of the situs and patient’s condition at the bedside. Existing monitoring techniques have been reported in the past, but due to several disadvantages, e.g., invasiveness and potential complications, they failed to gain acceptance [29, 12, 20]. A promising non-invasive, non-contact and non-ionising but cost-intensive method is hyperspectral imaging [39, 21, 31, 34]. Further, telemedicine as a remote service for diagnosis and medical monitoring is a fast-growing public health sector. Especially, the COVID-19 pandemic moved it into focus. Unfortunately, telehealth does not allow measuring the vital signs using patient contact. However, the face of the patient can be an essential source of information about vital signs and well-being. Therefore, it would be beneficial to directly determine the patient’s condition from the face in the video stream. Thus, there is a growing need for an objective, reliable, and examiner-independent method to safely assess perfusion and vital signs in many medical applications, ranging from intraoperative monitoring as well as telehealth applications.
In addition to clinical assessment, rPPG can also be used in security applications for liveliness analysis in order to detect presentation attacks (PAD) [28, 9, 18, 23, 13]. The use of a facial recognition system for authentication has become widespread. Biometric authentication systems based on facial recognition are already used in border security systems and unlock smartphones. Although widely used and highly accurate, facial recognition algorithms suffer from vulnerability to simple spoofing attacks by impersonating a target victim holding the desired authorization [19] through the use of, e.g., photos or masks [6]. RPPG methods can be used to detect if the whole face is covered by a mask or not[18]. In addition, locally resolved rPPG analysis, as proposed in this paper, is able to detect partial face masks.
In this paper, we propose a method for locally (i.e. spatially) resolved rPPG analysis for the assessment of the blood flow through human tissue from videos with the aim to visualize tissue perfusion quality as well as blood flow. In our approach, the perfusion can be assessed at different scales depending on the chosen application: globally for an overall perfusion assessment of, e.g., implanted tissue, region-based to detect poorly or non-perfused regions, and locally to visualize the blood flow. We introduce metrics derived from rPPG to detect whether a tissue is adequately supplied with blood. We compute these multiple parameters from the local rPPG signal, which are then utilized to assess the perfusion. Here, we define three parameters to analyze the perfusion in a region of interest (ROI) based on the rPPG signal.
The remainder of this paper is organized as follows. In Sec. 2, we review existing related work on remote photoplethysmography for vital sign and perfusion analysis. The proposed method and the dataset are described in Sec. 3 and Sec. 4, respectively. In Sec. 5, we introduce different applications for each presented scale. Then, in Sec. 6 the results are discussed, while Sec. 7 concludes the paper.
2 Related Work
The measurement of the HR111Heart rate and pulse rate have been used synonymously in the literature, although they are not precisely the same [16, 25, 32]. To be precise, according to medical definitions, the rPPG signal can be used to extract the pulse rate signal, but we will use the term HR in this paper. is usually based on the optical measuring technique photoplethysmography (PPG) [43]. The principle is based on human blood circulation and the fact that blood absorbs more light than surrounding tissue. Thus, variations in blood volume affect light transmission or reflectance accordingly[30]. A photoplethysmography (PPG) sensor (commonly used to measure the human pulse rate) is placed directly on the skin and optically detects the changes in blood volume[30]. The same principle is used in remote photoplethysmography (rPPG), which allows contactless measurements of the HR with a regular RGB camera[43]: the blood flow through the human circulatory system leads to a continuous change in skin color, which is analyzed by rPPG techniques to determine the HR [24, 5, 33, 32].
To robustly extract an rPPG signal regardless of the subject’s skin tone and illumination color (non-white illumination), a chrominance-based calculation (CHROM) of the rPPG signal has been developed [5] for pre-processing the input frames. Similarly, the Plane-Orthogonal-to-Skin Transformation (POS)[33] projects a three-channel (R-G-B) image onto a plane orthogonal to the [1, 1, 1] direction to create a two-channel image. These two channels are then fused to the desired rPPG signal.
As global model-based methods can be affected, e.g., by noise, compression artifacts, or masking, several of the latest rPPG related publications use deep neural networks to extract the HR from video [4, 42, 41]. Yang et al. [37] compared three neural networks (Deepphys [4], rPPGNet [42], and Physnet [41]) with model-based approaches (independent component analysis (ICA) [24], CHROM [5], and POS [33]) on the publicly available UBFC-rPPG dataset [1]. In these experiments, the deep-learning-based approaches outperform the model-based approaches under constant lighting conditions, but model-based approaches (ICA, CHROM, and POS) show more accurate and robust results than neuronal networks in varying lighting conditions [37]. The recent ICCV Vision-for-Vitals (V4V) challenge [27] comparing different model-based as well as network-based approaches [14, 7, 10, 27] for the measurement of the HR, shows similar results.
Recently, rPPG signals have also been analyzed locally and visualized based on amplitude, velocity, or signal-to-noise ratio (SNR) map[38, 43]. Especially, the blood flow has been analyzed in videos showing a human face [38, 15, 13]. The blood flow velocity is calculated from the relative phase shift of the frequency component corresponding to the HR in the frequency domain. These methods assume that the difference between neighboring phase values directly corresponds to the velocity at this point. Applying a 2D Sobel operator to the calculated phase shifts results to the desired velocity map. Another method for estimating perfusion speed from videos uses spatially separated rPPG signals; band-pass filtered based on the HR measured with an electrocardiogram (ECG) [43]. The time delay between specific positions can then be extracted and the pulse wave perfusion speed calculated. However, since the calculation is performed on pixel values, the result is neither a physical speed nor can it be transferred to other data.
3 Method
This chapter presents our approach for rPPG-based perfusion assessment of skin tissue. We distinguish between three different scales for the analysis of perfusion and blood flow: (1) global, (2) region-based, and (3) local. The global analysis resembles a one-dimensional rPPG signal extraction from a video recording. In the region-based approach, we subdivide the region of interest (ROI) in the video into sub-regions and analyze these. The local blood flow analysis resolves the rPPG signal on pixel-level in the input RGB video. The three different scales require different prepossessing steps, including annotation of the ROI, image registration, image filtering, and scaling. In the following, we describe our approach for calculating the rPPG signal and the derivation of the perfusion parameters from the rPPG signal. Details on the pre-processing steps for the different scales are explained in sections Sec. 3.2 to Sec. 3.4.
3.1 rPPG-based Perfusion Assessment
In order to extract an rPPG signal for each scale (ROI, region or pixel position), we use the POS transformation [33] as it showed best results for different lightning conditions [37]. For each frame, the red (R), green (G), and blue (B) color values are pixel-wise averaged for each scale and concatenated to a three-dimensional (3D) normalized time signal per scale. This signal is projected onto a plane orthogonal to an normalized skin tone vector using
| (1) |
and
| (2) |
The resulting 2D signal is combined into a 1D signal by
| (3) |
where is the standard deviation (SD). This ensures that the resulting signal contains the maximum amount of pulsating component. Details can be found in [33]. The output signal is normalized and filtered with a fifth order Butterworth digital band-pass filter (between and ), resulting in the rPPG signal . The temporal trend of the rPPG signal is extracted using a sliding window of with step size .
The HR determination is done in the frequency domain [15, 24]. We propose the sub bin maximum analysis to determine the heart frequency of the rPPG signal. For each scale, we transform the time domain rPPG signal into the frequency domain via fast Fourier transform (FFT). Then we identify the maximum sum of the magnitudes of a fundamental frequency and its second harmonic. Thereby, the range from to (i.e., a HR of to ) is considered as eligible interval of the fundamental frequency. The selected fundamental frequency represents the heart frequency for the corresponding scale in the analyzed sliding window of size . This sub bin maximum analysis prevents selecting noise-related frequency components as heart frequency. The HR in beats per minute () is given by . During , the subject’s heart rate varies, which is referred to as heart rate variability (HRV) [43]. In the following, the magnitude of is referred to as (i.e., selected peak on the power spectrum density).
Based on the HR and the extracted rPPG signal, we analyze different parameters for perfusion and blood: SNR, magnitude of the heart frequency, perfusion index (PI), and the reference correlation coefficient between the rPPG signal of ROI and reference region. The SNR, as well as , indicate if the quality of the extracted rPPG signals is sufficient and the measured HR is reliable. The PI immediately reacts to acute and significant changes in blood volume and allows to distinguish between non-perfused and continuously perfused tissue regions quantitatively. The correlation quantifies the relationship between a specific area and a well-perfused reference region.
3.1.1 SNR and Magnitude of the rPPG Signal
In order to quantify the rPPG signal quality, we analyze the SNR, representing the strength of the signal in the frequency domain compared to unwanted noise present in the signal following De Haan et al. [5].
| (4) |
where is the magnitude of the signal , and define the range in which the SNR is calculated (e.g., 0.6 Hz to 4.0 Hz), is the bin number of the frequency component, and is a binary mask defining the signal interval
| (5) |
where is the spectral frequency resolution
| (6) |
with the number of FFT points (i.e. number of samples) and the sampling frequency of the input signal . Due to HRV, an interval of ( in frequency domain) around the heart frequency as well as its second harmonic is used to select the signal. The remaining frequency components are classified as noise, i.e. .
Besides the SNR, the magnitude of the heart frequency is relevant for perfusion assessment. Both values are indicators of the strength and quality of the rPPG signal.
3.1.2 Reference Correlation
The reference correlation coefficient measures the correlation between the rPPG signals of the ROI and the reference region [14]. If no reference region can be specified within the image, an externally measured HR can be used to imitate a reference signal by using a sine wave.
3.1.3 Perfusion Index
Initially, the Perfusion Index (PI) is derived from the PPG signal and represents the ratio of pulsatile on non-pulsatile light absorbance or reflectance of the PPG signal, but it can also be computed from the rPPG signal as a ratio between the DC and AC component[26]. However, it has to be calculated using only the green color channel values of the ROI [25] as the rPPG signal after POS transformation contains no DC component, which would lead to a division by zero.
| (7) |
where time signal is low-pass filtered with cutoff frequency leading to and is the mean and max finds the largest value in the time series . The sample rate and the corresponding Nyquist frequency influence and if is not applicable, has been used.
3.2 Global Analysis
The global analysis allows an overall perfusion assessment of tissue, based on the rPPG signal, the determined HR, and the parameters presented in Sec. 3.1. In the pre-processing steps, an ROI and, if possible, a reference region has to be defined. Based on these areas, the captured frames are motion-compensated as breathing, heartbeat, and external physical contact cause slight movements in the video. We determine the rPPG signals and for the ROI as well as the reference region in order to compute the HR and the parameters for the perfusion assessment (see Sec. 3.1). When skin tissue is the focus of the analyzed video recording, skin segmentation is applied to each frame removing occlusions within the defined ROI (e.g., eyeglasses in facial images). This skin segmentation increases the SNR of the rPPG signal.
3.3 Region-based Analysis
For the region-based approach, the selected ROI is divided into several (five in our examples for the facial videos) sub-regions to preserve the signal intensity of global analysis but, on the other hand, analyze region-based differences. The regions are selected in a way that, despite object (or camera) position, at least one region can be captured by the camera to counteract possible occlusions.For each region, the rPPG signal is extracted individually to determine the subject’s HR [14] as well as the region-specific parameters presented in Sec. 3.1.
3.4 Local Analysis
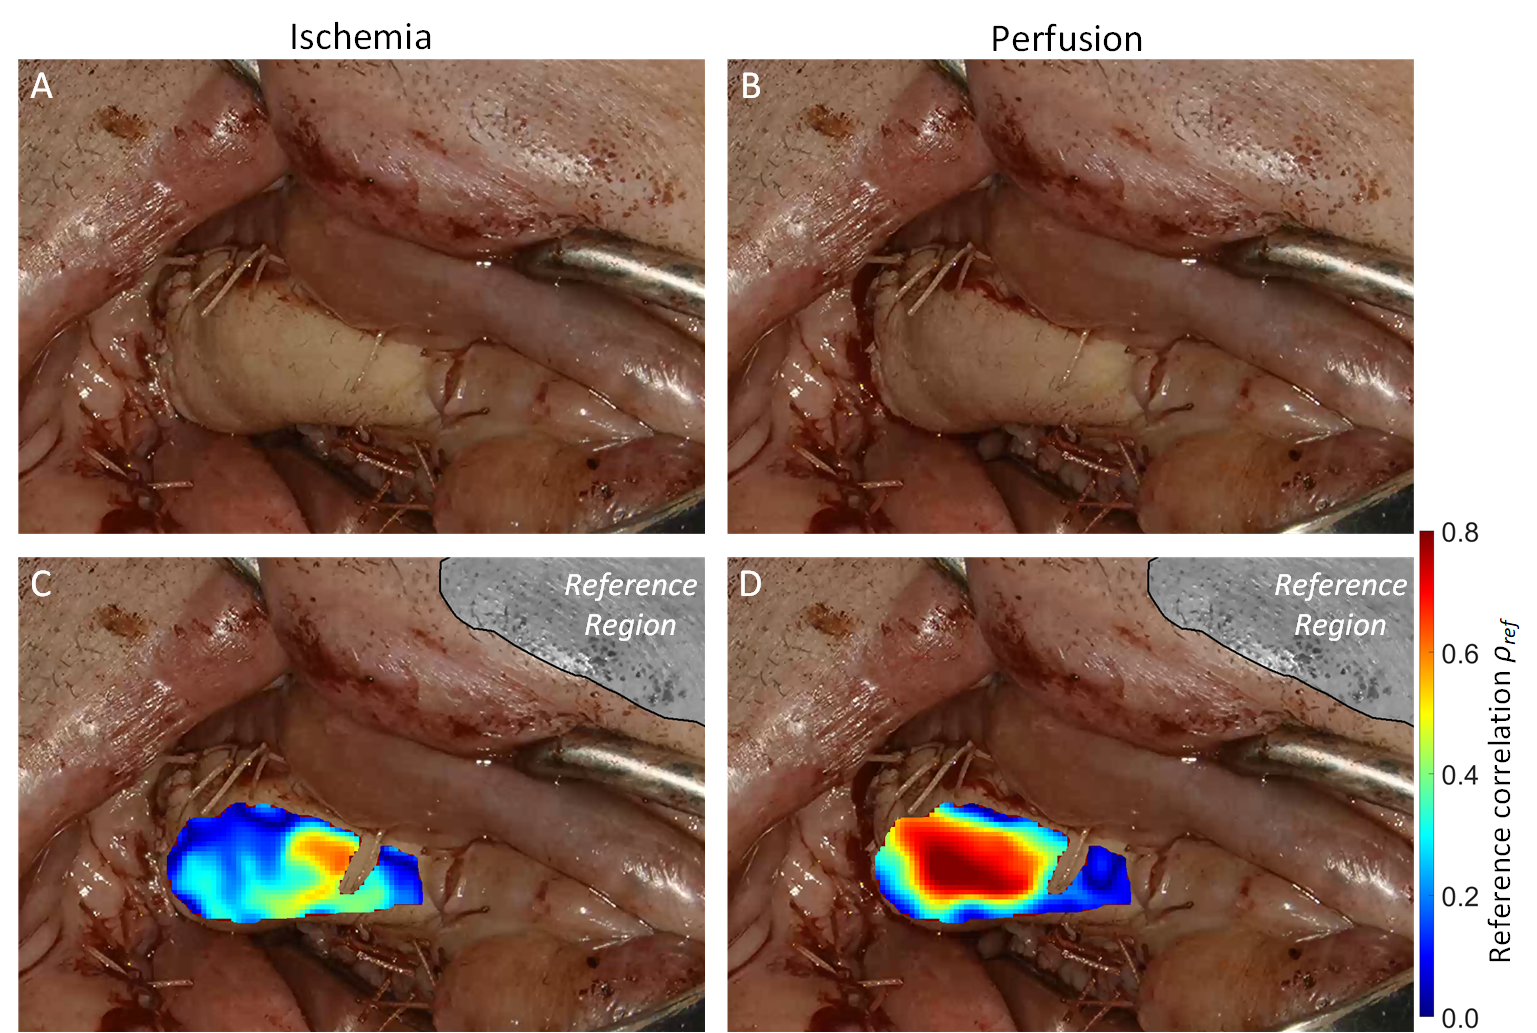
The local analysis resolves the rPPG signal on a pixel level. It allows identifying poorly perfused areas and the accurate differentiation of living tissue from non-living materials. Each spatial position within the image is analyzed. Beforehand, a reference region has to be defined to extract the reference rPPG signal and a global . If no reference region is present, an external HR measurement can also be used to receive . As the influence of noise is stronger for local analysis, we calculate a Gaussian pyramid for each registered image. We chose a pyramid level consisting approx. (i.e., x ) and conducted an rPPG signal extraction as well as parameter calculation (see Sec. 3.1) for each spatial position. The locally resolved parameters can then be used to visualize local perfusion behaviors, e.g., blood flow (see Fig. 3).
4 Datasets
We recorded two datasets, SurgTissue and FaceMask, for the evaluation of our perfusion assessment approach.
Dataset I SurgTissue consists of the operation situs of 14 oncological patients, who underwent tumor resection and defect reconstruction with a free fasciocutaneous flap for head-neck tumors (see Fig. 3) as well as 27 patients receiving a kidney transplantation (see Fig. 4). After reconstruction of the defect with the flap, respectively transplantation of the kidney, the artery as well as the accompanying veins were anastomosed (surgically connected). The reperfusion after opening the clamped artery was documented with an all-digital surgical imaging device with resolution of x , either a surgical microscope (ARRIscope, Munich Surgical Imaging, Germany) with or an endoscope (Karl Storz SE, Germany) with . The patient’s vital signs were recorded continuously and synchronized with each video recording for validation reasons.
Dataset II FaceMask is a collection of RGB video recordings of masked and unmasked subjects. In total, 44 participants aged between 22 to 62 years, female and male, coming from diverse ethnic backgrounds (Hispanic, Asian, African, European) were captured using two different RGB cameras (35 subjects with ace acA2440-75uc, Basler AG, Ahrensburg, Germany and 9 subjects with RealSense D435, Intel Corp, CA, USA). Each person was recorded ten times for each with resolution of × (ace with frame rate 25, 30, 40, or ) or × (RealSense D435 with ). The subjects were illuminated with white light using LED panels (Diva-Lite L20X and L30X, Kino Flo, Inc., CA, USA) and varying light temperatures (, , ). Each participant was connected to a vital sign monitor (VitaGuard 3100, GETEMED, Germany) to measure ECG (via body electrodes, ) and PPG (via finger clip sensor, ) simultaneously to the video recording. The respective subject looked either straight into the camera or as well as moved the head slightly during the recording. First, we recorded the unmasked subject with and without movement. Subsequently, the subject was masked by applying full or partial facial coverings or thick layers of make-up. Finally, we recorded the masked participants again with and without movement. The partial coverage was applied to either the cheek, forehead, chin, or nose region using different variations (skin tones and sizes) of professional make-up equipment. Example images of the FaceMask dataset are shown in the first column of Fig. 6.
5 Results and Applications
In the following, we present results for different applications. First, we show how the scale analysis can measure perfusion and blood flow during surgery. In the second step, we present region-based and local presentation attack detection (PAD).
5.1 Intraoperative Perfusion Assessment
In reconstructive and transplant surgery, flap respectively organ monitoring is crucial for early detection of perfusion problems. The survival of transplanted tissues anastomosed to suitable donor vessels depends on adequate tissue perfusion. Transplantation failure may result due to arterial or venous occlusion due to vasospasm, thrombosis, external compression, vessel kinking, or hematoma formation [2]. Furthermore, timely re-exploration can significantly increase the rate of compromised tissue salvage. Consequently, detecting early signs of deterioration and the necessary correction is only possible with close monitoring [3, 36]. Although several objective monitoring techniques have been reported in the past [29, 8, 22] and a growing need for a reliable and examiner-independent assessment is depicted, the current gold standard for perfusion monitoring is still based on subjective clinical assessment [2]. As a result, since not all parts of the vessel remain visible and slight discoloration is invisible to the human eye, suboptimal positioning as well as slight kinks in the course of the vessel remain undetected though impairing organ function. Analyzing the SurgTissue dataset shows statistically distinct behavior for perfused and non-perfused tissue parts, allowing to specify relevant time points and tissue behaviors.
5.1.1 Global and Region-based Assessment
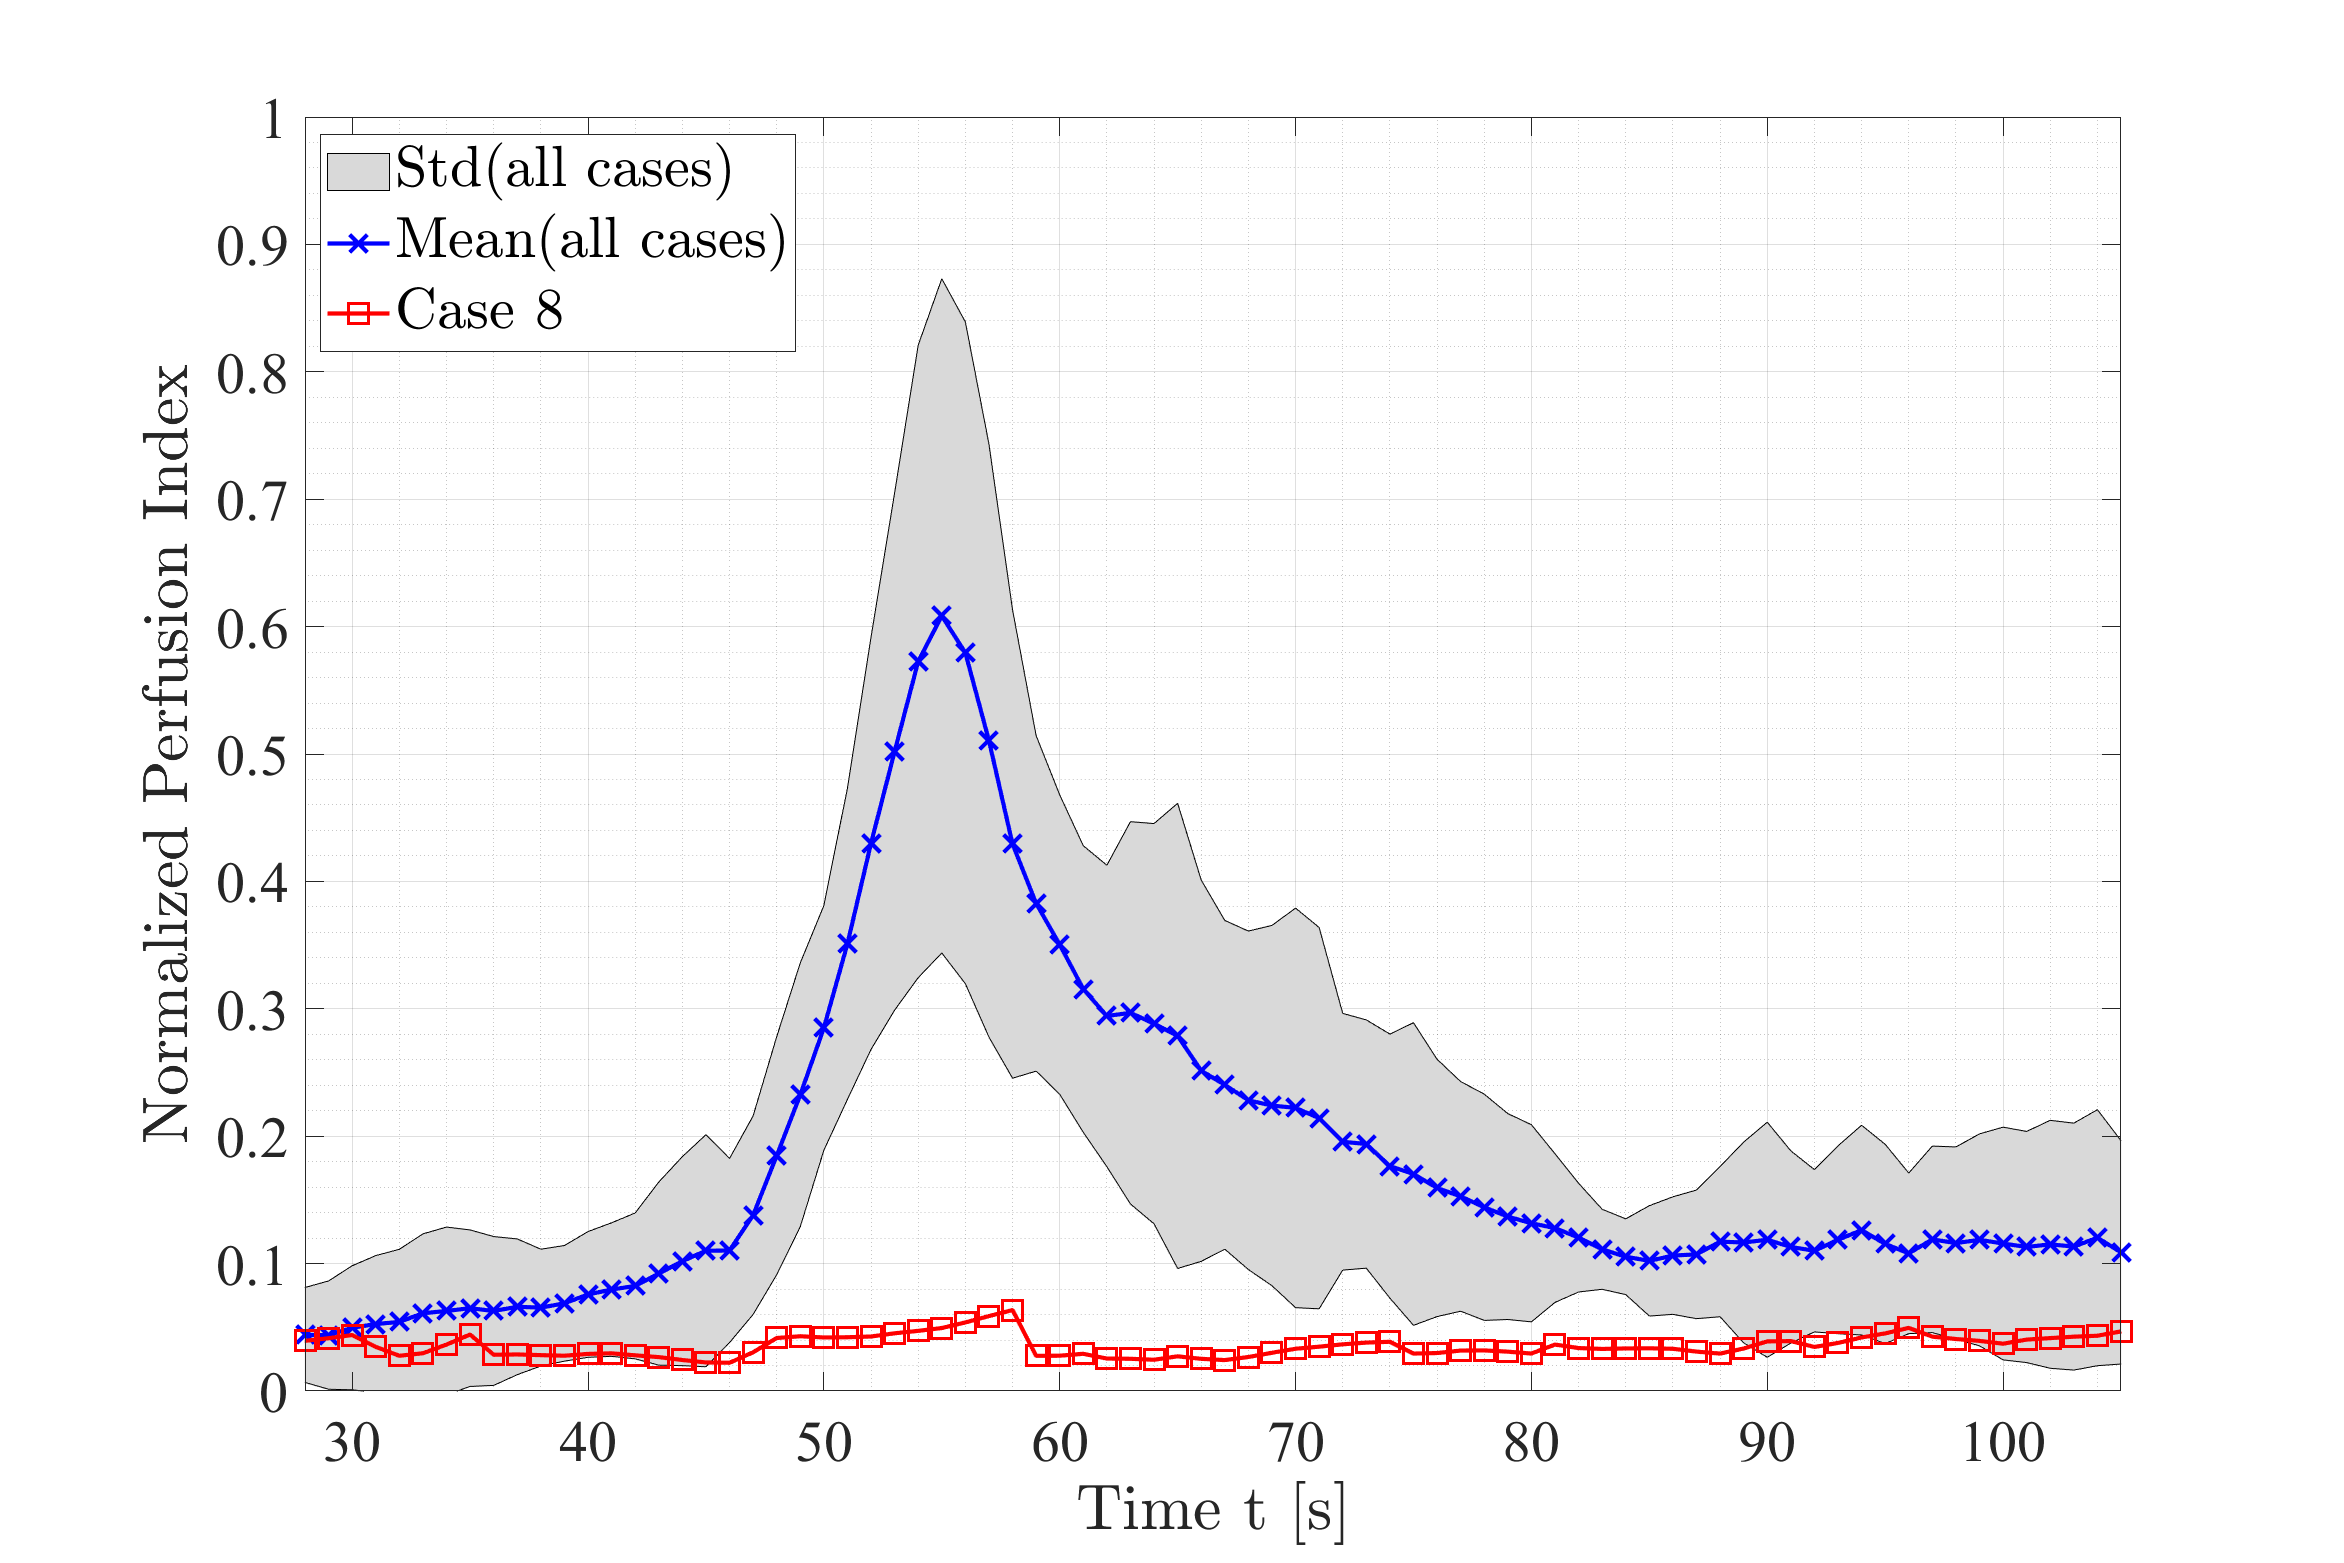
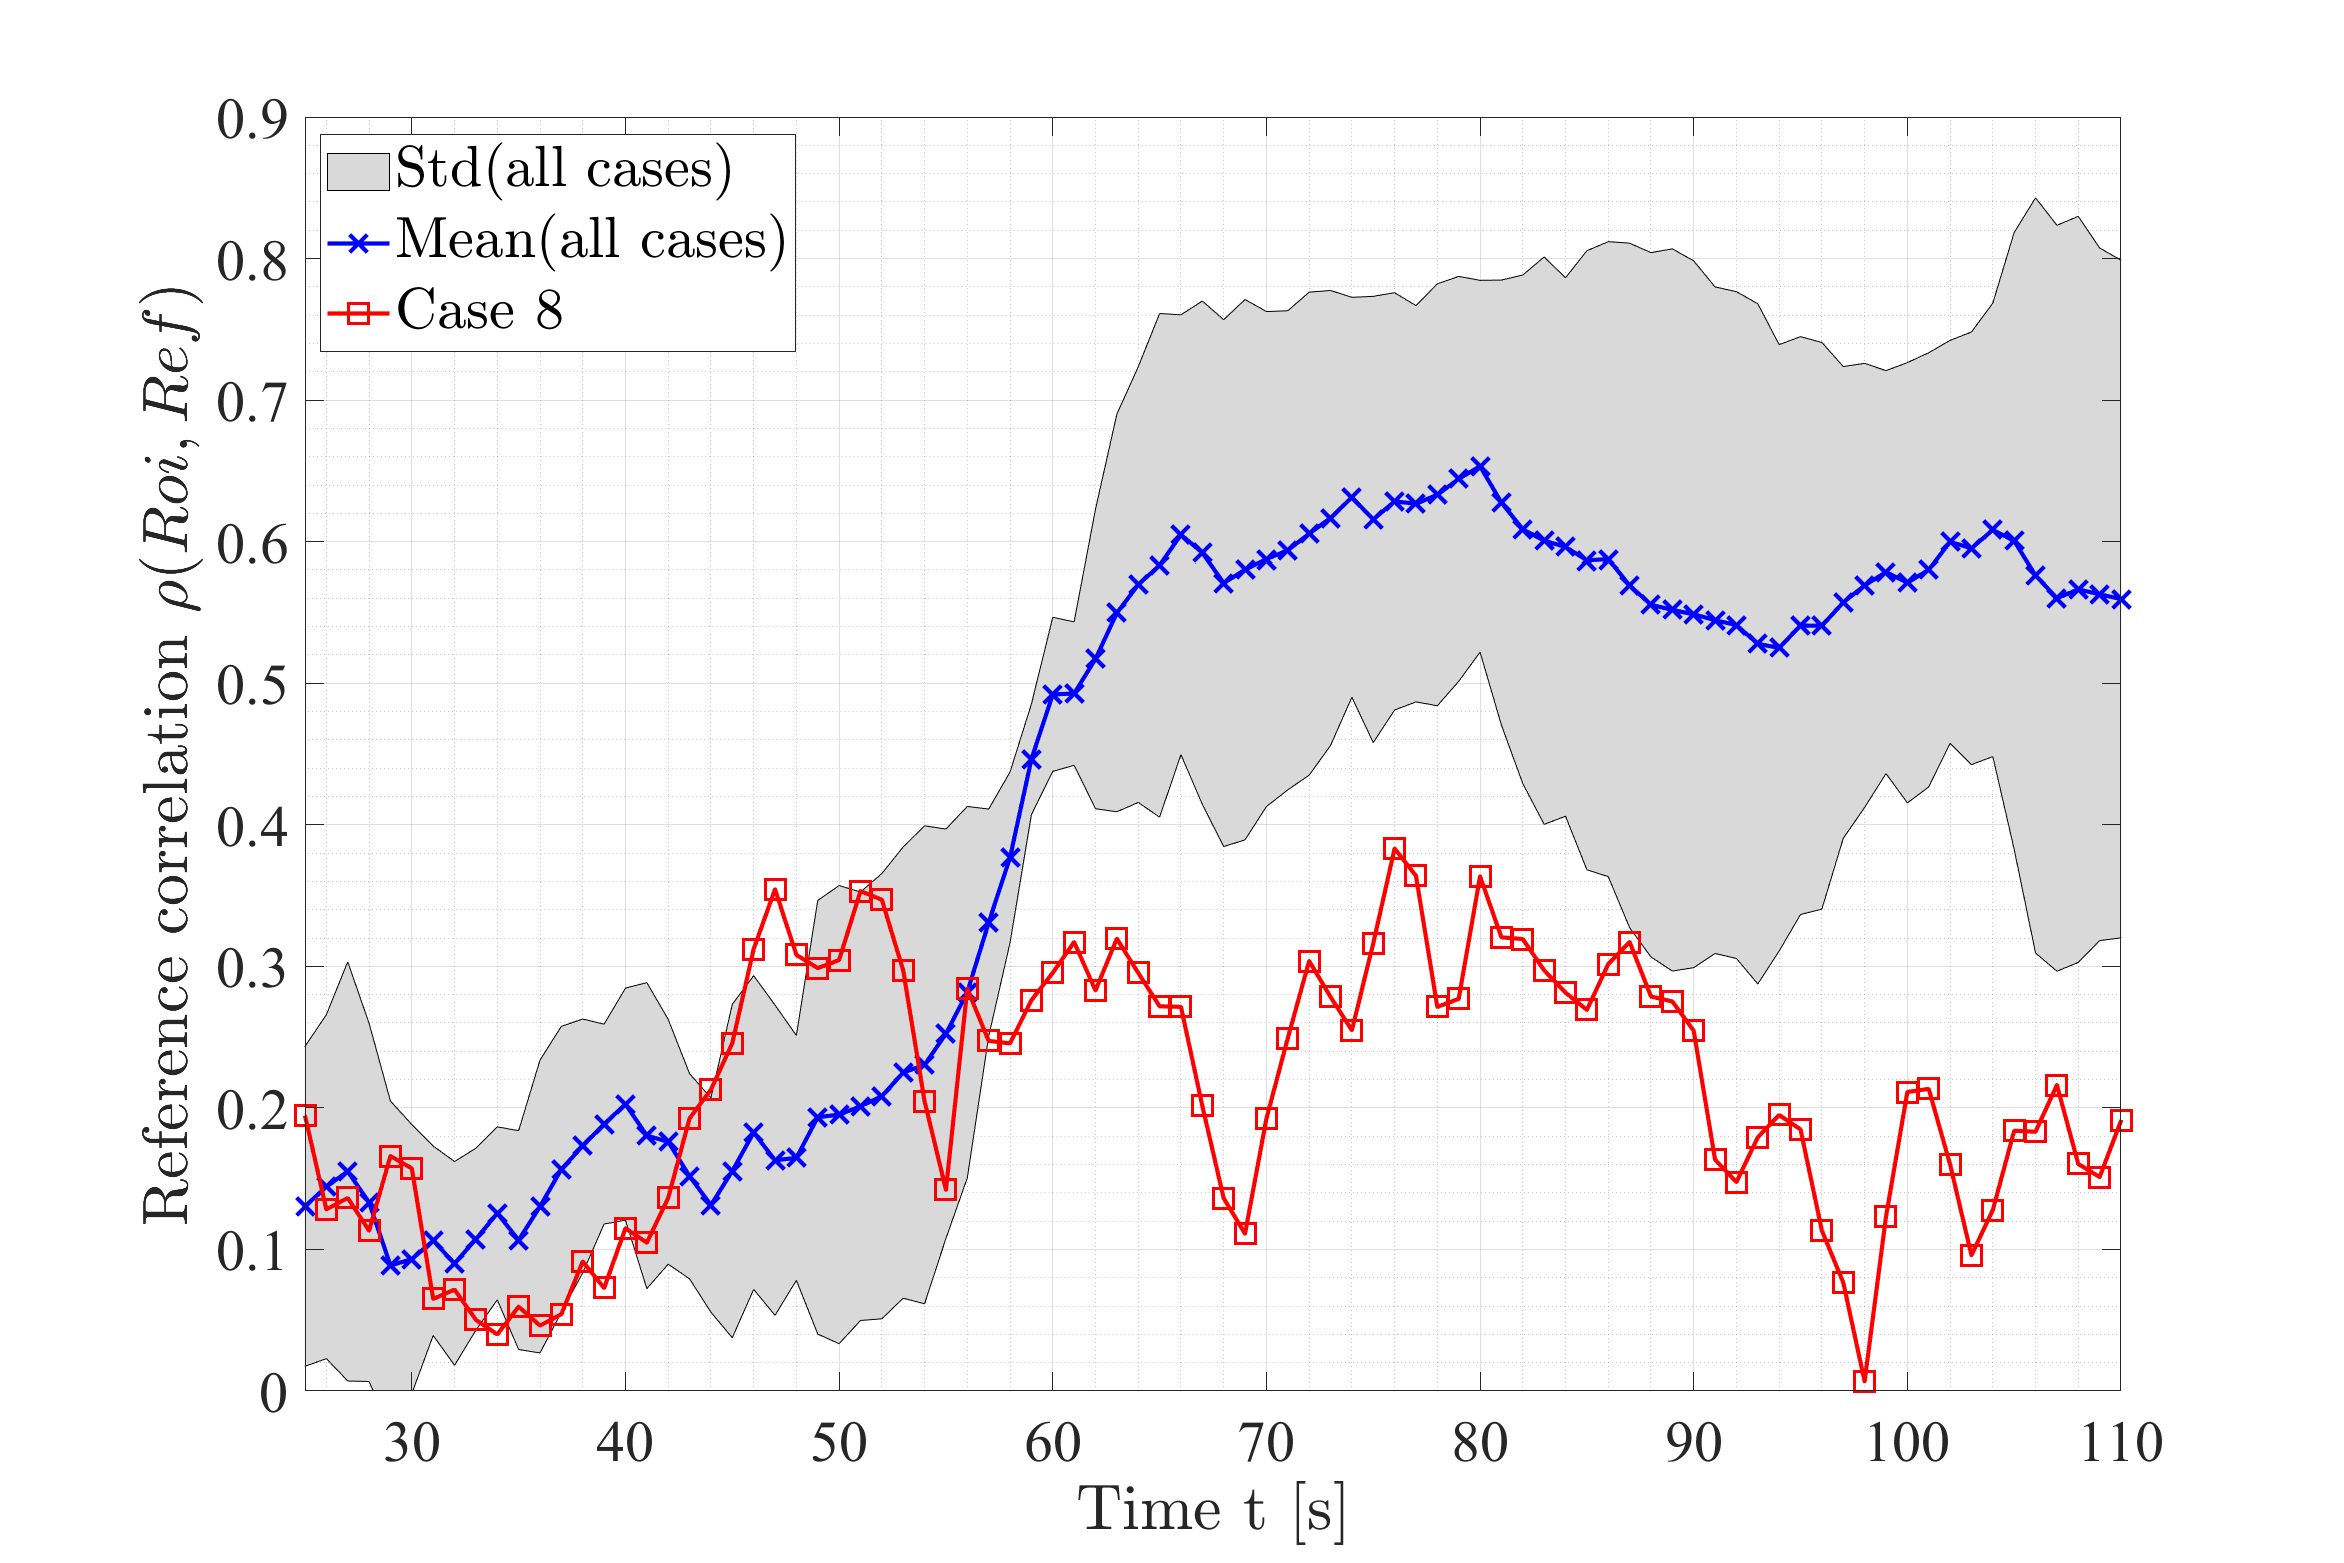
For all free fasciocutaneous flap patients in the SurgTissue dataset, it is possible to quantify how accurately the HR can be determined from the video data using the recorded ground truth comparison values. Further, for all patients, where the flap transplantation went successfully (13 out of 14 cases), it is possible to detect region-based perfusion changes in the transplanted tissues. From the extracted rPPG signal of the flap region, the shows a significant change of perfusion, i.e., the reperfusion of the tissue can be detected, see Fig. 1. This event of reperfusion produces a peak, reaching its maximum after the documented reperfusion event. The reference correlation between the flap and a reference skin region increases in parallel to the increasing , reaching its maximum at , see Fig. 2.
5.1.2 Local Assessment
A good visualization of blood flow propagation and representation of the signal quality of each spatial position would allow the surgeon to make a robust quantitative diagnosis. In addition, it could reveal transplantation failures at an early stage without the need for additional complex and invasive methods.
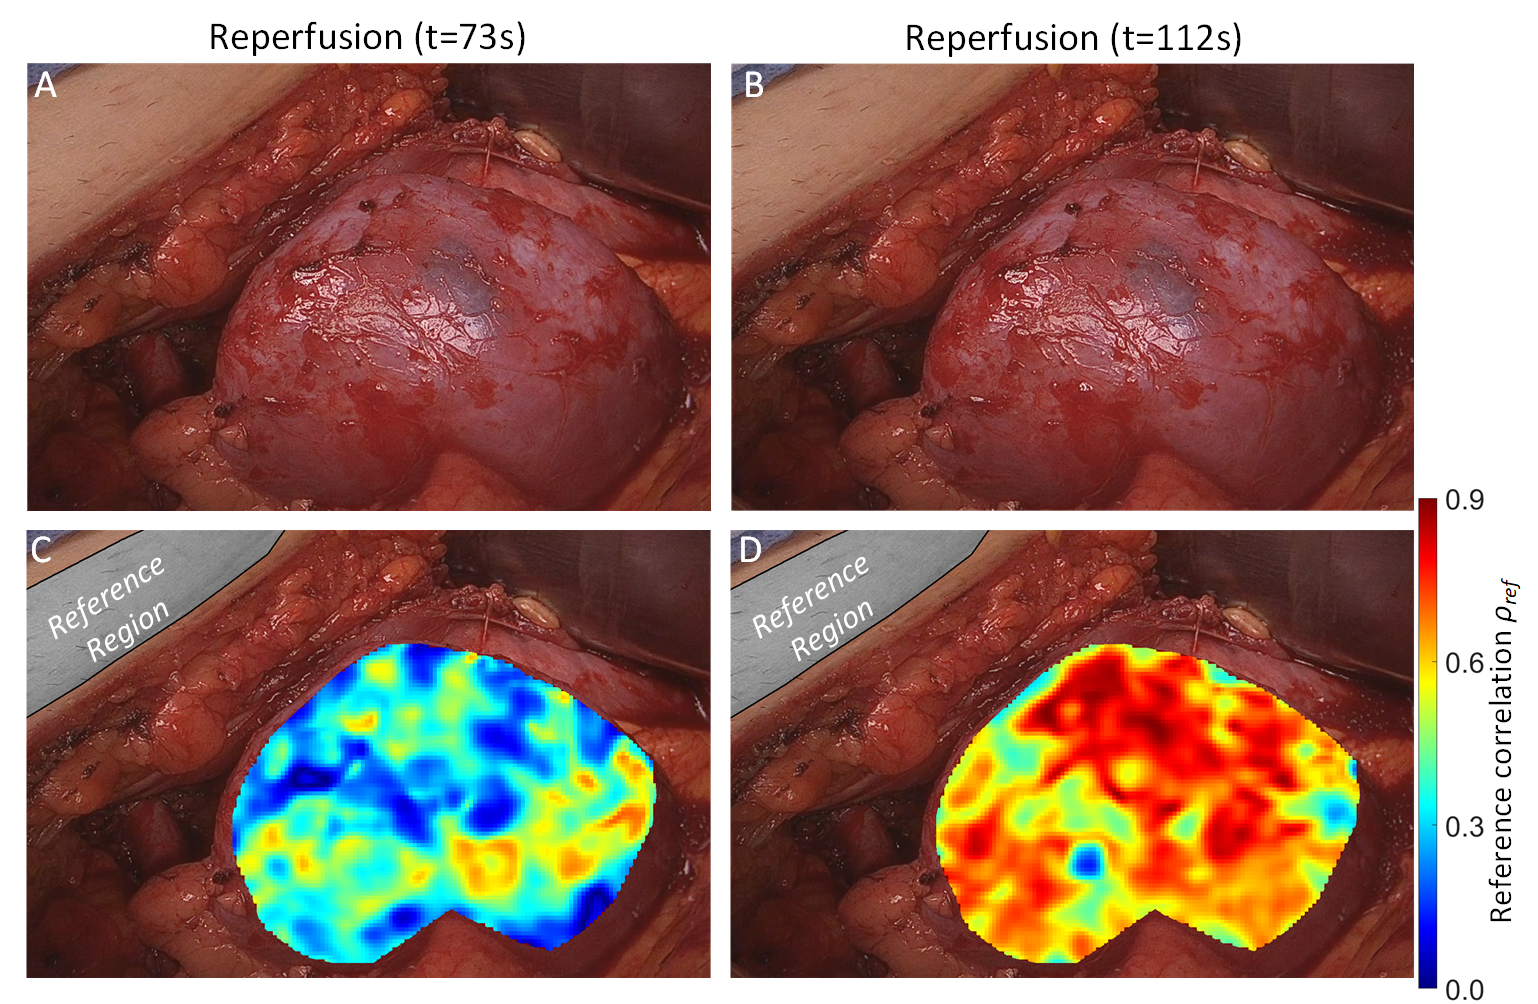
An augmented overlay of the different parameters, which have been determined locally, allows to visually highlight relevant tissue behaviors during critical processes. The normal RGB view on a transplanted region shortly after reperfusion shows no difference compared to the non-perfused appearance, cf. Fig. 3 and Fig. 4 (top row). However, the local reference correlation shows a clear improvement in perfusion over time with specific local variations.
5.2 Presentation Attack Detection via Perfusion Analysis
The goal of a presentation attack is to impersonate a person’s identity through the presentation of photos or wearing a mask such that an identification system allows the attacker to pass through the system with a false identity. The FaceMask dataset includes attacks with full face masking, cf. Sec. 4. Such full-face masks with the authorized person’s biometric feature have the disadvantage of being sometimes easily recognized as the masks do not move like a real face, and the reflection of light might differ from human skin. More advanced attacks involve partial masks altering a person’s face so that the attacker’s biometric features match the target victim’s. These masks can be blended into the face’s overall appearance with make-up equipment to create a natural look. In the dataset, such partial mask attacks are simulated using handmade partial masks made of gelatin, latex, latex milk, wax, and Artex silicone. An application of perfusion assessment to detect masks (i.e., presentation attacks) in video sequences is presented in the following.
5.2.1 Region-based PAD
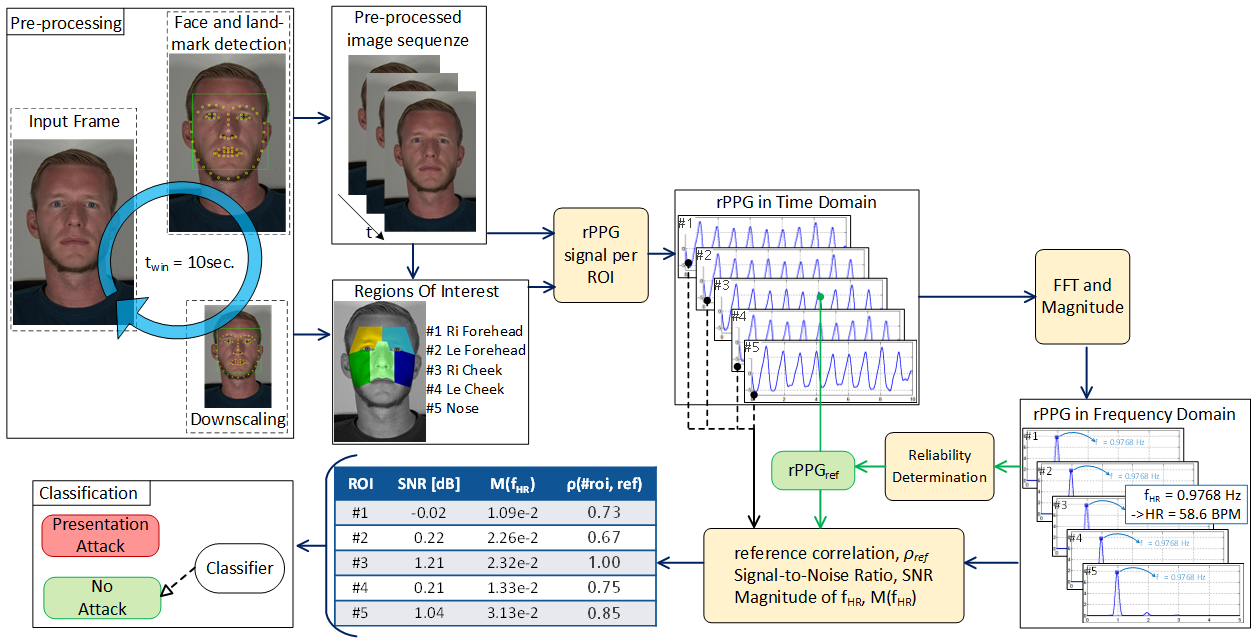
Fig. 5 shows the major steps of the proposed region-based PAD. To evaluate this approach, recordings of the FaceMask dataset have been used, containing simulated attacks with full face masks out of latex and foam latex. Randomly, 43 video recordings are selected; 17 of them are showing presentation attacks. The length of each video is approx. . The position of the face is determined using face detection based on the dlib algorithm [11] extracting 68 landmarks per face. Based on these landmarks, the face is segmented into five symmetric regions covering the major parts of the face, excluding the eyes since they mostly do not show visible skin. Fig. 5 shows the regions: right forehead, left forehead, right cheek, left cheek, and nose. The mouth and chin areas are not analyzed due to low signal quality [17]. The pre-processing steps for facial videos described in Sec. 3.3, yield long image sequence and the corresponding facial landmarks for each frame which determine the facial ROIs. To determine the HR of the recorded subject, the region with the most robust signal based on a reliability determination has been selected [14] as reference signal .
For each region and sliding window, the three parameters (, , ) are calculated, cf. Fig. 5, resulting in 2216 ground truth samples. A cubic SVM classifier is trained to detect presentation attacks. The data are split into training and test set (training: (1780 samples), testing: (436 samples)). Thereby, the data set was randomly split with the constraint that no subject of the test set appears in the training set and vice versa. We use cross-validation to protect the classifier against over-fitting to the training data (10 folds). The classifier is tested against the test data and reaches an accuracy of . Tab. 1 shows the confusion matrix visualizing the performance of the classifier.
| Predicted Class | ||||
| 0 | 1 | total | ||
| Actual Class | 0 | 200 | 4 | 204 |
| 1 | 11 | 221 | 232 | |
| total | 211 | 225 | ||
5.2.2 Local PAD Visualization
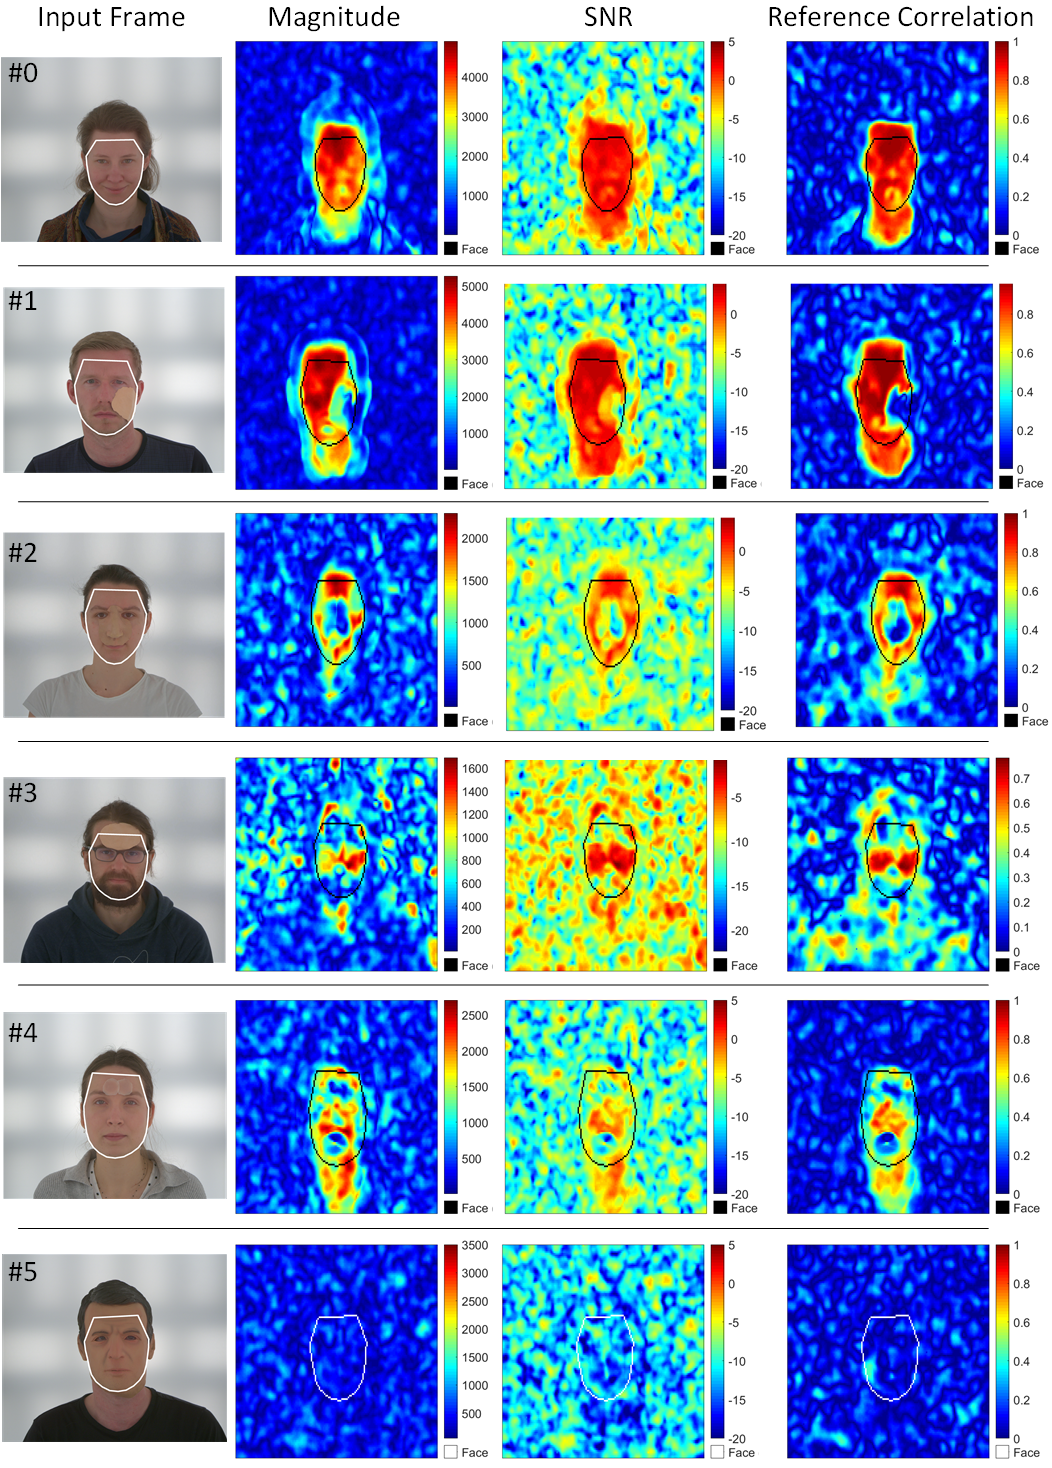
Local perfusion assessment can be used to visualize more details of the local perfusion within the human face. We use the local analysis described in Sec. 3.4 and visualize our approach for local perfusion assessment. This visualization can be used for PAD assistance to detect and localize partial masks. The FaceMask dataset (see in Sec. 4) simulates presentation attacks with partial masks. These masks cover single or multiple facial regions like the nose, cheeks, or forehead. Fig. 6 shows four examples of different face coverings and one non-covered face. It shows the input frame, the magnitude-, SNR- and reference correlation-maps. All five attacks are clearly visible within each corresponding map. With the local rPPG perfusion assessment, we can determine if a person is wearing a mask and localize the position of this mask coverage.
6 Discussion
The rPPG is a non-contact vital parameter determination method and has been used for objective intraoperative perfusion assessment of transplanted tissues. The overall goal of the considered surgical procedures is to achieve a similar blood flow in the transplanted tissues compared to the reference region. Sufficient reperfusion in transplanted tissue resulting from opening the artery is clearly detectable by the PI peak and the increase in correlation of the pulse-induced rPPG signal. Further, we could show that rPPG is able to detect critically perfused tissues before clinical ischemia occurs.
The correlation quantifies the similarity of both rPPG signals, which allows clear conclusions about the perfusion of the transplanted tissue. Therefore, an objective and reproducible perfusion assessment can be made region-based as well as locally based on the introduced parameters. This gives to surgeon additional relevant information about physiological parameters and perfusion problems, which would manifest clinically much later so that a possible intervention would be already too late. For this reason, such a non-invasive continuous monitoring approach using existing imaging techniques such as surgical microscopes and endoscopes would be an excellent improvement for various medical applications, such as intraoperative tissue perfusion measurements as well as postoperative wound assessment. All results calculated for the SurgTissue dataset and presented in this paper have been reviewed and verified by several medical experts (for free fasciocutaneous flap and kidney transplantation).
As shown in Fig. 6, the partial and full-face masks can be located in a person’s face by inspecting the magnitude, SNR, and reference correlation maps generated via the local analysis. However, the figure also shows for subject #3 that his dense beard appears as an occlusion, which in fact is an occlusion of skin. Thus, facial hair makes it difficult robustly detect presentation attacks, as it has to be distinguished between normal occlusions such as beard and glasses and attacks with partial masks. Because of this challenge, as well as it has been reported that the chin generally shows less signal strength [17], we decided to ignore the chin region for the region-based PAD. With the region-based approach, we were able to detect full-face coverage. Compared to the local analysis, the advantage of the region-based method is reducing processing time, making real-time application possible.
7 Conclusion
We presented a method for rPPG-based perfusion assessment in visible human tissue from RGB video-based. We use a plane-orthogonal-to-skin remote photoplethysmography technique in order to extract the rPPG signal and derive perfusion-relevant parameters at three different scales, offering flexibility for different applications.
We presented two example applications for intraoperative tissue perfusion monitoring in patients undergoing transplantation or reconstruction surgery. Our approach yields objective and reproducible results, verified by medical experts. We will perform further clinical studies to evaluate our approach for continuous intraoperative as well as postoperative tissue monitoring. Existing digital imaging units, such as a surgical microscope or endoscope could be easily expanded [35] to be used for tissue monitoring.
In addition to applications in the medical field, we presented an application to presentation attack detection to authentication systems. In our experiments, attacks with partial- and full-face masks could robustly been detected.
8 Acknowledgment
The work in this paper has been funded in part by the H2020 projects D4Fly under grant number 952147, by the German Federal Ministry of Education and Research (BMBF) projects KIPos under grant number 16SV8602, and MultiARC under grant number 16SV8061.
References
- [1] Serge Bobbia, Richard Macwan, Yannick Benezeth, Alamin Mansouri, and Julien Dubois. Unsupervised skin tissue segmentation for remote photoplethysmography. Pattern Recognition Letters, 124:82–90, 2019.
- [2] Michael P Chae, Warren Matthew Rozen, Iain S Whitaker, Daniel Chubb, Damien Grinsell, Mark W Ashton, David J Hunter-Smith, and William C Lineaweaver. Current evidence for postoperative monitoring of microvascular free flaps: a systematic review. Annals of plastic surgery, 74(5):621–632, 2015.
- [3] Eric I Chang, Brian T Carlsen, Jaco H Festekjian, Andrew L Da Lio, and Christopher A Crisera. Salvage Rates of Compromised Free Flap Breast Reconstruction After Recurrent Thrombosis. Annals of Plastic Surgery, 71:68 71, 2013.
- [4] Weixuan Chen and Daniel McDuff. DeepPhys: Video-Based Physiological Measurement Using Convolutional Attention Networks. In Lecture Notes in Computer Science (including subseries Lecture Notes in Artificial Intelligence and Lecture Notes in Bioinformatics), volume 11206 LNCS, pages 356–373, 2018.
- [5] Gerard De Haan and Vincent Jeanne. Robust pulse rate from chrominance-based rPPG. IEEE Transactions on Biomedical Engineering, 60(10):2878–2886, 2013.
- [6] Javier Galbally, Sébastien Marcel, and Julian Fierrez. Biometric antispoofing methods: A survey in face recognition. IEEE Access, 2:1530–1552, 2014.
- [7] John Gideon and Simon Stent. Estimating heart rate from unlabelled video. In Proceedings of the IEEE/CVF International Conference on Computer Vision, pages 2743–2749, 2021.
- [8] Ichiro Hashimoto, Hideki Nakanishi, Hirotsugu Takiwaki, Maki Toda Takase, Masahiro Yamano, and Hiromichi Sedo. Flap monitoring by transcutaneous PO2 and PCO2: importance of transcutaneous PCO2 in determining follow-up treatment for compromised free flaps. Journal of reconstructive microsurgery, 23(5):269–274, 2007.
- [9] Guillaume Heusch and Sebastien Marcel. Pulse-based features for face presentation attack detection. 2018 IEEE 9th International Conference on Biometrics Theory, Applications and Systems, BTAS 2018, 2019.
- [10] Brian L Hill, Xin Liu, and Daniel McDuff. Beat-to-beat cardiac pulse rate measurement from video. In Proceedings of the IEEE/CVF International Conference on Computer Vision (ICCV) Workshops, pages 2739–2742, October 2021.
- [11] Davis E King. Dlib-ml: A Machine Learning Toolkit. Journal of Machine Learning Research, 10(60):1755–1758, 2009.
- [12] R C King, O A Binns, F Rodriguez, R C Kanithanon, T M Daniel, W D Spotnitz, C G Tribble, and I L Kron. Reperfusion injury significantly impacts clinical outcome after pulmonary transplantation. The Annals of thoracic surgery, 69(6):1681–1685, 2000.
- [13] Benjamin Kossack, Eric L Wisotzky, Anna Hilsmann, and Peter Eisert. Local Remote Photoplethysmography Signal Analysis for Application in Presentation Attack Detection. Vision, Modeling and Visualization, pages 135–142, 2019.
- [14] Benjamin Kossack, Eric L Wisotzky, Anna Hilsmann, and Peter Eisert. Automatic region-based heart rate measurement using remote photoplethysmography. In 2021 IEEE/CVF International Conference on Computer Vision Workshops (ICCVW), pages 2755–2759, 2021.
- [15] Benjamin Kossack, Eric L Wisotzky, Anna Hilsmann, Peter Eisert, and Ronny Hänsch. Local blood flow analysis and visualization from RGB-video sequences. Current Directions in Biomedical Engineering, 5(1), 2019.
- [16] Karl HE Kroemer, Hiltrud J Kroemer, and Katrin E Kroemer-Elbert. Engineering physiology: Bases of human factors engineering/ergonomics. Springer, 2010.
- [17] Sungjun Kwon, Jeehoon Kim, Dongseok Lee, and Kwangsuk Park. ROI analysis for remote photoplethysmography on facial video. In 2015 37th Annual International Conference of the IEEE Engineering in Medicine and Biology Society (EMBC), pages 4938–4941, 2015.
- [18] Xiaobai Li, Jukka Komulainen, Guoying Zhao, Pong Chi Yuen, and Matti Pietikainen. Generalized face anti-spoofing by detecting pulse from face videos. Proceedings - International Conference on Pattern Recognition, pages 4244–4249, 2017.
- [19] Emanuela Marasco, Mohamed Shehab, and Bojan Cukic. A methodology for prevention of biometric presentation attacks. Proceedings - 7th Latin-American Symposium on Dependable Computing, LADC 2016, pages 9–14, 2016.
- [20] Henning Mothes, Torsten Dönicke, Reinhard Friedel, Mark Simon, Eberhard Markgraf, and Olaf Bach. Indocyanine-green fluorescence video angiography used clinically to evaluate tissue perfusion in microsurgery. The Journal of trauma, 57(5):1018–1024, 2004.
- [21] Richard Mühle, Wenke Markgraf, Anna Hilsmann, Hagen Malberg, Peter Eisert, and Eric L Wisotzky. Comparison of different spectral cameras for image-guided organ transplantation. Journal of Biomedical Optics, 26(7):076007, 2021.
- [22] Tetsuji Nagata, Kazuma Masumoto, Yoshiyuki Uchiyama, Yoshiko Watanabe, Ryuichi Azuma, Yuji Morimoto, and Fuminori Katou. Improved technique for evaluating oral free flaps by pinprick testing assisted by indocyanine green near-infrared fluorescence angiography. Journal of cranio-maxillo-facial surgery : official publication of the European Association for Cranio-Maxillo-Facial Surgery, 42(7):1112–1116, 2014.
- [23] Ewa M Nowara, Ashutosh Sabharwal, and Ashok Veeraraghavan. PPGSecure: Biometric Presentation Attack Detection Using Photopletysmograms. Proceedings - 12th IEEE International Conference on Automatic Face and Gesture Recognition, FG 2017, 77005:56–62, 2017.
- [24] Ming-Zher Poh, Daniel J McDuff, and Rosalind W Picard. Non-contact, automated cardiac pulse measurements using video imaging and blind source separation. Optics Express, 18(10):10762, 2010.
- [25] Michal Rapczynski, Philipp Werner, and Ayoub Al-Hamadi. Continuous low latency heart rate estimation from painful faces in real time. In 2016 23rd International Conference on Pattern Recognition (ICPR), pages 1165–1170, 2016.
- [26] Simon M Rasmussen, Thomas Nielsen, Sofie Hody, Henrik Hager, and Lars P Schousboe. Photoplethysmography for demarcation of cutaneous squamous cell carcinoma. Scientific Reports, 11(1):21467, 2021.
- [27] Ambareesh Revanur, Zhihua Li, Umur A Ciftci, Lijun Yin, and László A Jeni. The first vision for vitals (v4v) challenge for non-contact video-based physiological estimation. In Proceedings of the IEEE/CVF International Conference on Computer Vision (ICCV) Workshops, pages 2760–2767, October 2021.
- [28] Kun H Suh and Eui Cl Lee. Face liveness detection for face recognition based on cardiac features of skin color image. First International Workshop on Pattern Recognition, 10011(July 2016):100110C, 2016.
- [29] W M Swartz, N F Jones, L Cherup, and A Klein. Direct monitoring of microvascular anastomoses with the 20-MHz ultrasonic Doppler probe: an experimental and clinical study. Plastic and reconstructive surgery, 81(2):149–161, 1988.
- [30] Toshiyo Tamura, Yuka Maeda, Masaki Sekine, and Masaki Yoshida. Wearable Photoplethysmographic Sensors—Past and Present. Electronics, 3(2):282–302, 2014.
- [31] Daniel GE Thiem, Richard W Frick, Elisabeth Goetze, Matthias Gielisch, Bilal Al-Nawas, and Peer W Kämmerer. Hyperspectral analysis for perioperative perfusion monitoring—a clinical feasibility study on free and pedicled flaps. Clinical oral investigations, 25(3):933–945, 2021.
- [32] Sergey Tulyakov, Xavier Alameda-Pineda, Elisa Ricci, Lijun Yin, Jeffrey F Cohn, and Nicu Sebe. Self-adaptive matrix completion for heart rate estimation from face videos under realistic conditions. In Proceedings of the IEEE Conference on Computer Vision and Pattern Recognition (CVPR), June 2016.
- [33] Wenjin Wang, Albertus C Den Brinker, Sander Stuijk, and Gerard De Haan. Algorithmic Principles of Remote PPG. IEEE Transactions on Biomedical Engineering, 64(7):1479–1491, 2017.
- [34] Eric L Wisotzky, Benjamin Kossack, Florian C Uecker, Philipp Arens, Anna Hilsmann, and Peter Eisert. Validation of two techniques for intraoperative hyperspectral human tissue determination. Journal of Medical Imaging, 7(6):065001, 2020.
- [35] Eric L Wisotzky, Jean-Claude Rosenthal, Peter Eisert, Anna Hilsmann, Falco Schmid, Michael Bauer, Armin Schneider, and Florian C Uecker. Interactive and Multimodal-based Augmented Reality for Remote Assistance using a Digital Surgical Microscope. In IEEE Conference on Virtual Reality and 3D User Interfaces (VR), pages 1477–1484, mar 2019.
- [36] Q Yang, Z H Ren, D Chickooree, H J Wu, H Y Tan, K Wang, Z J He, C J Gong, V Ram, and S Zhang. The effect of early detection of anterolateral thigh free flap crisis on the salvage success rate, based on 10 years of experience and 1072 flaps. International journal of oral and maxillofacial surgery, 43(9):1059–1063, 2014.
- [37] Ze Yang, Haofei Wang, and Feng Lu. Assessment of Deep Learning-based Heart Rate Estimation using Remote Photoplethysmography under Different Illuminations. CoRR, abs/2107.13193, 2021.
- [38] El Saddik Abdulmotaleb Yang Jun, Guthier B. Estimating two-dimensional blood flow velocities from videos. International Conference on Image Processing (ICIP), pages 3768–3772, 2015.
- [39] Jonghee Yoon. Hyperspectral imaging for clinical applications. BioChip Journal, pages 1–12, 2022.
- [40] Zitong Yu, Xiaobai Li, Pichao Wang, and Guoying Zhao. Transrppg: Remote photoplethysmography transformer for 3d mask face presentation attack detection. IEEE Signal Processing Letters, 28:1290–1294, 2021.
- [41] Zitong Yu, Xiaobai Li, and Guoying Zhao. Remote photoplethysmograph signal measurement from facial videos using spatio-temporal networks. In 30th British Machine Vision Conference 2019, BMVC 2019, 2020.
- [42] Zitong Yu, Wei Peng, Xiaobai Li, Xiaopeng Hong, and Guoying Zhao. Remote Heart Rate Measurement From Highly Compressed Facial Videos: An End-to-End Deep Learning Solution With Video Enhancement. In Proceedings of the IEEE/CVF International Conference on Computer Vision (ICCV), oct 2019.
- [43] Sebastian Zaunseder, Alexander Trumpp, Daniel Wedekind, and Hagen Malberg. Cardiovascular assessment by imaging photoplethysmography - A review. Biomedizinische Technik, pages 1–18, 2018.